
The Effect of Herbage Availability and Season of Year on the Rate of Liveweight Loss during Weighing of Fasting Ewe Lambs

 , , ,
, , ,
Abstract
:1. Introduction
2. Materials and Methods
2.1. Overall Study Design
2.2. Stage 1: Calibration
2.2.1. Location
2.2.2. Study Animal Conditions, Experimental Design, and Feed Management
2.2.3. Liveweight Measurement
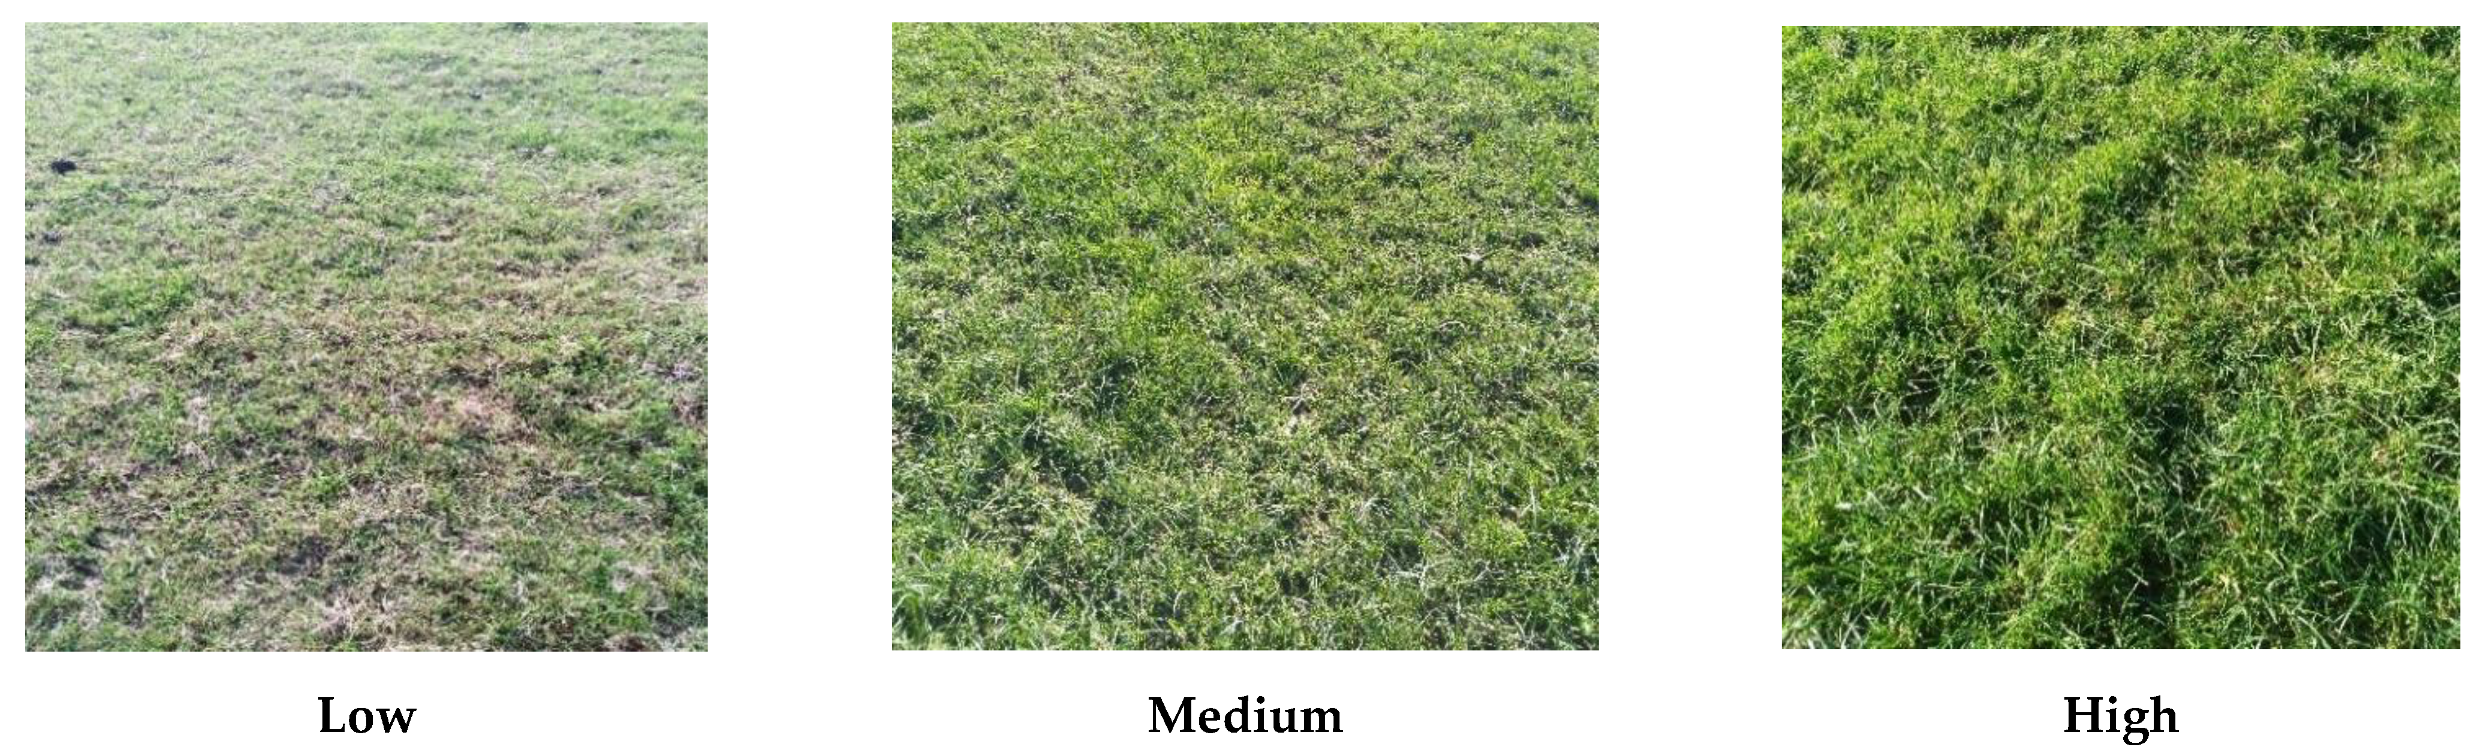
2.2.4. Herbage Sampling, Mass and Quality
2.2.5. Statistical Analyses
2.3. Stage 2: Validation
2.3.1. Location
2.3.2. Study Animals, Experimental Design, and Feed Management
2.3.3. Liveweight Measurement
2.3.4. Herbage Sampling, Availability Determination, and Herbage Quality
2.3.5. Statistical Analyses
3. Results
3.1. Calibration Stage
3.1.1. Herbage Mass and Chemical Composition
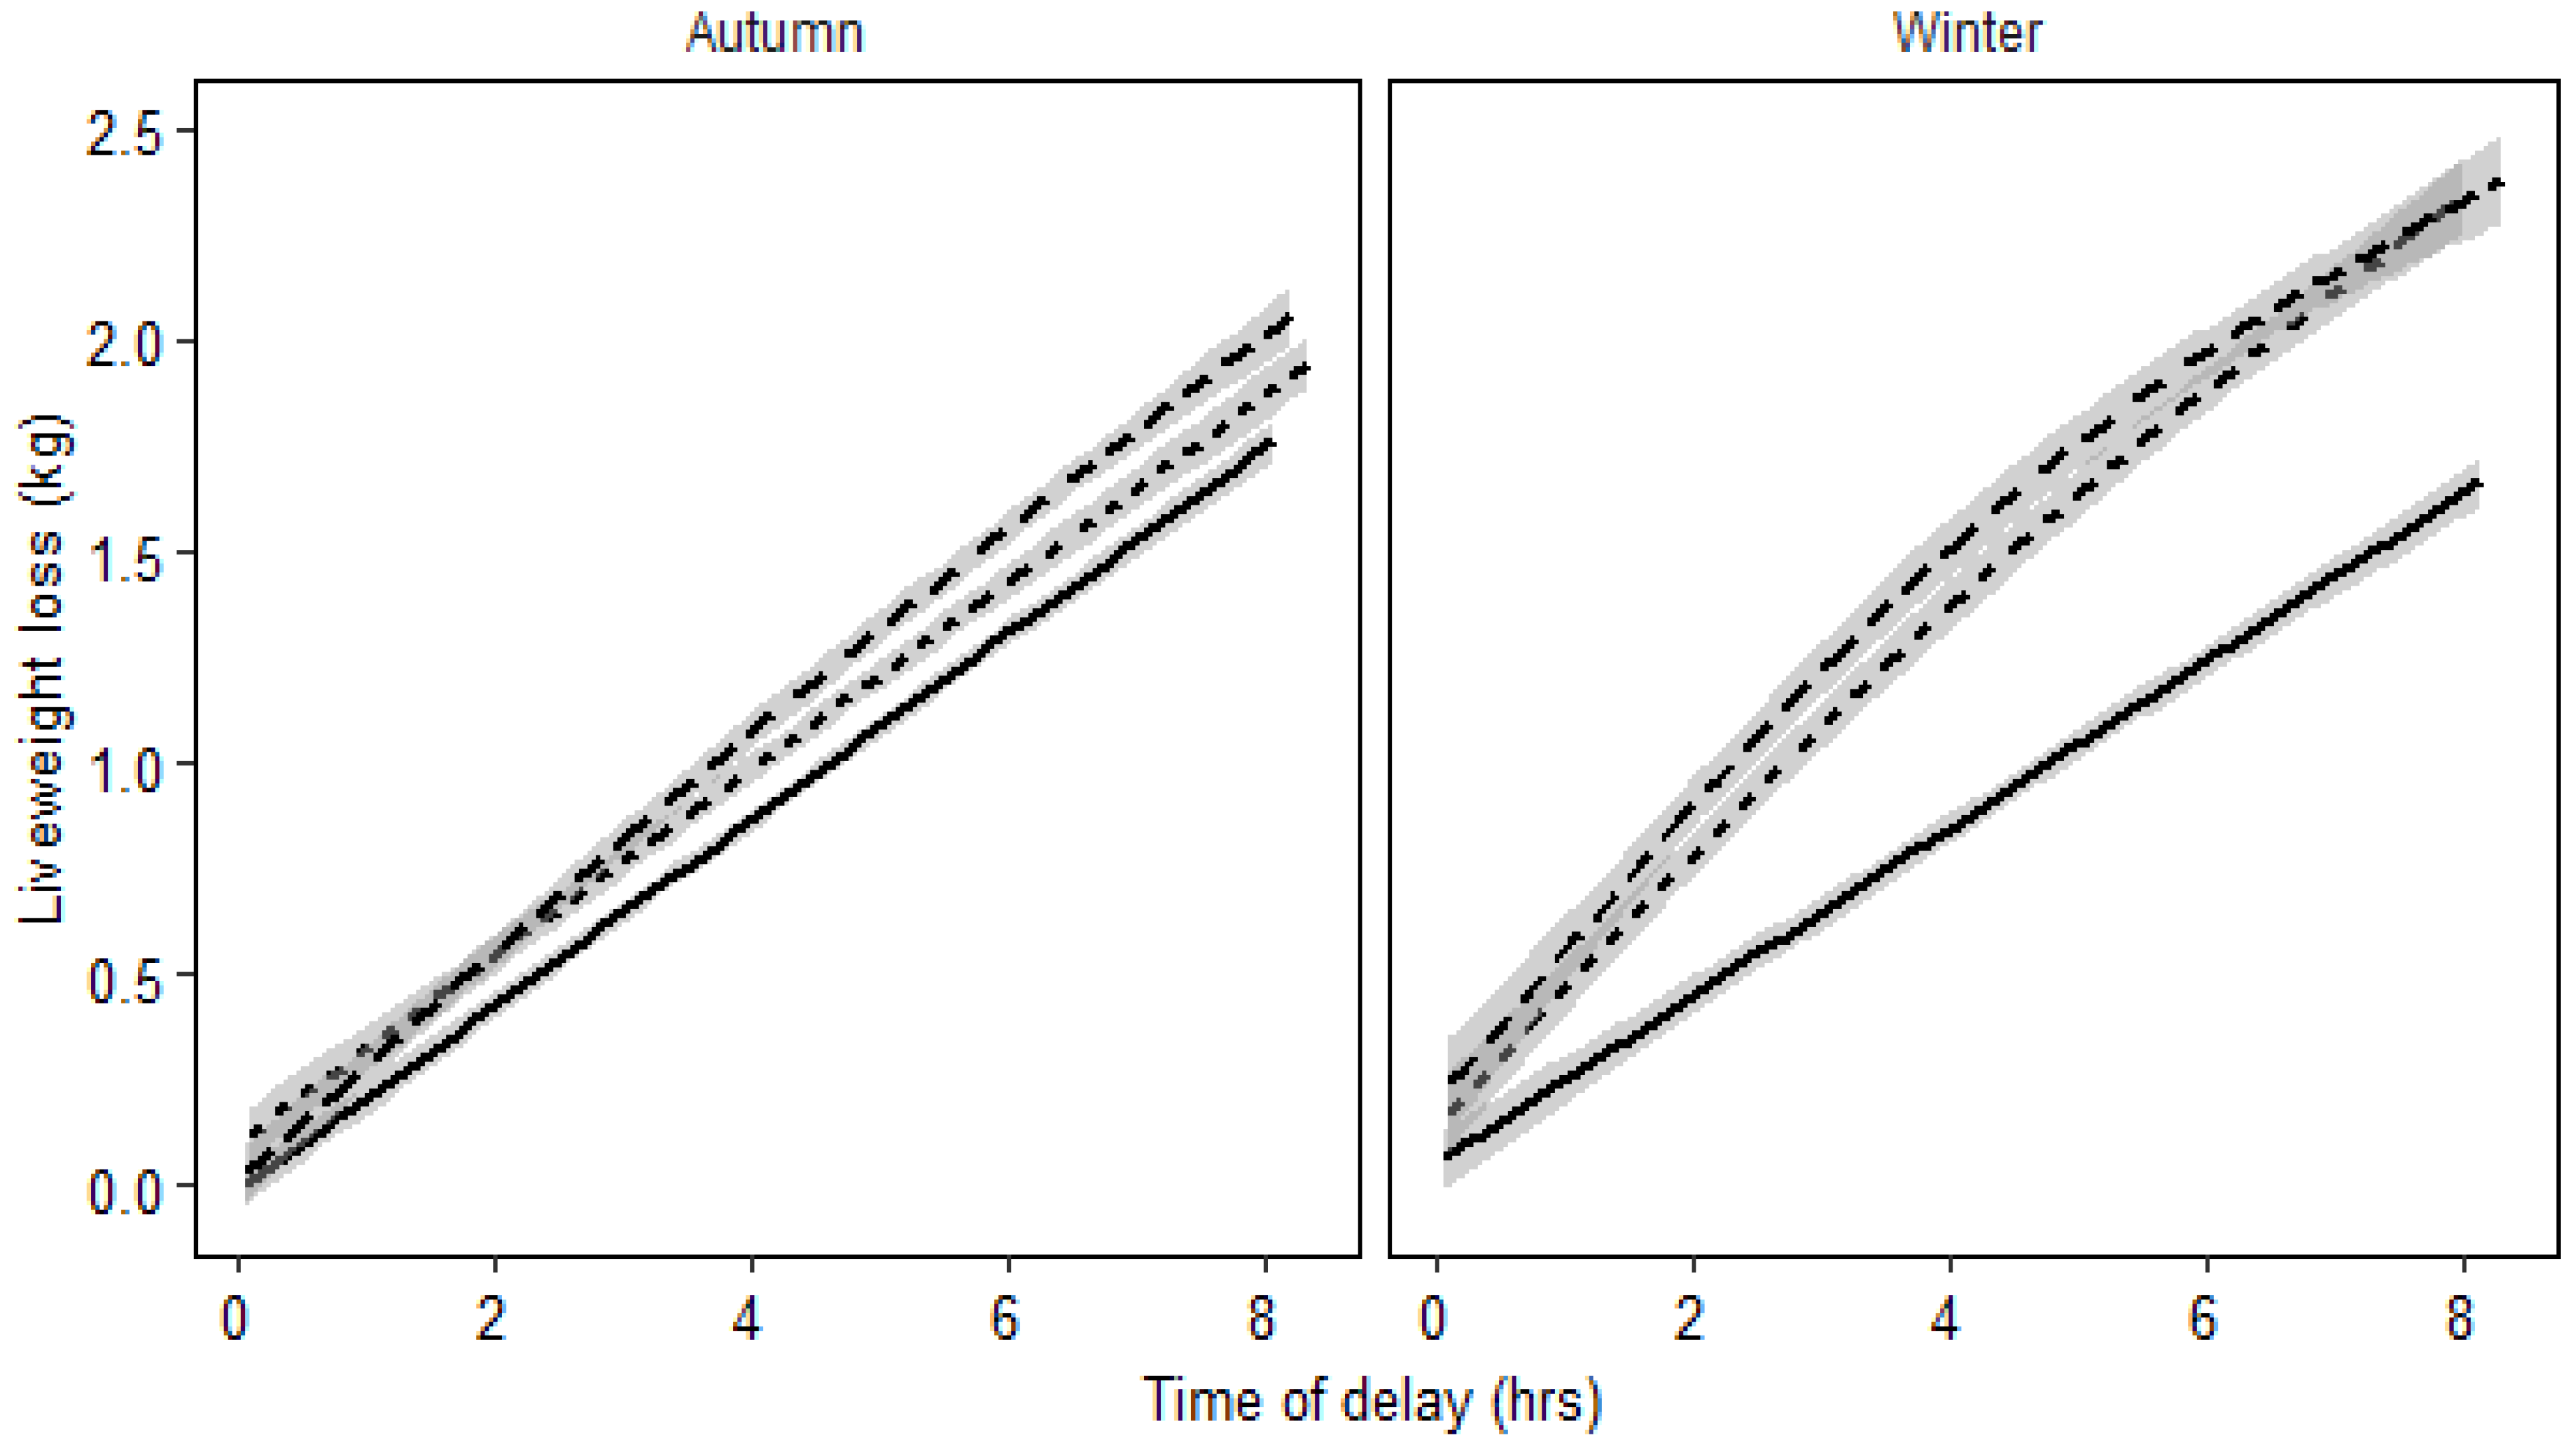
3.1.2. Effect of Herbage Availability and Season on Liveweight Loss
3.2. Validation Stage
3.2.1. Herbage Mass and Chemical Composition
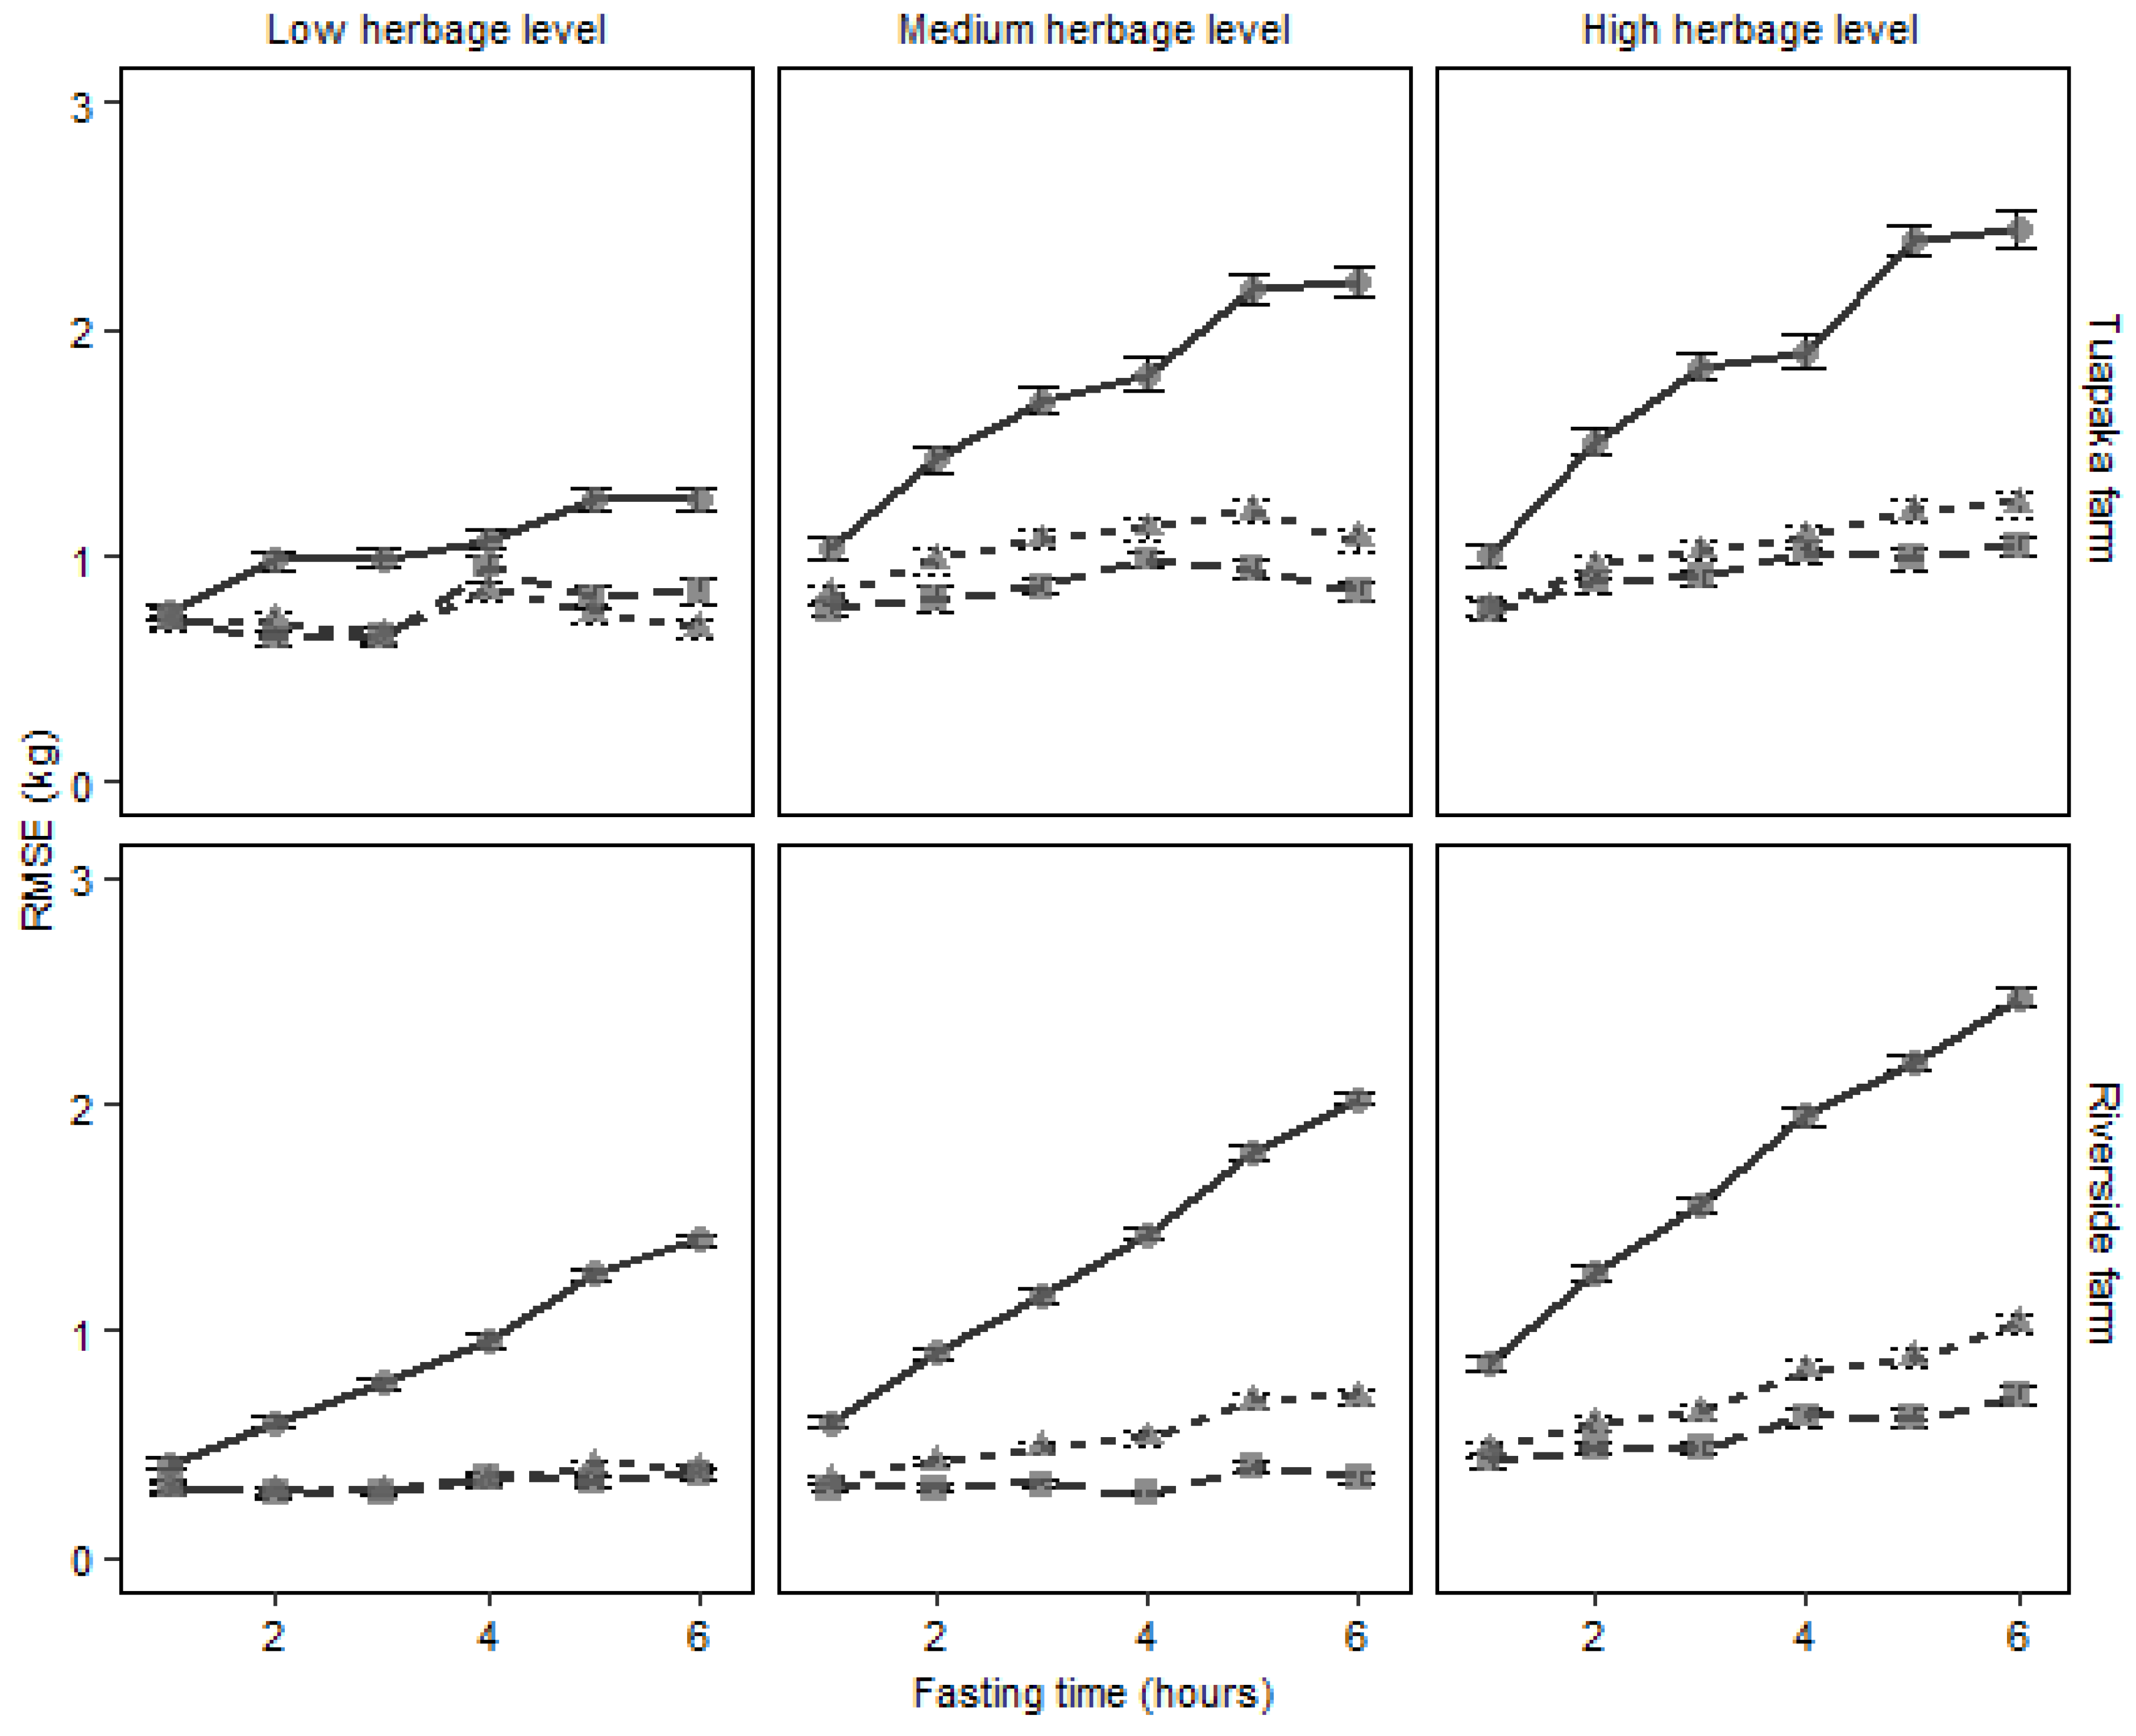
3.2.2. Using Separate Correction Equations on Validation Datasets to Predict without Delay Liveweight
4. Discussion
4.1. Calibration Stage
4.2. Validation Stage
5. Conclusions
Author Contributions
Funding
Institutional Review Board Statement
Data Availability Statement
Acknowledgments
Conflicts of Interest
References
- Brown, D.J.; Ball, A.J.; Huisman, A.E. The influence of ewe weight at mating on lamb performance and reproduction of the ewe. Proc. Assoc. Adv. Anim. Breed. Genet. 2005, 16, 306–309. [Google Scholar]
- Wishart, H.; Morgan-Davies, C.; Stott, A.; Wilson, R.; Waterhouse, T. Liveweight loss associated with handling and weighing of grazing sheep. Small Rumin. Res. 2017, 153, 163–170. [Google Scholar] [CrossRef]
- Brown, D.J.; Savage, D.B.; Hinch, G.N.; Hatcher, S. Monitoring liveweight in sheep is a valuable management strategy: A review of available technologies. Anim. Prod. Sci. 2015, 55, 427–436. [Google Scholar] [CrossRef]
- Coates, D.B.; Penning, P. Measuring animal performance. In Field and Laboratory Methods for Grassland and Animal Production Research; Mannetje, L., Jones, R.M., Eds.; CABI Publishing: Wallingford, UK, 2000; pp. 353–402. [Google Scholar]
- Kenyon, P.R.; Maloney, S.K.; Blache, D. Review of sheep body condition score in relation to production characteristics. N. Z. J. Agric. Res. 2014, 57, 38–64. [Google Scholar] [CrossRef]
- Hughes, J.G. Short-term variation in animal live weight and reduction of its effect on weighing. Anim. Breed. Abstr. 1976, 44, 1976. [Google Scholar]
- Moyo, M.; Nsahlai, I. Rate of Passage of Digesta in Ruminants; Are Goats Different? In Goat Science; Kukovics, S., Ed.; IntechOpen: London, UK, 2018; pp. 39–74. [Google Scholar] [CrossRef] [Green Version]
- Cranston, L.; Ridler, A. Pasture measurement. In Livestock Production in New Zealand; Stafford, K.J., Ed.; Massey University Press: Auckland, New Zealand, 2017; pp. 88–96. [Google Scholar]
- Burnham, D.L.; Morel, P.C.H.; Kenyon, P.R.; Morris, S.T.; Stafford, K.J. The effect of fasting on live weight in hogget wethers and pregnant mature ewes: Brief Communication. Proc. N. Z. Soc. Anim. Prod. 2009, 69, 112–114. [Google Scholar]
- Wilson, R.F.; Hardwick-Smith, J.A.; Logan, C.M.; Corner-Thomas, R.A.; Bywater, A.C.; Greer, A.W. Brief communication: Optimizing a fasting protocol to assess live weight of sheep. Proc. N. Z. Soc. Anim. Prod. 2015, 75, 223–224. [Google Scholar]
- Hogan, J.P.; Petherick, J.C.; Phillips, C.J. The physiological and metabolic impacts on sheep and cattle of feed and water deprivation before and during transport. Nutr. Res. Rev. 2007, 20, 17–28. [Google Scholar] [CrossRef] [PubMed] [Green Version]
- Semakula, J.; Corner-Thomas, R.; Morris, S.; Blair, H.; Kenyon, P. The effect of herbage type prior to fasting on the rate of liveweight loss during fasting in ewe lambs. Proc. N. Z. Soc. Anim. Prod. 2019, 79, 131–134. [Google Scholar]
- Kirton, A.H.; Quartermain, A.R.; Uljee, A.E.; Carter, W.A.; Pickering, F.S. Effect of 1- and 2-days’ ante-mortem fasting on live weight and carcass losses in lambs. N. Z. J. Agric. Res. 1968, 11, 891–902. [Google Scholar] [CrossRef]
- Thompson, J.; O’Halloran, W.; McNeill, D.; Jackson-Hope, N.; May, T. The effect of fasting on liveweight and carcass characteristics in lambs. Meat Sci. 1987, 20, 293–309. [Google Scholar] [CrossRef]
- Kirton, A.; Moss, R.; Taylor, A.G. Weight losses from milk and weaned lambs in mid Canterbury resulting from different lengths of starvation before slaughter. N. Z. J. Agric. Res. 1971, 14, 149–160. [Google Scholar] [CrossRef]
- Haaland, G.L.; Tyrrell, H.F. Effects of Limestone and Sodium Bicarbonate Buffers on Rumen Measurements and Rate of Passage in Cattle. J. Anim. Sci. 1982, 55, 935–942. [Google Scholar] [CrossRef]
- Varga, G.A.; Prigge, E.C. Influence of forage Species and Level of Intake on Ruminal Turnover Rates. J. Anim. Sci. 1982, 55, 1498–1504. [Google Scholar] [CrossRef]
- Alwash, A.H.; Thomas, P.C. The effect of the physical form of the diet and the level of feeding on the digestion of dried grass by sheep. J. Sci. Food Agric. 1971, 22, 611–615. [Google Scholar] [CrossRef] [PubMed]
- Kaske, M.; Groth, A. Changes in factors affecting the rate of digesta passage during pregnancy and lactation in sheep fed on hay. Reprod. Nutr. Dev. 1997, 37, 573–588. [Google Scholar] [CrossRef] [PubMed] [Green Version]
- Nicol, A.; Brookes, I. The metabolisable energy requirements of grazing livestock. In Pasture and Supplements for Grazing Animals; Rattray, P.V., Brookes, I.M., Nicol, A.M., Eds.; New Zealand Society of Animal Production: Hamilton, New Zealand, 2007; pp. 151–172. [Google Scholar]
- Penning, P.; Hooper, G. An evaluation of the use of short-term weight changes in grazing sheep for estimating herbage intake. Grass Forage Sci. 1985, 40, 79–84. [Google Scholar] [CrossRef]
- Hodgson, J.; Matthews, P.N.P.; Matthews, C.; Lucas, R.J. Pasture measurement. In New Zealand Pasture and Crop Science; White, J., Hodgson, J., Eds.; Oxford University Press: Oxford, UK, 1999; pp. 56–65. [Google Scholar]
- Khodabux, K.; L’Omelette, M.S.S.; Jhaumeer-Laulloo, S.; Ramasami, P.; Rondeau, P. Chemical and near-infrared determination of moisture, fat and protein in tuna fishes. Food Chem. 2007, 102, 669–675. [Google Scholar] [CrossRef]
- Haese, E.; Krieg, J.; Grubješić, G.; Feyder, A.; Rodehutscord, M. Determination of in situ ruminal degradation of phytate phosphorus from single and compound feeds in dairy cows using chemical analysis and near-infrared spectroscopy. Animal 2020, 14, 1461–1471. [Google Scholar] [CrossRef] [PubMed]
- Corson, D.; Waghorn, G.; Ulyatt, M.; Lee, J. NIRS: Forage analysis and livestock feeding. Proc. N. Z. Grassl. Assoc. 1999, 61, 127–132. [Google Scholar] [CrossRef]
- Dowman, M.G.; Collins, F.C. The use of enzymes to predict the digestibility of animal feeds. J. Sci. Food Agric. 1982, 33, 689–696. [Google Scholar] [CrossRef]
- Roughan, P.G.; Holland, R. Predicting in-vivo digestibilities of herbages by exhaustive enzymic hydrolysis of cell walls. J. Sci. Food Agric. 1977, 28, 1057–1064. [Google Scholar] [CrossRef]
- R Core Team. R: A Language and Environment for Statistical Computing; R Version 3.4.4 (2018-03-15); R Foundation for Statistical Computing: Vienna, Austria, 2016. [Google Scholar]
- Dhakal, C.P. Multiple Regression Model Fitted for Rice Production Forecasting in Nepal: A Case of Time Series Data. Nepal. J. Stat. 2018, 2, 89–98. [Google Scholar] [CrossRef] [Green Version]
- Peat, J.; Barton, B. Medical Statistics: A Guide to Data Analysis and Critical Appraisal; John Wiley & Sons: Hoboken, NJ, USA, 2008. [Google Scholar]
- Shapiro, S.S.; Wilk, M.B. An analysis of variance test for normality (complete samples). Biometrika 1965, 52, 591–611. [Google Scholar] [CrossRef]
- Breusch, T.S.; Pagan, A.R. A Simple Test for Heteroscedasticity and Random Coefficient Variation. Econometrica 1979, 47, 1287–1294. [Google Scholar] [CrossRef]
- Cook, R.D. Detection of Influential Observation in Linear Regression. Technometrics 1977, 19, 15–18. [Google Scholar] [CrossRef]
- Pinheiro, J.; Bates, D.; DebRoy, S.; Sarkar, D.; R Core Team. nlme: Linear and Nonlinear Mixed Effects Models; R package Version 31-137; R Foundation for Statistical Computing: Vienna, Austria, 2018; Available online: https://cran.r-project.org/web/packages/nlme (accessed on 20 June 2020).
- McDowell, M.L.; Bruland, G.L.; Deenik, J.L.; Grunwald, S. Effects of subsetting by carbon content, soil order, and spectral classification on prediction of soil total carbon with diffuse reflectance spectroscopy. Appl. Environ. Soil Sci. 2012, 2012, 294121. [Google Scholar] [CrossRef] [Green Version]
- Bellon-Maurel, V.; Fernandez-Ahumada, E.; Palagos, B.; Roger, J.-M.; McBratney, A. Critical review of chemometric indicators commonly used for assessing the quality of the prediction of soil attributes by NIR spectroscopy. TrAC. Trends Anal. Chem. 2010, 29, 1073–1081. [Google Scholar] [CrossRef]
- Moriasi, D.N.; Arnold, J.G.; Van Liew, M.W.; Bingner, R.L.; Harmel, R.D.; Veith, T.L. Model evaluation guidelines for systematic quantification of accuracy in watershed simulations. Trans. ASABE 2007, 50, 885–900. [Google Scholar] [CrossRef]
- Botchkarev, A. Performance Metrics (Error Measures) in Machine Learning Regression, Forecasting and Prognostics: Properties and Typology. arXiv 2019, arXiv:1809.03006. [Google Scholar]
- Kodaira, M.; Shibusawa, S. Using a mobile real-time soil visible-near infrared sensor for high resolution soil property mapping. Geoderma 2013, 199, 64–79. [Google Scholar] [CrossRef]
- Nawar, S.; Mouazen, A.M. Predictive performance of mobile vis-near infrared spectroscopy for key soil properties at different geographical scales by using spiking and data mining techniques. Catena 2017, 151, 118–129. [Google Scholar] [CrossRef] [Green Version]
- Efron, B. Estimation and Accuracy after Model Selection. J. Am. Stat. Assoc. 2014, 109, 991–1007. [Google Scholar] [CrossRef] [Green Version]
- Pino, F.; Mitchell, L.K.; Jones, C.M.; Heinrichs, A.J. Comparison of diet digestibility, rumen fermentation, rumen rate of passage, and feed efficiency in dairy heifers fed ad-libitum versus precision diets with low- and high-quality forages. J. Appl. Anim. Res. 2018, 46, 1296–1306. [Google Scholar] [CrossRef]
- Crampton, E.W.; Jackson, I.R.C. Seasonal Variation in Chemical Composition of Pasture Herbage and the Relation to Its Digestibility by Steers and Sheep. (Pasture Studies—XXVI). J. Anim. Sci. 1944, 3, 333–339. [Google Scholar] [CrossRef]
- Särkijärvi, S.; Niemeläinen, O.; Sormunen-Cristian, R.; Saastamoinen, M. Changes in chemical composition of different grass species and -mixtures in equine pasture during grazing season. In Forages and Grazing in Horse Nutrition; Saastamoinen, M., Fradinho, M.J., Santos, A.S., Miraglia, N., Eds.; Wageningen Academic Publishers: Wageningen, The Netherlands, 2012; pp. 45–48. [Google Scholar]
- Warly, L.; Fariani, A.; Ichinohe, T.; Fujihara, T. Seasonal changes in nutritive value of some grass species in West Sumatra, Indonesia. Asian Australas. J. Anim. Sci. 2004, 17, 1663–1668. [Google Scholar] [CrossRef]
- Mir, S.; Ahmed, H. Effect of Season on the Chemical Composition and Nutritive Value of Shrub Foliage (Cotoneaster spp.) of Sub-Alpine Pasture of Kashmir Valley. Int. J. Livest. Res. 2017, 7, 289–294. [Google Scholar] [CrossRef]
- Litherland, A.J.; Woodward, S.J.R.; Stevens, D.R.; McDougal, D.B.; Boom, C.J.; Knight, T.L.; Lambert, M.G. Seasonal variations in pasture quality in New Zealand sheep and beef farms. Proc. N. Z. Soc. Anim. Prod. 2002, 62, 138–142. [Google Scholar]
- Ekanayake, W.; Corner-Thomas, R.; Cranston, L.; Hickson, R.; Kenyon, P.; Morris, S. Characterisation of the nutritional composition of plant components of a herb-clover mix during November to May in New Zealand. Proc. N. Z. Soc. Anim. Prod. 2019, 79, 162–167. [Google Scholar]
- Bernabucci, U.; Bani, P.; Ronchi, B.; Lacetera, N.; Nardone, A. Influence of Short- and Long-Term Exposure to a Hot Environment on Rumen Passage Rate and Diet Digestibility by Friesian Heifers. J. Dairy Sci. 1999, 82, 967–973. [Google Scholar] [CrossRef]
- Kennedy, P.M. Influences of cold exposure on digestion of organic matter, rates of passage of digesta in the gastrointestinal tract, and feeding and rumination behaviour in sheep given four forage diets in the chopped, or ground and pelleted form. Br. J. Nutr. 1985, 53, 159–173. [Google Scholar] [CrossRef] [PubMed] [Green Version]
- Morris, S.; Kenyon, P. The effect of litter size and sward height on ewe and lamb performance. N. Z. J. Agric. Res. 2004, 47, 275–286. [Google Scholar] [CrossRef]


| Metric | Equation |
|---|---|
| Bias | |
| Root mean square error | |
| Relative prediction error | |
| Residual prediction deviation | |
| Ratio of performance to interquartile distance | |
| Coefficient of determination | |
| Lin’s concordance correlation coefficient |
| Item | Autumn | Winter |
|---|---|---|
| Herbage mass (kg DM/ha) | ||
| Low | 854.6 a | 924.46 a |
| Medium | 1216.06 b | 1219.16 b |
| High | 1911.2 c | 1870.4 c |
| Proportion of live dry matter (%) | ||
| Low | 19.5 a | 56.4 c |
| Medium | 30.7 b | 74.5 d |
| High | 36.6 b | 83.0 d |
| Autumn | Winter | |||||
|---|---|---|---|---|---|---|
| Parameter | Low | Medium | High | Low | Medium | High |
| DM % | 26.4 b | 26.1 b | 26.7 b | 19.1 a | 18.7 a | 19.5 a |
| CP % | 16.8 a | 18.3 ab | 18.4 ab | 21.6 abc | 25.8 bc | 27.3 c |
| NDF % | 52.9 c | 52.0 c | 50.5 bc | 43.2 ab | 42.2 ab | 39.1 a |
| ADF % | 30.1 c | 30.2 c | 28.3 bc | 23.5 ab | 23.1 ab | 21.8 a |
| ME (MJ/kg) | 9.5 a | 9.5 a | 9.8 a | 11.5 b | 11.4 b | 11.4 b |
| Herbage Availability | Liveweight (kg) | Predictor | Coefficient of Variation (CV) | Adjusted R2 | |||
|---|---|---|---|---|---|---|---|
| Initial | Final | Intercept | Time | Time 2 | |||
| Autumn | |||||||
| Low | 36.8 (0.42) | 35.0 (0.39) | 0.01 (0.08) | 0.20 a (0.02) ** | ns | 0.31 | 0.69 |
| Medium | 37.6 (0.43) | 35.9 (0.41) | 0.11 (0.08) | 0.23 a (0.02) ** | ns | 0.41 | 0.69 |
| High | 37.6 (0.40) | 35.6 (0.38) | 0.05 (0.08) | 0.27 ab (0.02) ** | −0.020 ab (0.003) * | 0.45 | 0.71 |
| Winter | |||||||
| Low | 47.3 (0.33) | 45.4 (0.32) | 0.10 (0.08) | 0.22 a (0.02) ** | ns | 0.48 | 0.6 |
| Medium | 48.1 (0.32) | 46.0 (0.32) | 0.13 (0.09) | 0.35 bc (0.02) ** | −0.012 a (0.002) ** | 0.39 | 0.71 |
| High | 48.5 (0.34) | 46.3 (0.32) | 0.02 (0.08) | 0.42 c (0.02) ** | −0.020 ab (0.002) ** | 0.42 | 0.67 |
| Item | Tuapaka Farm | Riverside Farm |
|---|---|---|
| Herbage mass (kg DM/ha) | ||
| Low | 940 ab | 882.3 a |
| Medium | 1284.3 b | 1232.5 b |
| High | 1910.8 d | 1530.3 bc |
| Proportion of live dry matter (%) | ||
| Low | 61.7 a | 85.3 bc |
| Medium | 93.4 bc | 71.2 ab |
| High | 94.5 c | 86.2 bc |
| Tuapaka Farm | Riverside Farm | |||||
|---|---|---|---|---|---|---|
| Parameter | Low | Medium | High | Low | Medium | High |
| DM % | 17.9 b | 16.5 a | 16.7 a | 17.8 b | 18.6 b | 17.9 b |
| CP % | 22.8 a | 26.9 b | 26.9 b | 24.6 a | 27.2 b | 27.4 b |
| NDF % | 39.1 a | 42.2 b | 43.2 b | 39.1 a | 42.9 b | 43.3 b |
| ADF % | 21.8 a | 23.1 b | 23.5 b | 22.3 a | 19.9 a | 19.7 a |
| ME (MJ/kg) | 11.5 b | 11.4 b | 11.4 b | 10.3 a | 10.8 a | 10.5 a |
| Liveweight (kg) | Predictor | Coefficient of Variation (CV) | Adjusted R2 | |||||
|---|---|---|---|---|---|---|---|---|
| Farm | Herbage Availability | Initial | Final | Intercept | Time | Time2 | ||
| * Keeble | Low | 47.3 (0.33) | 45.4 (0.32) | −0.28 (0.107) e | 0.23 (0.033) a | 0.01 (0.005) e | 0.48 | 0.48 |
| Medium | 48.1 (0.32) | 46.0 (0.32) | 0.35 (0.117) cd | 0.45 (0.036) c | −0.02 (0.006) cd | 0.39 | 0.62 | |
| High | 48.5 (0.34) | 46.3 (0.32) | −0.62 (0.117) bcd | 0.55 (0.036) cd | −0.03 (0.005) bc | 0.42 | 0.58 | |
| † Tuapaka | Low | 38.1 (0.26) | 37.1 (0.24) | −0.62 (0.146) abcd | 0.40 (0.046) bc | −0.03 (0.007) bcd | 0.55 | 0.50 |
| Medium | 41.5 (0.39) | 39.5 (0.33) | −1.24 (0.150) a | 0.80 (0.046) e | −0.06 (0.007) a | 0.43 | 0.65 | |
| High | 42.6 (0.40) | 40.3 (0.36) | −1.13 (0.153) ab | 0.79 (0.047) e | −0.06 (0.007) a | 0.44 | 0.65 | |
| † Riverside | Low | 40.6 (0.45) | 39.3 (0.44) | −0.13 (0.13) de | 0.27 (0.041) ab | −0.01 (0.006) de | 0.31 | 0.75 |
| Medium | 43.8 (0.46) | 41.8 (0.44) | −0.39 (0.137) cd | 0.46 (0.043) c | −0.02 (0.006) cd | 0.24 | 0.84 | |
| High | 43.9 (0.49) | 41.4 (0.47) | −0.75 (0.144) abc | 0.68 (0.045) de | −0.04 (0.007) ab | 0.23 | 0.85 | |
| Farm | * Correction Equation (Model) | Herbage Availability | Liveweight (kg) | Bias | RMSE | RPE % | RPD | RPIQ | r2 % | CCC % | ||
|---|---|---|---|---|---|---|---|---|---|---|---|---|
| Actual Initial | Actual Final | Predicted Final | ||||||||||
| Tuapaka | None | Low | 38.2 (0.26) | 37.1 (0.24) | −0.75 | 1.06 | 2.78 | 1.92 | 2.45 | 87.9 | 80.8 | |
| Medium | 41.5 (0.38) | 39.5 (0.33) | −1.49 | 1.77 | 4.26 | 1.67 | 2.34 | 80.6 | 75.6 | |||
| High | 42.6 (0.40) | 40.3 (0.36) | −1.62 | 1.91 | 4.49 | 1.63 | 2.26 | 81.9 | 73.2 | |||
| From autumn | Low | 38.2 (0.26) | 37.1 (0.24) | 38.5 (0.24) | −0.06 | 0.75 | 1.96 | 2.72 | 3.95 | 87.9 | 92.4 | |
| Medium | 41.5 (0.38) | 39.5 (0.33) | 41.2 (0.33) | −0.62 | 1.05 | 2.53 | 2.82 | 3.95 | 92.6 | 94.8 | ||
| High | 42.6 (0.40) | 40.3 (0.36) | 41.9 (0.36) | −0.58 | 1.06 | 2.49 | 2.93 | 4.08 | 92.6 | 91.8 | ||
| From winter | Low | 38.2 (0.26) | 37.1 (0.24) | 38.6 (0.24) | 0.25 | 0.78 | 2.04 | 2.62 | 3.33 | 87.9 | 91.6 | |
| Medium | 41.5 (0.38) | 39.5 (0.33) | 41.0 (0.33) | −0.24 | 0.87 | 2.1 | 3.4 | 4.77 | 92.6 | 94 | ||
| High | 42.6 (0.40) | 40.3 (0.36) | 42.7 (0.36) | −0.35 | 0.94 | 2.21 | 3.31 | 4.6 | 92.6 | 95.5 | ||
| Riverside | None | Low | 40.6 (0.45) | 39.3 (0.44) | −0.84 | 0.96 | 3.55 | 2.42 | 3 | 87 | 92.9 | |
| Medium | 43.8 (0.46) | 41.8 (0.44) | −1.27 | 1.41 | 3.9 | 2.18 | 3.25 | 84.9 | 85.5 | |||
| High | 43.9 (0.49) | 41.4 (0.47) | −1.67 | 1.8 | 4.1 | 2.1 | 3.07 | 89.4 | 80.9 | |||
| From autumn | Low | 40.6 (0.45) | 39.3 (0.44) | 40.6 (0.44) | −0.16 | 0.34 | 0.84 | 10.26 | 12.12 | 99.3 | 99.5 | |
| Medium | 43.8 (0.46) | 41.8 (0.44) | 43.5 (0.44) | −0.42 | 0.55 | 1.26 | 6.46 | 10.1 | 99.2 | 99.2 | ||
| High | 43.9 (0.49) | 41.4 (0.47) | 43.0 (0.47) | −0.64 | 0.77 | 1.76 | 4.91 | 7.18 | 99.1 | 96.6 | ||
| From winter | Low | 40.6 (0.45) | 39.3 (0.44) | 40.7 (0.44) | 0.14 | 0.33 | 0.81 | 10.57 | 13.11 | 99.3 | 99.5 | |
| Medium | 43.8 (0.46) | 41.8 (0.44) | 43.4 (0.44) | −0.04 | 0.33 | 0.75 | 10.77 | 16.82 | 99.2 | 98.9 | ||
| High | 43.9 (0.49) | 41.4 (0.47) | 43.8 (0.47) | −0.42 | 0.57 | 1.3 | 6.62 | 9.69 | 99.1 | 99.4 | ||
Publisher’s Note: MDPI stays neutral with regard to jurisdictional claims in published maps and institutional affiliations. |
© 2021 by the authors. Licensee MDPI, Basel, Switzerland. This article is an open access article distributed under the terms and conditions of the Creative Commons Attribution (CC BY) license (http://creativecommons.org/licenses/by/4.0/).
Share and Cite
Semakula, J.; Corner-Thomas, R.A.; Morris, S.T.; Blair, H.T.; Kenyon, P.R. The Effect of Herbage Availability and Season of Year on the Rate of Liveweight Loss during Weighing of Fasting Ewe Lambs. Agriculture 2021, 11, 150. https://doi.org/10.3390/agriculture11020150
Semakula J, Corner-Thomas RA, Morris ST, Blair HT, Kenyon PR. The Effect of Herbage Availability and Season of Year on the Rate of Liveweight Loss during Weighing of Fasting Ewe Lambs. Agriculture. 2021; 11(2):150. https://doi.org/10.3390/agriculture11020150
Chicago/Turabian StyleSemakula, Jimmy, Rene A. Corner-Thomas, Stephen T. Morris, Hugh T. Blair, and Paul R. Kenyon. 2021. "The Effect of Herbage Availability and Season of Year on the Rate of Liveweight Loss during Weighing of Fasting Ewe Lambs" Agriculture 11, no. 2: 150. https://doi.org/10.3390/agriculture11020150
APA StyleSemakula, J., Corner-Thomas, R. A., Morris, S. T., Blair, H. T., & Kenyon, P. R. (2021). The Effect of Herbage Availability and Season of Year on the Rate of Liveweight Loss during Weighing of Fasting Ewe Lambs. Agriculture, 11(2), 150. https://doi.org/10.3390/agriculture11020150