Article

Effects of Climate on Fruit Growth and Development on Olive Oil Quality in Cultivar Carolea

Department of AGRARIA, University Mediterranea of Reggio Calabria, 89124 Vito, Reggio Calabria, Italy
*
Author to whom correspondence should be addressed.
Agriculture 2021, 11(2), 147; https://doi.org/10.3390/agriculture11020147
Submission received: 4 December 2020 / Revised: 28 January 2021 / Accepted: 5 February 2021 / Published: 10 February 2021

Abstract

:
Trees of the olive (Olea europaea L.) cultivar Carolea grown in Calabria (Italy) in three sites with different main climate traits (temperatures, rainfall, Growth Degree Days seasonal variations) were studied for three years to see the ripening time course and quality of the oils. The optimal harvesting time for obtaining the best-quality olive oils was defined for each site. The effect on quality indexes of three harvesting periods was also considered, linking this to the observed various thermal regimes. The different climates largely affected the growth and the development of fruits and the quality of obtained oils. Lower temperatures and higher rainfall slow down fruit growth and development and delay ripening. Olive oils of good quality (free acidity, fatty acid composition, antioxidant components and oxidative stability were obtained in the site with lower temperatures and higher rainfall when fruits were still yellow-green ripe and had a detachment index between 1.9 and 1.5. Climate change, evidenced by rising temperatures, led to the movement of olive groves from the high-temperature coastal plain to the intern foothills.

1. Introduction

The olive oil is the principal fat of the Mediterranean Diet, recognized by UNESCO as a protected asset and added to humankind’s intangible heritage. The consumption of this fat as an ingredient in various gastronomic preparations is strongly recommended due to its healthy properties, particularly the reduction in cardiovascular and inflammatory diseases. Qualitative parameters in olive oils are affected by different variables. During olive maturation, many metabolic reactions take place, with subsequent variations in the physical characteristics and the concentration of some chemical compounds. In particular, advanced maturation involves a decline in positive sensorial attributes owing to the decrease in aromatic compounds, pigments and phenolic compounds, which directly affects the qualitative properties of olives (e.g., average weight, flesh/pit ratio, oil yield) and olive oil [1,2]. The fruit growth and oil accumulation into the drupes are also dependent on agronomical and edaphoclimatic conditions [3,4]. Olive oils obtained from the same cultivar grown in different areas vary in terms of chemical characteristics, due to the different environmental conditions [5]. Olive oils from Tunisian and Turkish cultivars grown in a cool environment showed a greater amount of oleic acid and total phenols, compared to oils produced in warm climate areas [6,7]. Mousa et al. [8] confirmed the trend for unsaturated fatty acids, and instead observed a decrease in phenolic substances in Greek oils obtained at higher altitude. The water availability in fact was negatively correlated with the polyphenol concentration and stability in a research on oils from Arbequina, Cobrançosa, Koroneiki and Leccino cvs. [9,10,11,12]. Ismail et al. [13] instead observed a higher phenolic content in oils from drupes of regularly irrigated trees than in oils obtained without tree irrigation.
In the Calabria region (Southern Italy), olive growing expands from coastal areas to mountain areas with a typical “Mediterranean” climate with a mild winter and hot and dry summer. In more inland areas and at higher altitudes, there is a mountain-Mediterranean climate with colder and wetter winters and warm and sometimes rainy summers. This climatic diversity, together with the numerous autochthonous varieties found in Calabria [14,15], can produce very different oils. Although numerous studies have been conducted over the years to characterize and evaluate Calabrian olive production [16,17,18,19], there are no previous studies on the climate of the growing environment on olive ripening and the quality of olive oils.
The aim of this study is to evaluate the effects of climate on the dynamics of olive ripening and qualitative characteristics of the olive oils of the Carolea cultivar, the most important olive variety cultivated in Calabria.

2. Materials and Methods

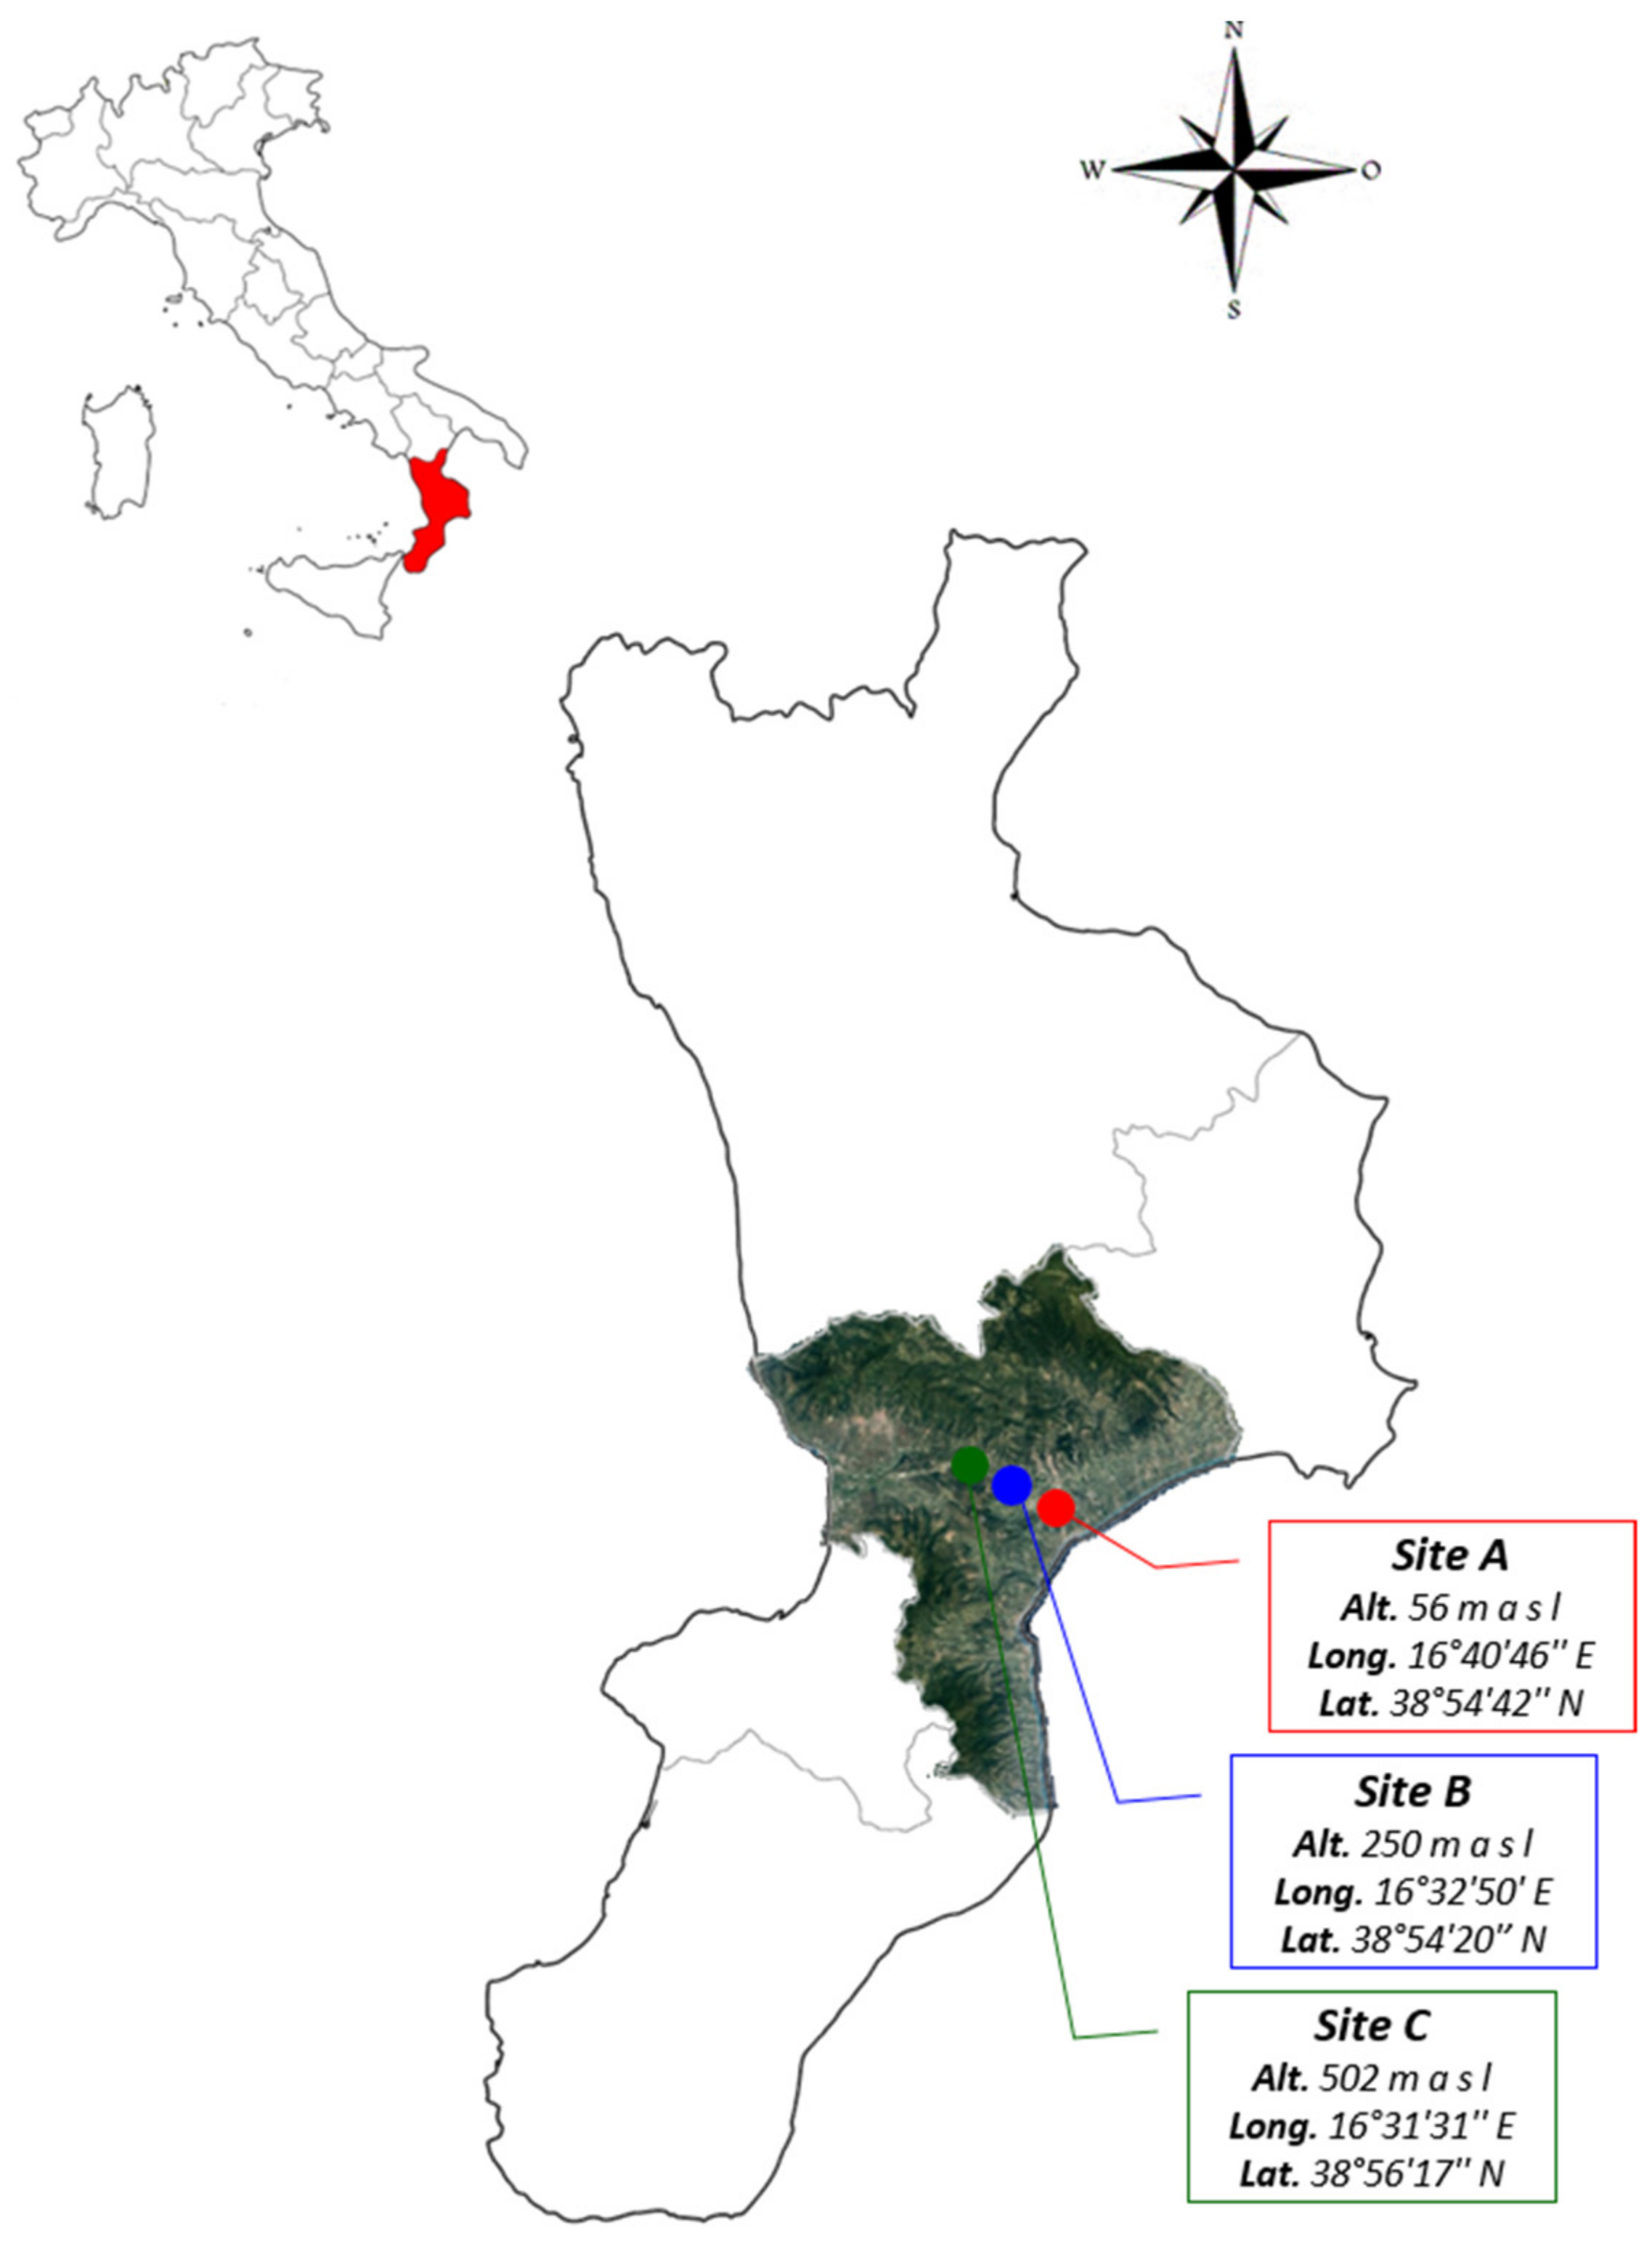
2.1. Experimental Sites and Plant Materials

The study was carried out in a central area of Calabria (Southern Italy) during the years 2013, 2014 and 2015. The location, altitudes and geographical positions of the olive (Carolea cv.) grove sites are reported in Figure 1.
The three olive orchards were similar in terms of age, planting system and agronomic management: about 60 years old, trained according to the open-center training system and spaced 10 × 10 m2 and grown under rain-fed conditions. The agronomic management essentially involved a fertilization and superficial tillage at the end of winter and a light annual pruning after harvest. The fertilization was carried out with the controlled-release fertilizer (N: P: K 21:5:9 with microelements) at five kilograms per tree. Olive orchards received continuous monitoring for the main olive parasites, using pest control treatments when necessary and according to the principles of integrated pest management. At the start of the study, six trees with similar growth and fruit load were selected within each olive orchard, among which three were used for destructive analysis (which included periodic removal of fruit samples) and the remaining three for non-destructive assessments (based only on visual observations or measurements, without removing the fruits).

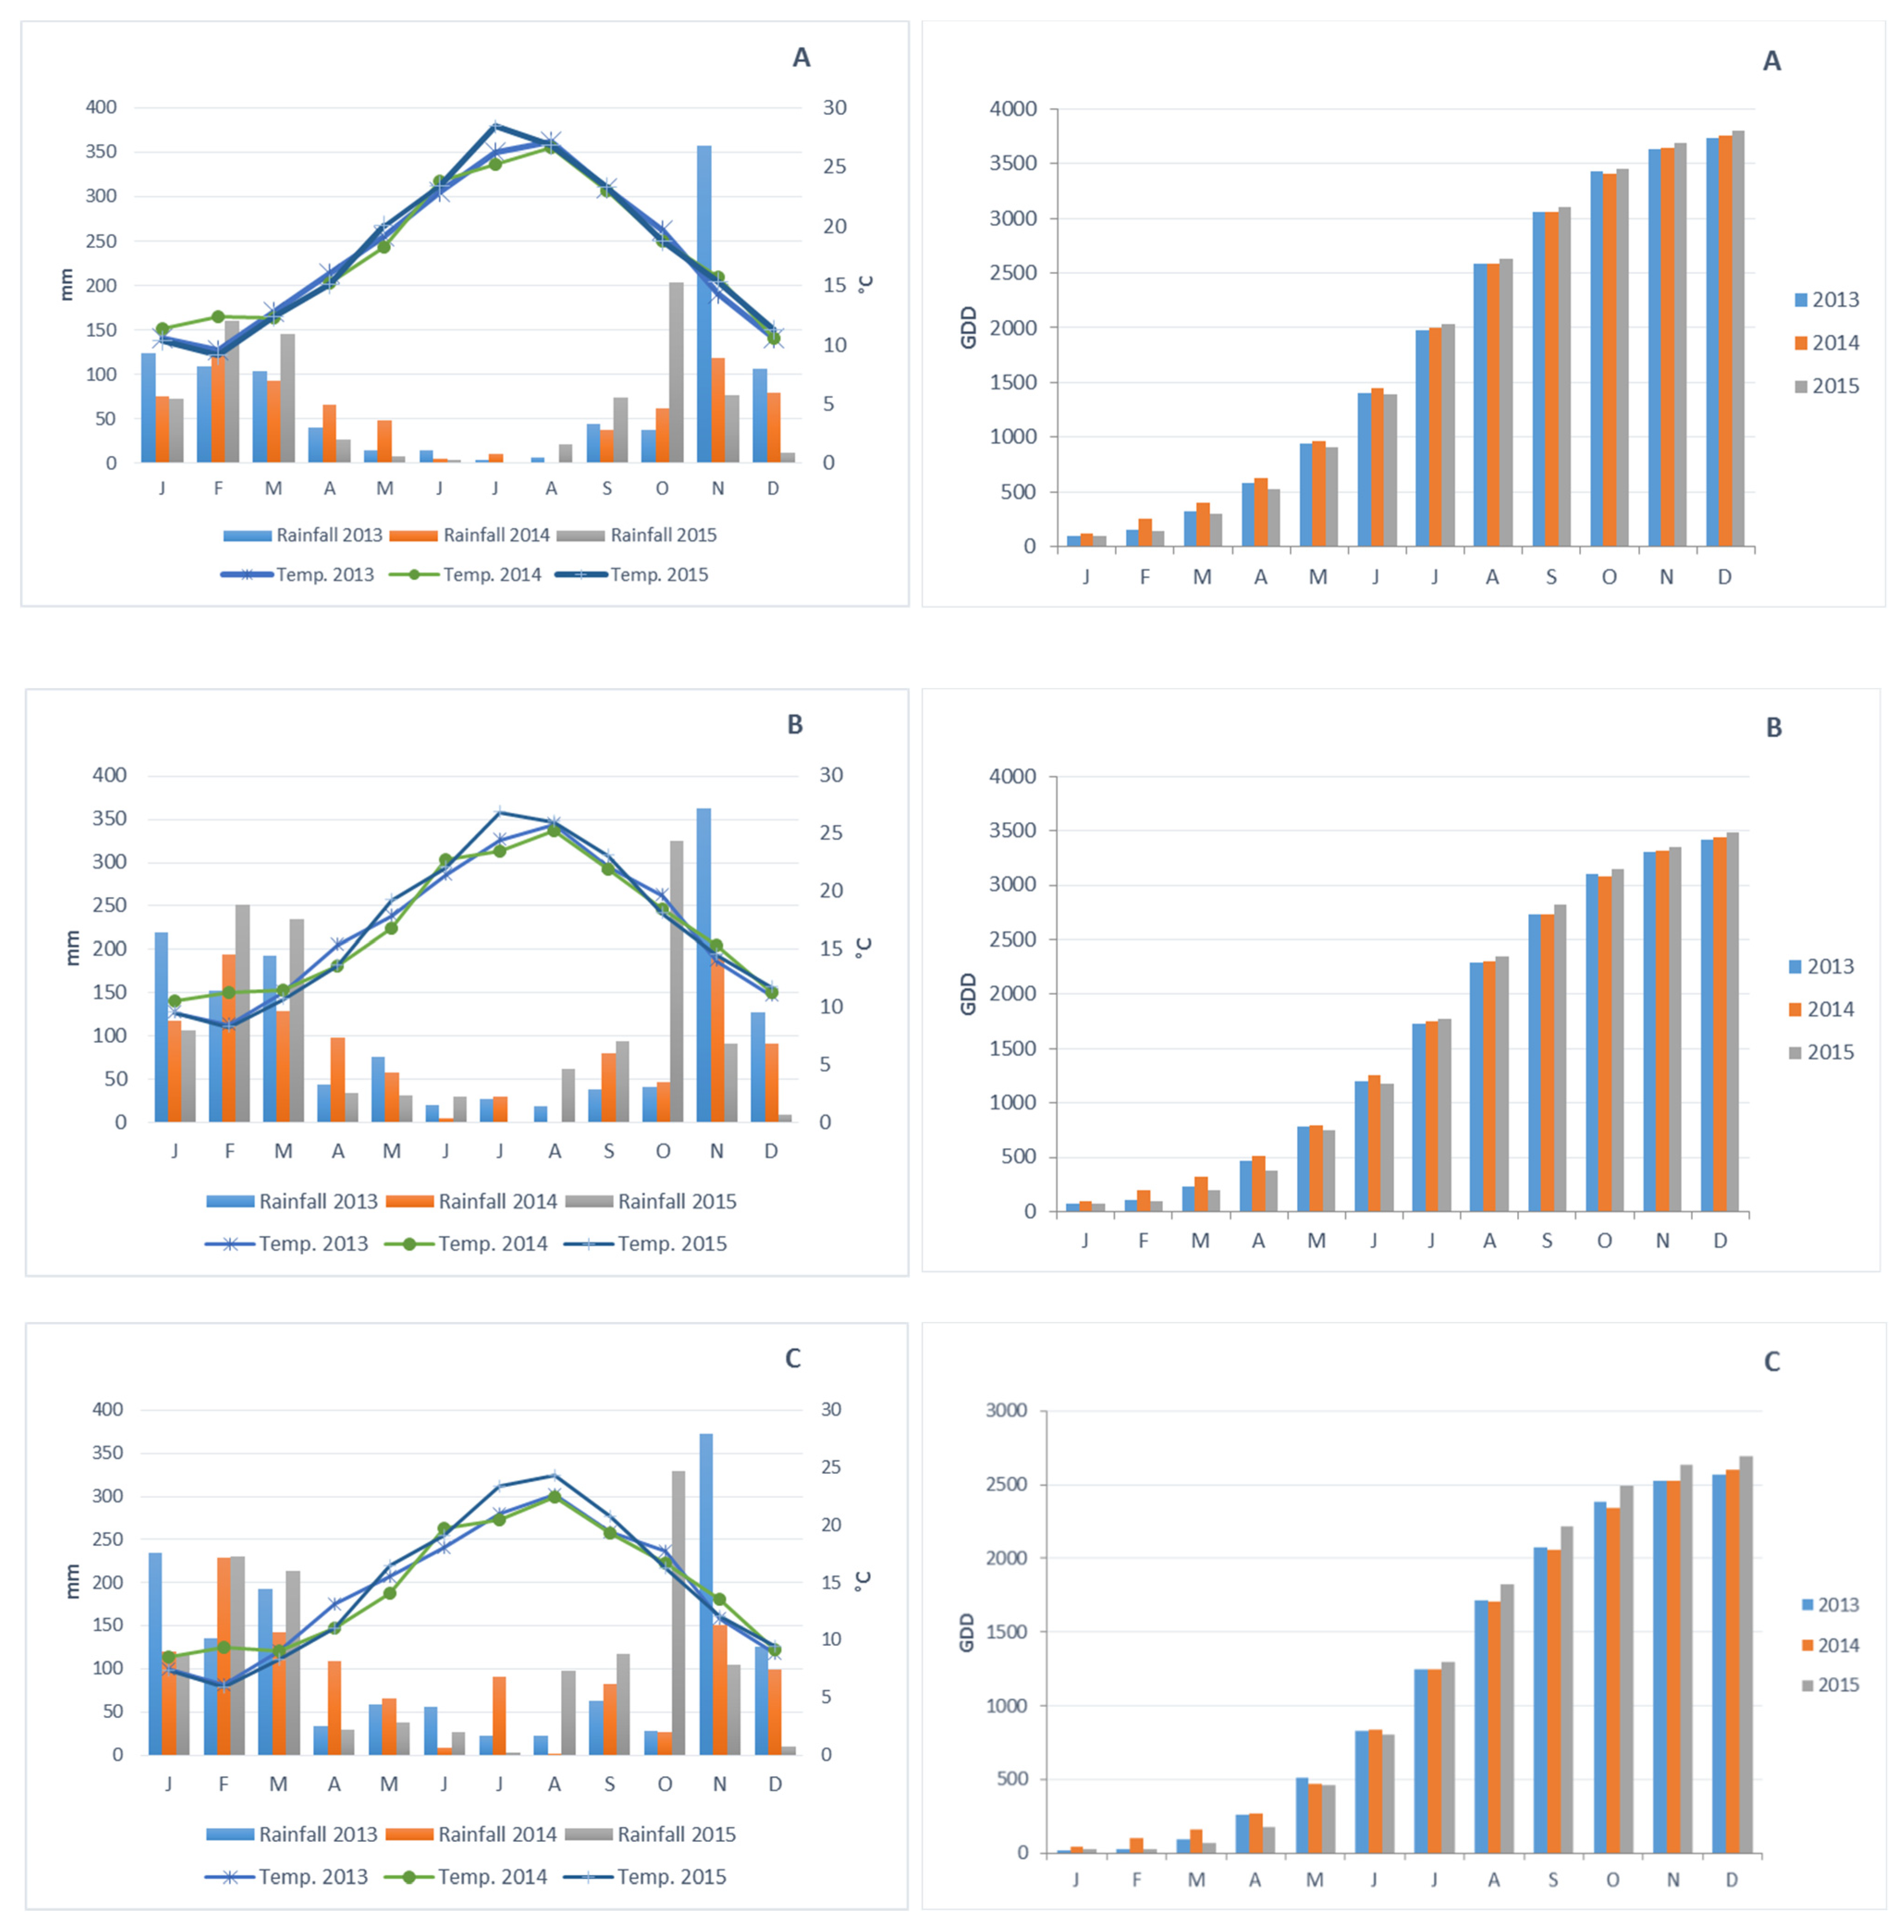
2.2. Climate Parameters

In each site, the air temperature and rainfall were measured through a WatchDog 2425 weather station (SPECTRUM Technologies Inc., Thayer Court, Aurora, IL, USA) located inside the olive orchards. The air temperature data were used to calculate the Growing Degree Days (GDD) by the following formula: GDD = Σ (T daily mean temperature—T threshold). T threshold is the minimum temperature for olive biothermic accumulation and it is assumed to be 7.5 °C [20].

2.3. Phenological Parameters

Starting from mid-April and throughout the growing season, the main phenological phases were observed on the three trees selected for non-destructive evaluations. The phenological observations, carried out on four fruiting branches (one for each cardinal point) for each tree, were made using the BBCH scale system [21,22]. In particular, the following phenological phases have been defined: first open flowers (code 60); complete flowering (code 65); first falling petals (code 67); complete stone hardening (code 75); beginning of fruit coloring (colour break) (code 81).

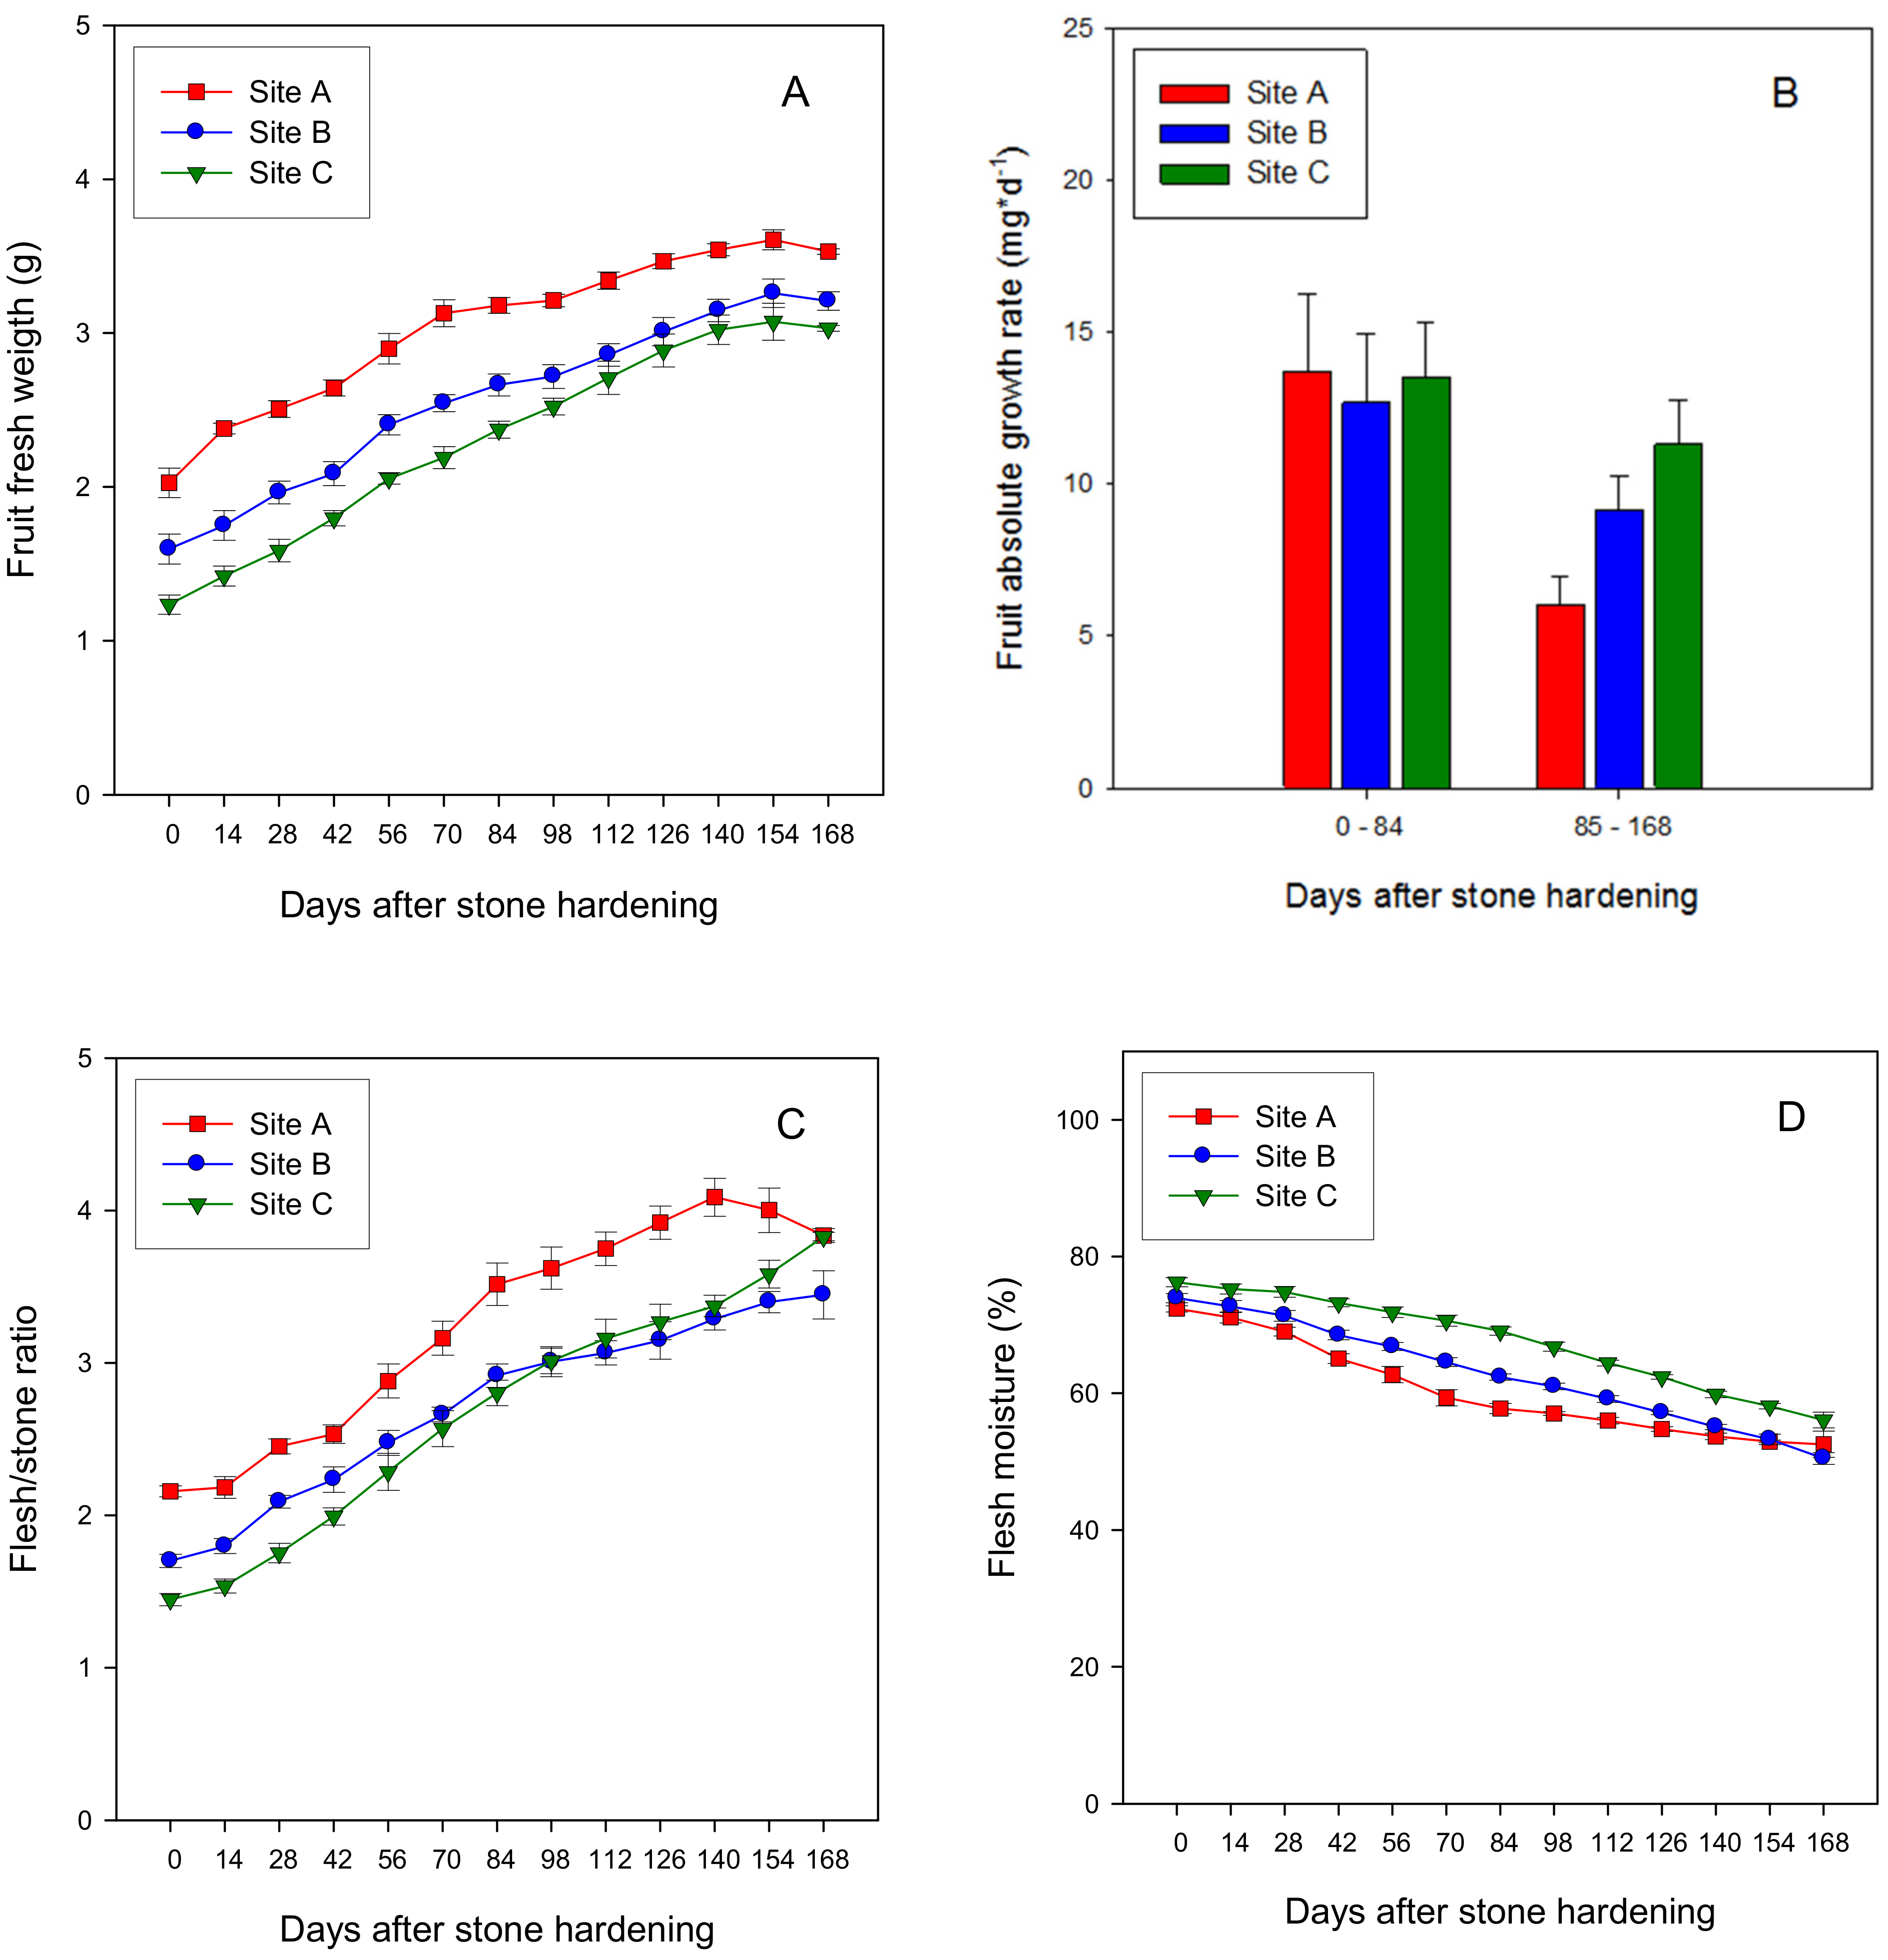
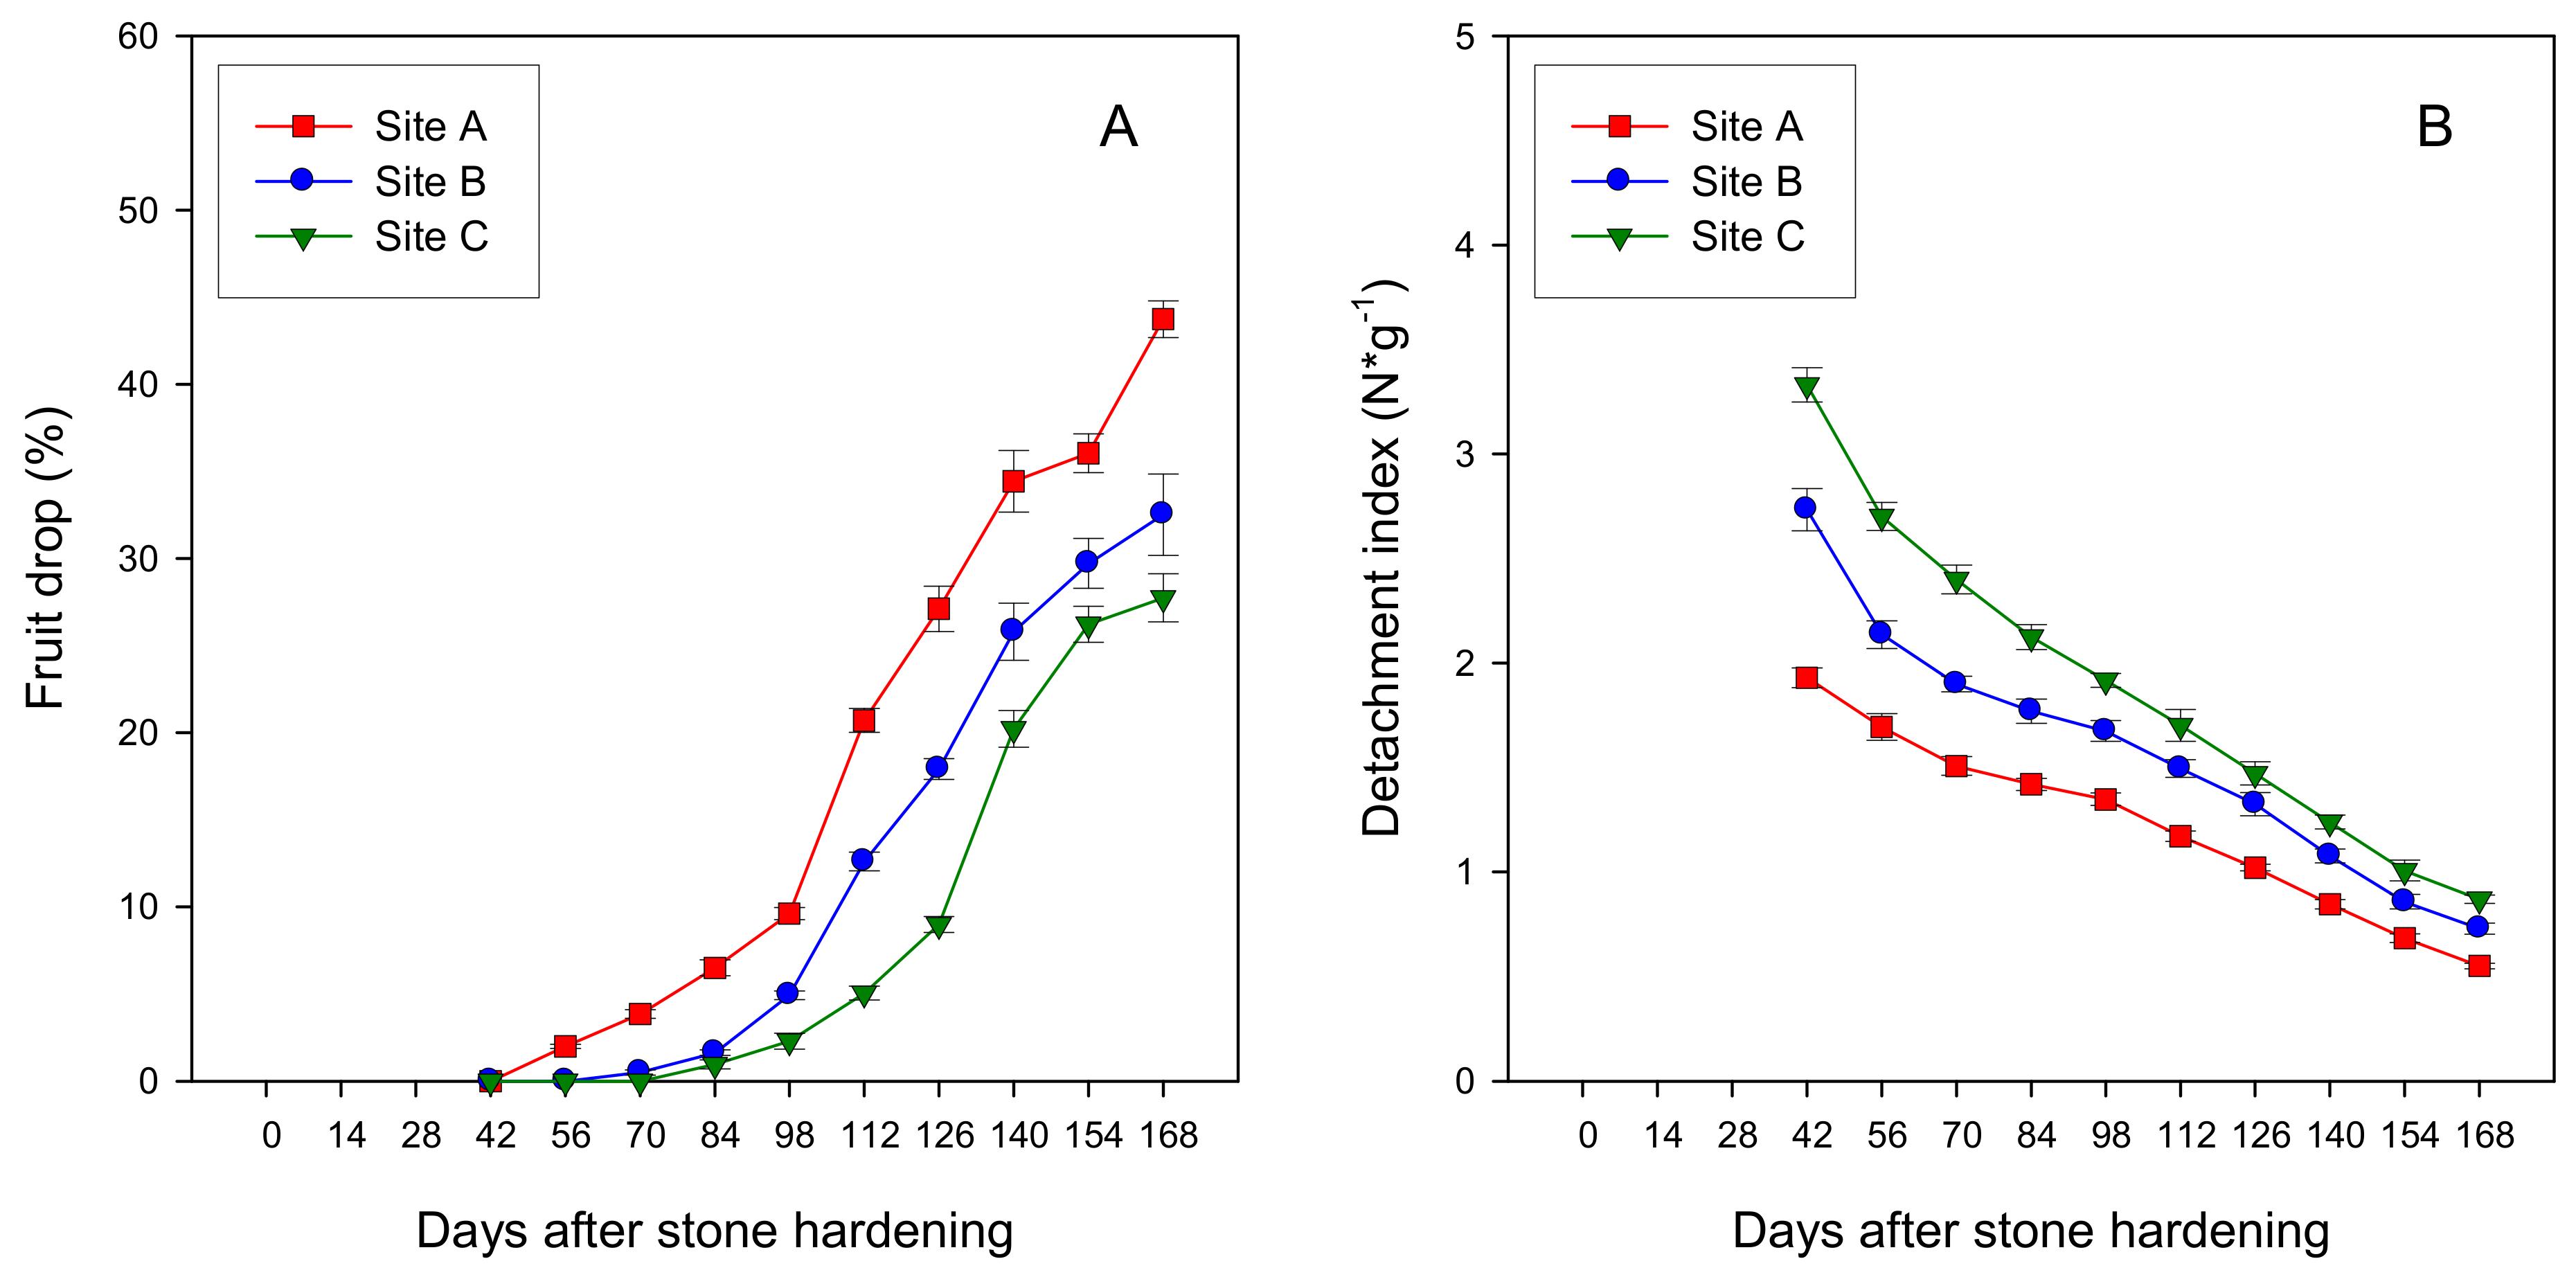
2.4. Sampling and Olive Measurements

From three trees selected for destructive evaluations starting from the complete stone hardening (which occurred in all three years in the second decade of July for site A, in the third decade of July for site B and in the first ten days of August for site C), samples of 40 fruits (10 for each cardinal point of the canopy) were harvested at bi-weekly intervals for each location. The samples were placed in a refrigerated bag until reaching the laboratory for processing. Fruit fresh weight was calculated and then each fruit was manually separated into flesh and stone. Fresh and dry weight was determined in flesh and stone after 48 h in a forced air oven at 80 °C. Water concentration was calculated in terms of percentage by difference from fresh and dry weight. Starting from the beginning of September, at bi-weekly intervals, and in the same samples of 40 fruits used to determine the fresh and dry weight of the flesh and the stone (measurements started from the complete stone hardening), the detachment force, ripening index and firmness flesh of the fruits was determined. The detachment force of olive samples was measured by a “TR” hand dynamometer (TR Turoni s.r.l., Forlì, Italy). Ripening index was determined according to the method developed at the Estacion de Olivicultura of Jaen in Spain [23].
The detachment index (DI) was also calculated as
DI   = DF FW
where DF is the detachment force and FW is the fresh weight of fruit.
The flesh firmness was measured by PCE-FB 20 dynamometer (PCE Holding GmbH & Co, Hamburg, Germany) with a 1.5 mm diameter tip. At the same time, from each tree 300 g of fruits were sampled for the evaluation of the percentage of oil, sugar content and total polyphenols. In other three trees (those used for non-destructive analysis), fruit drop percentage was estimated by the isolation of fruiting branches with net bags and counting the number of fruit dropped at the end of the season.

2.5. Olive oil Extraction and Chemical Analyses of Olive Oils

About 5 kg of drupes from each selected olive tree were sampled at three harvesting times (90, 120 and 150 days after stone hardening) in the three experimental years for olive oil extraction. Olive oils were extracted by a “Mini 30” pressure system (Agrimec Valpesana, Firenze, Italy), centrifuged, filtered through paper and then stored in dark glass bottles at room temperature. The chemical analyses performed on olive oils were: free acidity (FA), peroxide value (PV), UV light absorption (K232 and K270), sterols content, waxes, free fatty acids, fatty acids methyl esters (FAME), ethyl esters (FAEE), and according to the analytical methods described in EC Regulations [24,25,26]. Total phenol content (TPC) of olive oils was quantified according to Baiano et al. [27]. Total Tocopherol (TT) analysis followed the IUPAC method 2432 [28]. Total chlorophylls (TCL) and total carotenoids (TCA) were determined according to the methods reported by Minguez-Mosquera et al. [29]. Antioxidant assays (DPPH and ABTS) were performed according to Baiano et al. [27] and Miller et al. [30].

2.6. Statistical Analysis

Olive data were elaborated as mean ± standard error (n = 9) of the three experimental years. Olive oil data were elaborated as mean (n = 2) of the three experimental years. The potential relationship between the main measured parameters was examined. One-way analysis of variance (ANOVA) was applied to the data to determine the presence of significant differences in the chemical parameters of monovarietal olive oils among two variables: growing environment and harvesting times (significant level for p < 0.05). Multivariate analysis was used to discriminate the effect of the studied variables on each qualitative parameter in the oils. SPSS Software (Version 15.0, SPSS Inc., Chicago, IL, USA) was used for data processing.

3. Results

The thermo-pluviometric data showed only slight oscillations among the three years for each site (Figure 2).
The data, considered as a mean of the period 2013–2015, showed that site A has an average annual temperature of 17.7 °C, an average temperature of the coldest month of 10.3 °C, four months with thermal averages above 20 °C, and an annual temperature range equal to 16.5 °C. In site B, the average annual temperature was 16.8 °C and that of the coldest month was 9.3 °C. In this case, four months showed thermal averages above 20 °C. The annual temperature range (16.4 °C) was also similar to that of site A. Site C, conversely, was characterized by an average annual temperature (14.4 °C) and that of the coldest month (7.2 °C) significantly lower compared to the other two locations. The annual temperature range was 15.9 °C and there were only two months with thermal averages above 20 °C. Substantial differences between the three sites were also found with regard to rainfall. In location A, the average annual rainfall was significantly lower (827.9 mm) than that of sites B and C, where it was 1203.0 and 1264.1 mm, respectively. In all three sites, the wettest period coincided with the autumn and winter months, with about 70% of the average annual rainfall. The rainfall was also good in the spring months: 200 mm in site A and 300 mm in sites B and C. Rainfall was significantly lower during the summer months. I was around 20 mm in site A, 60 mm in site B and 110 mm in site C.
The accumulation of heat, quantified by GDD, decreased from site A to site C, with an increase in altitude and a decrease in thermal characters, and an increase of rainfall (Figure 2).
This value fluctuated between a minimum value of 2621.5 (site C) and a maximum value of 3760.1 (site A). Inevitably, the different climatic conditions of the three environments conditioned the phenology of the olive trees. Analyzing the data relating to the main phenological phases taken into consideration in this study, it is evident that the phenological phases were postponed with increasing altitude (Figure S1). Even with slight fluctuations depending on year, in site A, flowering essentially occurred in the first ten days of May. It occurred about ten days later in site B. In the site C, however, it occurred considerably later, in the second decade of June. The analysis of accumulation of heat data showed that, for all three environments and years, about 600 GDD was required for the start of flowering. The complete stone hardening occurred in all three years in the second decade of July for site A, in the third decade of July for the site B and in the first ten days of August for site C. The interval of time between the end of flowering and complete stone hardening was almost similar between sites A and B (63 days), while it was shorter in site C (54 days). The interval of time between stone hardening and start of changes of skin colour of fruit increased progressively with the altitude, resulting in an average of 90, 98 and 119 days in sites A, B and C, respectively. Accordingly, the interval of time between the end of flowering and beginning of changes in the skin colour of fruit was, on average, 22 weeks in site A, 23 weeks in site B and 24 weeks in site C. Substantial differences among three cultivation environments were observed in fruit development and ripening. The fruit fresh weight decreased with increasing altitude (Figure 3A).
These differences were already evident at the end of the first period of fruit growth. At complete stone hardening, in site A the fruit fresh weight already exceeded 2 g and was significantly greater than that of site B (+27%) and C (+64%). These differences remained almost constant up to 84 days after stone hardening. It corresponded to the first ten days of October in site A, the second ten days of October in site B and end of October/beginning of November in site C, when the fruit growth rates were almost similar in the three sites, with values around 13.3 mg day −1 (Figure 3B). After this period, the differences among three sites gradually decreased because the fruit growth rates in sites B (9.13 mg day−1) and C (11.3 mg day−1) were significantly higher than in site A (6.05 mg day −1). Nevertheless, at the end of the observation period (168 days after stone hardening), the fruit fresh weight of site A continued to have a higher value than that of sites B (+10%) and C (+16%). Significant differences among the environments were also found on the flesh stone ratio (Figure 3C). In site A, this parameter was significantly higher than in the other two sites, which instead showed similar values. The differences were evident at the beginning of the observations; at complete stone hardening in site A, the flesh stone ratio was 25% greater than in site B and about 50% greater than in site C. These differences gradually increased up to 140 days after stone hardening. This corresponded to the end of November/beginning of December in site A, the end of the first decade of December in site B and to the third decade of December in site C. At this stage, the flesh stone ratio in the site A exceeded the value of 4, while it was around 3.3 in those of the other two sites. In the subsequent samplings, the differences gradually diminished. The flesh moisture progressively decreased with the fruit development and ripening (Figure 3D), going from values of around 72–76% at the beginning to values ranging between 50 and 56% at the end of the observations. While having a similar dynamic model, the flesh moisture value in site C was constantly higher than that of the other two sites. In these sites, the differences were minimal in the initial and final observations period and more evident in the central period, with higher values recorded by the fruits of site B.
Substantial differences among three cultivation environments were found on fruit drop (Figure 4A): a postponement of the phenomenon was observed with increasing altitude.
In site A, 84 days after stone hardening, the fruit drop was greater than 6.5%. Two weeks later it was already around 10%, while in sites B and C it still did not exceed 5% and 2.5%, respectively. In site C, alarming fruit drop values reached between 126 and 140 after stone hardening. At this stage, the fruit drop values in sites A and B were significantly higher, with values close to 30% and 20%, respectively. Significant differences between sites were also recorded for the detachment index (Figure 4B). In fact, although showing a similar decreasing trend model, the values were significantly different in absolute terms: site A showed, at the first sampling (42 days after stone hardening), values close to 2 N*g−1. In sites B and C, this critical threshold was reached two and four weeks later, respectively. Similar differences were also found regarding the ripening index: in site A, the olive pigmentation was significantly earlier than in the other two sites (Figure 4C). After 98 days from the stone hardening, the ripening index was higher than 2 (changing skin colour with reddish spots), with an advance of about 10 days with respect to site B and almost a month with respect to site C. At the end of the observations (168 days after stone hardening), the ripening index was higher than 4.5 in site A, slightly higher than 4 in B and around 3.3 in C. The postponement of the ripening process with lower temperatures and higher rainfall is also confirmed by the firmness flesh data: a decreasing trend was recorded with the progression of ripening, with higher values in sites C and B than those in site A (Figure 4D). The oil content data of the flesh showed an increasing trend with progress of ripening without clear differences among sampling sites (Figure 4E). The total phenol content of sampled drupes did not show clear trends; the phenols contained in drupes sampled at the hottest and driest site (during summer) were higher with respect to others at the last sampling (Figure 4F).
All the Carolea oils produced during October and November in the three sites possessed a free acidity level inside the legal limit for extra virgin olive oil (max 0.8%) (Table 1) and some differences among the samples produced at October: in site C, oils possessed the lowest FA.
Data are means (years 2013, 2014 and 2015). Capital and small letters indicate significant differences in the row and in the line for Tukey post-hoc test. An increase in total free acidity was generally observed during the harvest season progress, whereas PV varied only in site C with an increase from 2.6 to 6.46 mEq O2/kg. PV, together with the spectrophotometric indexes and total waxes of all samples, were inside the limit of the extra virgin olive oil class. Oils produced with olives collected in site C showed a significant increase in total waxes from October to December productions (19–40 mg/kg). The FAEE content quantified in studied oils denoted amounts inside the legal limit for extra virgin olive oil (35 mg/kg). The phenolic concentration in the olive oil samples varied from 180 to 458 mg/kg and total tocopherol content varied from 129 to 269 mg/kg. Among samples, the highest amounts were quantified in oil from olives of site A, obtained at a warmer growing environment, in the three harvesting periods, with the same trend observed for polyphenol content. Pigments in olive oil are directly related to oxidative stability: in this study, no significant differences (p > 0.05) were observed among samples for both chlorophylls (3.72–14.12 mg/kg) and carotenoids (2.75–6.51 mg/kg) contents. Moreover, regarding the antioxidant activity of oils by ABTS assay, only the sampling of October denoted differences among sites with the highest radical scavenging activity in B samples; oils produced at a medium altitude possessed then the highest mean TPC. The results of DPPH assays did not show evident variation among all samples. Oxidative stability is an important parameter for the quality maintenance of olive oil: the determinations varied from 6.18 to 21 h in the oil samples and opposite trends were observed in oils produced at a medium and higher altitude during the harvesting periods. In particular, this study evidenced a bigger stability for site B samples.
Oleic (C18:1), palmitic (C16:0), linoleic (C18:2) and stearic acid (C18:0) were found as the major fatty acids (Table 2), and, in general, all olive oils possessed amounts that conformed to the extra virgin category. The oleic acid ranged from 73% to 77%: the highest amounts were possessed by C oils without differences among production dates. The palmitic acid ranged from 13% to 15%, with the highest amounts observed in A oils; the linoleic acid ranged from 5% to 7%, and the stearic acid content was attested to be 2%, without significant variations among all the samples. Finally, all the results of the sterol content of studied olive oils conform to the extra virgin olive oil category: significant differences were observed in campesterol, β-sitosterol and D7-Stigmastenol percentage only among olive oils produced in the three growing environments in December (Table 3).

4. Discussion

The sites located at different altitudes were characterized by very different thermal and rainfall regimes. The analysis of the climatic data of the three sites showed that the air temperature gradually decreased with increasing altitude. The effect of the temperature decrease with altitude was lower during the winter and autumn months, while the gap was higher in the spring and summer months. Instead, the reverse behavior occurred for rainfall. During the three-year period, there were no limiting temperatures (minimum and maximum) to compromise the functionality of the olive trees. The rainfall allowed a regular course of the fruiting cycle of the olive trees. This also occurred in site A, where rainfall was minor (about 800 mm/year). In fact, the rainfall in the spring period and the type of soil (fresh and deep) in this site allowed the olive trees to not suffer excessively from the summer drought. This was confirmed by the regular fruit growth dynamics. The climatic differences among the three sites inevitably influenced the phenology and productive behavior of olive trees. The climate of the growing environment significantly affected the flowering period, with marked temporal differences among the three sites. Results revealed a strong relationship between thermal regime due to altitude and the flowering-period start-date, which was delayed as altitude increased. Similar results have been reported in a number of other studies [31,32,33]. The altitude gradient, associated with a thermal gradient [34,35], significantly affected this process. In order to complete the differentiation process of flowering buds [36,37,38] and other phenological events [39], the olive tree must satisfy a certain heat requirement. The analysis of accumulation of heat data showed that, for all three environments and years, about 600 GDD was required for the start of flowering. These results are in agreement with what was found in a previous study conducted in the same area on the Carolea cultivar [20]. These results also confirm that the phenological phases of the olive tree are mainly influenced by temperature and not by the photoperiod [40,41].
The time differences among the three sites found in the flowering period also remain in broad outline for the period of stone hardening. The slight shortening of the time interval between the end of flowering and the complete stone hardening recorded in site C was probably attributable to the different thermal regime in which the stone hardening process took place. Similarly, the different thermal regime also influenced the time interval between the stone hardening and start of changes in the skin colour of fruit, with a progressive increase in this time interval with increasing altitude. Therefore, the results showed not only a postponement of the phenological phases, but also an extension of the interval of time between the end of flowering and start of changes in skin colour of fruit with the increase in altitude. In addition to the effects on phenology, altitude greatly influenced the olive fruit growth. The obtained results agree with other previous studies that showed a greater increase in the weight of fruits grown at a lower altitude compared with fruits grown at a higher altitude [5,8]. By analyzing the fruit growth dynamics, it is clear that these differences are essentially attributable to the different growth rates registered in the first phase. As in other drupes, olive fruit development is characterized by a double sigmoid growth curve for fruit size and weight [42]. In drupes, the majority of mesocarp cells are produced by the end of endocarp sclerification, and the bulk of cell expansion occurs after that time [43]. For a long time, the general perception was that cell division was the main process during the early stages of fruit growth and cell expansion instead dominated after pit hardening. However, recent studies indicated that cell division and expansion processes are already highly active 8–10 weeks after full bloom and contribute to the initial growth in the mesocarp [44,45]. From that time, until fruit maturity, considerable cell expansion takes place, and an additional 10% to 40% of mesocarp cells may still be produced [46,47]. Other recent studies indicated that the final fruit size is directly related to the cell number produced by the cytokinesis process, which occurs mainly in the first six weeks after full bloom [48]. The different initial fruit growth among the three sites was presumably attributable to their different thermal regimes. It is well known that the cell division process in fruits is strongly influenced by temperature. Studies conducted on other stone fruit species showed that the thermal regime of the weeks following flowering is able to influence the development and ripening of the fruits [49,50,51]. The positive correlation (R2 = 0.82) between the average air temperature from the date of end of flowering until the date of stone hardening and fruit fresh weight at stone hardening supported this hypothesis. The higher growth rates recorded by the fruits of sites B and C, compared to those of site A, in the last fruit growth periods were presumably attributable to an extension of the cellular expansion phase favored by the postponement of the ripening process. The flesh/stone ratio, constantly higher for most of the growth period of the fruits of site A, was probably attributable to a greater number of cells in the mesocarp. Hammani et al. [48] found that when there are no limiting factors, the size of mesocarp and endocarp increased linearly with the fruit size, with larger dimensions that favor an ever-greater mesocarp/endocarp ratio. The fruit size was directly related to the number of mesocarp cells, which was established immediately after flowering based on the cell division rate. The cell size, after the expansion phase, was rather similar. The flesh moisture progressively decreased with the development of the fruit and the olives grown in site C always had substantially higher moisture than that of the other two sites. These results agreed with what was found by Moussa et al. [8] on the Greek olive cultivar “Mastoides”: the noted variations could be due to the different conditions of relative humidity and amount of rainfall in cultivation environments. In addition, differences in flesh moisture could also be due to the postponement of the ripening period that characterizes the fruit growth at thermal and rainfall conditions of high altitudes. The climate of the growing environment also greatly affected the ripening process.
The fruit drop was strongly correlated with the fruit detachment force (R2 = 0.90).
Generally, the fruit drop started after the detachment force values were lower than 5 N. However, the fruit drop began to have significant entities (with values greater than 10%) only when the detachment force was lower than 4 N. The positive relationship (R2 = 0.76) between the detachment force values after 42 days from the stone hardening and the average air temperature of the previous six weeks indicated that the thermal regime of the period following the stone hardening was able to condition the fruit detachment force. In fact, the higher temperatures that characterized the sites with a lower altitude inevitably influenced the ripening process, presumably also influencing the processes that determine the abscission of the ripe fruits [52,53,54,55]. With regard to the detachment index, which represents a very important parameter to establish when the mechanical harvest is possible [56], the differences between the three sites became even more amplified. Indeed, the previously mentioned differences in detachment force were also added to those relating to the fruit fresh weight. The different thermal regimes of the three sites certainly influenced the fruit color changes and flesh firmness. However, the relationships, which not particularly close, between the ripening index and the flesh firmness values at the end of the measurements (168 days after the stone hardening) (R2 = 0.61), and between the ripening index and the sum of the degree days of 24 weeks after the stone hardening (R2 = 0.55), indicated that these processes were likely to be influenced by other factors in addition to temperature. The climatic conditions affected olive oil production: in particular, a high thermal amplitude negatively affected the oil content in drupes [57]; a lower acidity was quantified in those produced in cooler growing environments, according to [58] that evidenced larger amounts of free fatty acids in oil from lower elevation. Moreover, the FA increase in olive oils obtained in progressive harvesting periods was also noted for other cultivars grown in the same region of our experimentation, as in Ottobratica and Roggianella [59,60], for Barnea in Israel [61], and Arbequina and Picual in Spain [62]. The trend reported in the literature was confirmed by the oil productions of December at lower and higher altitudes (A and C), which evidenced mean values typical of the merceological class of “virgin oil”, whereas it was only in medium-altitude-produced oils (B) that this qualitative parameter did not vary, maintaining the original good quality. The results of multivariate data analysis evidenced a significant effect of harvesting time on FA, as illustrated in Table S1.
The climate of the growing environment seemed not affect the PV and Total wax content of olive oils: this last was, in fact, significantly affected (p < 0.05) by harvesting time, as a result of data elaboration via multivariate analysis of variance. The FAEE content did not show significant differences due to the climate of the growing environment or harvesting time, so this parameter appears to be linked more to processing conditions, as previously observed by Piscopo et al. [63] in a similar area of Southern Italy. The antioxidant content in olive oils is affected by agroclimatic conditions, varietal characteristics, drupe ripening stage, olive growing techniques and extraction system [64]. The climatic and geographic factors of the production zones, in fact, greatly affect the content of minor constituents, whereas a negative correlation with rainfall is reported in the literature [65]. The harvesting time affected the TPC of olive oils, denoting the highest amounts in the October productions, without significant differences between A and B oil samples. These results, according to Osman et al. [57] (1994), showed a higher phenol content in Greek olive oils obtained from plants grown at lower altitudes (100 vs. 400 m a.s.l.). During the harvesting time, from October to December, an overall decline in TPC was observed in all oil samples, attesting to −24% in A, −13% in B and −42% in C, according to previous studies [66] and revealing the best retention in medium-altitude-produced oils. Multivariate data analysis showed that both altitude and harvesting time significantly (p < 0.01) influenced TPC (Table S1); the overall data elaboration by Pearson correlation coefficient revealed that the TPC of oils was particularly correlated with oxidative stability (R2 = 0.78) and not with the two antioxidant assays. Total tocopherols also tended to decrease during the harvesting time progress, as confirmed by the literature for the same cultivar [18], and they were affected by altitude with a significance of p < 0.01. Pigments were not influenced by altitude, as confirmed by [67]. The literature reports differences in fatty acid composition according to cultivar [68] and geographical origin [69]. Concerning the effect of harvesting time, only in oils produced in site B, at medium altitude, was significance observed in terms of palmitic, oleic and linoleic acid amounts: the same sample showed good quality with an unvaried oleic to linoleic acid ratio for both productions of October and December. This trend is also dependent on varietal characters, as a response to environmental factors, as evidenced by [70]. No great differences were observed in the other samples, with trends similar to those observed by Nergiz and Engez [71]. The effect of the growing environment on fatty acid composition was particularly marked in saturated acid amounts (C16:0 and C17:0) of previously cited productions (October and December): at site A, a higher amount was observed. In all oils, and in particular in those produced in December, a bigger content of oleic acid was observed at site C, according to the literature, which reported an increase in unsaturated fatty acid percentage in oils from olives grown at a higher altitude, where the temperature decreases [72,73]. The exclusive effect on SFA % by the climate of the growing environment and on C18:1/C18:2 by harvesting time was evidenced after an overall data elaboration by multivariate analysis (Table S1). The sterol composition is investigated for the evaluation of the nutritional value, as well for the identification of the olive oil: the statistical data elaboration did not evidence strong differences due to climate of the growing environment and harvesting time. In the literature, it was shown that β-sitosterol concentration in olive oil increased in the colder region [73], considering the different latitudes: our study instead focused the study of more concentrated regions at three growing environments, so these differences were not noted. The joint analysis of the fruit drop (less than 10%), detachment index (less than 2) and oil content (higher than 40%) made it possible to define the optimal harvesting time for each location. This period was found to be around the middle of October (between 91 and 98 days after stone hardening) in site A. Instead, in site B, the olive harvest should take place in the period between the end of October and the beginning of November (91–105 days after stone hardening). The optimal harvesting period in site C was considerably later, occurring over a period of about a month, extending from the second half of November to the first half of December (98–128 days after stone hardening). In site A, the optimal harvesting time occurs when the first reddish spots appear on the yellow-green surface (with a ripening index of around 2). In the other two sites, however, the harvest can begin before the start of veraison, when the olives are still yellow-green. In all sites, in the optimal harvesting time, the oil content in the mesocarp is around 45%.

5. Conclusions

The study deepened the knowledge on the genotype–environment relationships in the Carolea olive cultivar. The climatic differences, due to altitude, have significantly changed the growth and ripening of fruits and the quality of the obtained oils. In particular, the decrease in temperature with the increase in altitude has led to a postponement of some of the main phases of the fruiting cycle, with an extension of the period of the growth and ripening of fruits. The veraison started in the second ten days of October in site A, between the end of October and the beginning of November in site B and in the first ten days of December in site C.
This behavior inevitably influenced the time position of the optimal harvesting time. The results showed a postponement and an extension of the optimal harvesting period with the increase in altitude, and a corresponding decrease in temperature indexes and increase in rainfall. Moreover, this study evidenced a good quality of olive oil produced at cooler growing environments. This knowledge can be very useful for improving and rationalizing the agronomic management of olive orchards and enhancing the qualitative characteristics of the oil. These results are interesting for olive growers to also valorize other areas located at a higher level, even if they are earmarked for other crops. The obtained results also confirm the high edaphic plasticity of the Carolea olive cultivar, which is capable of guarantee a high productive performance in very different soil and climatic contexts.

Supplementary Materials

The following are available online at https://www.mdpi.com/2077-0472/11/2/147/s1, Figure S1: Flowering periods in the three years (2013, 2014 and 2015) in the three olive groves sites (site A, site B and site C), Figure S2: Relationship between detachment force and fruit drop, Table S1: Multivariate analysis of qualitative characteristics of oil olive extracted from drupes produced from olive trees grown in three different sites.

Author Contributions

Conceptualization, R.M., A.P. and M.P.; data curation, R.M., A.P. and A.D.B.; formal analysis, R.M. and A.D.B.; funding acquisition, M.P.; methodology, R.M. and A.D.B.; resources, M.P.; supervision, R.M., A.P. and M.P. All authors have read and agreed to the published version of the manuscript.

Funding

This research was funded by MIUR (Ministry of Education, University and Research), grant number PON 01 01545, ‘‘Sistemi tecnologici avanzati e processi integrati nella filiera olivicola per la valorizzazione dei prodotti e dei sottoprodotti, lo sviluppo di nuovi settori per la creazione di sistemi produttivi ecocompatibili” (OLIO-PIU’)”.

Institutional Review Board Statement

Not applicable.

Informed Consent Statement

Not applicable.

Data Availability Statement

The data presented in this study are available on request from the corresponding author.

Acknowledgments

The authors appreciate Antonino Tramontana and Simone Santacaterina for assistance in conducting olive oil extraction.

Conflicts of Interest

The authors declare no conflict of interest.

References

  1. Mafrica, R.; Piscopo, A.; De Bruno, A.; Pellegrino, P.; Zappia, A.; Zappia, R.; Poiana, M. Integrated study of qualitative olive and oil production from three important varieties grown in Calabria (Southern Italy). Eur. J. Lipid Sci. Technol. 2019, 121, 190014. [Google Scholar] [CrossRef]
  2. Yorulmaz, A.; Erinç, H.; Tekin, A. Changes in Olive and Olive Oil Characteristics During Maturation. J. Am. Oil Chem. Soc. 2013, 90, 647–658. [Google Scholar] [CrossRef]
  3. Beltrán, G.; del Río, C.; Sánchez, S.; Martínez, L. Seasonal changes in olive fruit characteristics and oil accumulation during ripening process. J. Sci. Food Agric. 2004, 84, 1783–1790. [Google Scholar] [CrossRef]
  4. Roshani, M.; Sahari, M.A.; Amirkaveei, S.; Ardabili, A.S. Effect of Edaphoclimatic Region and Fruit Ripening Stage on Fatty Acid Profile of Tree Olive Oil Cultivars. Curr. Nutr. Food Sci. 2016, 12, 212–219. [Google Scholar] [CrossRef]
  5. Di Vaio, C.; Nocerino, S.; Paduano, A.; Sacchi, R. Influence of some environmental factors on drupe maturation and olive oil composition. J. Sci. Food Agric. 2013, 93, 1134–1139. [Google Scholar] [CrossRef]
  6. Issaoui, M.; Flamini, G.; Brahmi, F.; Dabbou, S.; Hassine, K.B.; Taamali, A.; Chehab, H.; Ellouz, M.; Zarrouk, M.; Hammami, M. Effect of the growing area conditions on differentiation between Chemlali and Chétoui olive oils. Food Chem. 2010, 119, 220–225. [Google Scholar] [CrossRef]
  7. Toker, C.; Aksoyb, U.; Ertaş, H. The effect of fruit ripening, altitude and harvest year on volatile compounds of virgin olive oil obtained from the Ayvalık variety. Flavour Fragr. J. 2016, 31, 195–205. [Google Scholar] [CrossRef]
  8. Mousa, Y.M.; Gerasopoulos, D.; Metzidakis, I.; Kiritsakis, A. Effect of altitude on fruit and oil quality characteristics of‘Mastoides’ olives. J. Sci. Food Agric. 1996, 71, 345–350. [Google Scholar] [CrossRef]
  9. Motilva, M.J.; Tovar, M.J.; Romero, M.P.; Alegre, S.; Girona, J. Influence of Regulated Irrigation Strategies Applied to Olive Trees (Arbequina cultivar) on Oil Yield and Composition during the Fruit Ripening Period. J. Sci. Food Agric. 2000, 80, 2037–2043. [Google Scholar] [CrossRef]
  10. Fernandes-Silva, A.; Gouveia, J.B.; Vasconcelos, P.; Ferreira, T.C.; Villalobos, F.J. Effect of different irrigation regimes on the quality attributes of monovarietal virgin olive oil from cv. “Cobrançosa”. Grasas Y Aceites 2013, 64, 41–49. [Google Scholar] [CrossRef] [Green Version]
  11. Servili, M.; Esposto, S.; Lodolini, E.M.; Selvaggini, R.; Taticchi, A.; Urbani, S.; Montedoro, G.; Serravalle, M.; Gucci, R. Irrigation effects on quality, phenolic composition, and selected volatiles of virgin olive oils cv. Leccino. J. Agric. Food Chem. 2007, 55, 6609–6618. [Google Scholar] [CrossRef] [PubMed]
  12. Stefanoudaki, E.; Williams, M.; Chartzoulakis, K.; Harwood, J. Effect of Irrigation on Quality Attributes of Olive Oil. J. Agric. Food Chem. 2009, 57, 7048–7055. [Google Scholar] [CrossRef]
  13. Ismail, A.S.; Stavroulakis, G.; Metzidakis, J. Effect of irrigation on the quality characteristics of organic olive oil. Acta Hortic. 1999, 474, 687–690. [Google Scholar] [CrossRef]
  14. Marra, F.P.; Caruso, T.; Costa, F.; Di Vaio, C.; Mafrica, R.; Marchese, A. Genetic relationships, structure and parentage simulation among the olive tree (Olea europaea L. subsp. europaea) cultivated in Southern Italy revealed by SSR markers. Tree Genet. Genomes 2013, 9, 961–973. [Google Scholar] [CrossRef]
  15. Marra, F.P.; Marchese, A.; Campisi, G.; Guzzetta, G.; Caruso, T.; Mafrica, R.; Pangallo, S. Intra-cultivar diversity in Southern Italy olive cultivars depicted by morphological traits and ssr markers. Acta Hortic. 2014, 1057, 571–576. [Google Scholar] [CrossRef] [Green Version]
  16. Piscopo, A.; De Bruno, A.; Zappia, A.; Ventre, C.; Poiana, M. Characterization of monovarietal olive oils obtained from mills of Calabria region (Southern Italy). Food Chem. 2016, 213, 313–318. [Google Scholar] [CrossRef] [PubMed] [Green Version]
  17. Piscopo, A.; De Bruno, A.; Zappia, A.; Gioffrè, G.; Grillone, N.; Mafrica, R.; Poiana, M. Effect of olive storage temperature on the quality of Carolea and Ottobratica oils. Emir. J. Food Agric. 2018, 30, 563–572. [Google Scholar] [CrossRef]
  18. Piscopo, A.; Zappia, A.; De Bruno, A.; Poiana, M. Effect of the Harvesting Time on the Quality of Olive Oils Produced in Calabria. Eur. J. Lipid Sci. Technol. 2018, 120, 1700304. [Google Scholar] [CrossRef]
  19. De Bruno, A.; Romeo, R.; Fedele, F.L.; Sicari, A.; Piscopo, A.; Poiana, M. Antioxidant activity shown by olive pomace extracts. J. Environ. Sci. Health Part B 2018. [Google Scholar] [CrossRef]
  20. Bonofiglio, T.; Orlandi, F.; Sgromo, C.; Romano, B.; Fornaciari, M. Influence of temperature and rainfall on timing of olive (Olea europaea) flowering in southern Italy. N. Z. J. Crop Hortic. Sci. 2008, 36, 59–69. [Google Scholar] [CrossRef]
  21. Meier, U. BBCH-Monograph. Growth Stages of Plants—Entwicklungsstadien von Pflanzen—Estadios de las Plantas—Développement des Plantes; Blackwell Wissenschafts-Verlag: Berlin, Germany, 1997; pp. 94–95. [Google Scholar]
  22. Sanz-Cortés, F.; Martínez-Calvo, J.; Badenes, M.L.; Bleiholder, H.; Hack, H.; Llacer, G.; Meier, U. Phenological growth stages of olive trees (Olea europaea). Ann. Appl. Biol. 2002, 140, 151–157. [Google Scholar] [CrossRef]
  23. Uceda, M.; Frias, L. Harvest dates. Evolution of the fruit oil content, oil composition and oil quality. In Proceedings of the “Segundo Seminario Oleicola Internacional” COI, Cordoba, Spain, 6 October 1975; pp. 125–128. [Google Scholar]
  24. European Union Commission. Commission Regulation No. 61/2011 of 24 January 2011. Off. J. Eur. Union 2011, 23, 1–14. [Google Scholar]
  25. European Union Commission. Commission Implementing Regulation No. 348/2013 of 17 December 2013. Off. J. Eur. Union 2013, 338, 31–67. [Google Scholar]
  26. European Union Commission. Commission delegated regulation No 16/2095 of 26 September 2016. Off. J. Eur. Union 2016, 326, 1–6. [Google Scholar]
  27. Baiano, A.; Gambacorta, G.; Terracone, C.; Previtali, M.A.; Lamacchia, C.; La Notte, E. Changes in phenolic content and antioxidant activity of italian extravirgin olive oils during storage. J. Food Sci. 2009, 74, 177–183. [Google Scholar] [CrossRef] [PubMed]
  28. IUPAC. International Union of Pure and Applied Chemistry. Determination of Tocopherol and Tocotrienols in Vegetable Oils and Fats by HPLC: Method 2.432. In Standard Methods for the Analysis of Oils, Fats and Derivatives; Paquot, C., Haufenne, A., Eds.; Blackwell Scientific Publications: Oxford, UK, 1987; pp. 1–7. [Google Scholar]
  29. Minguez-Mosquera, M.I.; Rejano, L.; Gandul, B.; Sanchez, A.H.; Garrido, J. Color-pigment correlation in virgin olive oil. J. Am. Oil Chem. 1991, 68, 332–336. [Google Scholar] [CrossRef]
  30. Miller, N.J.; Rice-Evans, C.; Davies, M.J.; Gopinathan, V.; Milner, A. A novel method for measuring antioxidant capacity and its application to monitoring the antioxidant status in premature neonates. Clin. Sci. 1993, 84, 407–412. [Google Scholar] [CrossRef] [PubMed] [Green Version]
  31. Galán, C.; García-Mozo, H.; Vázquez, L.; Ruiz-Valenzuela, L.; Díaz de la Guardia, C.; Trigo-Pérez, M. Heat requirement for the onset of the Olea europaea L. pollen season in several places of Andalusia region and the effect of the expected future climate change. Int. J. Biometeorol. 2005, 49, 184–188. [Google Scholar] [CrossRef]
  32. Aguilera, F.; Ruiz, L. Study of the floral phenology of Olea europaea L. in Jaén province (SE Spain) and its relation with pollen emission. Aerobiologia 2009, 25, 217–225. [Google Scholar] [CrossRef]
  33. Rojo, J.; Pérez-Badia, R. Effects of topography and crown-exposure on olive tree phenology. Trees 2014, 28, 449–459. [Google Scholar] [CrossRef]
  34. Davi, H.; Gillmann, M.; Ibanez, T.; Cailleret, M.; Bontemps, A.; Fady, B.; Lefèvre, F. Diversity of leaf unfolding dynamics among tree species: New insights from a study along an altitudinal gradient. Agric. For. Meteorol. 2011, 151, 1504–1513. [Google Scholar] [CrossRef]
  35. Jochner, S.C.; Sparks, T.H.; Estrella, N.; Menzel, A. The influence of altitude and urbanization on trends and mean dates in phenology (1980–2009). Int. J. Biometeorol. 2012, 56, 387–394. [Google Scholar] [CrossRef]
  36. Galán, C.; García-Mozo, H.; Carinãnos, P.; Alcázar, P.; Domínguez-Vilches, E. The role of temperature in the onset of the Olea europaea L. pollen season in southwestern Spain. Int. J. Biometeorol. 2001, 45, 8–12. [Google Scholar] [CrossRef]
  37. Orlandi, F.; Fornaciari, M.; Romano, B. The use of phenological data to calculate chilling units in Olea europaea L. inrelation to the onset of reproduction. Int. J. Biometeorol. 2002, 46, 2–8. [Google Scholar] [CrossRef] [PubMed]
  38. Galán, C.; García-Mozo, H.; Vázquez, L.; Ruiz, L.; Díaz de la Guardia, C.; Domínguez-Vilches, E. Modeling olive crop yield in Andalusia, Spain. Agron. J. 2008, 100, 98–104. [Google Scholar] [CrossRef] [Green Version]
  39. Wang, Y.; Li, X.; Dawadi, B.; Eckstein, D.; Liang, E. Phenological variation in height growth and needle unfolding of Smith fir along and altitudinal gradient on the southeastern Tibetan Plateau. Trees 2013, 27, 401–407. [Google Scholar] [CrossRef]
  40. Osborne, C.P.; Chuine, I.; Viner, D.; Woodward, F.I. Olive phenology as a sensitive indicator of future climatic warming in the mediterranean. Plant Cell Environ. 2000, 23, 701–710. [Google Scholar] [CrossRef] [Green Version]
  41. Connor, D.J.; Fereres, E. The physiology of adaptation and yield expression in olive. Hortic. Rev. 2005, 31, 155–229. [Google Scholar] [CrossRef]
  42. Lavee, S. Olive. In Handbook of Fruit Set and Development; Monselise, S.P., Ed.; CRC Press Inc.: Boca Raton, FL, USA, 1986; pp. 261–276. [Google Scholar]
  43. Bollard, E.G. The physiology and nutrition of developing fruits. In The Biochemistry of Fruits and Their Products; Hulme, A.C., Ed.; Academic Press: New York, NY, USA, 1970; Volume 1, pp. 387–425. [Google Scholar]
  44. Rapoport, H.F. Botánica y morfología. In El Cultivo del Olivo; Barranco, D., Fernández-Escobar, R., Rallo, L., Eds.; MundiPrensa: Barcelona, Spain, 1999; pp. 35–60. [Google Scholar]
  45. Rallo, P.; Rapoport, H. Early growth and development of the olive fruit mesocarp. J. Hortic. Sci. Biotechnol. 2001, 76, 408–412. [Google Scholar] [CrossRef]
  46. Manrique, T.; Castro, J.; Pastor, M.; Rapoport, H.F. Mesocarp cell division and expansion in the growth of olive fruits. Acta Hortic. 1999, 474, 301–304. [Google Scholar] [CrossRef]
  47. Rapoport, H.F.; Manrique, T.; Gucci, R. Cell division and expansion in the olive fruit. Acta Hortic. 2004, 636, 461–465. [Google Scholar] [CrossRef]
  48. Hammami, S.B.M.; Manrique, T.; Rapoport, H.F. Cultivar-based fruit size in olive depends on different tissue and cellular processes throughout growth. Sci. Hortic. 2011, 130, 445–451. [Google Scholar] [CrossRef]
  49. Ben Mimoun, M.; DeJong, T.M. Using the relation between growing degree hours and harvest date to estimate run-times for peach: A tree growth and yield simulation model. Acta Hortic. 1999, 499, 107–114. [Google Scholar] [CrossRef]
  50. Lopez, G.; DeJong, T.M. Spring temperatures have a major effect on early stages of peach fruit growth. J. Hortic. Sci. Biotechnol. 2007, 82, 507–512. [Google Scholar] [CrossRef]
  51. Day, K.; Lopez, G.; DeJong, T.M. Using growing degree hours accumulated 30 d after bloom to predict peach and nectarine harvest date. Acta Hortic. 2008, 803, 163–166. [Google Scholar] [CrossRef] [Green Version]
  52. Gomez-Jimenez, M.C.; Paredes, M.A.; Gallardo, M.; Fernandez-Garcia, N.; Olmos, E.; Sanchez-Calle, I.M. Tissue-specific expression of olive S-adenosyl methionine decarboxylase and spermidine synthase genes and polyamine metabolism during flower opening and early fruit development. Planta 2010, 232, 629–647. [Google Scholar] [CrossRef]
  53. Gomez-Jimenez, M.C.; Paredes, M.A.; Gallardo, M.; Sanchez-Calle, I.M. Mature fruit abscission is associated with upregulation of polyamine metabolism in the olive abscission zone. J. Plant Physiol. 2010, 167, 1432–1441. [Google Scholar] [CrossRef]
  54. Parra-Lobato, M.C.; Gomez-Jimenez, M.C. Polyamine-induced modulation of genes involved in ethylene biosynthesis and signalling pathways and nitric oxide production during olive mature fruit abscission. J. Exp. Bot. 2011, 62, 4447–4465. [Google Scholar] [CrossRef] [PubMed] [Green Version]
  55. Gil-Amado, J.A.; Gomez-Jimenez, M.C. Regulation of polyamine metabolism and biosynthetic gene expression during olive mature-fruit abscission. Planta 2012, 235, 1221–1237. [Google Scholar] [CrossRef]
  56. Tombesi, A. Physiological and mechanical advances in olive harvesting. Acta Hortic. 1990, 286, 399–412. [Google Scholar] [CrossRef]
  57. Mousavi, S.; de la Rosa, R.; Moukhli, A.; El Riachy, M.; Mariotti, R.; Torres, M.; Pierantozzi, P.; Stanzione, V.; Mastio, V.; Zaher, H.; et al. Plasticity of fruit and oil traits in olive among different environments. Sci. Rep. 2019, 9, 16968. [Google Scholar] [CrossRef] [Green Version]
  58. Osman, M.; Metzidakis, I.; Gerasopoulos, D.; Kiritsakis, A. Qualitative changes in olive oil of fruits collected from trees grown at two altitudes. Riv. Ital. Sostanze Gr. 1994, 71, 187–194. [Google Scholar]
  59. Sicari, V.; Giuffrè, A.M.; Piscopo, A.; Poiana, M. Effect of ‘‘Ottobratica” variety ripening stage on the phenolic profile of the obtained olive oil. Riv. Ital. Sostanze Gr. 2009, 86, 215–219. [Google Scholar]
  60. Giuffrè, A.M.; Piscopo, A.; Sicari, V.; Poiana, M. The effects of harvesting on phenolic compounds and fatty acids content in virgin olive oil (cv. Roggianella). Riv. Ital. Sostanze Gr. 2010, 87, 14–23. [Google Scholar]
  61. Dag, A.; Kerem, Z.; Yogev, N.; Zipori, I.; Lavee, S.; Ben-David, E. Influence of time of harvest and maturity index on olive oil yield and quality. Sci. Hortic. 2011, 127, 358–366. [Google Scholar] [CrossRef]
  62. Yousfi, K.; Cert, R.M.; García, J.M. Changes in quality and phenolic compounds of virgin olive oils during objectively described fruit maturation. Eur. Food Res. Technol. 2006, 223, 117–124. [Google Scholar] [CrossRef]
  63. Piscopo, A.; De Bruno, A.; Zappia, A.; Ventre, C.; Poiana, M. Data on some qualitative parameters of Carolea olive oils obtained in different areas of Calabria (Southern Italy). Data Brief 2016, 9, 78–80. [Google Scholar] [CrossRef] [PubMed] [Green Version]
  64. Franco, M.N.; Galeano-Díaz, T.; Sánchez, J.; De Miguel, C.; Martín-Vertedora, D. Antioxidant capacity of the phenolic fraction and its effect on the oxidative stability of olive oil varieties grown in the southwest of Spain. Grasas Y Aceites 2014, 65, e004. [Google Scholar] [CrossRef] [Green Version]
  65. Borges, T.H.; López, L.C.; Pereira, J.A.; Cabrera–Vique, C.; Seiquer, I. Comparative analysis of minor bioactive constituents (CoQ10, tocopherols and phenolic compounds) in Arbequina extra virgin olive oils from Brazil and Spain. J. Food Compos. Anal. 2017, 63, 47–54. [Google Scholar] [CrossRef]
  66. Rodney, J.M.; Ayton, J.; Graham, K.J. The Influence of Growing Region, Cultivar and Harvest Timing on the Diversity of Australian Olive Oil. J. Am. Oil Chem. Soc. 2010, 87, 877–884. [Google Scholar] [CrossRef]
  67. Martakos, I.; Kostakis, M.; Dasenaki, M.; Pentogennis, M.; Thomaidis, N. Simultaneous Determination of Pigments, Tocopherols, and Squalene in Greek Olive Oils: A Study of the Influence of Cultivation and Oil-Production Parameters. Foods 2020, 9, 31. [Google Scholar] [CrossRef] [PubMed] [Green Version]
  68. Kosma, I.; Badeka, A.; Vatavali, K.; Kontakos, S.; Kontominas, M. Differentiation of Greek extra virgin olive oils according to cultivar based on volatile compound analysis and fatty acid composition. Eur. J. Lipid Sci. Technol. 2016, 118, 849–861. [Google Scholar] [CrossRef]
  69. Longobardi, F.; Ventrella, A.; Casiello, G.; Sacco, D.; Tasioula-Margari, M.; Kiritsakis, A.K.; Kontominas, M.G. Characterisation of the geographical origin of Western Greek virgin olive oils based on instrumental and multivariate statistical analysis. Food Chem. 2012, 133, 169–175. [Google Scholar] [CrossRef]
  70. Rondanini, D.P.; Castro, D.N.; Searles, P.S.; Rousseaux, M.C. Contrasting patterns of fatty acid composition and oil accumulation during fruit growth in several olive varieties and locations in a non-Mediterranean region. Eur. J. Agron. 2014, 52 Pt B, 237–246. [Google Scholar] [CrossRef]
  71. Nergiz, C.; Engez, Y. Compositional variation of olive fruit during ripening. Food Chem. 2000, 69, 55–59. [Google Scholar] [CrossRef]
  72. Paz, A.M.; Beltran, G.; Ortega, D.; Fernandez, A.; Jimenez, A.; Uceda, M. Characterisation of virgin olive oil of Italian olive cultivars: Frantoio and Leccino, grown in Andalusia. Food Chem. 2005, 89, 387–391. [Google Scholar] [CrossRef]
  73. Piravi-Vanak, Z.; Ghasemi, J.B.; Ghavami, M.; Ezzatpanah, H.; Zolfonoun, E. The Influence of Growing Region on Fatty Acids and Sterol Composition of Iranian Olive Oils by Unsupervised Clustering Methods. J. Am. Oil Chem. Soc. 2012, 89, 371–378. [Google Scholar] [CrossRef]
Figure 1. Location, altitude, longitude and latitude of the three study sites in Catanzaro province (Southern Italy).
Agriculture 11 00147 g001
Figure 2. Mean monthly temperatures and changes in rainfall (left figures) and Total Growing Degree Days (right figures) from January to December in the three years (2013, 2014 and 2015) and in the three olive grove sites (site A, site B and site C).
Agriculture 11 00147 g002
Figure 3. Seasonal changes in fruit fresh weight (A), fruit absolute growth rate (B), flesh/stone ratio (C) and flesh moisture (D) during development and ripening process of Carolea olive cultivar grown at three different sites. Data are mean ± standard error (years 2013, 2014 and 2015).
Agriculture 11 00147 g003
Figure 4. Seasonal changes in fruit drop (A), detachment index (B), ripening index (C). flesh firmness (D), flesh oil content (E) and flesh total polyphenols content (F) in drupes of “Carolea” trees grown at three different sites. Data are mean ± standard error (years 2013, 2014 and 2015).
Agriculture 11 00147 g004aAgriculture 11 00147 g004b
Table 1. Qualitative traits of olive oil extracted from drupes produced from trees grown in three sites (A, B, and C).
SiteHarvesting Month Parameters Site Harvesting Month Time
OctoberNovemberDecemberOctoberNovemberDecember
FA
(oleic acid %)
A0.39 Ab0.50 ab1.21 aTPC (mg/kg)A449.36 Aa308.07 b340.82 Bb
B0.33 AB0.420.46B457.90 Aa318.63 b398.27 Aab
C0.15 Bb0.59 ab1.05 aC392.62 Ba180.83 b226.23 Cb
PV (mEq O2/kg)A3.433.957.29TT
(mg/kg)
A269.55 Aa209.04 Ab185.45 b
B5.435.333.51B195.27 Ba158.82 ABb170.81 ab
C2.65 b7.20 a6.46 aC202.87 Ba129.04 Bb157.00 ab
K232A1.72 Ba1.60 b1.78 AaTCL (mg/kg)A8.407.233.72
B2.06 Aa1.86 b1.66 BcB8.714.996.44
C1.63 B1.861.70 BC14.125.845.42
K270A0.11 Bb0.09 b0.14 aTCA (mg/kg)A5.185.082.75
B0.14 A0.170.13B5.853.384.29
C0.10 Cb0.16 a0.14 abC6.514.004.91
Wax esters (mg/kg)A28.2133.8045.31ABTS assay (% inhibition)A32.12 B27.3032.44
B25.2822.3230.21B56.09 A26.3644.46
C19.18 b23.64 ab40.46 aC41.42 AB35.3134.15
∑FAEE (mg/kg)A2.5616.9213.27DPPH assay (% inhibition)A26.0416.9935.69
B2.3012.554.68B49.3638.5057.01
C1.8524.0611.73C48.5337.0533.26
Oxidative stability (h)A13.89 10.45 B10.46
B15.30 b16.90 Aab21.04 a
C18.60 a6.18 Cb7.74 b
Data are mean (years 2013, 2014 and 2015). Capital and small letters indicate significant differences on the row and in the line for Tukey post-hoc test.
Table 2. Fatty acid composition of olive oils extracted from drupes produced from trees grown in three sites (A, B, and C).
SamplesHarvesting Month Harvesting Month
OctoberNovemberDecember OctoberNovemberDecember
C16:0 (%)A14.77 AB14.4114.21 AC18:2 (%)A5.425.906.23 A
B14.91 Aa13.10 b12.94 BbB6.15 b7.61 a5.79 ABb
C13.18 B12.4711.87 CC5.435.995.58 B
C16:1 (%)A1.351.451.57 AC18:3 (%)A0.490.480.48
B1.701.341.34 BB0.460.460.41
C1.421.451.36 ABC0.430.420.45
C17:0 (%)A0.19 A0.190.19 ASFAA18.37 A17.9317.69 A
B0.16 B0.170.19 AB18.19 Aa16.28 b16.18 Bb
C0.13 C0.120.14 BC16.11 B15.5014.87 C
C17:1 (%)A0.35 A0.360.37MUFAA75.7075.6875.60 C
B0.35 A0.350.38B75.19 c75.64 b77.61 Ba
C0.28 B0.300.31C78.0378.0479.09 A
C18:0 (%)A2.732.662.66PUFAA5.916.386.70
B2.462.412.46B6.62 B8.07 A6.20 B
C2.212.282.25C5.866.456.03
C18:1 (%)A73.7173.6073.40 CC18:1/C18:2A13.7212.4911.78 B
B72.84 c73.67 b75.62 BaB11.84 a9.79 b13.06 ABa
C76.0375.9977.11 AC14.41 ± 3.2813.0413.88 A
Data are mean (years 2013, 2014 and 2015). Capital and small letters indicate significant differences in the row and in the line for Tukey post-hoc test.
Table 3. Sterol composition of olive oils produced in the three locations (A, B, and C) at October (O), November (N) and December (D).
(%)SamplesOND SamplesOND
Cholesterol (%)A0.080.070.08Sitostanol (%)A0.861.051.06
B0.070.110.08B1.061.131.05
C0.080.090.09C1.031.060.94
24-Methylene cholesterol (%)A0.100.100.10D5-Avenastenol (%)A7.045.996.01
B0.100.120.10B9.288.175.98
C0.100.100.12C5.856.727.72
Campesterol (%)A1.772.221.87 BD5-24-Stigmastadienol (%)A0.770.850.86
B1.772.342.64 AB0.890.770.85
C2.512.142.45 AC0.830.860.78
Campestanol (%)A0.130.150.15D7-Stigmastenol (%)A0.180.160.15 AB
B0.180.180.15B0.150.200.17 A
C0.150.150.15C0.160.090.09 B
Stigmasterol (%)A0.660.901.00 A0.550.500.41
B0.530.530.74D7-Avenasterol (%)B0.580.660.53
C0.710.950.92 C0.570.490.50
Campesterol/
Stigmasterol
A3.072.481.87Total β-Sitosterol (%)A96.5395.9096.23
B3.314.763.58B96.6295.8695.57
C3.550.952.73C95.7295.9995.70
Clerosterol (%)A0.930.900.90Total sterols (mg/kg)A152717381582
B0.840.910.90B134813201679
C0.880.960.91C177615531630
β-sitosterol (%)A86.9487.1187.40 A
B84.5584.8886.79 AB
C87.1486.3985.35 B
Data are mean (years 2013, 2014 and 2015). Capital and small letters indicate significant differences in the row and in the line for Tukey post-hoc test.
Publisher’s Note: MDPI stays neutral with regard to jurisdictional claims in published maps and institutional affiliations.

