Article

Foodshed, Agricultural Diversification and Self-Sufficiency Assessment: Beyond the Isotropic Circle Foodshed—A Case Study from Avignon (France)

by
José Luis Vicente-Vicente
1,*,
Esther Sanz-Sanz
1,2,
Claude Napoléone
2,
Michel Moulery
2 and
Annette Piorr
1
1
Leibniz Centre for Agricultural Landscape Research (ZALF), 15374 Müncheberg, Germany
2
UR Ecodeveloppement, French National Institute for Reasearch on Agriculture, Food and Environment (INRAE), 84914 Avignon, France
*
Author to whom correspondence should be addressed.
Agriculture 2021, 11(2), 143; https://doi.org/10.3390/agriculture11020143
Submission received: 21 January 2021 / Accepted: 5 February 2021 / Published: 10 February 2021
(This article belongs to the Special Issue Agricultural Diversification)

Abstract

:
The regionalization of food systems in order to shorten supply chains and develop local agriculture to feed city regions presents particular challenges for food planning and policy. The existing foodshed approaches enable one to assess the theoretical capacity of the food self-sufficiency of a specific region, but they struggle to consider the diversity of existing crops in a way that could be usable to inform decisions and support urban food strategies. Most studies are based on the definition of the area required to meet local consumption, obtaining a map represented as an isotropic circle around the city, without considering the site-specific pedoclimatic, geographical, and socioeconomic conditions which are essential for the development of local food supply chains. In this study, we propose a first stage to fill this gap by combining the Metropolitan Foodshed and Self-sufficiency Scenario model, which already considers regional yields and specific land use covers, with spatially-explicit data on the cropping patterns, soil and topography. We use the available Europe-wide data and apply the methodology in the city region of Avignon (France), initially considering a foodshed with a radius of 30 km. Our results show that even though a theoretically-high potential self-sufficiency could be achieved for all of the food commodities consumed (>80%), when the specific pedological conditions of the area are considered, this could be suitable only for domestic plant-based products, whereas an expansion of the initial foodshed to a radius of 100 km was required for animal products to provide >70% self-sufficiency. We conclude that it is necessary to shift the analysis from the size assessment to the commodity-group–specific spatial configuration of the foodshed based on biophysical and socioeconomic features, and discuss avenues for further research to enable the development of a foodshed assessment as a complex of complementary pieces, i.e., the ‘foodshed archipelago’.

Graphical Abstract

1. Introduction

A lack of confidence in conventional market-based agriculture has arisen since the 1990s [1], together with a fear of long-distance food supply disruptions, emphasized by crises such as the covid-19 pandemic [2,3]. Feeding the city on sustainable and healthy agriculture became a local policy concern [4,5,6], and proximity is an effective way to enhance the confidence. Nevertheless, regional self-sufficiency has not been a focus of policy decision-making until recently [7,8]. In other words, social awareness about sustainable regional food security requests an increase in regional—or domestic—food self-sufficiency levels [6,9,10,11,12,13,14], where dietary patterns, consumer behaviors, and diversified farming play an important role [5,15]. In addition to implementing farming-related concepts, such as ecological intensification, the challenge is to enhance the efficiency of food chains, building upon proximity in all of the diversity of emerging concepts, and linking local agricultural supply to the urban final demand [10]. There is no consensus regarding a definition of ‘local’ and ‘regional food systems’ in terms of the distance between production and consumption, and the concept remains an elision implicitly contrasted to the ‘global’ [2]. Furthermore, the region is a social construct shaped by networks and connectivity, in which the formal territorial jurisdictional functions and capacities intersect with contingent interests [16]. Inspired by the relational approach of Clancy and Ruhf [17], the concept of a ‘regional food system’ is considered in this article as the system in which as much food as possible is produced, processed, distributed and purchased to meet the population’s demands within a particular meaningful geographical area. Some existing methods analyze the main characteristics and drivers of regional food systems in a specific context. On the one hand, qualitative methods, such as socio-empirical surveys, are able to finely illustrate the stakeholders’ behaviors [18]. On the other hand, quantitative food assessments can give an overview of the status of the food supply and demand [19,20,21,22,23,24,25], whereas other methodologies are focused on the current spatial distribution of crops and land use change dynamics (e.g., in urban areas) [26,27].
Specifically, quantitative foodshed approaches can assess the capacity or flows, or both approaches at the same time [28]. In the capacity assessments, to which the majority of the studies belong, the theoretical food land footprint and the potential self-sufficiency are evaluated by considering the population, current dietary patterns, farmland available, land use cover, and regional yields (e.g., the Metropolitan Foodshed and Self-sufficiency Scenario: MFSS [29]). Such an approach is very valuable to raise the urban residents’ awareness of the spatial impact of their current food diet by highlighting theoretical changes in the extension of the land footprint depending on different scenarios (e.g., the change in the land footprint if one shifts to a more plant-based diet, or from a conventional to organic food diet) [30,31] or to assess the role of public procurement in food self-sufficiency [32]. As foodshed models use data on food consumption and production, and take into account the land cover, the result is the achievement of a theoretical self-sufficiency level for all food commodities, or at least for some of them. While the models addressing all food commodities do not consider the real land allocation to specific crops, but rather only the type of land cover and yield level [29], others focus on specific crops but are able to allocate them [33,34]. The second type of foodshed approaches, the ones assessing the flows [22,23,35], are especially valuable to the study of the distribution networks, as they place consumers and producers. Finally, the hybrid approaches combine the assessments of the capacity and the flows (e.g., [21,36,37]) and, thus, are aimed at comparing the potential food self-sufficiency with the current levels; therefore, they assess the dependencies on foreign food sources, the vulnerabilities of the food system, and the agricultural environmental impacts of the food system’s relocalization [28]. The vast majority of the foodshed assessments are developed at a regional level, although some global-scale studies and models have recently appeared (e.g., [38,39]).
However, in order to enforce a local food policy responding to the willingness to establish regional food proximity, empirical evidence on the food self-sufficiency capacity is required, which takes into account the local agronomic heterogeneity of soils as well as various farming systems and marketing modes. In that way, public action can be located where it is most likely to be effective. Therefore, a foodshed is not a standard concept that could be applied to different cases in the same way; rather, different biophysical and socioeconomic conditions should be considered. Soil fertility features, for instance, are usually a key determinant defining the kind and intensity of the agricultural production at a specific location. They are very often not evenly distributed around the urban area in a gradient, as the theoretical concept by von Thünen would suggest, where the type of agriculture is determined by the distance to the city center [29]. By contrast, the spatial distribution of agricultural production responds to the biophysical constraints and the particular history of each place in terms of its urbanization, development of the agricultural sector, organization of activities (including agricultural sectors), and environmental protection [40,41]. Furthermore, the land use is influenced by farm structures and plot sizes, and thus different land covers coexist, especially in the surroundings of urban areas, while other land uses (e.g., extensive livestock farming) only take place in specific areas under suitable biophysical conditions. However, so far, the majority of regional foodshed assessments have been developed in an isotropic way, by considering administrative boundaries and biophysical constraints in a second step (notably, for the availability of monitoring data in high-density and identical quality, e.g., population data). Indeed, foodsheds are usually defined by a radius around the city (i.e., centroid), and are therefore represented as circles [28,29,30,38]. Accordingly, the foodshed concept represented by just one circle around the city must be reconsidered in order to consider the landscape heterogeneity, and furthermore, to include societal demands. Therefore, we modified the traditional foodshed concept in this study to address these limitations, and applied it to a specific Mediterranean city region, the area of Avignon (France). This specific area is surrounded by high-fertility soils dedicated mainly to commercial agriculture (vegetable, fruit trees and vineyards), and it has a high heterogeneous geomorphology as the distance from the city increases, where soils dedicated to extensive livestock farming appear.
The overall goal of this study is to develop a hybrid foodshed assessment aimed at evaluating the potential and current self-sufficiency of a proposed foodshed. The specific objectives of the study to achieve this end are threefold: (i) to propose and assess a foodshed with a radius of 30 km for the city region of Avignon, which could potentially provide a high degree of self-sufficiency; (ii) to assess the role of agricultural and livestock diversification in increasing the current self-sufficiency within the initial foodshed with a radius of 30 km; and (iii) to propose and discuss the expansion of the initial foodshed considering the landscape heterogeneity and anisotropy, in order to develop a more realistic scenario in terms of achieving a high degree of food self-sufficiency.

2. Materials and Methods
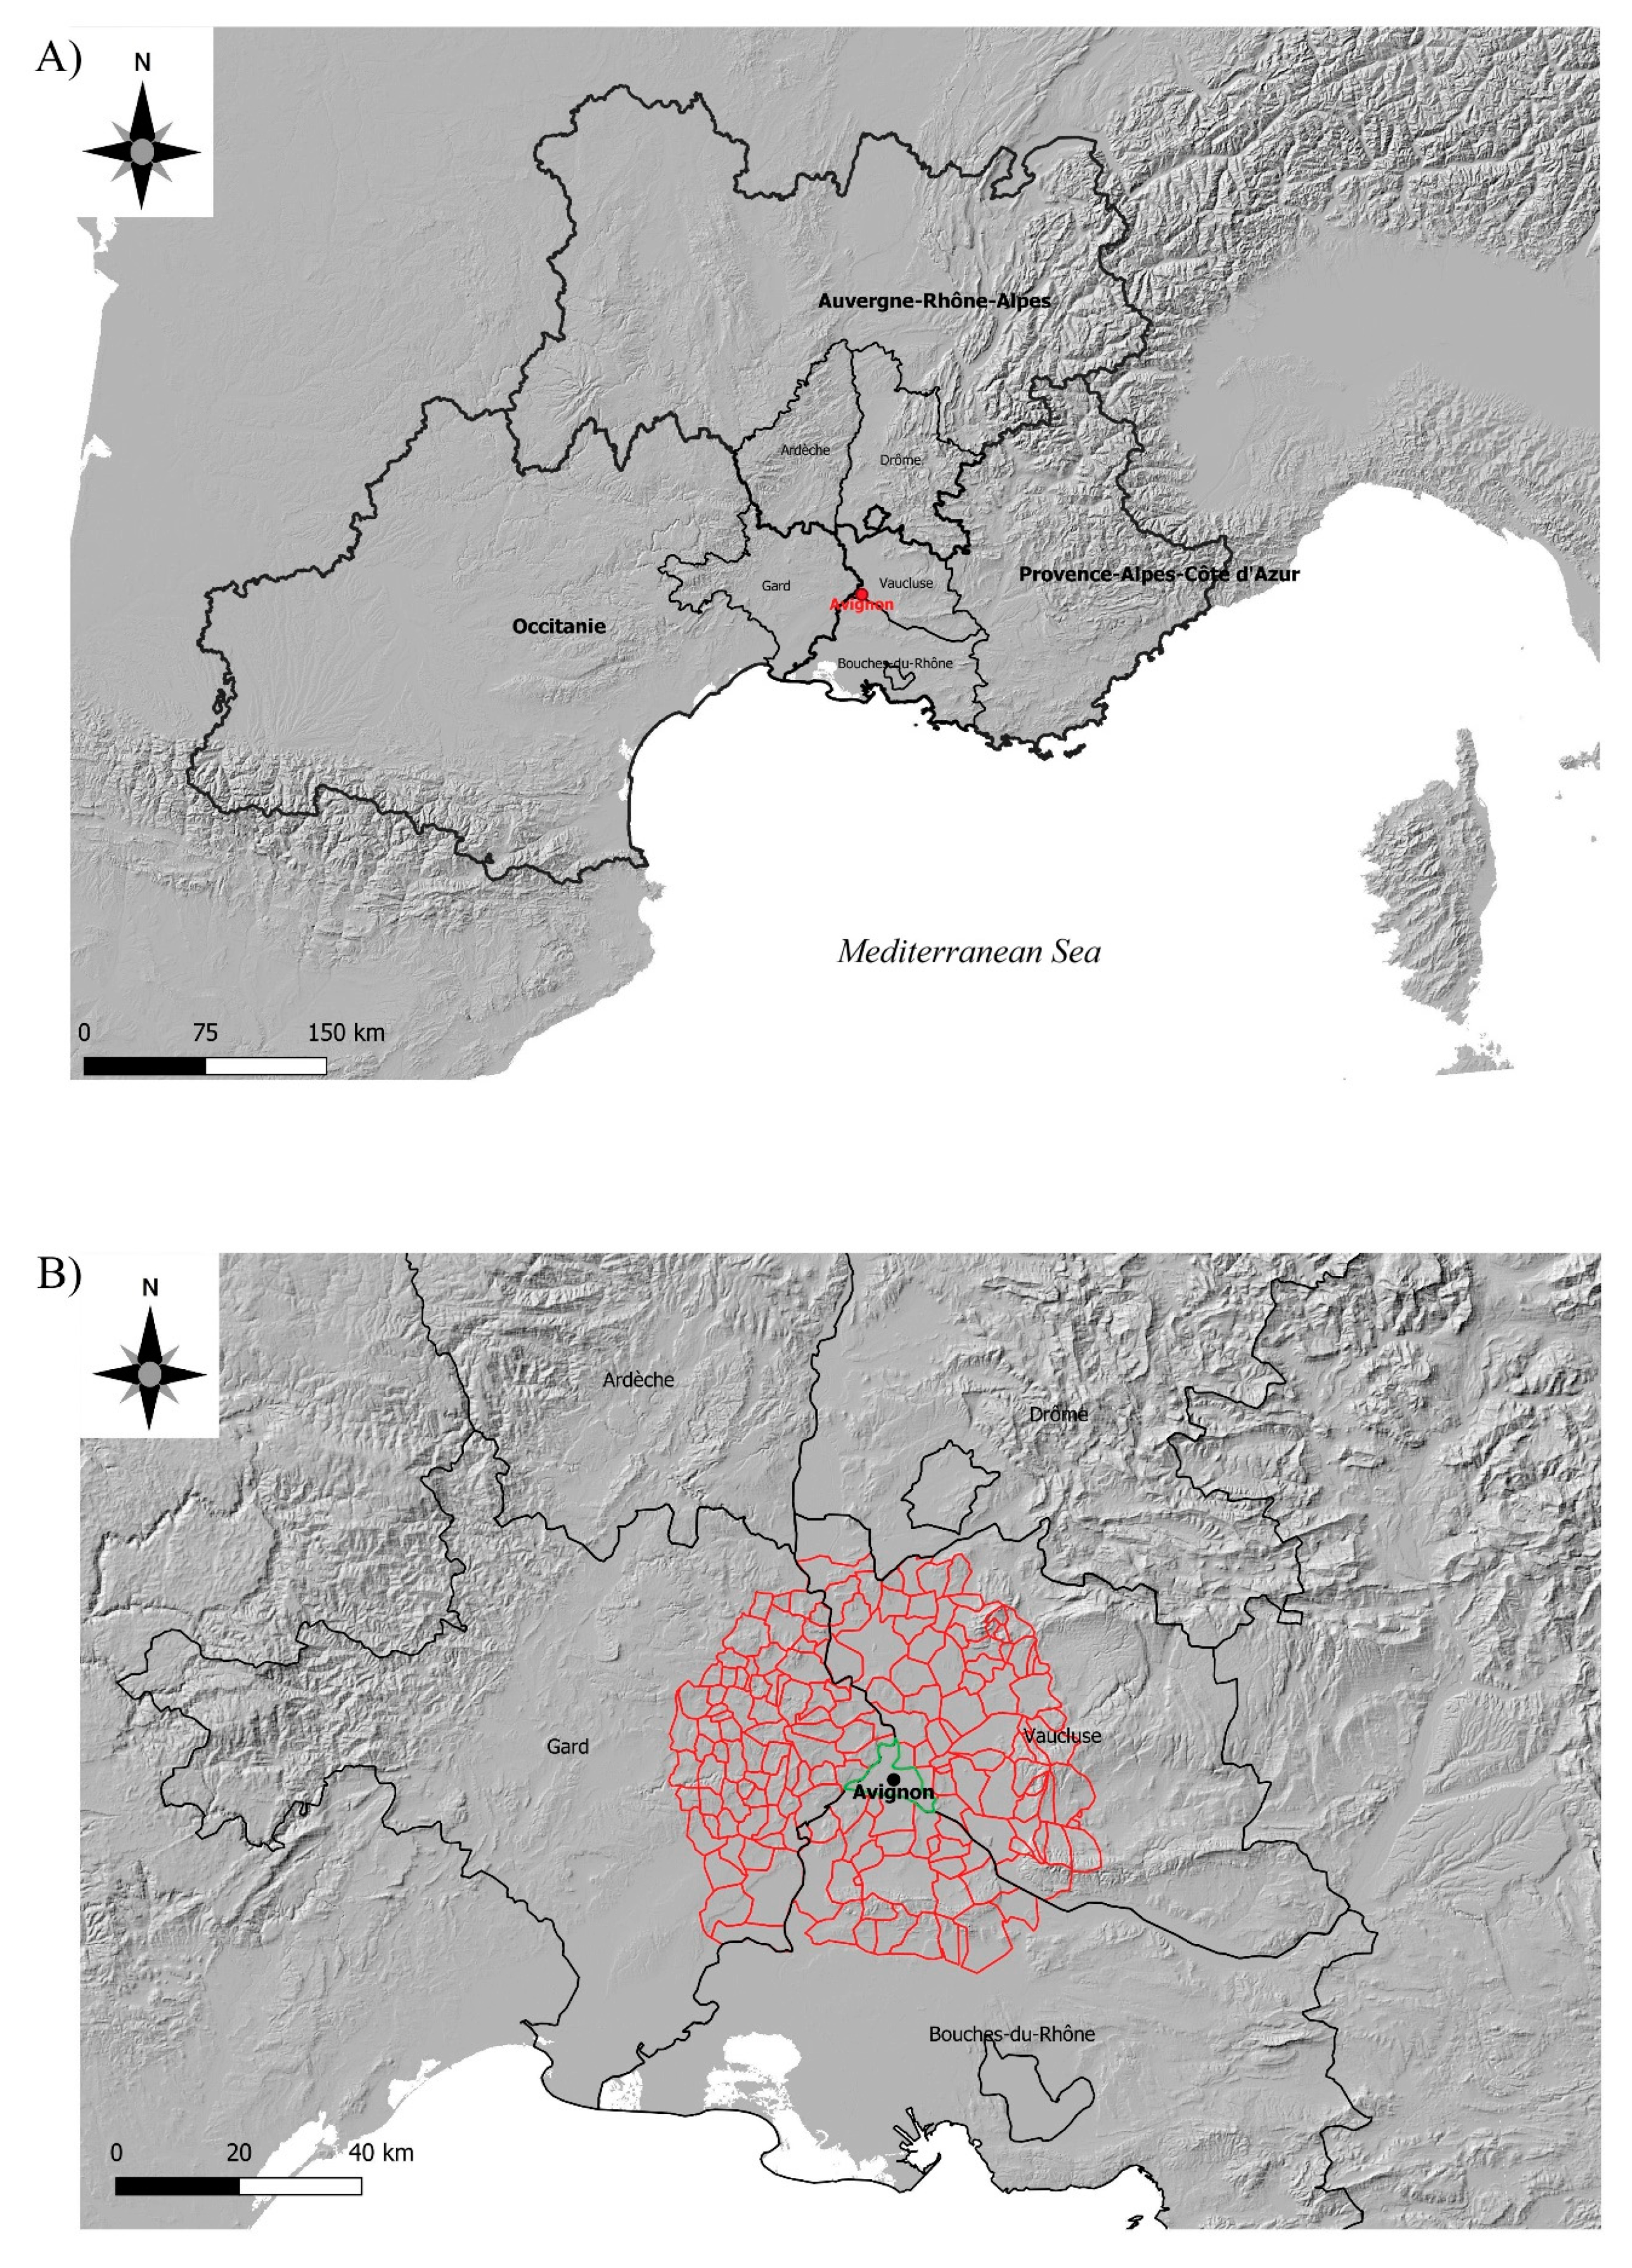
2.1. Study Aea

We first selected a foodshed with a radius of 30 km around Avignon. Thirty kilometers is a nonnormative distance set by the French Senate to define the maximum spatial distance between the site of production and the point of sale for fresh fruit and vegetable short circuits. The initial foodshed selected, formed by a total of 171 communes (i.e., municipalities), comprises two different administrative regions and three different departments (similar to counties) in South-East France: Bouches-du-Rhône and Vaucluse in the region of Provence-Alpes-Côte d’Azur, and Gard in the region of Occitanie (Figure 1A; Tables S1–S3 in the Supplementary Material). Furthermore, the foodshed is close to the administrative region of Auvergne-Rhône-Alpes, particularly the two southern departments, Ardèche and Drôme. The municipality of Avignon is located within the Vaucluse department (Figure 1B).
The area is relatively flat, typically between 0 and 400 m, and is crossed by the Rhône River from north to south. However, the altitudes become higher towards the west (Gard) and east (Vaucluse), and remain low towards the south (Bouches-du-Rhône), where the river flows into the Mediterranean Sea. The soils in the low altitudes are usually deeper, whereas the depth decreases significantly with higher altitudes and slopes. As such, almost all of the foodshed area in Bouches-du-Rhône is formed by deep or very deep soils, whereas this description applies to about half of the area in Vaucluse, and around a quarter of the Gard area (Figure 2).

2.2. Application of the MFSS Model for the Avignon Foodshed Assessment: Food Land Footprint and the Potential Self-Sufficiency of the Foodshed

The MFSS model [29] incorporates the two dimensions driving the food self-sufficiency analysis: estimated demand and potential supply. The model also distinguishes between domestic and exotic products, and between organic and conventional production systems. However, only one scenario, the business as usual (i.e., conventional, and a mixture of regional- and import-based diets), has been used for the first stage of the Avignon foodshed assessment, which aimed to test whether the initial strategically defined foodshed is suitable for achieving a high degree of potential self-sufficiency.
Very briefly, the model considers the utilizable agricultural area (UAA), which represents the potential area available for agriculture. The Corine Land Cover map (2018) was used to estimate the UAA, and eight land uses were included: non-irrigated arable land, permanently-irrigated land, rice fields, fruit trees and berry plantations, olive groves, pastures, annual crops associated with permanent crops, and complex cultivation patterns. Vineyards were excluded from the UAA assessment, because we assume that their agronomic use will not change in the future due to the high profitability of the wine industry in the study area. In addition, areas formed totally or partially by natural vegetation (e.g., forests or crops with significant patches of natural vegetation) were excluded from the assessment.
The model estimates the area demand for the population within the foodshed—i.e., the area required to meet the food consumption—for each food commodity (i.e., food land footprint) by considering the yields and population. The data on food consumption for 2017 were taken from the Food and Agriculture Organization of the United Nations (FAO) statistics (http://www.fao.org/faostat/en/#data/FBS, accessed on 22 July 2020), whereas the data on the yields for domestic plant-based products are regional, and were taken from national and regional reports for 2017–2018 [42,43,44] (see Table S4 in the Supplementary Material). The data on the yields for animal products (beef, eggs, poultry, pork, milk and dairy products, mutton and goat) and non-domestic food commodities were taken from Zasada et al., who estimated the land footprint of the FAO’s animal products categories by applying conversion factors from European studies [29].
When applying the MFSS model, the aggregated area demand per department is spatially represented by a circle—defined by a radius—with a centroid of the administrative boundary polygon, in this case the municipality of Avignon. The process can be summarized as the combination of the consideration of the UAA inside and outside the boundaries. The UAA for the whole region is represented as the overall agricultural area share of the region [29]. Therefore, the potential food self-sufficiency of the foodshed is estimated as the ratio between the area demand—or the food land footprint—and the current UAA to meet the regional food demand. Thus, food self-sufficiency values higher than 100% mean that the complete area demand for food production can be met within the boundaries of the foodshed. On the contrary, values lower than 100% would require food imports.

2.3. Materials Used for the Current Crop Production and Self-Sufficiency Level Assessment of Plant-Based Products

It is necessary to assess the current crop production in order to evaluate the role of agricultural diversification in increasing food self-sufficiency. This was carried out by using the 2014 Land Parcel Identification System (LPIS)—graphically represented in the French Registre Parcellaire Graphique (RPG)—which geo-locates and informs about areas under different European Union aid schemes of the Common Agricultural Policy (CAP). The current area dedicated to the different crops was then compared with the food land footprint, which was estimated previously for the foodshed by applying the MFSS model. Thus, the current level of self-sufficiency is determined from the current dedicated area:area demand ratio, and is expressed as a percentage (Figure 3).
The assessment was carried out by grouping the plant-based products most commonly consumed following the LPIS (RPG)-MFSS model categories, excluding less relevant food products. Five food products were assessed: cereals, vegetables, pulses, fruits from temperate areas, and wine and grapes. Oilseeds and nuts were also assessed, but the results are shown only in the Table S5 (see Section 3.2).

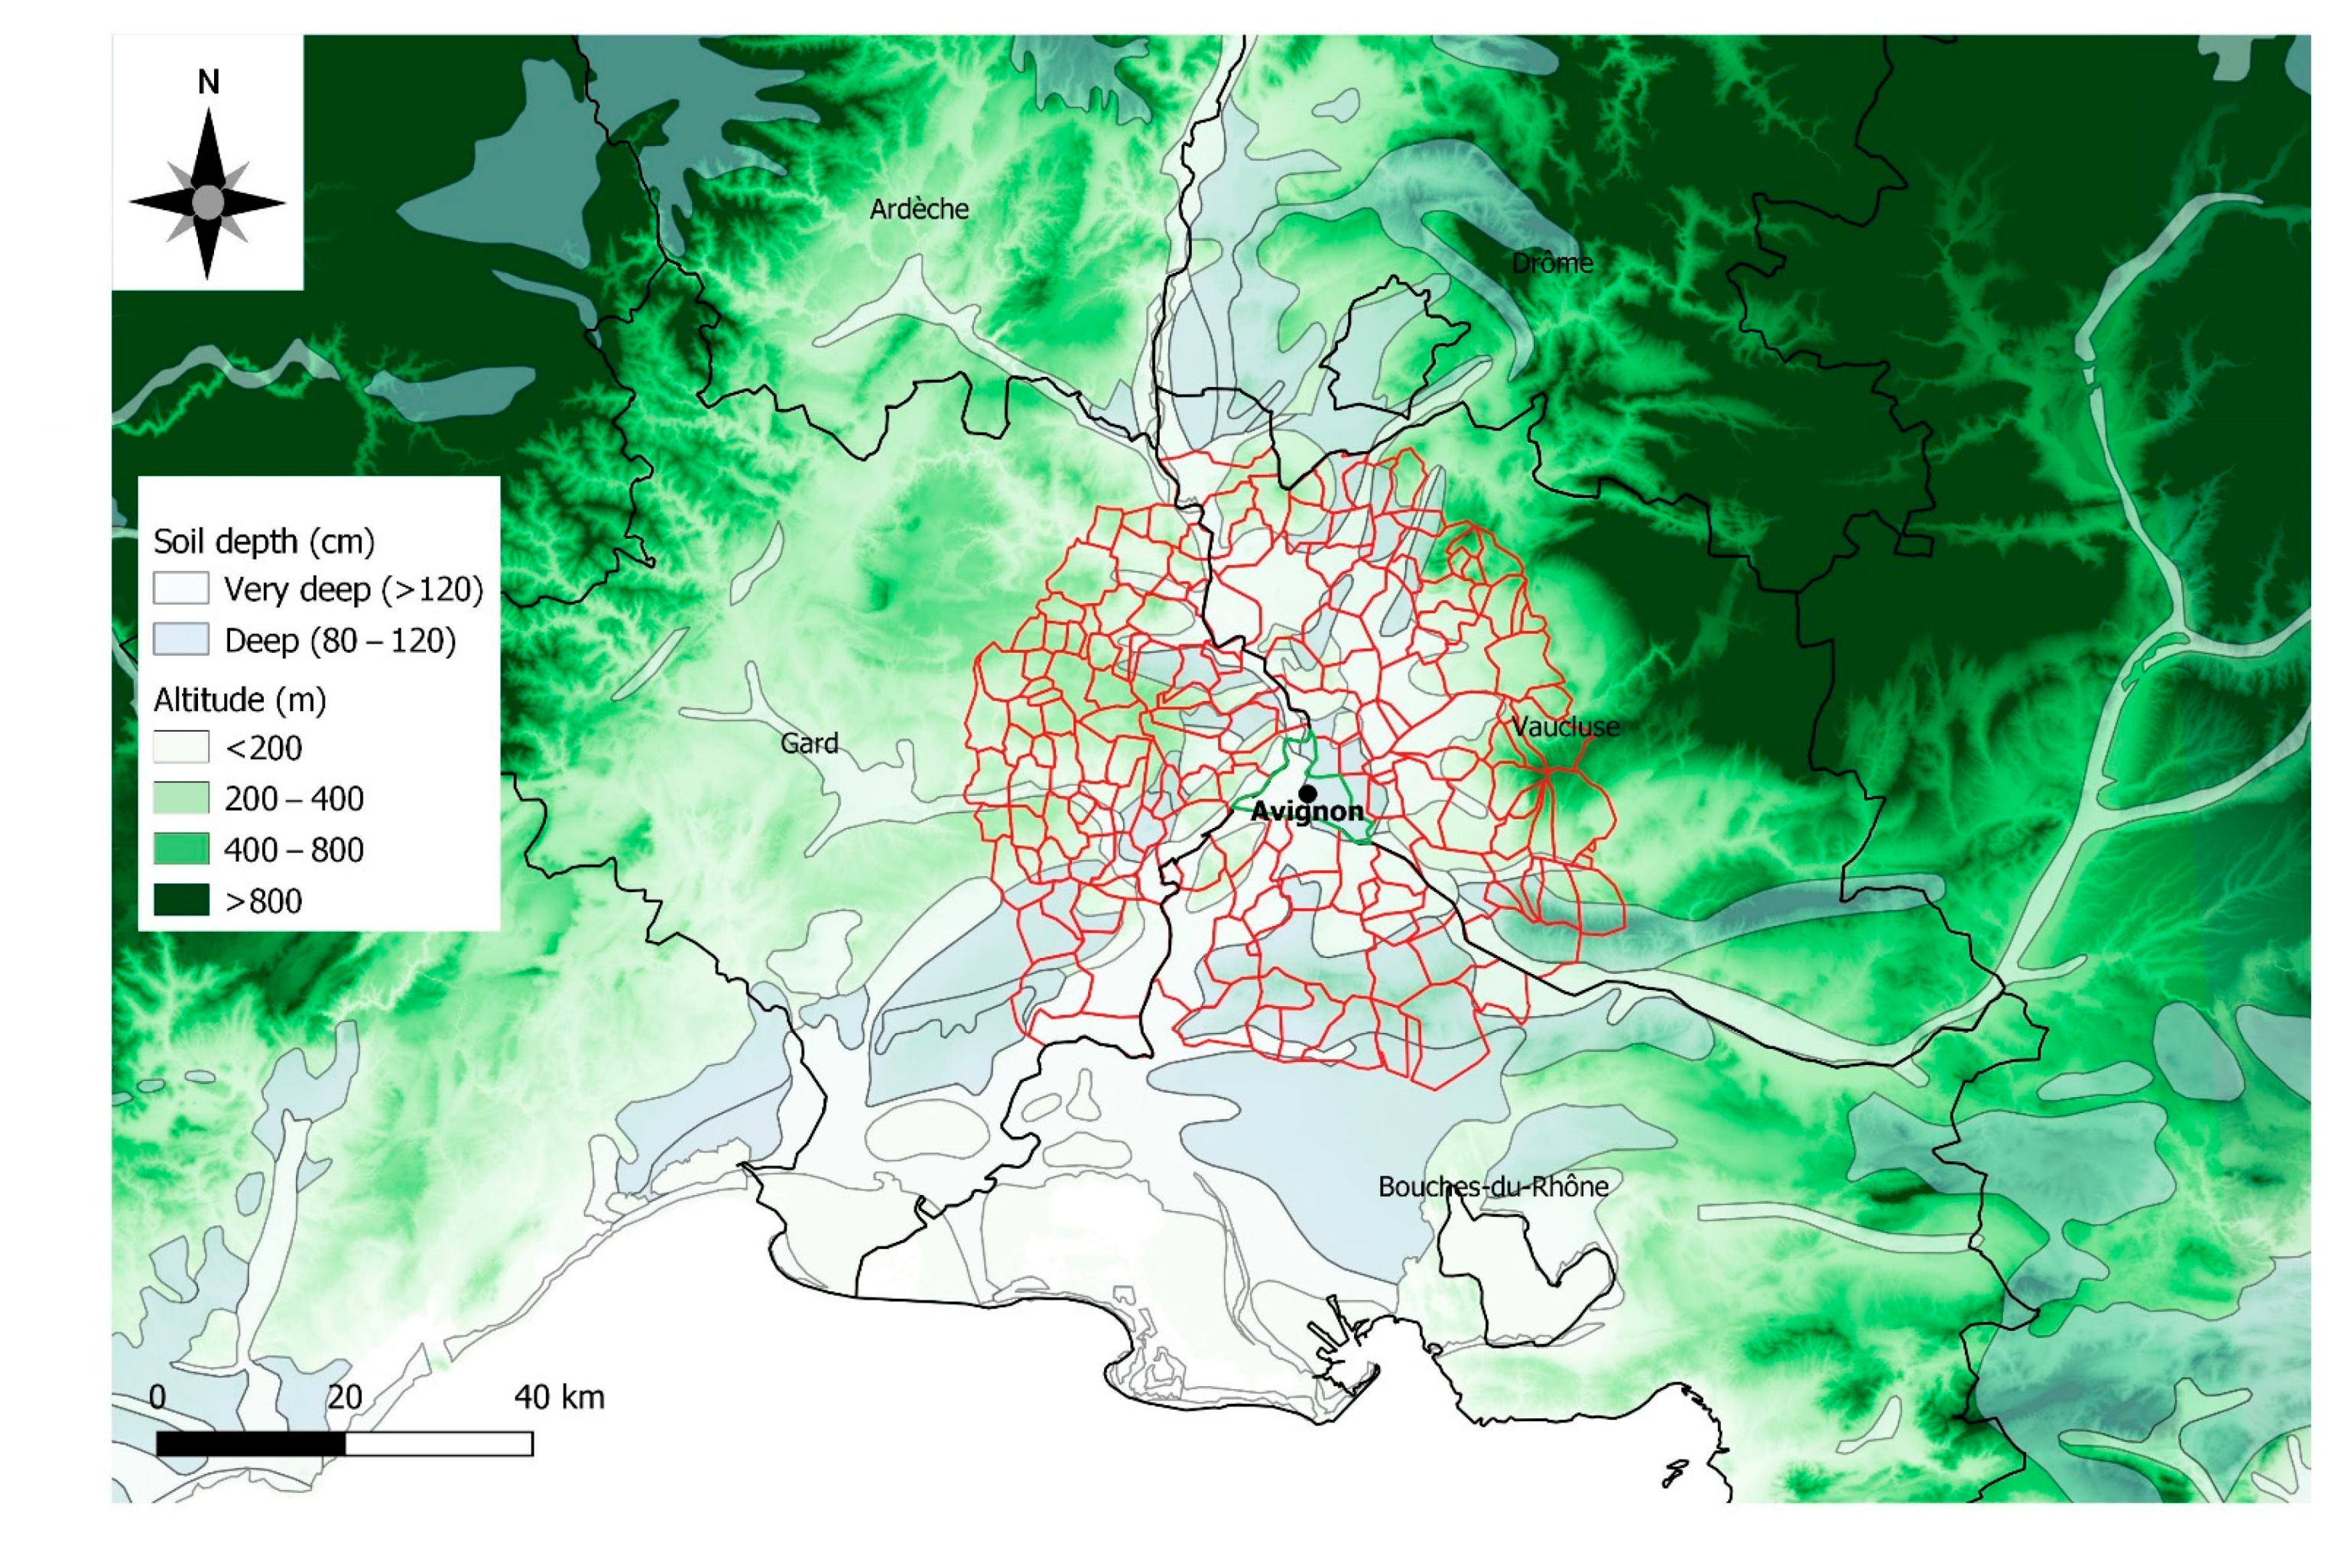
2.4. Materials Used for the Food Land Footprint and Foodshed Assessment of Animal Products

The current area dedicated to the production of animal products was estimated by assessing the information provided by the RPG map. Three categories were selected for the assessment: fodder, temporary grasslands, and permanent grasslands. Summer pastures were excluded from the analysis, because they are available only during a short period of time in the study area. The area demand for the consumption of animal products was estimated by applying the organic scenario of the MFSS model. The selection of the organic product system instead of the conventional one is because organic livestock farming is more often linked to extensive farming systems (i.e., the use of grasslands or pastures as animal feed) in the areas near where the livestock farm is located. The current self-sufficiency for animal products within the foodshed radius of 30 km was estimated in the same way as that developed for the plant-based products (Figure 3).
Since the study area is dedicated mainly to growing commercial crops (predominantly vegetables and fruit; see Table S5 in the Supplementary Material), an expansion of the foodshed was assessed solely for animal products, considering only unsuitable soils for commercial crops (Figure 3). One explanatory variable, the soil depth, was selected in order to address this issue, as pastures and fodder for extensive agriculture are usually located in shallow-depth and weakly-developed soils (AC soil profile), whereas commercial crops are usually placed in deep and highly-developed soils (ABC soil profile). The soils closer to the river in the study area are classified as Luvisols or Cambisols, whereas Leptosols are the most common types in mountainous areas, followed by Cambisols [45]. The European Soil Database was used for this analysis. This database identifies soils according to different properties, and the category ‘soil depth to rock’ is one of them. Thus, four categories of soils are distinguished: (i) shallow (<40 cm), (ii) moderate (40–80 cm), (iii) deep (80–120 cm), and (iv) very deep (>120 cm). We considered that commercial crops are more likely to be grown in deep and very deep soils (>80 cm), whereas fodder and pastures are mostly located in shallow and moderate soils (<80 cm).
After selecting the areas currently dedicated to feeding livestock, and excluding those located in deep and very deep soils, two radii for the expanded foodshed were considered: (1) 60 km and (2) 100 km (Figure 3), and two other departments located in the Auvergne-Rhône-Alpes region to the north—but very close to the borders of the foodshed (Ardèche and Drôme)—were included in the assessment. The first expanded radius, 60 km, was selected in order to include only those mountainous areas that are very close to the initial foodshed of 30 km, whereas the purpose of the second expanded radius, 100 km, was to include the mountainous areas of the five departments surrounding the initial foodshed (Figure 2).

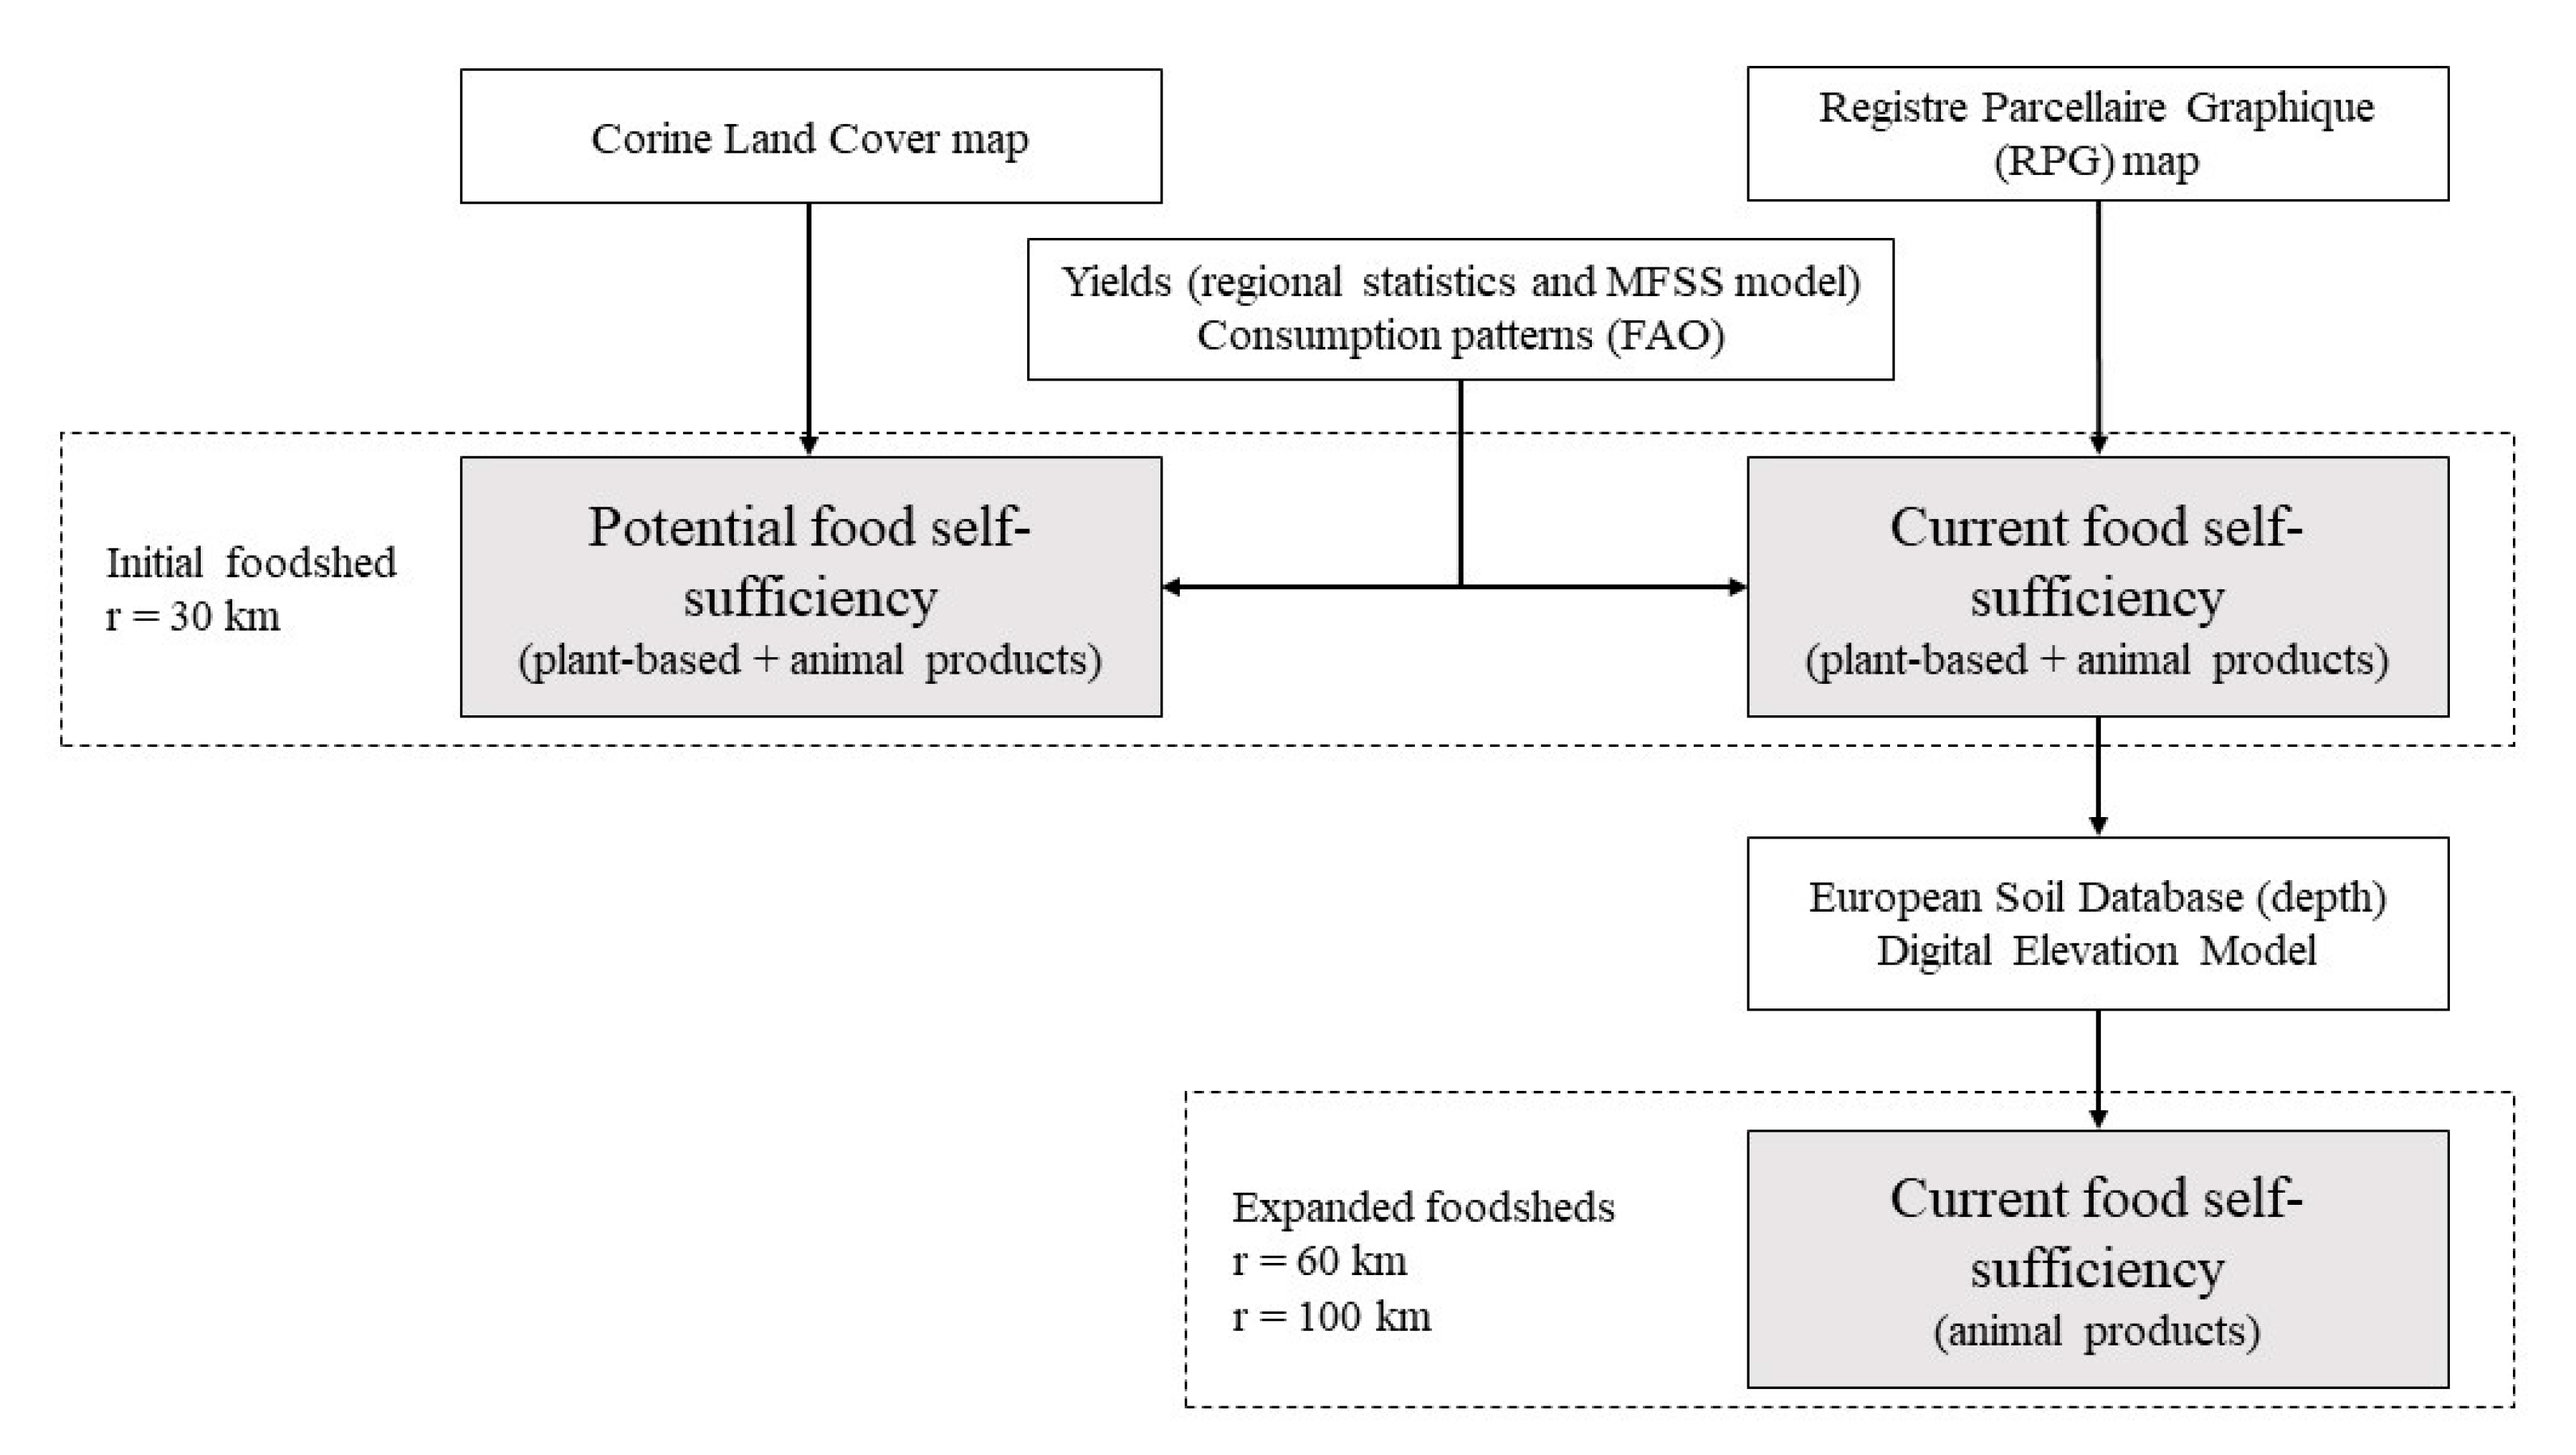
2.5. Methodology Used for the Assessment

A summary of the methodology followed for the development of the analysis is shown in Figure 3. The area demand for the different products was extracted from the MFSS model [29]. The yields for plant-based products were taken from regional statistics [42,43,44]. The potential self-sufficiency analysis is based on the Corine Land Cover Map [46] and FAO data on food consumption without considering food waste (http://www.fao.org/faostat/en/#data/FBS, accessed on 22 July 2020), whereas the assessment of the current self-sufficiency for the plant-based and animal products for the current and expanded foodsheds (60 and 100 km radius) were based on the LPIS database that is graphically represented in the RPG map [47], considering only people living within the initial foodshed of 30 km [48]. The assessment of the soil depth was carried out by using the European Soil Database [49], whereas the elevation was taken from the Digital Elevation Model over Europe [50]. The land cover and crop area assessments, as well as the soil and expanded foodshed assessments, were developed using QGIS 3.12.1 [51].

3. Results

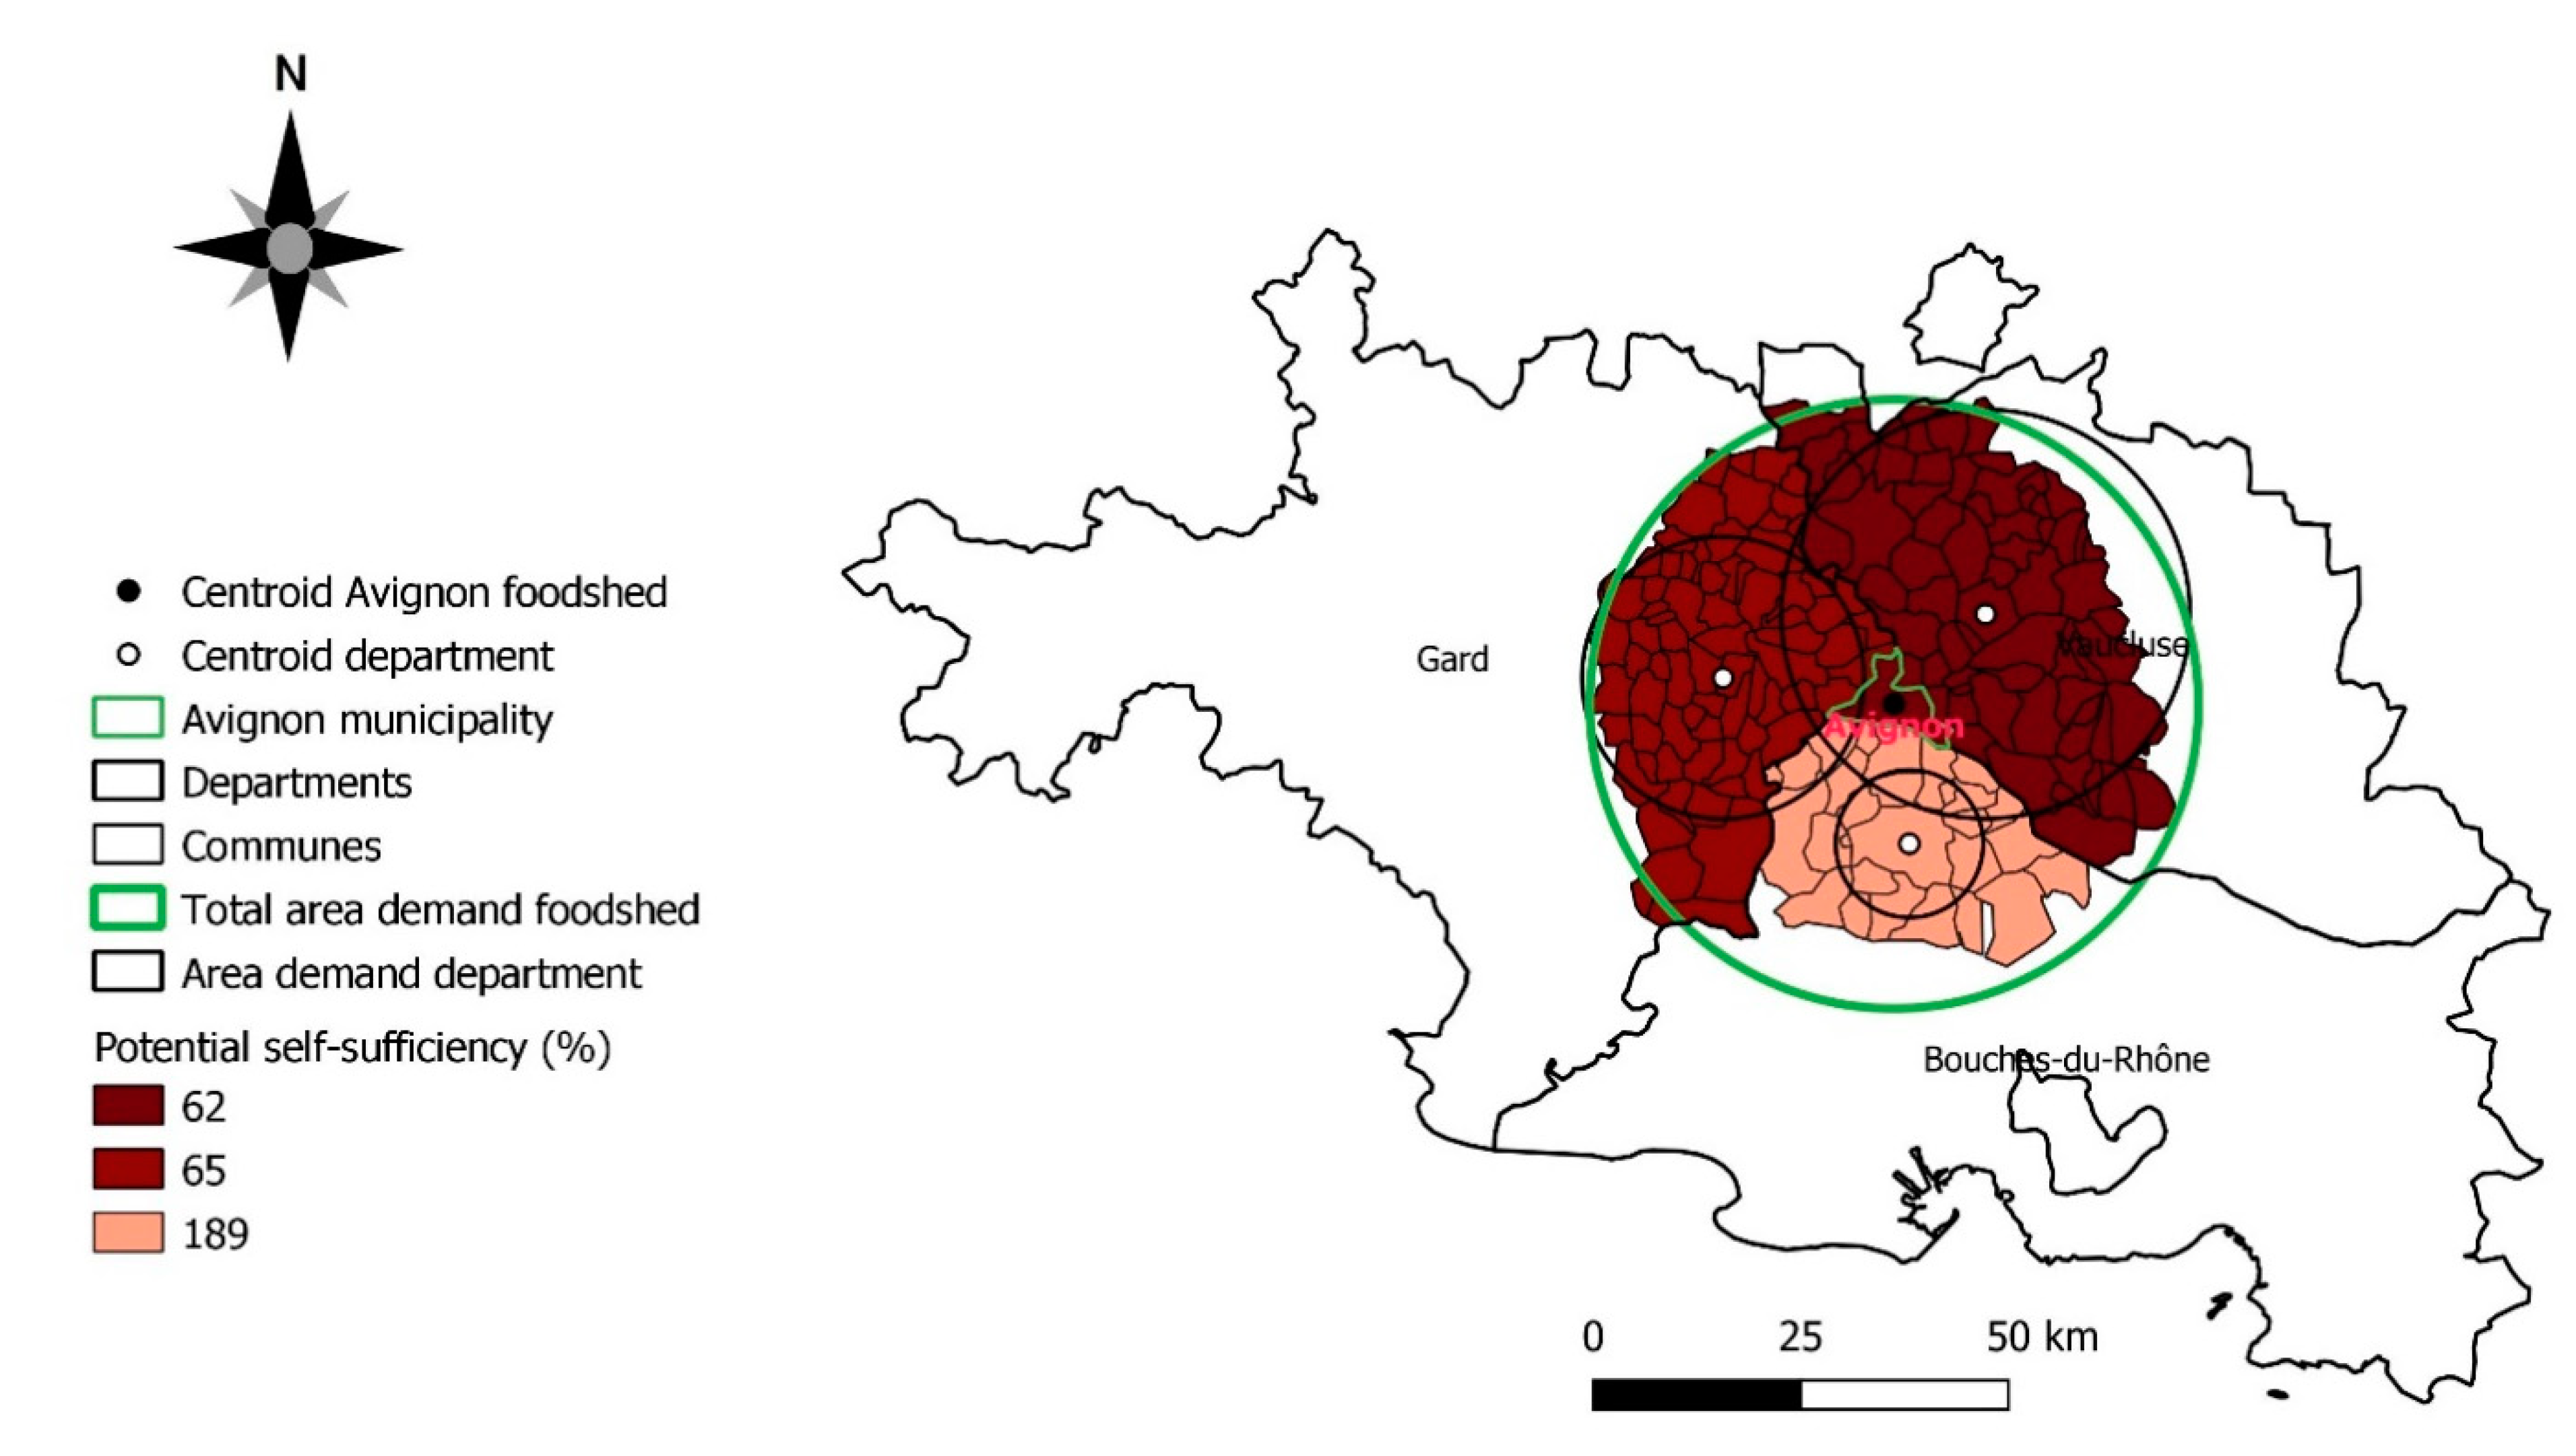
3.1. Foodshed Assessment and Potential Self-Sufficiency for the Proposed Foodshed

Table 1 and Figure 4 summarize the results of the area demand and potential food self-sufficiency for plant-based and animal products. The communes within the Bouches-du-Rhône department had the highest potential self-sufficiency, 189%, due to the high amount of UAA per capita (3861 m2) compared to the area demand per capita (2047 m2). However, the self-sufficiency values for the communes—or municipalities—belonging to the other two departments, Gard and Vaucluse, were lower than 100% (65 and 62%, respectively), due to the relatively low UAA per capita. However, while the main restriction for achieving a high degree of self-sufficiency in Gard was the low total UAA (around 26,000 ha), the UAA in Vaucluse was relatively high (around 53,000 ha), but the population density was much higher (278 inhabitants per km2) compared to the other two departments (around 150 inhabitants per km2), due mainly to the fact that Avignon, the main city in the study area, is located in Vaucluse department. The potential self-sufficiency estimated for the whole study area is around 83%, and the estimated radius to meet the theoretical 100% food self-sufficiency is 37 km, which is slightly higher than the initial radius of 30 km of the foodshed selected.
However, whereas the area demand is a relatively accurate value, because it is based on the current consumption per capita, this is not the case for the UAA. The UAA represents the potential area that could be used for agriculture and livestock. Therefore, the food self-sufficiency values estimated do not show the current situation, but rather show a theoretical one, which we compared to the current situation of the agricultural cropping pattern determined by the specific regional pedoclimatic and socioeconomic characteristics (see the following subchapters).
The estimation of the potential food self-sufficiency in the business-as-usual scenario does not consider any change in food consumption patterns. This limitation must be pointed out regarding the fact that there are products currently consumed that cannot be produced regionally (e.g., bananas), and hence, importantly, the resulting food land footprint of the foodshed (2047 m2 capita−1) does not take place 100% regionally. Nevertheless, these products, all plant-based or drinks based on plants, only represent 156 m2 capita−1 of the total 563 m2 capita−1 of the plant-based products’ land footprint, since the rest of the products could theoretically be produced in the region (Table S5 in the Supplementary Material). Therefore, adapting diets has not been considered as a key driver in achieving a high level of food self-sufficiency in the region, and the focus was on the role of the regional spatial crop diversification and its drivers.

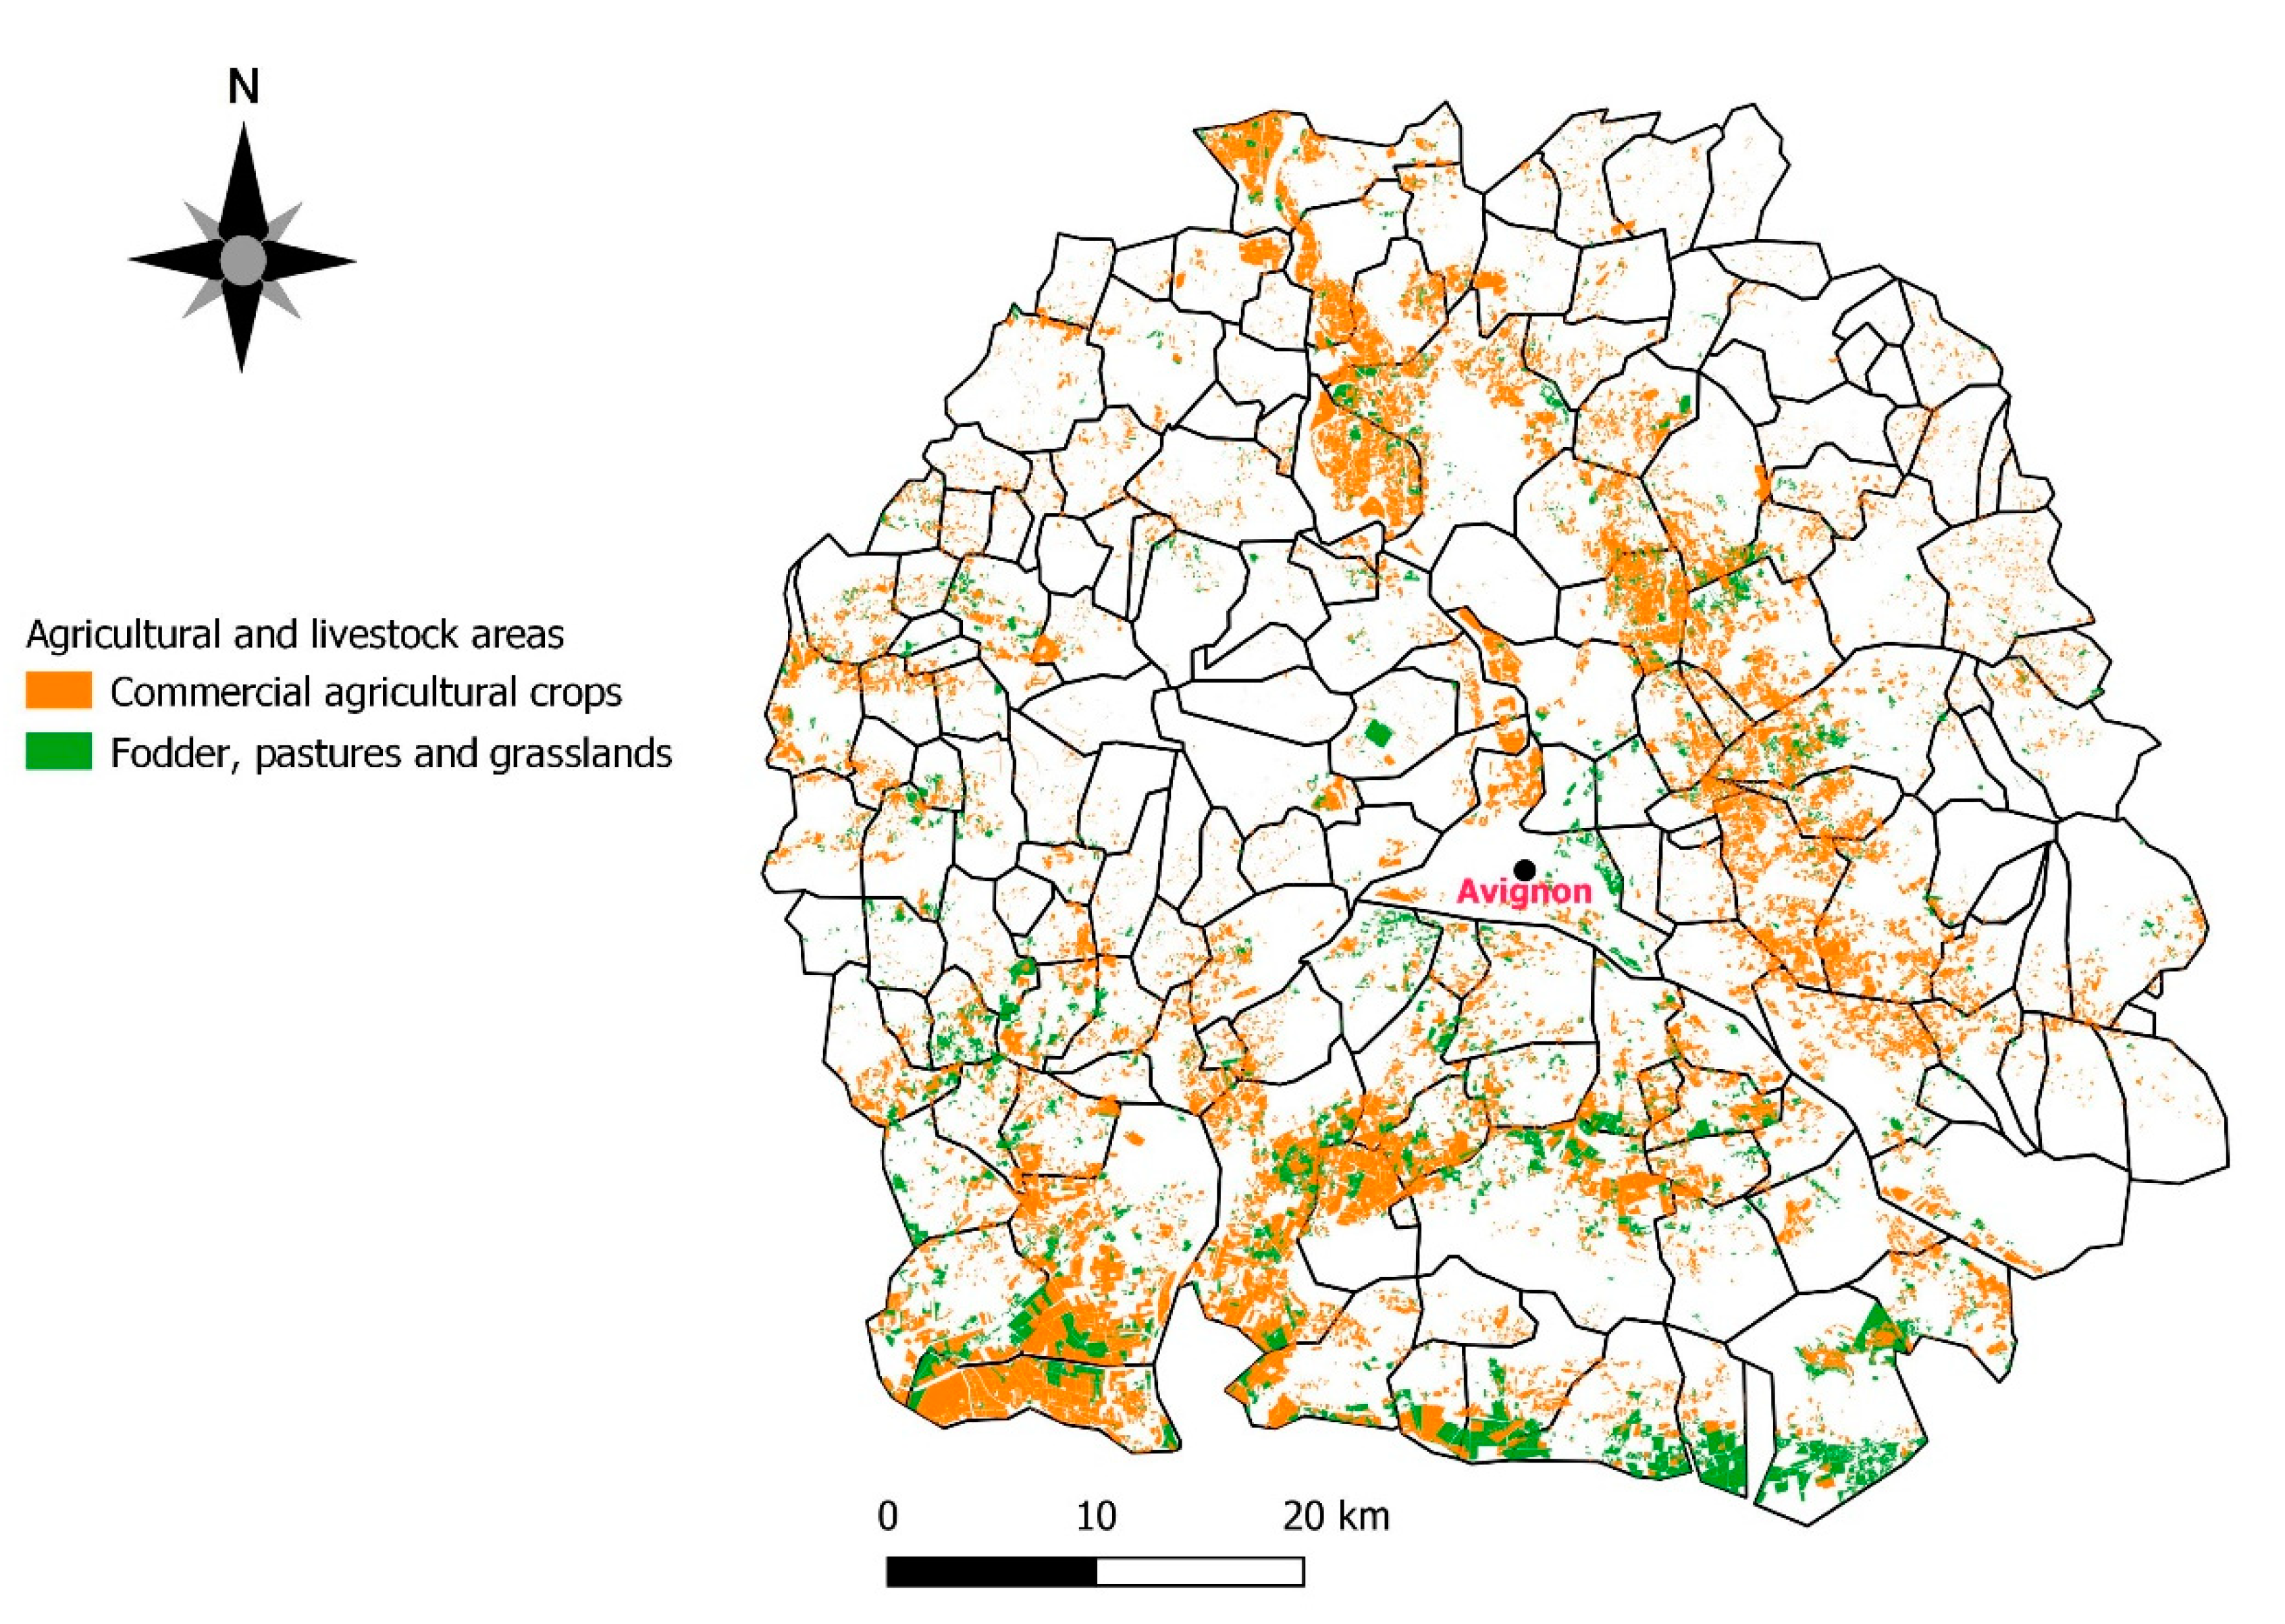
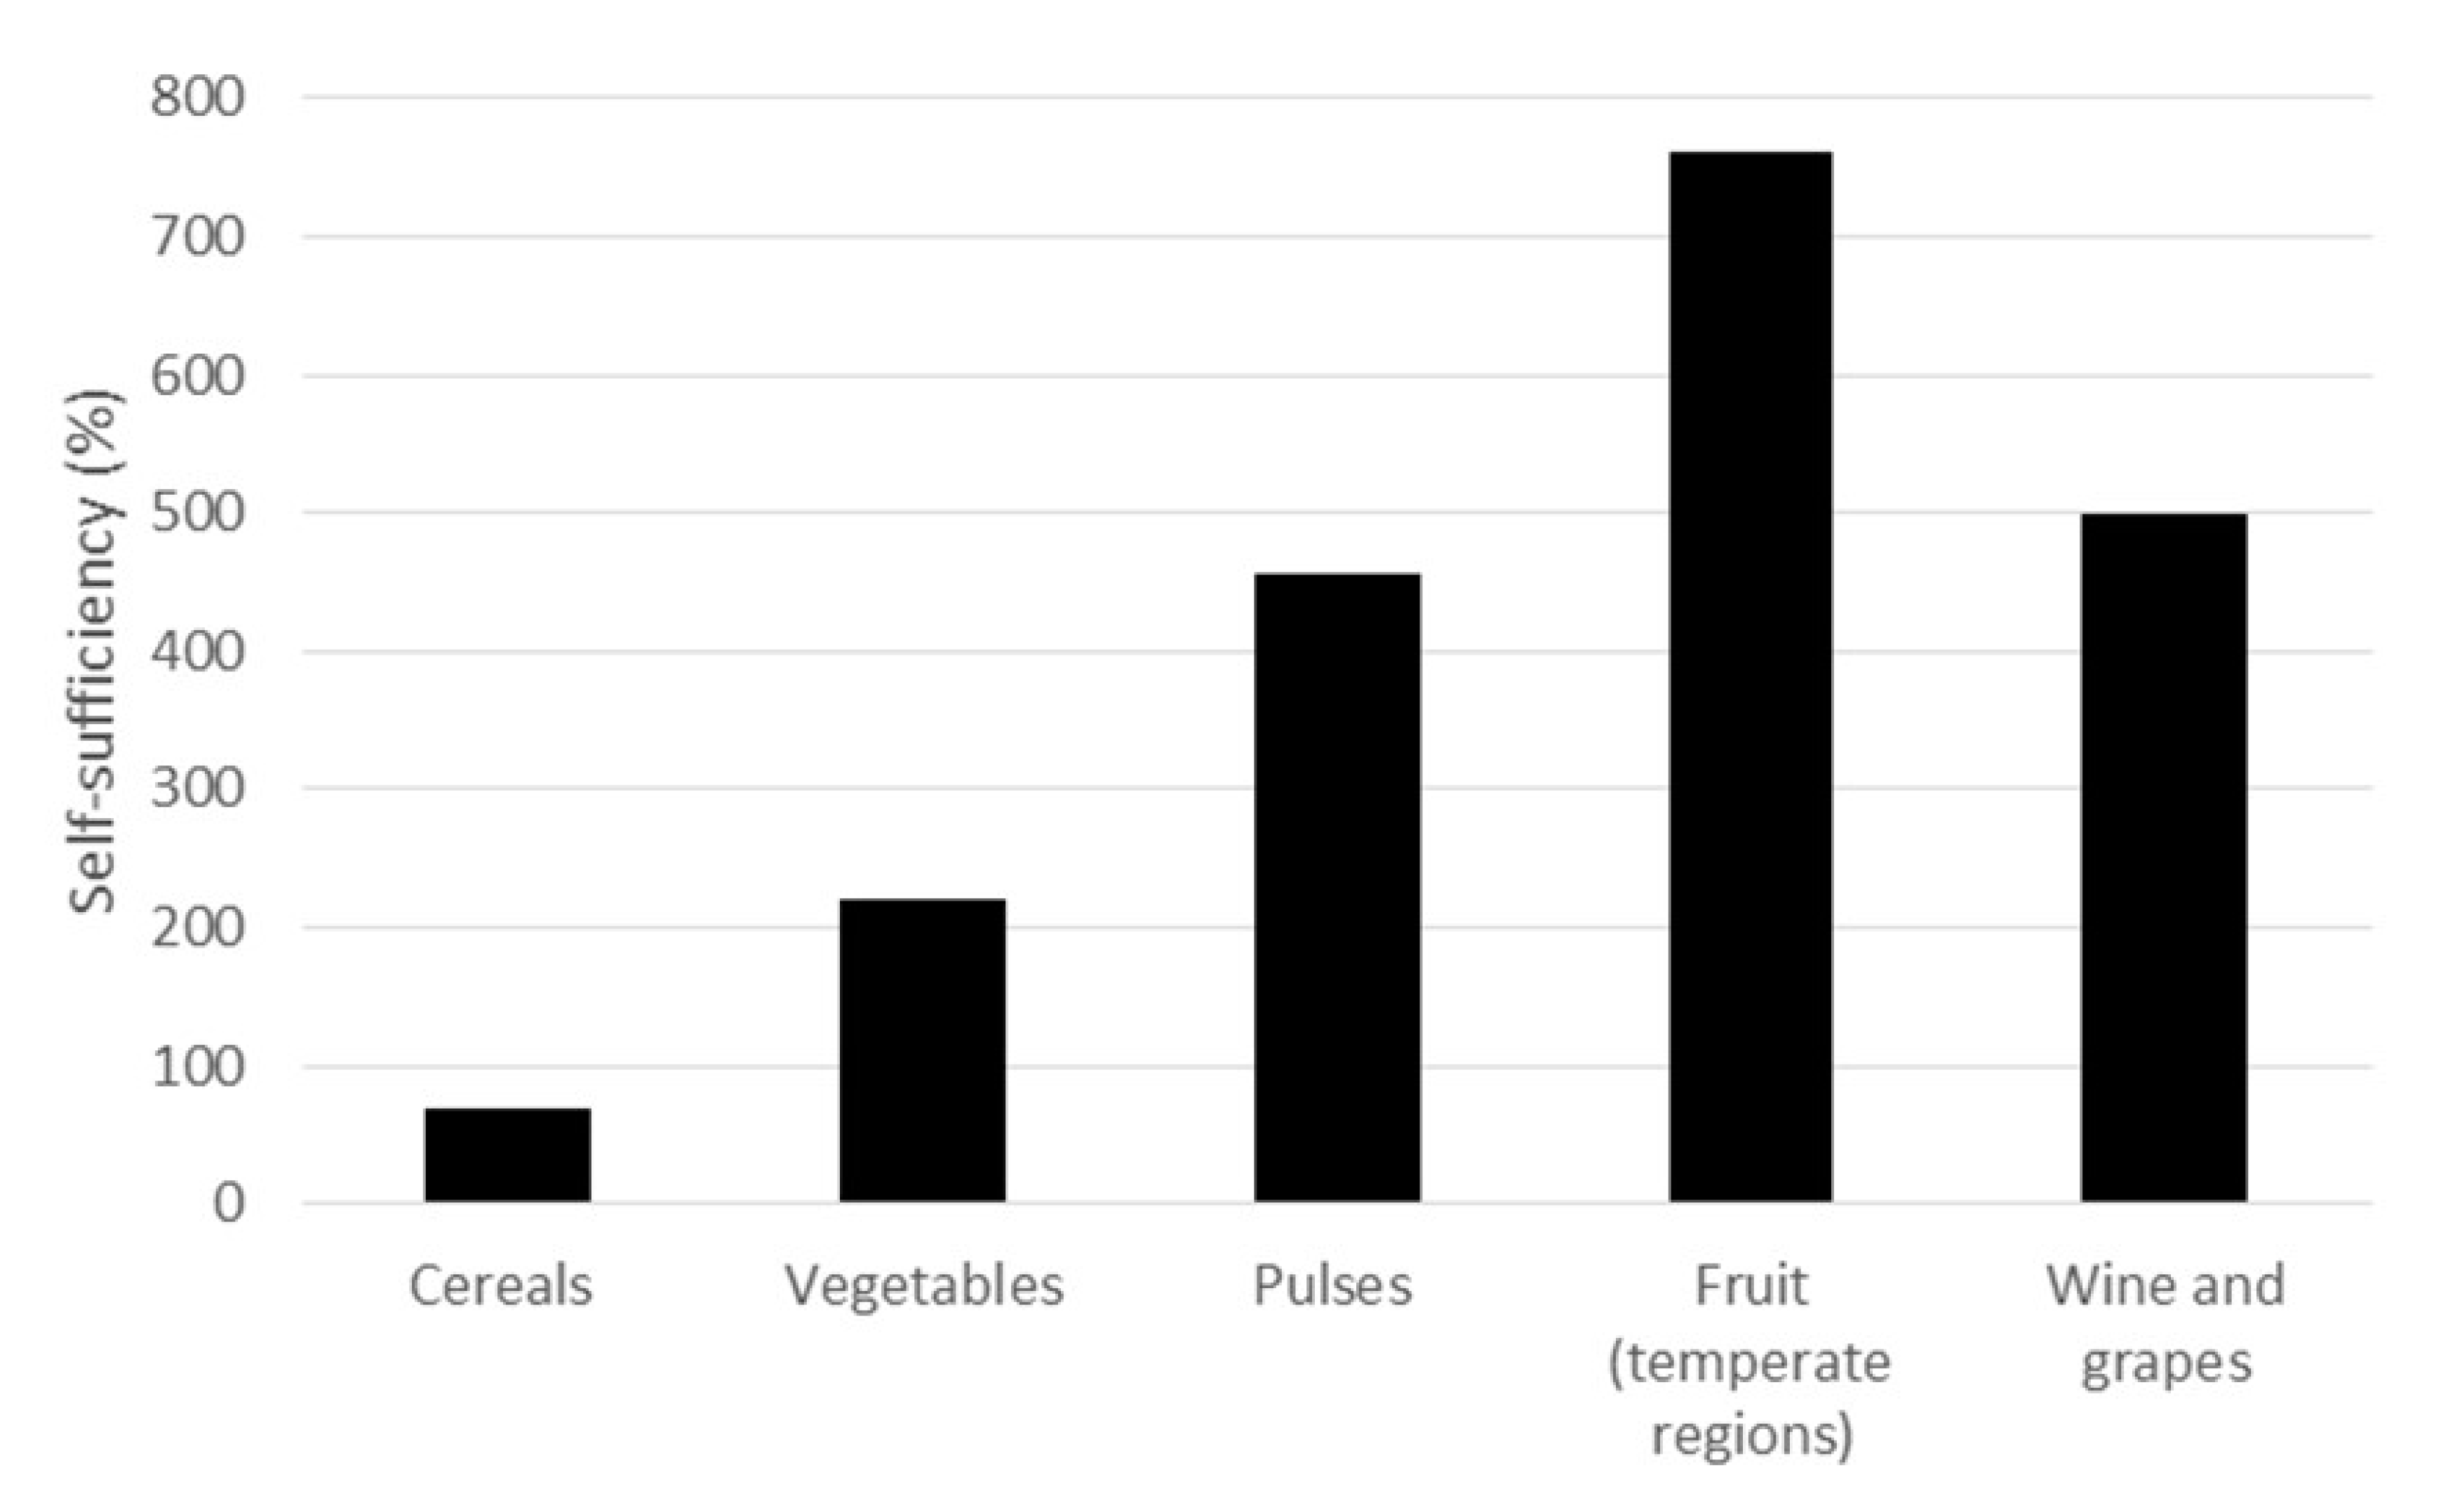
3.2. Current Crop Production and Self-Sufficiency of Plant-Based Products

The challenge is on the supply side, as consumption is not a key driver for increasing the food self-sufficiency level. According to the RPG map, the total agricultural area currently used within the foodshed is estimated to be around 110,000 ha. This area, which includes vineyards, is lower than the UAA estimated previously (Table 1). This is due to the different way of estimating the cultivated area. While the UAA comes from the Corine Land Cover map, an estimation from remote sensing, the LPIS database—and the RPG map—is constructed from cadastral data related to the CAP payments, and therefore some plots might not be included, leading to an underestimation of the real cultivated area. However, since the accuracy in terms of crop identification is greater in the LPIS database than in the Corine Land Cover map, the former—modified and adapted to the conditions of the study—was selected for this part of the assessment (Figure 5).
Considering the current consumption and production values in the foodshed area, we estimated the current level of food self-sufficiency for cereals, vegetables, pulses, fruit from temperate regions, and wine and grapes. The results show that only cereals achieve a value lower than 100% (Figure 6 and Table S5 in the Supplementary Material), whereas 100% food self-sufficiency is clearly achieved for the rest of the products. Fruit accounted for the highest value (761%), followed by wine and grapes (498%), pulses (455%), and vegetables (220%). Even if the food sufficiency capacity for plant-based products is very high, they account for only 38% of the food products forming the average diet, whereas the other 62% belong to the consumption of animal products. In the following section, we analyze the food self-sufficiency capacity for the animal products.

3.3. Current Livestock Production and Potential Self-Sufficiency of Animal Products

We estimated the total land footprint for organic animal products to be around 133,000 ha (Table 2). This value is 1.4 times higher than the one estimated for conventional farming (92,700 ha) due to the higher area demand estimated by the model for organic livestock farming. This area represents around two-thirds of the food land footprint of the whole diet. Of this area, around 39% is a consequence of the consumption of milk and dairy products, followed by beef consumption (26%), pork (18%), poultry (10%), eggs (5%), and mutton and goat (2%).
However, the current surface dedicated to pastures and fodder in the proposed foodshed of 30 km is 14,120 ha, thus enabling the 11% self-sufficiency of animal food products. There is also an unbalance between the different departmental areas within the foodshed. While the highest area demand takes place in the Vaucluse area, Bouches-du-Rhône accounts for the highest current dedicated area for livestock. Consequently, the highest self-sufficiency for animal products is achieved in Bouches-du-Rhône (32%), followed by Gard (12%), and Vaucluse (4%) (Table 2).
An expansion of the foodshed proposed is considered in the following section, as the area available for the production of animal products within the foodshed of 30 km only covers around 11% of the total area demand, and extensive agriculture takes place in soils with medium-to-low fertility (e.g., high slope, shallow depth, high stoniness, low pH).

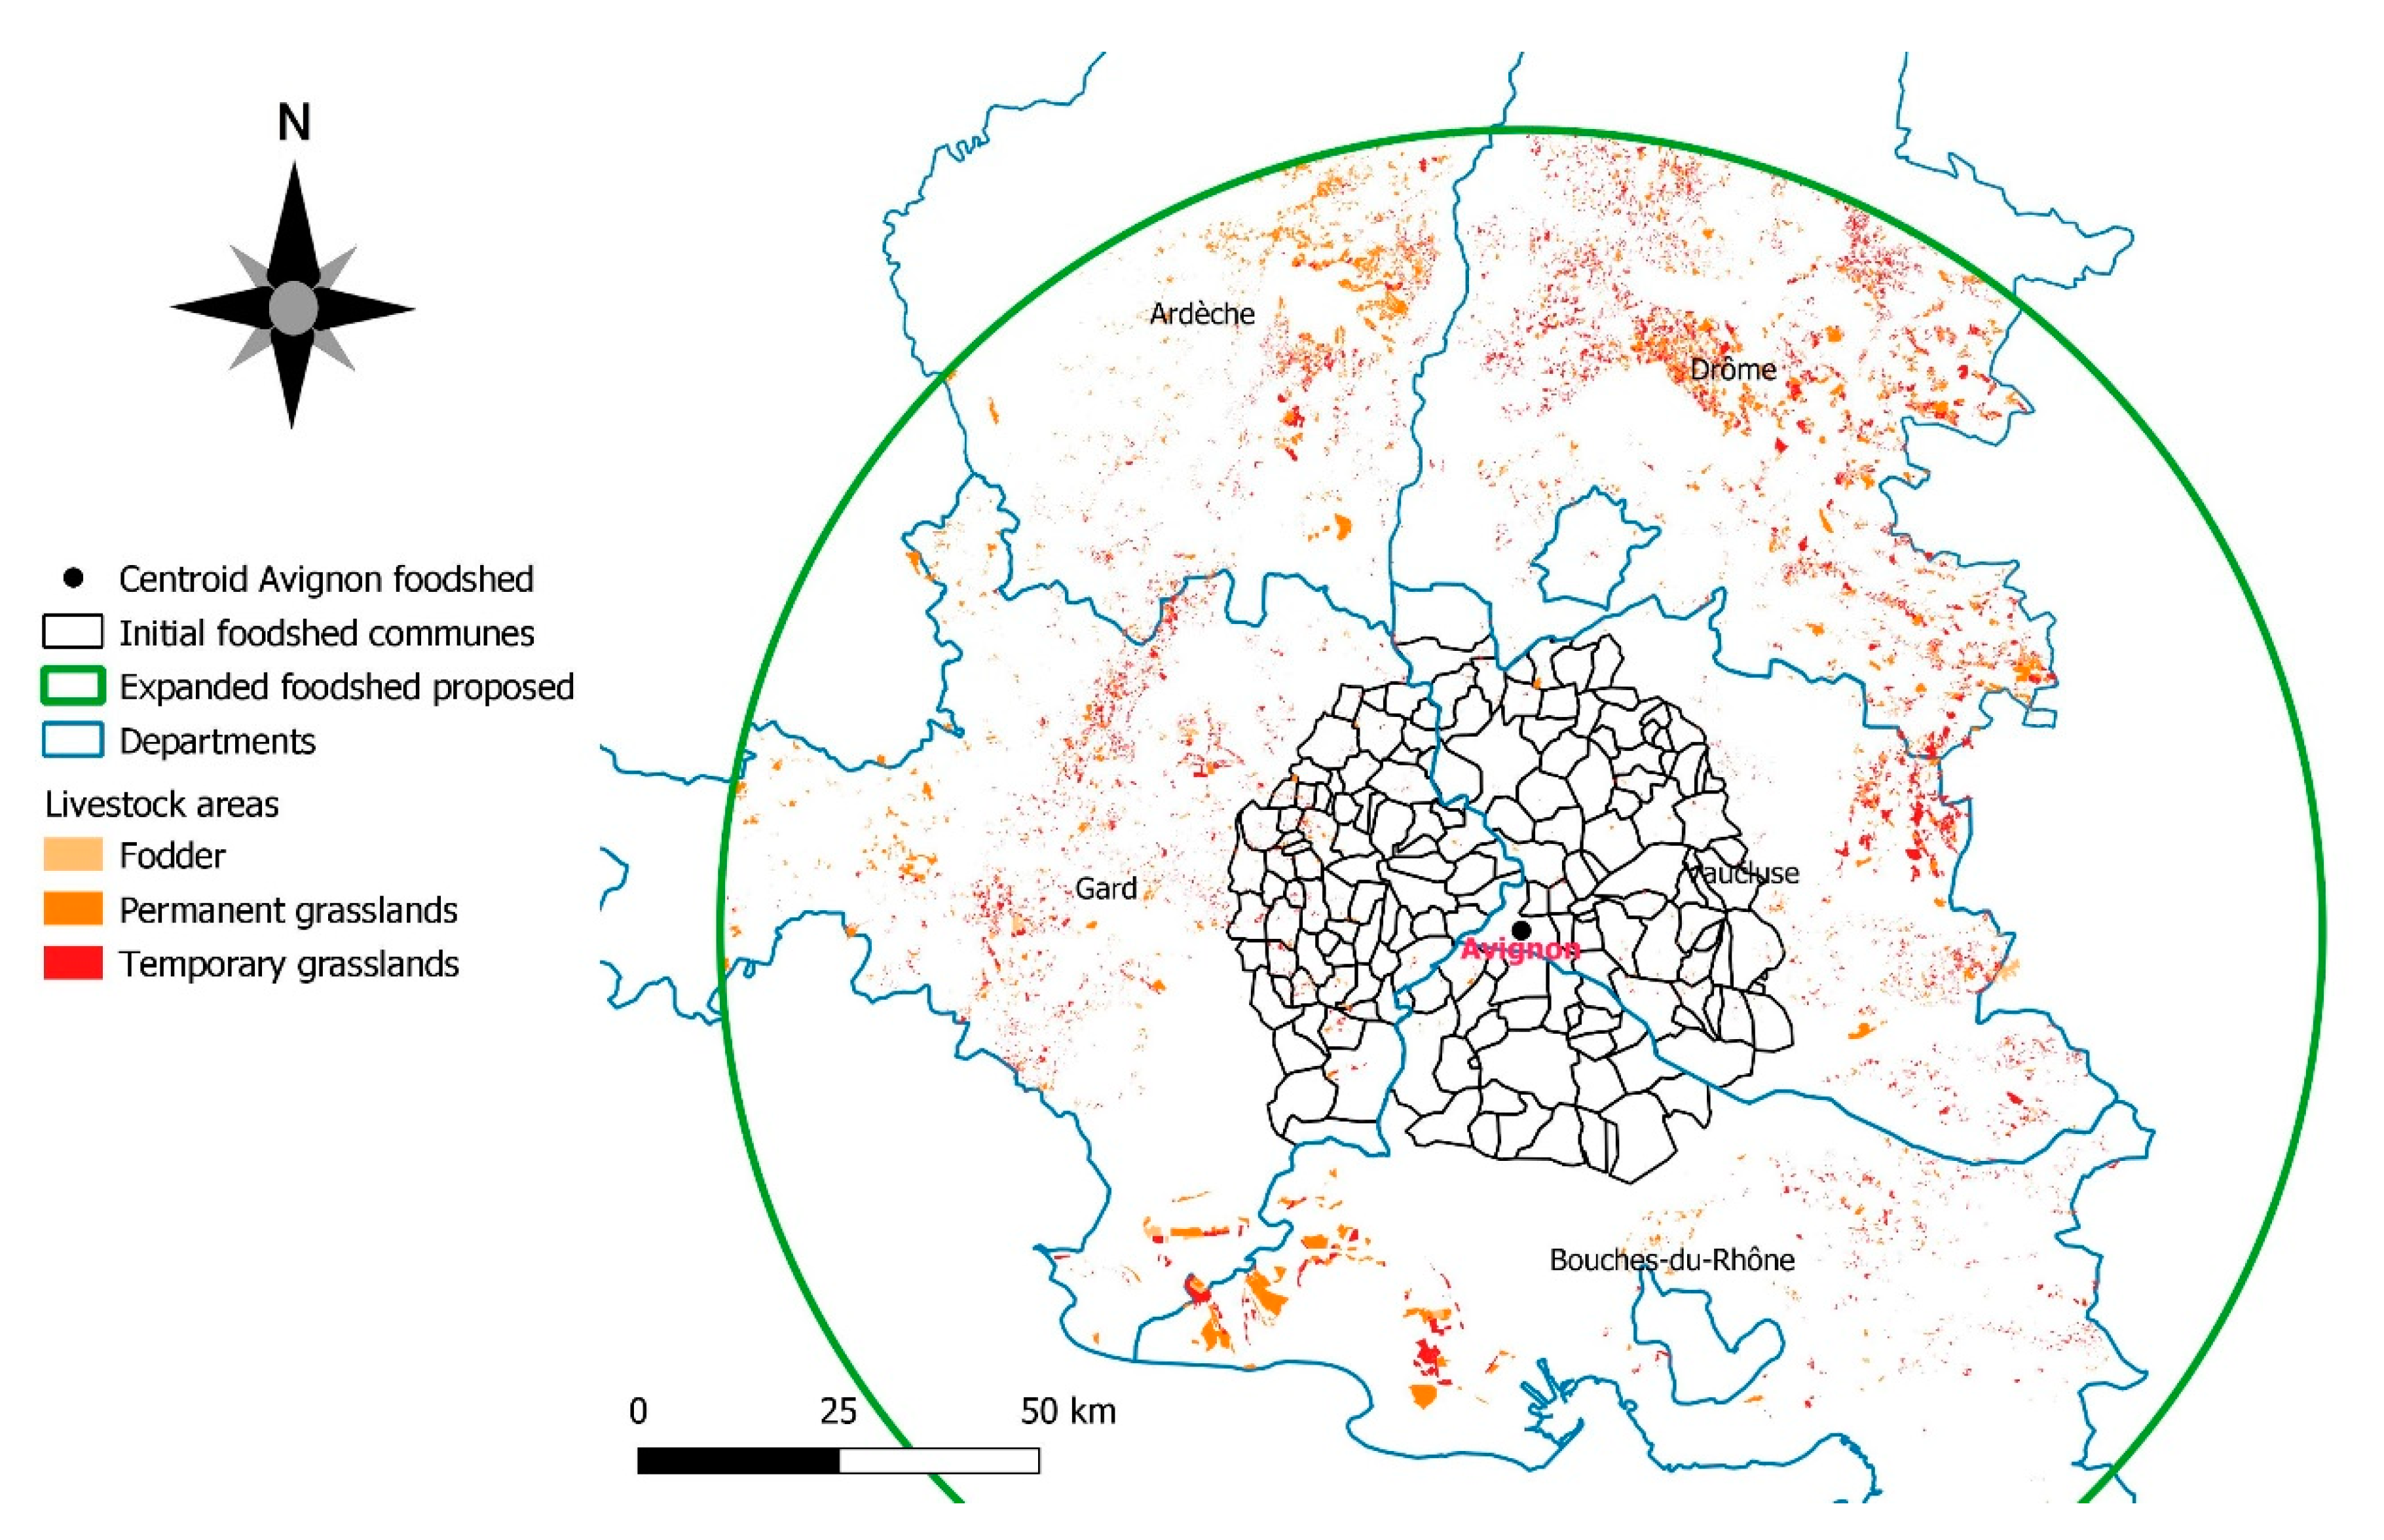
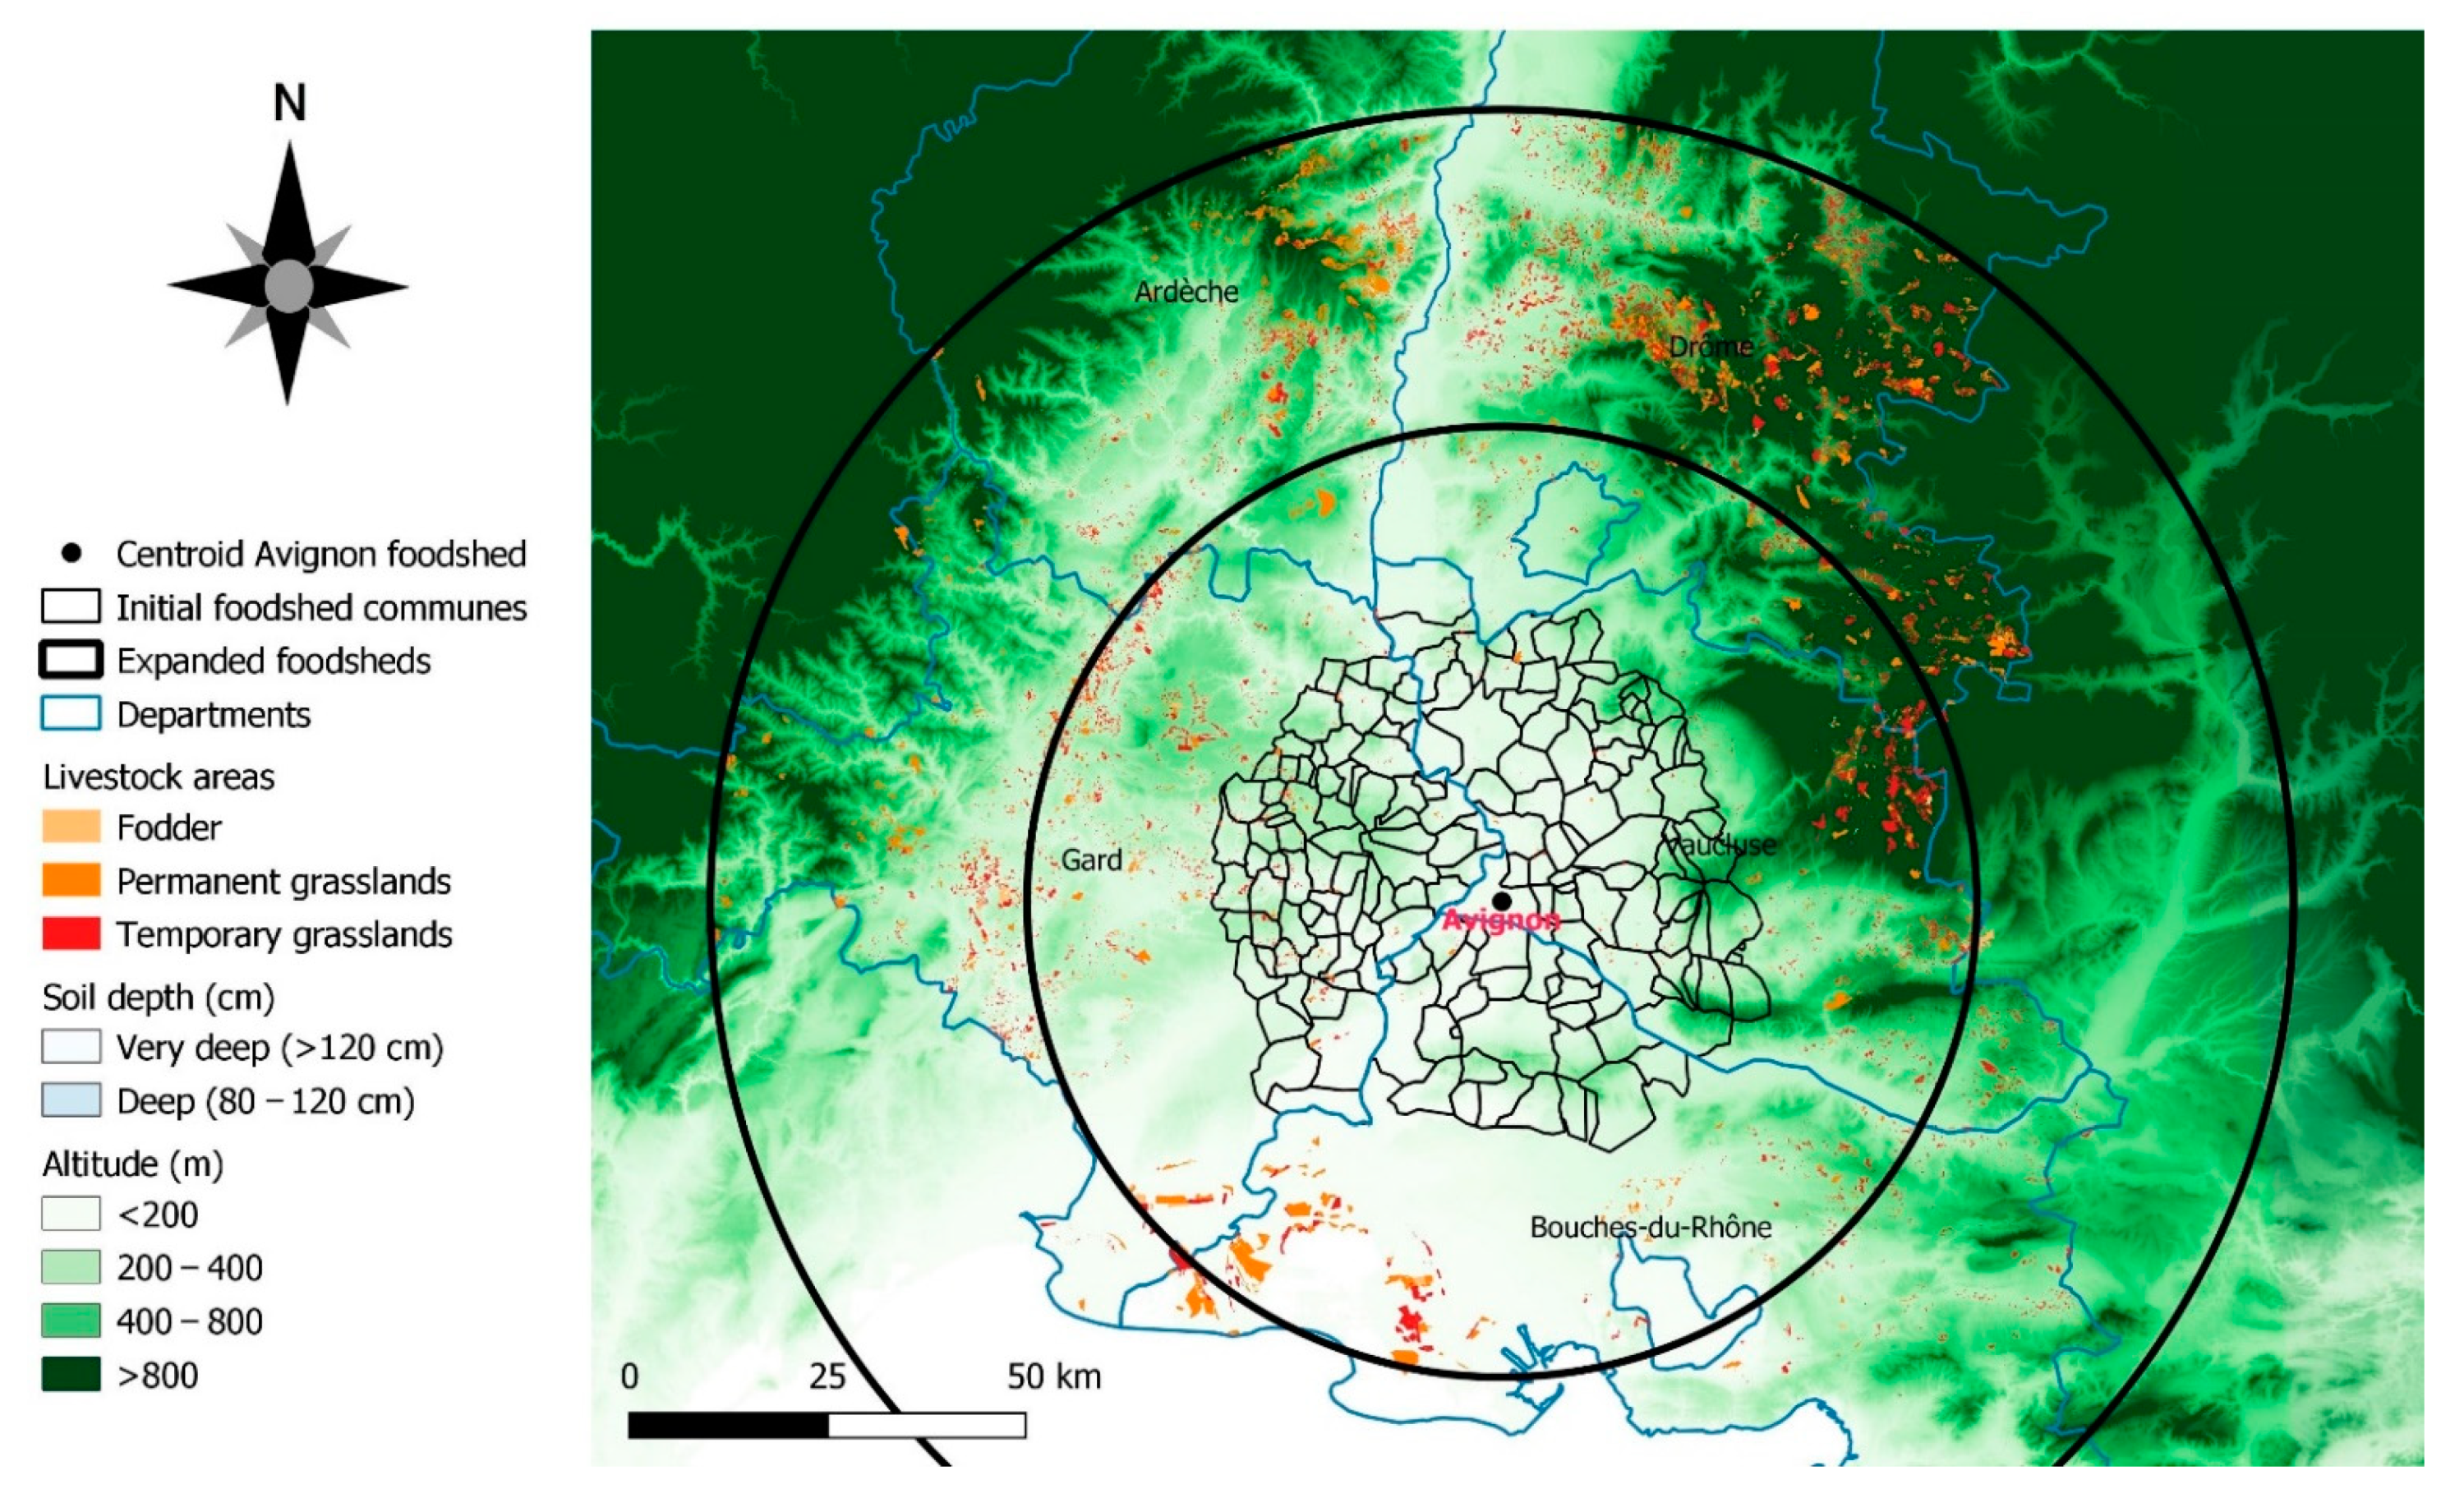
3.4. Assessment of the Expanded Foodshed for Animal Products

An expansion of the foodshed for animal products was simulated, considering the pedological conditions and geomorphology. Two buffers around the municipality of Avignon were considered for the expansion of the foodshed: 60 and 100 km. The immediate consequence is that the foodshed area must include other departments beyond the three considered so far. Geomorphologically, the foodshed is well connected to the two adjacent departments to the north, Ardèche and Drôme, in the Auvergne-Rhône-Alpes region, which also account for a high surface of area dedicated to extensive agriculture (Figure 7) and, at the same time, avoid competition with the neighboring city of Marseille (South-East). Plots under deep or very deep soils (i.e., >80 cm depth) were excluded from the assessment in order to avoid land-use conflicts, and to avoid including areas with a high aptitude for commercial agriculture in the study (Figure 8); therefore, only plots with a non-commercial agricultural suitability were included in the assessment.
Thus, the area available for extensive livestock farming resulting from the first buffer, a radius of 60 km, is only 38,000 ha, and is around 97,000 ha in the case considering a radius of 100 km, suggesting that it is especially after 60 km that the plots used for extensive agriculture appear, whereas the soils closer to the foodshed that was initially proposed are mostly used for commercial agriculture (Figure 7). As a result of the selection of the foodshed for animal products with a radius of 100 km, and the exclusion of deep and well-developed soils (Figure 8), the food self-sufficiency for these products would be around 73%, without considering the population of these mountainous areas, accounting typically for a much lower population density than the areas closer to the river.

4. Discussion

Our study shows that assessing the size of the foodshed both quantitatively—by applying the MFSS model and assessing the supply-demand balance—and qualitatively—by combining these outcomes with the different biophysical maps—is an appropriate and realistic way of evaluating the theoretical potential and current food self-sufficiency degree at a regional level (i.e., hybrid foodshed assessment [28]). The outcomes from the MFSS model can, thus, be combined with different types of maps to obtain a more accurate overview of the regional food system, enabling food self-sufficiency issues and foodshed assessment to be addressed realistically. This more realistic approach was partially addressed recently by some authors, for instance, by including the economic dimension [52] or food traceability [53], but lacking a more accurate assessment of the amount and balance of the regional domestic supply–demand, and especially a more realistic assessment of the regional food supply, which is, indeed, the final outcome of our assessment.

4.1. The Spatial Configuration of the Foodshed, Taking into Account Crop Diversification Questions

Higher food self-sufficiency is linked closely to the composition of crops (for instance, homogeneous vs. diversified) to provide sufficient diversity in marketed food products. However, crop diversification concerns not only agricultural cash crops providing food for human nutrition but also the pasture and fodder areas required for livestock farming. In our study, we found that increasing the pasture areas within the initial proposed foodshed of 30 km radius was not realistic (Table 1) due to the suitable soil conditions for commercial agricultural crops and, therefore, the lack of available area for extensive livestock farming (Table 2). This leaves two alternatives: (1) expanding the initial foodshed to incorporate the closest pastoral areas (Figure 7 and Figure 8) and (2) considering the foodshed as a complex of complementary parts extending beyond the isotropic circle, thus shifting the discussion from the size to the spatial configuration of the foodshed.
Expanding the initial foodshed to a larger circle would make it possible to include the closest area suited to the targeted production. In our case study, while the foodshed of 30 km radius initially proposed is self-sufficient for many of the plant-based crops, the expanded foodshed of 100 km—including the surrounding mountainous areas (Figure 8)—would increase animal-product self-sufficiency values to >70%. The new radius is an interesting illustration of the theoretical extent of the spatial requirements for such Mediterranean cities’ foodsheds.
From an empirical point of view, however, a foodshed assessment based on estimating distances in terms of a radius around the city has difficulty accounting for the precise consideration of the land use given and the diversity of existing crops. This information is needed in order to encourage farmers to change land use and inform decisions concerning food planning and urban food strategies, such as initiatives aimed at developing short supply chains for specific food products (in the case of Avignon, beef for the school canteens). The assessment is made by aggregating all of the different agricultural products used in the diet in one homogeneous foodshed area centered on the city. This yields a large foodshed containing too many diversified food production areas (in our case, mainly plant-based). In addition, an extended foodshed radius in high urban density areas may generate overlaps due to the city’s competing procurement needs [29,38], with inefficient results from a public action perspective. In summary, from an empirical perspective, it might not be suitable to extend the size of the circle limitlessly. Two main arguments should be kept in mind.
Firstly, there is a negative relationship between the distance from the city and the likelihood of a production context to be favorable to the development of a local food supply chain [52]. Foodsheds for big cities may be so large that they incorporate highly varied production contexts, including some farms oriented toward local supply. The density of locally-oriented farms tends to decrease with their distance from the city [54], whereas monocultures and intensive production farms devoted to the global market are located mainly in areas that are not under urban influence [5].
Secondly, there is a negative relationship between the urban density at a regional level and the likelihood of finding a production area targeting only one market location [55,56]. Agricultural areas in a polycentric setting (i.e., a dense network of cities) tend to combine all of the demand from local markets into a food chain that supplies several cities [57]. Thus, when big cities’ foodsheds are as large as a region, it is highly unlikely that a production area can be allocated to a single city [58].

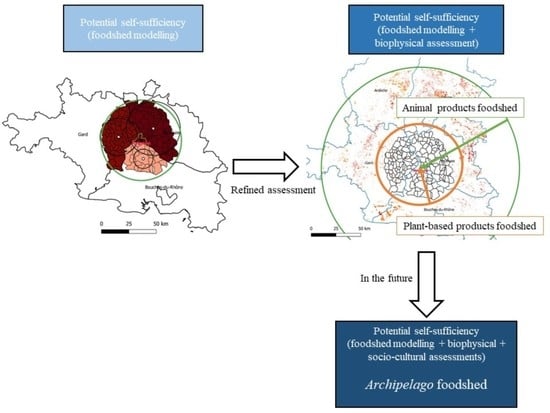
4.2. Foodshed and Self-Sufficiency Assessment: From the Isotropic Circle to the Archipelago Foodshed

An alternative method of supporting strategic discussions and decision-making based on empirical evidence to allocating agricultural areas and land use in order to enhance regional self-sufficiency would be to create multiple foodsheds according to the main food production types. The foodshed pattern would not necessarily be centered on the city: geomorphological and pedoclimatic criteria do not necessarily select areas in physical contact with the city, and socioeconomic and cultural habits may determine market chains geographically. The breeders supplying meat to Avignon, for example, are located mainly in the surrounding mountains (predominantly in the Southern Alps), where pastoral resources are naturally available (Figure 7). This is a common Mediterranean city model, in which cities are often located on a dry piedmont of mountains with more humid climates, but are historically integrated within the same economic and social territory [59].
There is, therefore, a major scientific challenge involved in shifting from a size (an isotropic circle) to a spatial configuration of the foodshed, which would certainly imply a discontinuous assembly of interconnected parts, which we call the ‘archipelago foodshed’; some of them can already be perceived in our foodshed assessment after considering the pedoclimatic and geomorphological constraints (Figure 8). Our research perspectives are founded on a well-known concept from ecological sciences and planning approaches: the ‘Biogeography of Islands’ theory [60,61]. This states that the specific richness of an island is correlated to its size and the distance from other islands or continental sources of new species. Reasoning by analogy, when physical contact between urban and agricultural areas is not possible, the most appropriate production areas for connection with the city are those closest and large enough to provide sufficient agricultural produce to supply a food chain. In the landscape, urban, and regional planning field, the archipelago is a visual metaphor for an anisotropic space defined by the dimension of the islands (i.e., the different parts of the foodshed) and the distances between them [62,63,64]. Moreover, in regional economics, the archipelago notion highlights the relational efficacy of production processes, depending on the location of the production units [65]. Additionally, this socio-geographic concept could be enriched by linking it with others that are already existent, such as ‘Functional Urban Areas’ (https://ec.europa.eu/eurostat/web/cities/spatial-units)—defined as the city and its commuting zone—and by including or prioritizing those farms that apply sustainable management practices, such as agroecology [53,66,67], in the context of assessing and improving the environmental sustainability of the food system [9].
From this perspective, theoretical food self-sufficiency assessments considering the site-specific conditions of metropolitan city regions—such as the one presented in this study—become a suitable starting point for the definition of the size of the foodshed realistically, improving the knowledge of the current state of the food system, or informing policy-makers [4,29,33,34]. However, avenues for further research include rethinking the foodshed concept as an archipelago of parts, the barycenter of which might be located in the production area that is socially, historically and/or agroecologically connected most closely with the city. The challenge is, therefore, to provide a robust and unambiguous indicator—or set of indicators—connecting the city with the farming areas within this archipelago foodshed. Further research could usefully select a set of production areas to meet the food self-sufficiency objective, by developing the ‘reserve-site-selection approach’ [68,69]. This would involve selecting, firstly, the most efficient area in terms of foodshed supply, and then the second best choice if necessary, continuing the procedure until the objective is fulfilled. In addition to mapping a more realistic foodshed pattern that is appropriate to guide public action and usable in decision-making, a multi-criterion indicator of the agricultural areas’ connection with the city could inform policy, for instance, by showing how the foodshed pattern is impacted when the prices of environmentally-friendly food products are positively weighted.
Finally, such an assessment could be used as a decision support methodology concerning the land use and food planning—such as, for example, the Plans Alimentaires Territoriaux (https://agriculture.gouv.fr/comment-construire-son-projet-alimentaire-territorial)—being developed in the region, or the specific urban food strategies promoting local agriculture and short food supply chains (e.g., the initiative promoted by the municipality of Avignon to serve local and organic beef in the menus of the canteens in public schools).

4.3. Potential Application of the Methodology to Other Study Cases

The MFSS model has a relatively high versatility, because the lack of data can be compensated for by applying some extrapolations and using default values. However, the lack of regional-scale data represents a trade-off with the accuracy of the assessment, as the model and the methodology are designed to be applied regionally. However, we highlight two variables that are of high importance for obtaining reliable and accurate results. Firstly, the availability of statistical data on regional crop yields, which leads us to indirectly include the site-specific pedoclimatic conditions in the assessment. These data are usually available because crop production and productivity are key agronomic data for farmers. Secondly, the share of UAA is also critical. However, this depends strongly on the pedoclimatic conditions and land cover. The selection can be performed, for example, with remote-sensing, land cover maps, and/or crop maps. The combination of these maps with other data and maps—such as edaphic properties—can be very helpful to improve the accuracy of the UAA selection. The availability of the data to estimate the UAA might be low, especially in developing countries where land cover maps may not be as precise as they are in other regions (e.g., the Corine Land Cover map in Europe).
Moreover, the MFSS model can be applied in city regions to develop scenarios considering dietary shifts (plant- vs. animal-based), population growth, the reduction of food losses and waste, producing systems (organic vs. conventional) [29], or to evaluate future policy targets (i.e., backcasting methodology) [34] and propose specific pathways to increase food self-sufficiency levels.

4.4. Limitations of the Study

The study provides a novel foodshed approach in order to improve the foodshed concept. However, some limitations must be highlighted. Firstly, the data on food consumption is from national estimations from the FAO; therefore, the differences between regions are not considered. Some differences in the dietary patterns might be expected because the area belongs to the Mediterranean part of France. The values of the regional food consumption in the area are estimated by some surveys, but they are shown in terms of dishes and processed food, making the translation to basic ingredients and crops very complex. Another limitation regarding the food consumption data is that they do not consider food wastage. Secondly, the assessment of the current food self-sufficiency is based on the use of the LPIS database and RPG map, which are constructed from cadastral data related to CAP payments, and, therefore, some plots might not be included in the assessment, leading to an underestimation of the real cultivated area. Thirdly, socioeconomic and cultural variables have not been considered to propose the expanded foodsheds, which are based only on biophysical constraints. Finally, the study does not cover explicitly potential overlaps with neighboring foodsheds.

5. Conclusions

Our study demonstrates that a quantitative food assessment combined with maps showing specific biophysical information might be a suitable and realistic approach for assessing food self-sufficiency at a regional level. These studies can become a suitable starting point for the definition of the size of the foodsheds, and in order to improve the knowledge of the current state of the food system. In this line, our results proposing two different foodsheds – one for animal products and another one for plant-based – have been demonstrated to perform realistically.
However, we believe that rethinking the foodshed concept is needed. For instance, to recognize that food supply and demand might be a result of social, historical, cultural and/or agroecological issues and, therefore, other concepts like the archipelago foodshed should be considered. In this regard, future studies should address the combination of the biophysical with the socio-cultural dimensions.

Supplementary Materials

The following are available online at https://www.mdpi.com/2077-0472/11/2/143/s1. Table S1: Surface and population of the communes of Bouches-du-Rhône, Table S2: Surface and population of the communes of Gard, Table S3: Surface and population of the communes of Vaucluse. Table S4: Food consumption and yields, Table S5: Area demand, current crop area, and current self-sufficiency.

Author Contributions

Conceptualization, A.P., J.L.V.-V., E.S.-S., C.N. and M.M.; validation, E.S.-S., C.N., M.M. and J.L.V.-V.; formal analysis, J.L.V.-V. and E.S.-S.; resources, A.P.; writing—original draft preparation, J.L.V.-V., E.S.-S. and C.N.; writing—review and editing, E.S.-S., and A.P.; supervision, J.L.V.-V. and E.S.-S. All authors have read and agreed to the published version of the manuscript.

Funding

This study is framed within the ‘FOODSHIFT2030’ project, and recieved funding from the European Union’s Horizon 2020 research and innovation program under grant agreement number 862716.

Institutional Review Board Statement

Not applicable.

Informed Consent Statement

Not applicable.

Data Availability Statement

Not applicable.

Acknowledgments

The authors want to thank the anonymous reviewers for their diligent work and their helpful advice.

Conflicts of Interest

The authors declare no conflict of interest.

References

  1. Deverre, C.; Traversac, J.-B. Local Food: A Concret Utopia. Métropolitiques. 2012. Available online: https://metropolitiques.eu/Local-food-a-concrete-Utopia.html (accessed on 19 January 2021).
  2. Hinrichs, C.C. Regionalizing food security? Imperatives, intersections and contestations in a post-9/11 world. J. Rural Stud. 2013, 29, 7–18. [Google Scholar] [CrossRef]
  3. Moragues-Faus, A. Distributive food systems to build just and liveable futures. Agric. Hum. Values 2020, 37, 583–584. [Google Scholar] [CrossRef] [PubMed]
  4. Carey, J. Who Feeds Bristol? Towards a Resilient Food Plan; Bristol City Council: Bristol, UK, 2011. [Google Scholar]
  5. Pradhan, P.; Kriewald, S.; Costa, L.; Rybski, D.; Benton, T.G.; Fischer, G.; Kropp, J.P. Urban food systems: How regionalization can contribute to climate change mitigation. Env. Sci. Technol. 2020, 54, 10551–10560. [Google Scholar] [CrossRef] [PubMed]
  6. Vicente-Vicente, J.L.; Piorr, A. Can a shift to regional and organic diets reduce greenhouse gas emissions from the food system? A case study from Qatar. Carbon Balance Manag. 2021, 16, 2. [Google Scholar] [CrossRef]
  7. Doernberg, A.; Horn, P.; Zasada, I.; Piorr, A. Urban food policies in German city regions: An overview of key players and policy instruments. Food Policy 2019, 89, 101782. [Google Scholar] [CrossRef]
  8. Piorr, A.; Zasada, I.; Doernberg, A.; Zoll, F.; Ramme, W. Research for AGRI Committee—Urban and Peri-Urban Agriculture in the EU; European Parliament: Brussels, Belgium, 2018. [Google Scholar]
  9. Béné, C.; Oosterveer, P.; Lamotte, L.; Brouwer, I.D.; de Haan, S.; Prager, S.D.; Talsma, E.F.; Khoury, C.K. When food systems meet sustainability—Current narratives and implications for actions. World Dev. 2019, 113, 116–130. [Google Scholar] [CrossRef]
  10. European Union. From Farm to Fork Strategy: For a Fair, Healthy and Environmentally-Friendly Food System; European Commission: Brussels, Belgium, 2020. [Google Scholar]
  11. Puma, M.J.; Bose, S.; Chon, S.Y.; Cook, B.I. Assessing the evolving fragility of the global food system. Environ. Res. Lett. 2015, 10, 024007. [Google Scholar] [CrossRef]
  12. SAPEA. A Sustainable Food System for the European Union; SAPEA: Berlin, Germany, 2020; pp. 161–194. [Google Scholar]
  13. Wezel, A.; Herren, B.G.; Kerr, R.B.; Barrios, E.; Gonçalves, A.L.R.; Sinclair, F. Agroecological principles and elements and their implications for transitioning to sustainable food systems. A review. Agron. Sustain. Dev. 2020, 40, 40. [Google Scholar] [CrossRef]
  14. Willett, W.; Rockström, J.; Loken, B.; Springmann, M.; Lang, T.; Vermeulen, S.; Garnett, T.; Tilman, D.; DeClerck, F.; Wood, A.; et al. Food in the Anthropocene: The EAT–Lancet Commission on healthy diets from sustainable food systems. Lancet 2019, 393, 447–492. [Google Scholar] [CrossRef]
  15. Pradhan, P.; Lüdeke, M.K.B.; Reusser, D.E.; Kropp, J.P. Food self-sufficiency across scales: How local can we go? Environ. Sci. Technol. 2014, 48, 9463–9470. [Google Scholar] [CrossRef]
  16. Macleod, G.; Jones, M. Territorial, scalar, networked, connected: In what sense a ‘regional world’? Reg. Stud. 2007, 41, 1177–1191. [Google Scholar] [CrossRef] [Green Version]
  17. Clancy, K.; Ruhf, K. Is local enough? Some arguments for regional food Systems. Choices 2010, 5, 5. [Google Scholar]
  18. Moreno Perez, O.; de Benito, C.; Sanz Sanz, E.; Simón Rojo, M.; Yacamán Ochoa, C. DIVERCROP Project—Deliverable 5.2: Possibilities to Reconnect Urban Consumption to Peri-Urban Agriculture. Avignon, France, 2019. [Google Scholar]
  19. Bala, B.K.; Alias, E.F.; Arshad, F.M.; Noh, K.M.; Hadi, A.H.A. Modelling of food security in Malaysia. Simul. Model. Pract. Theory 2014, 47, 152–164. [Google Scholar] [CrossRef]
  20. Godenau, D.; Caceres-Hernandez, J.J.; Martin-Rodriguez, G.; Gonzalez-Gomez, J.I. A consumption-oriented approach to measuring regional food self-sufficiency. Food Sec. 2020, 12, 1049–1063. [Google Scholar] [CrossRef]
  21. Hara, Y.; Murakami, A.; Tsuchiya, K.; Palijon, A.M.; Yokohari, M. A quantitative assessment of vegetable farming on vacant lots in an urban fringe area in Metro Manila: Can it sustain long-term local vegetable demand? Appl. Geogr. 2013, 41, 195–206. [Google Scholar] [CrossRef]
  22. Karg, H.; Drechsel, P.; Akoto-Danso, E.K.; Glaser, R.; Nyarko, G.; Buerkert, A. Foodsheds and city region food systems in two West African cities. Sustainability 2016, 8, 1175. [Google Scholar] [CrossRef] [Green Version]
  23. Moschitz, H.; Frick, R. City Food Flow Analysis. A New Method to Study Local Consumption; Renewable Agriculture and Food Systems; Cambridge University Press: Cambridge, UK, 2020; pp. 1–13. [Google Scholar] [CrossRef]
  24. Osei-Owusu, A.K.; Kastner, T.; de Ruiter, H.; Thomsen, M.; Caro, D. The global cropland footprint of Denmark’s food supply 2000–2013. Glob. Environ. Chang. 2019, 58, 101978. [Google Scholar] [CrossRef]
  25. Tedesco, C.; Petit, C.; Billen, G.; Garnier, J.; Personne, E. Potential for recoupling production and consumption in peri-urban territories: The case-study of the Saclay Plateau near Paris, France. Food Policy 2017, 69, 35–45. [Google Scholar] [CrossRef]
  26. Rothwell, A.; Ridoutt, B.; Page, G.; Bellotti, W. Feeding and housing the urban population: Environmental impacts at the peri-urban interface under different land-use scenarios. Land Use Policy 2015, 48, 377–388. [Google Scholar] [CrossRef] [Green Version]
  27. Saha, M.; Eckelman, M.J. Growing fresh fruits and vegetables in an urban landscape: A geospatial assessment of ground level and rooftop urban agriculture potential in Boston, USA. Landsc. Urban Plan. 2017, 165, 130–141. [Google Scholar] [CrossRef]
  28. Schreiber, K.; Hickey, G.M.; Metson, G.S.; Robinson, B.E.; MacDonald, G.K. Quantifying the foodshed: A systematic review of urban food flow and local food self-sufficiency research. Env. Res. Lett. 2020, 16, 023003. [Google Scholar] [CrossRef]
  29. Zasada, I.; Schmutz, U.; Wascher, D.; Kneafsey, M.; Corsi, S.; Mazzocchi, C.; Boyce, P.; Doernberg, A.; Sali, G.; Piorr, A. City, culture and society food beyond the city—Analysing foodsheds and self-sufficiency for different food system scenarios in European metropolitan regions. City Cult. Soc. 2019, 16, 25–35. [Google Scholar] [CrossRef]
  30. Joseph, S.; Peters, I.; Friedrich, H. Can regional organic agriculture feed the regional community? A case study for Hamburg and North Germany. Ecol. Econ. 2019, 164, 106342. [Google Scholar] [CrossRef]
  31. Kurtz, J.E.; Woodbury, P.B.; Ahmed, Z.U.; Peters, C.J. Mapping U.S. food system localization potential: The impact of diet on foodsheds. Env. Sci. Technol. 2020, 54, 12434–12446. [Google Scholar] [CrossRef]
  32. Orlando, F.; Spigarolo, R.; Alali, S.; Bocchi, S. The role of public mass catering in local foodshed governance toward self-reliance of metropolitan regions. Sustain. Cities Soc. 2019, 44, 152–162. [Google Scholar] [CrossRef]
  33. Świader, M.; Szewrański, S.; Kazak, J.K. Foodshed as an example of preliminary research for conducting environmental carrying capacity analysis. Sustainability 2018, 10, 882. [Google Scholar] [CrossRef] [Green Version]
  34. Tavakoli-Hashjini, E.; Piorr, A.; Müller, K.; Vicente-Vicente, J.L. Potential bioenergy production from Miscanthus × Giganteus in Brandenburg: Producing bioenergy and fostering other ecosystem services while ensuring food self-sufficiency in the Berlin-Brandenburg region. Sustainability 2020, 12, 7731. [Google Scholar] [CrossRef]
  35. Wegerif, M.C.A.; Wiskerke, J.S.C. Exploring the staple foodscape of Dar Es Salaam. Sustainability 2017, 9, 1081. [Google Scholar] [CrossRef] [Green Version]
  36. Liao, F.H.; Gordon, B.; DePhelps, C.; Saul, D.; Fan, C.; Feng, W. A land-based and spatial assessment of local food capacity in Northern Idaho, USA. Land 2019, 8, 121. [Google Scholar] [CrossRef] [Green Version]
  37. Porter, J.R.; Dyball, R.; Dumaresq, D.; Deutsch, L.; Matsuda, H. Feeding capitals: Urban food security and self-provisioning in Canberra, Copenhagen and Tokyo. Glob. Food Sec. 2014, 3, 1–7. [Google Scholar] [CrossRef]
  38. Kriewald, S.; Pradhan, P.; Costa, L.; Ros, A.G.C.; Kropp, J.P. Hungry cities: How local food self-sufficiency relates to climate change, diets, and urbanisation. Environ. Res. Lett. 2019, 14, 094007. [Google Scholar] [CrossRef]
  39. Kinnunen, P.; Guillaume, J.H.A.; Taka, M.; D’Odorico, P.; Siebert, S.; Puma, M.J.; Jalava, M.; Kummu, M. Local food crop production can fulfil demand for less than one-third of the population. Nat. Food 2020, 1, 229–237. [Google Scholar] [CrossRef]
  40. Sanz Sanz, E.; Martinetti, D.; Napoléone, C. Operational modelling of peri-urban farmland for public action in Mediterranean context. Land Use Policy 2018, 75, 757–771. [Google Scholar] [CrossRef]
  41. Sanz Sanz, E.; Napoléone, C.; Hubert, B. A systemic methodology to characterize peri-urban agriculture for a better integration of agricultural stakes in urban planning. Espace Geogr. 2017, 46, 174–190. [Google Scholar] [CrossRef]
  42. FranceAgriMer. Chiffres-Clés 2016: Les Filières des Fruits et Légumes—Données 2016. 2017. Available online: https://www.franceagrimer.fr/fam/content/download/55358/document/chiffres%20cl%C3%A9s%202016%20FL.pdf?version=9 (accessed on 19 January 2021).
  43. Agreste Provence-Alpes-Côte d’Azur. Mémento de La Statistique Agricole de La Forêt et Des Industries Agroalimentaires; La préfecture et les services de l’État en région Provenc: Marseille, France, 2019. [Google Scholar]
  44. Agreste Occitanie. Memento de La Statistique Agricole: Région Occitanie; Préfet de la Région Occitaine: Toulouse, France, 2019. [Google Scholar]
  45. European Soil Bureau Network European Commission. Soil Atlas of Europe; Joint Research Centre; European Soil Data Centre (ESDAC): Brussels, Belgium, 2005. [Google Scholar]
  46. Copernicus Land Monitoring Service. Corine Land Cover Map 2018. Available online: https://land.copernicus.eu/pan-european/corine-land-cover/clc2018 (accessed on 19 January 2021).
  47. Institut National de l’Information Géographique et Forestière. Registre Parcellaire Graphique; Institut National de l’Information Géographique et Forestière: Paris, France, 2014. [Google Scholar]
  48. Institut national de La Statistique (INSEE) et Des Études Économiques Bilan Démographique. Available online: https://www.insee.fr/fr/accueil (accessed on 20 September 2019).
  49. Panagos, P. The European Soil Database. GEO Connexion 2006, 5, 32–33. [Google Scholar]
  50. Copernicus Land Monitoring Service EU-DEM. 2017.
  51. QGIS. org QGIS Geographic Information System. 2020. [Google Scholar]
  52. Plakias, Z.T.; Klaiber, H.A.; Roe, B.E. Trade-offs in farm-to-school implementation: Larger foodsheds drive greater local food expenditures. J. Agr. Resour. Econ. 2020, 45, 232–243. [Google Scholar] [CrossRef]
  53. Zazo-Moratalla, A.; Troncoso-González, I.; Moreira-Muñoz, A. Regenerative food systems to restore urban-rural relationships: Insights from the Concepción metropolitan area foodshed (Chile). Sustainability 2019, 11, 2892. [Google Scholar] [CrossRef] [Green Version]
  54. Zasada, I.; Fertner, C.; Piorr, A.; Nielsen, T.S. Peri-urbanisation and multifunctional adaptation of agriculture around Copenhagen. Geogr. Tidsskr.—Danish J. Geogr. 2011, 111, 59–72. [Google Scholar] [CrossRef]
  55. Sinclair, R. Von Thünen and urban aprawl. Ann. Am. Assoc. Geogr. 1967, 57, 72–87. [Google Scholar] [CrossRef]
  56. Capt, D.; Schmitt, B. Economie spatiale et agriculture: Les dynamiques spatiales de l’agriculture contemporaine. RERU 2000, 3, 385–406. [Google Scholar]
  57. Filippini, R.; Marraccini, E.; Houdart, M.; Bonari, E.; Lardon, S. Food production for the city: Hybridization of farmers’ strategies between alternative and conventional food chains. Agroecol. Sustain. Food Syst. 2016, 40, 1058–1084. [Google Scholar] [CrossRef]
  58. Aubry, C.; Kebir, L. Shortening food supply chains: A means for maintaining agriculture close to urban areas? The case of the French metropolitan area of Paris. Food Policy 2013, 41, 85–93. [Google Scholar] [CrossRef]
  59. Braudel, F. La Méditerranée et Le Monde Méditerranéen à l’époque de Philippe II, 2nd ed.; Armand Colin: Paris, France, 1949; (revised 1966). [Google Scholar]
  60. MacArthur, R.H.; Wilson, E.O. The Theory of Island Biogeography; Princeton University Press: Princeton, NJ, USA, 1967; ISBN 0-691-08049-6. [Google Scholar]
  61. MacArthur, R.H.; Wilson, E.O. An equilibrium theory of insular zoogeography. Evolution 1963, 17, 373–387. [Google Scholar] [CrossRef]
  62. Chapuis, J.-Y.; Viard, J. Rennes, La Ville Archipel: Entretiens Avec Jean Viard; Aube: La Tour-d’Aigue, France, 2013; ISBN 978-2-8159-0754-5. [Google Scholar]
  63. Ungers, O.M.; Koolhaas, R. The City in the City: Berlin: A Green Archipelago; Hertweck, F., Marot, S., Eds.; Lars Müller Publishers: Zürich, Switzerland, 2013; ISBN 978-3-03778-326-9. [Google Scholar]
  64. Viganò, P. Les Territoires de L’urbanisme: Le Projet Comme Producteur de Connaissance; Mētispresses: Genève, Switzerland, 2014; ISBN 978-2-940406-88-3. [Google Scholar]
  65. Veltz, P. Mondialisation, Villes et Territoires: L’économie D’archipel, 2nd ed.; PUF: Paris, France, 2014; ISBN 978-2-13-062776-0. [Google Scholar]
  66. Cardoso, A.S.; Domingos, T.; de Magalhães, M.R.; de Melo-Abreu, J.; Palma, J. Mapping the Lisbon potential foodshed in Ribatejo e Oeste: A suitability and yield model for assessing the potential for localized food production. Sustainability 2017, 9, 2003. [Google Scholar] [CrossRef] [Green Version]
  67. Vaarst, M.; Escudero, A.G.; Chappell, M.J.; Brinkley, C.; Nijbroek, R.; Arraes, N.A.M.; Andreasen, L.; Gattinger, A.; De Almeida, G.F.; Bossio, D.; et al. Exploring the concept of agroecological food systems in a city-region context. Agroecol. Sustain. Food Syst. 2018, 42, 686–711. [Google Scholar] [CrossRef]
  68. Ay, J.-S.; Napoléone, C. Efficiency and equity in land conservation: The effects of policy scale. J. Env. Manag. 2013, 129, 190–198. [Google Scholar] [CrossRef] [Green Version]
  69. Kirkpatrick, J.B. An iterative method for establishing priorities for the selection of nature reserves: An example from Tasmania. Biol. Conserv. 1983, 25, 127–134. [Google Scholar] [CrossRef]
Figure 1. Location of Avignon (Vaucluse department) in South-East France, and the surrounding departments and regions (in bold) (A), and the location of the municipalities/communes (in red) forming the selected initial foodshed in a radius of 30 km around the municipality of Avignon (in green) (B). Note that the proposed foodshed belongs to two other departments (Gard and Bouches-du-Rhône), and is near the departments of Ardèche and Drôme to the North. Details on the population and surface area for each commune are given in the Supplementary Material (Tables S1–S3).
Agriculture 11 00143 g001
Figure 2. Location of the deep (80–120 cm) and very deep (>120 cm) soils in the foodshed area (in red), and in the surrounding areas of the different departments. The rest of the area is covered by soils with a shallow (0–40 cm) or moderate (40–80 cm) depth. The map also shows the altitudes in four categories (<200, 200–400, 400–800 and >800 m above sea level). Note that deep soils are usually located in low-altitude areas.
Agriculture 11 00143 g002
Figure 3. Scheme of the methodology followed in the study.
Agriculture 11 00143 g003
Figure 4. Mapping of the area demand (circles, in km) and food self-sufficiency (colors, expressed in %) for three departments (black) and for the whole foodshed proposed (green) based on the 30 km radius recommendation by the French Senate. See Table 1 for the specific values of the radius and area demand.
Agriculture 11 00143 g004
Figure 5. Distribution of commercial agricultural crops, excluding vineyards, and areas dedicated to feeding livestock (fodder, pastures and grasslands) in the foodshed. Our own elaboration based on the RPG map [47].
Agriculture 11 00143 g005
Figure 6. Current food self-sufficiency achieved by cereals, vegetables, pulses, fruit from temperate regions, and wine and grapes in the foodshed area. More information on the food groups and calculations is given in Table S5 in the Supplementary Material.
Agriculture 11 00143 g006
Figure 7. Current area used for extensive livestock farming in the five departments considered in the study (blue) in two radii around the city of Avignon: 60 and 100 km (black bold). Information on soil depth and altitude is also shown.
Agriculture 11 00143 g007
Figure 8. Current area used for livestock in the five departments considered in the study (blue) in the expanded foodshed proposed (radius of 100 km) (green bold). The areas under soils with >80 cm depth were excluded from the assessment.
Agriculture 11 00143 g008
Table 1. Results of the area demand, radius and self-sufficiency for the three departments and the whole foodshed.
DepartmentTotal AreaUAAPopulation Density Total Area DemandUAA per CapitaArea Demand per CapitaRadiusSelf-Sufficiency
Bouches-du-Rhône77,55644,79215023,7523861-9189
Gard123,59926,01015840,1031328-1765
Vaucluse149,45752,60627884,9731268-2562
Foodshed350,613123,408207148,827169820473783
Total area (ha), utilizable agricultural area (UAA) (ha), population density (inhabitants per km2), total area demand (ha), UAA per capita (m2 per capita), area demand per capita (m2 per capita), radius (km), and food self-sufficiency (%) values for the municipalities belonging to the three departments, and for the whole foodshed (radius: 30 km).
Table 2. Results of the area demand, current area used, and self-sufficiency of animal products for the three departments and the foodshed.
ProductArea Demand of Each Product Total area Demand of Each Department Current Area Used for Pastures and Fodder in the Foodshed Current Self-Sufficiency
Beef34,787---
Eggs6034--
Poultry 13,483---
Pork 24,023---
Milk and dairy51,484---
Mutton and goat3138---
Total 132,950---
Department
Bouches-du-Rhône-21,218682632
Gard-35,824430012
Vaucluse-75,90829944
Total 30 km Foodshed-132,95014,12011
Area demand per capita of organic animal products (beef, eggs, poultry, pork, milk and dairy products, and mutton and goat) (ha) of the population living within the foodshed of 30 km, an estimation of the current area used for livestock farming within the foodshed (ha), and the current food self-sufficiency (%) for the whole foodshed and the municipalities located in the three departments.
Publisher’s Note: MDPI stays neutral with regard to jurisdictional claims in published maps and institutional affiliations.

