
Classification of Lampung robusta Specialty Coffee According to Differences in Cherry Processing Methods Using UV Spectroscopy and Chemometrics


Abstract
1. Introduction
2. Materials and Methods
2.1. Samples
2.2. Coffee Extraction using Distilled Water
2.3. Spectral Measurement using UV-Visible Spectrometer
2.4. Chemometrics
2.5. Software
3. Results and Discussion
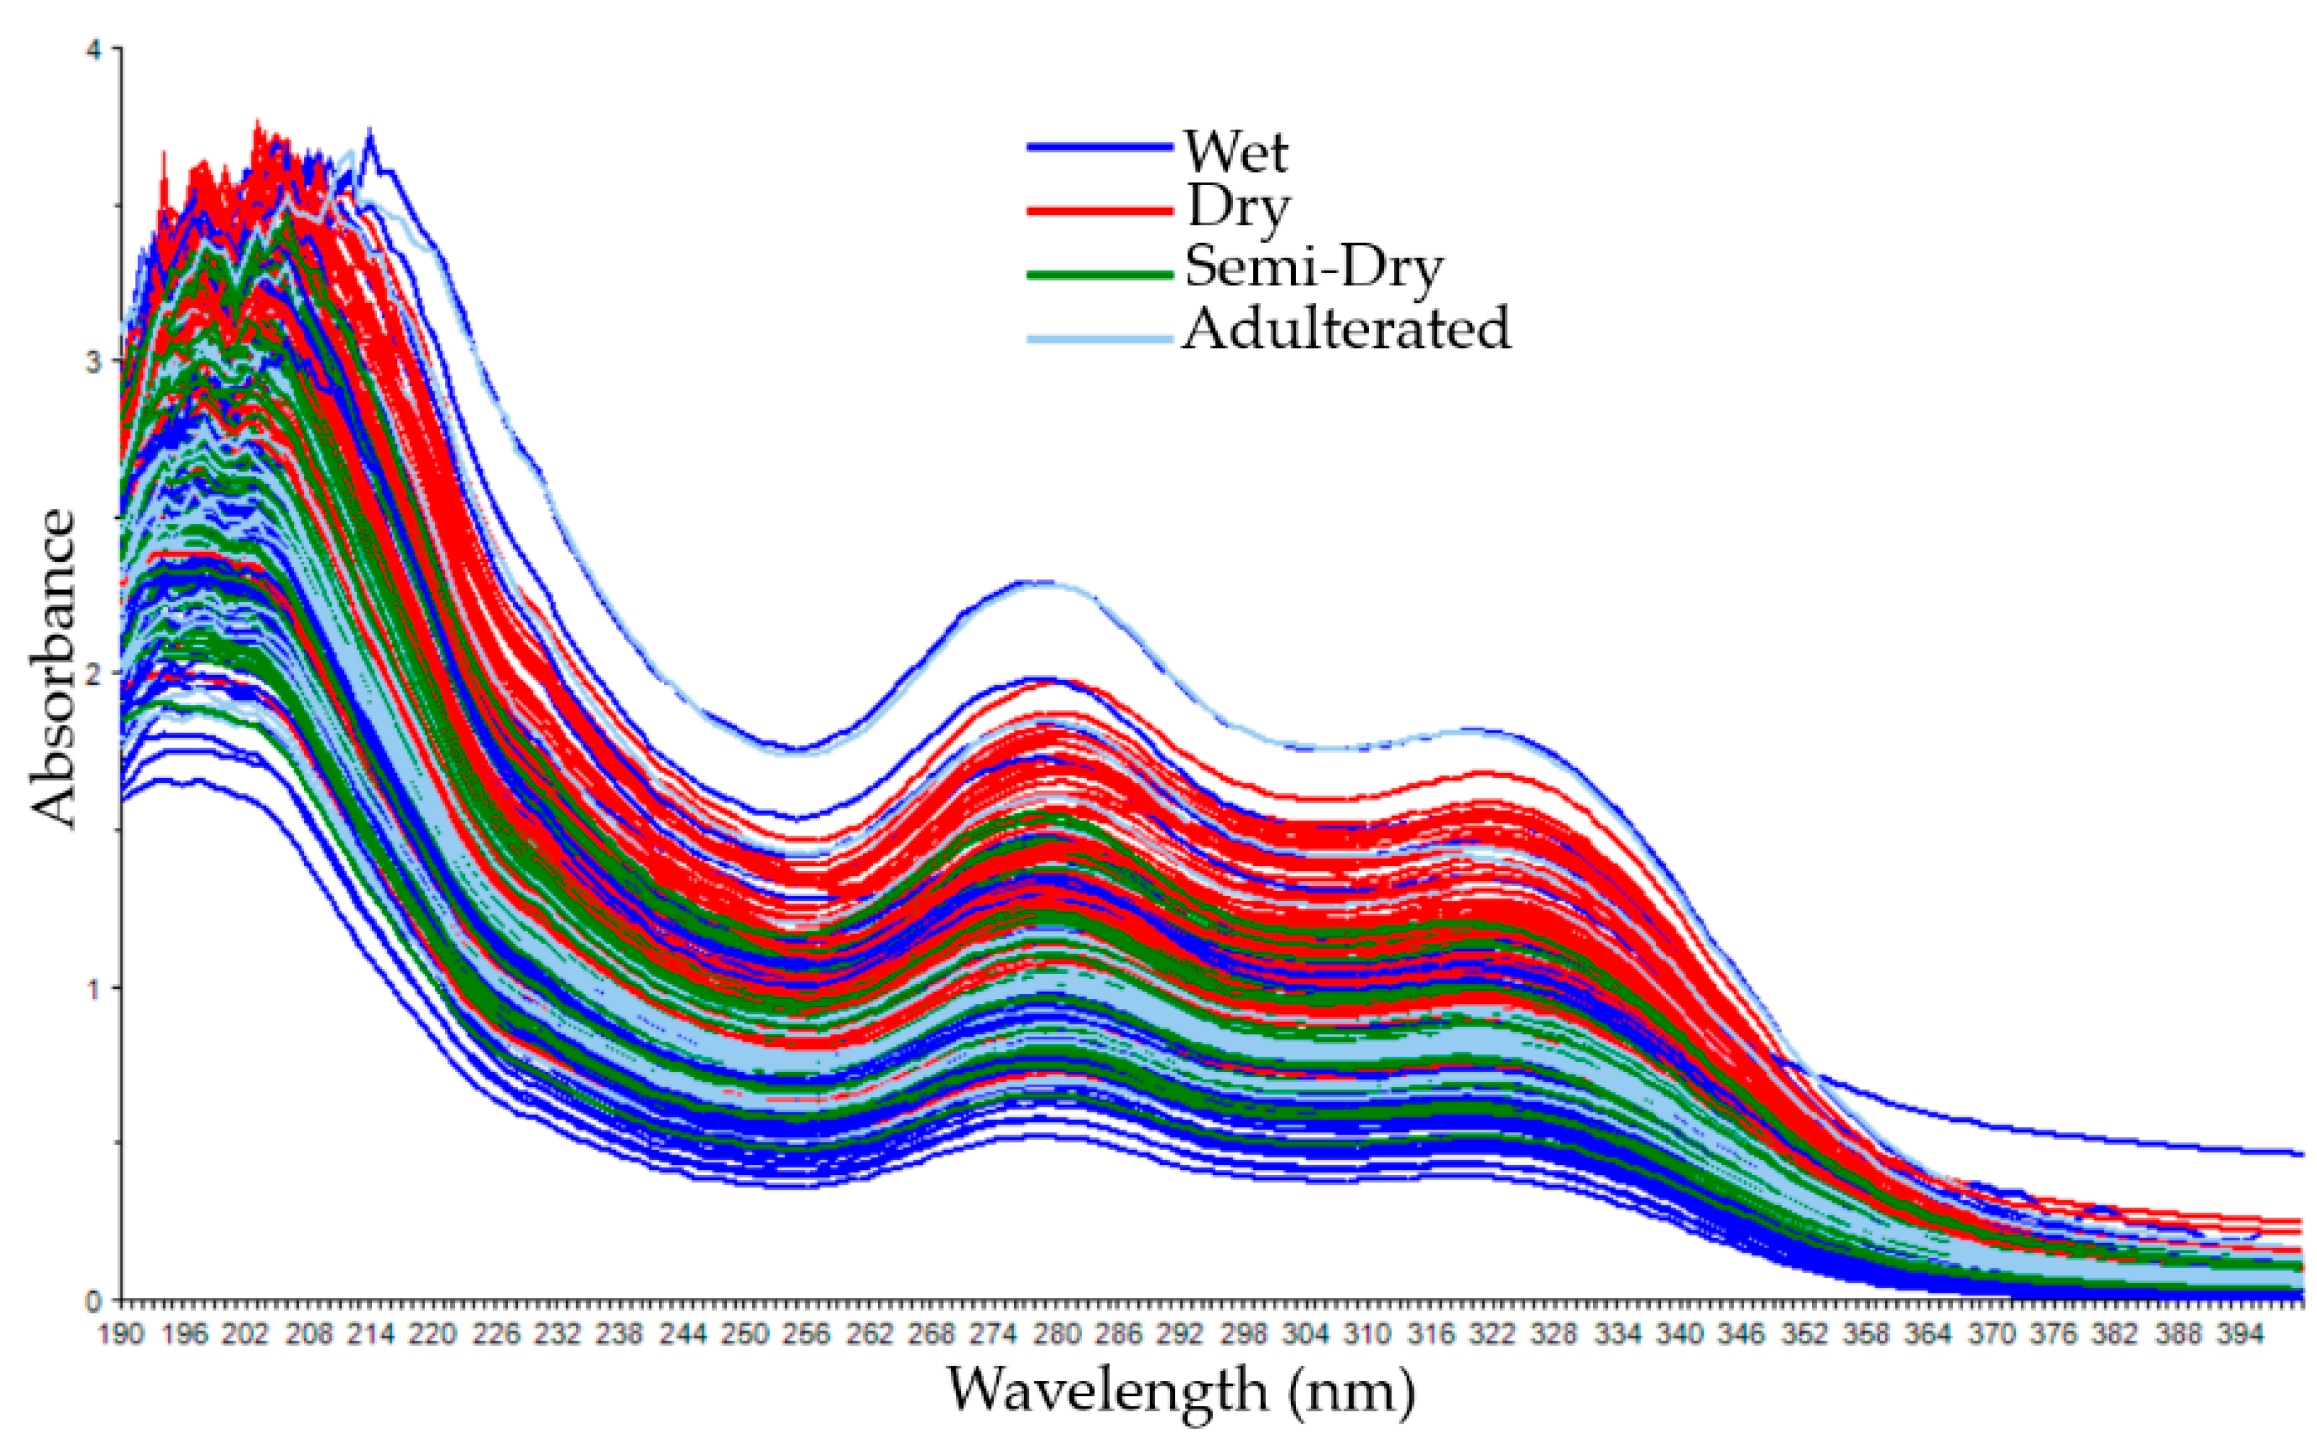
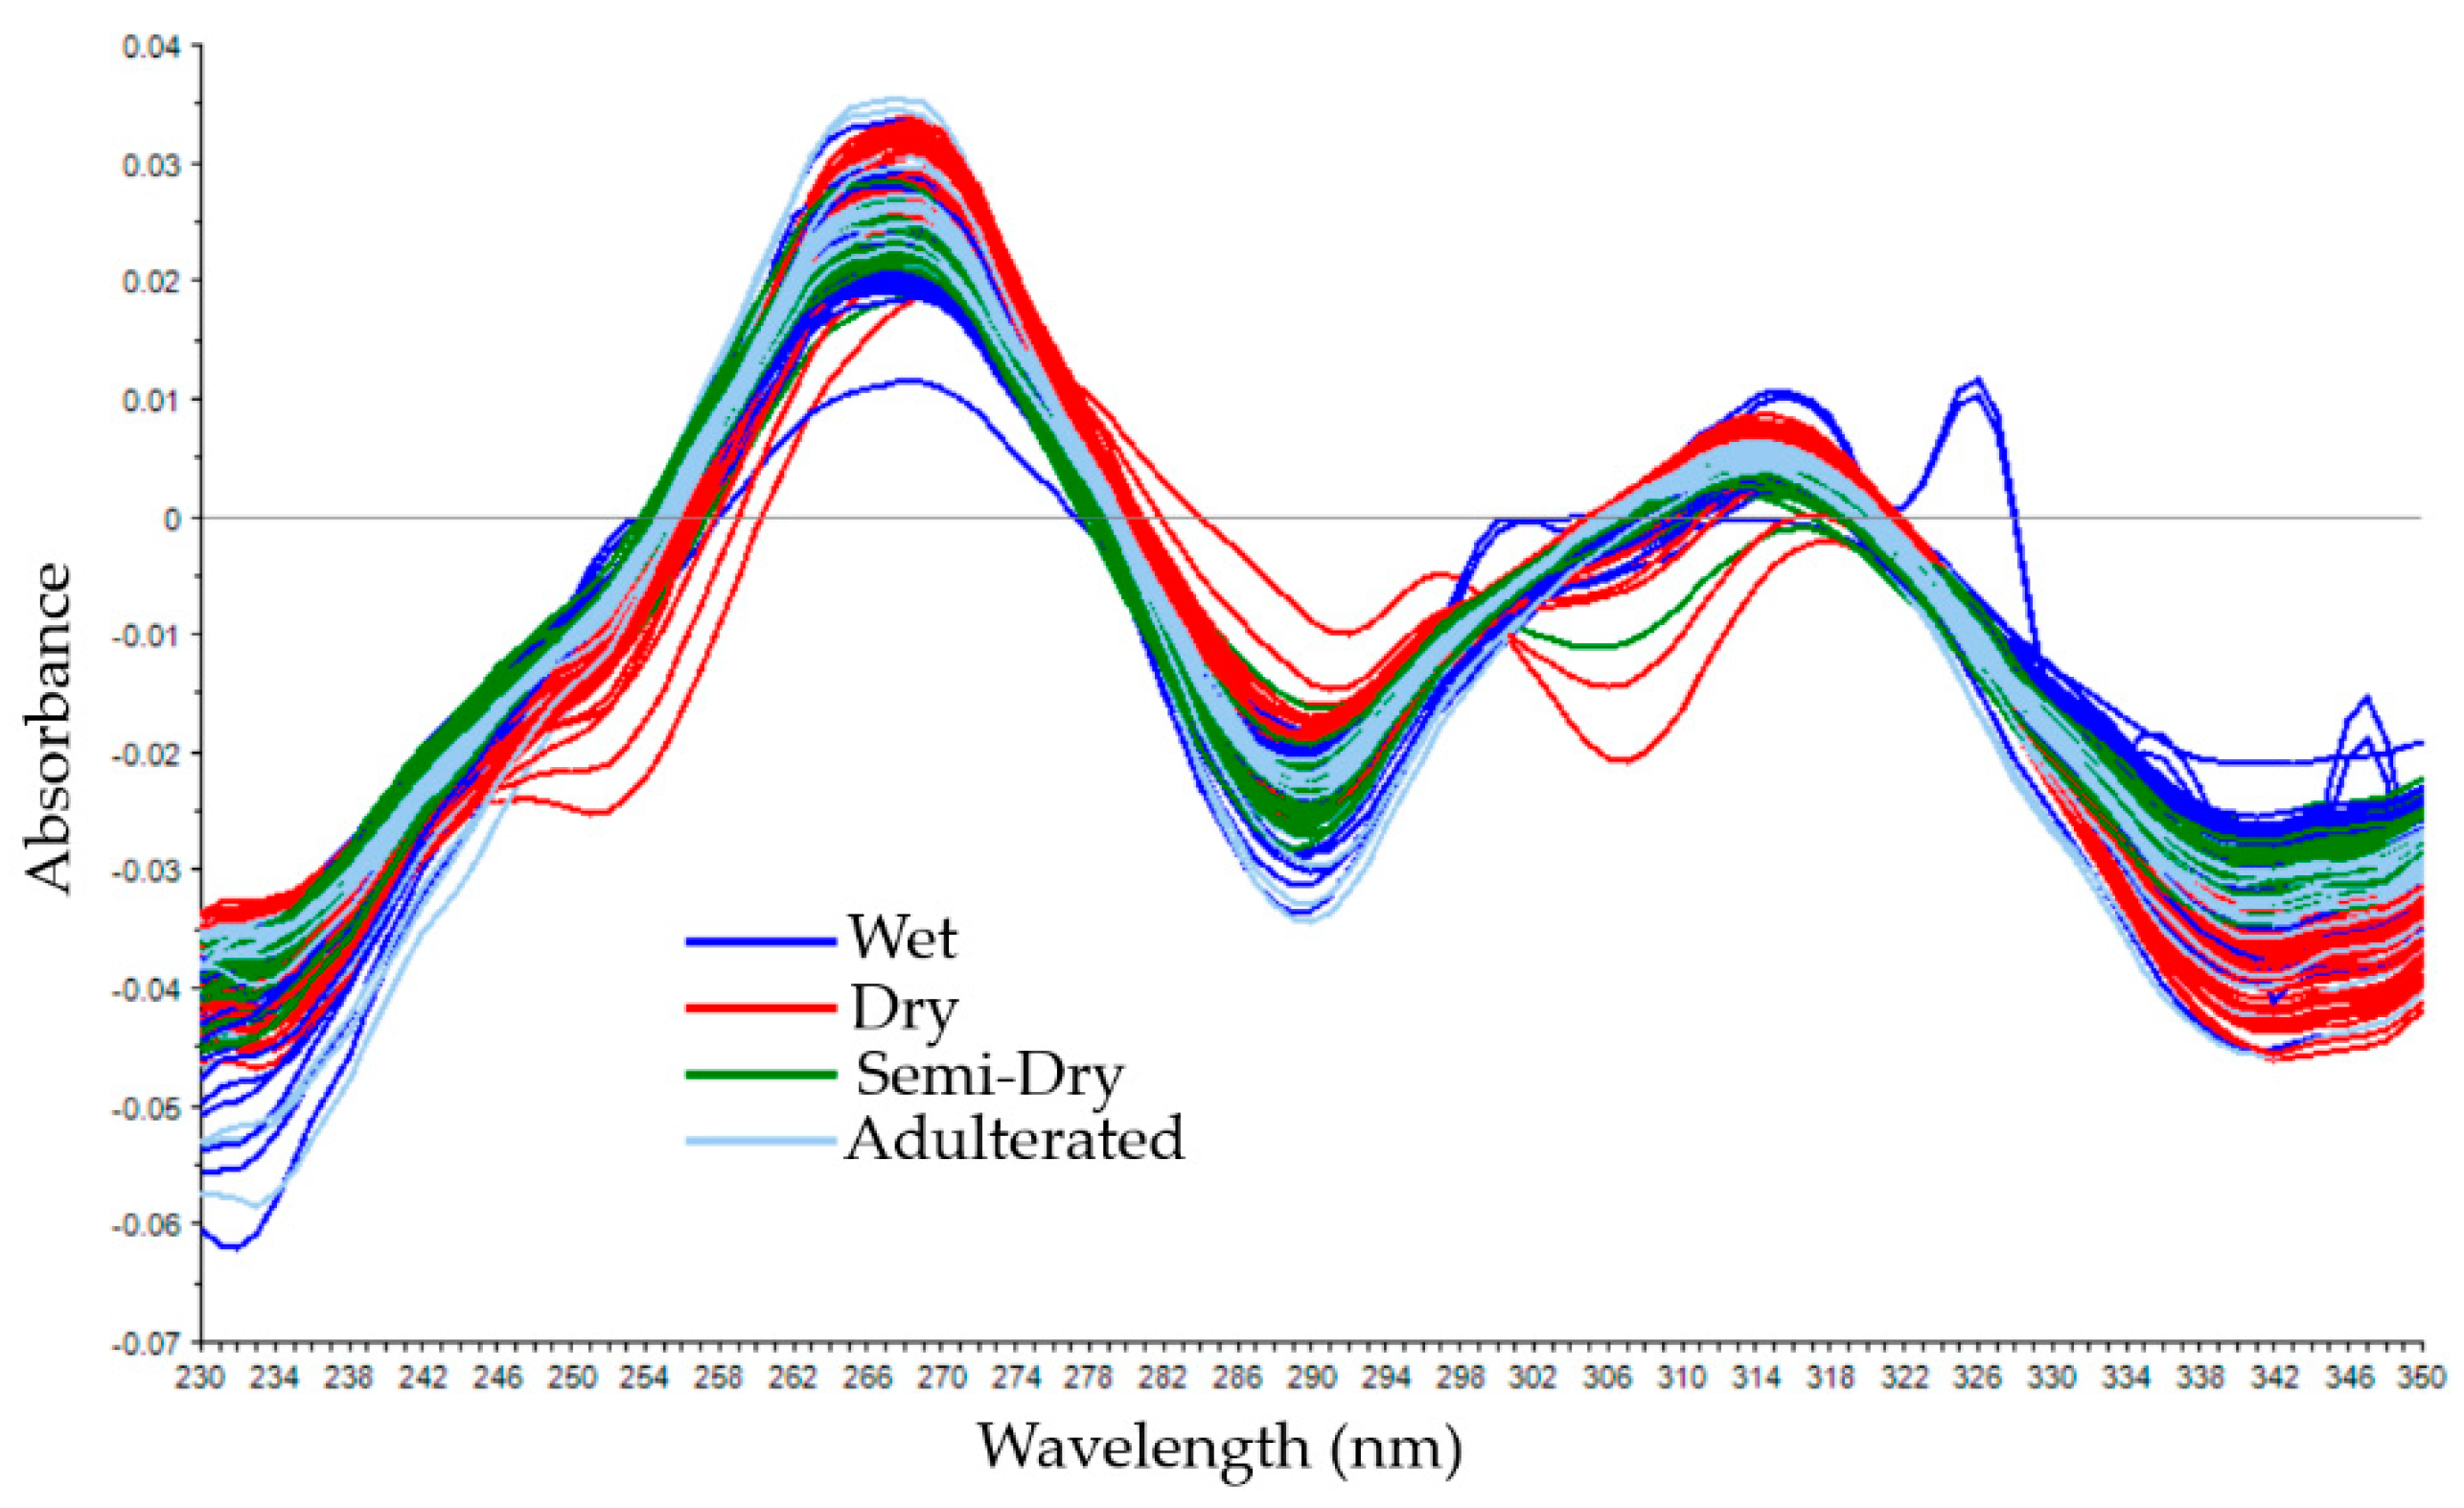
3.1. Spectral Data of Coffee Samples with Different Cherry Processing
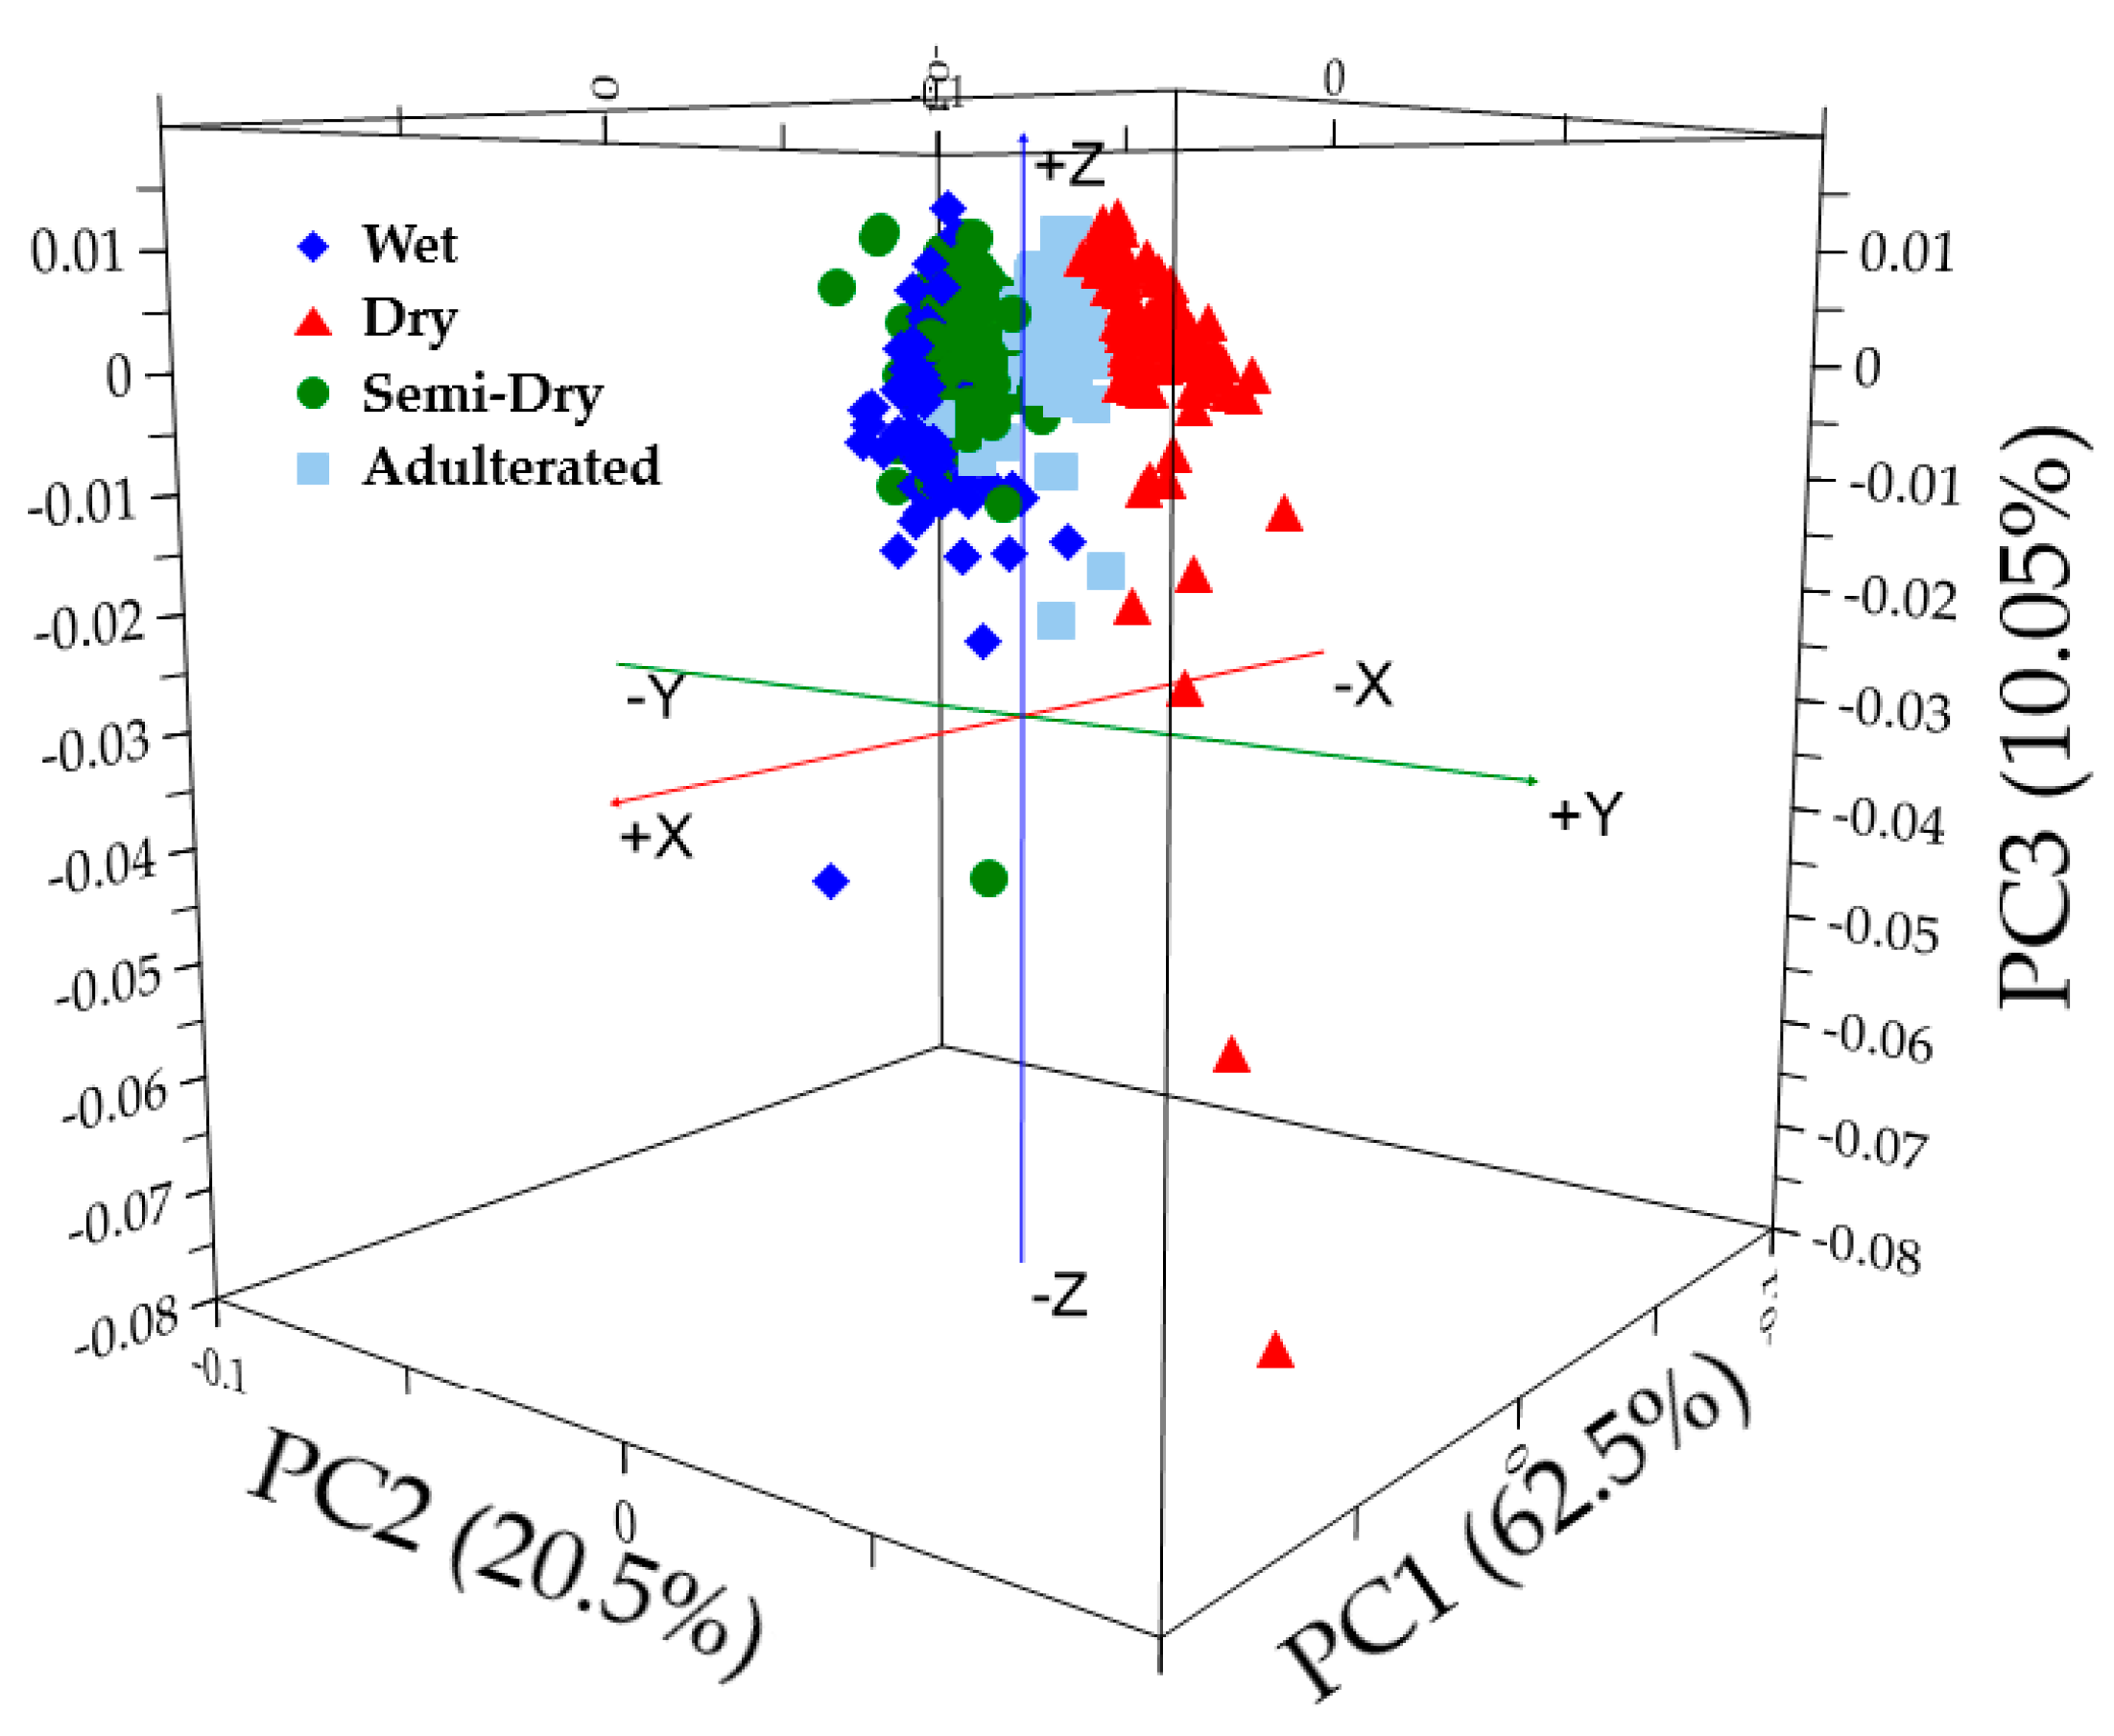
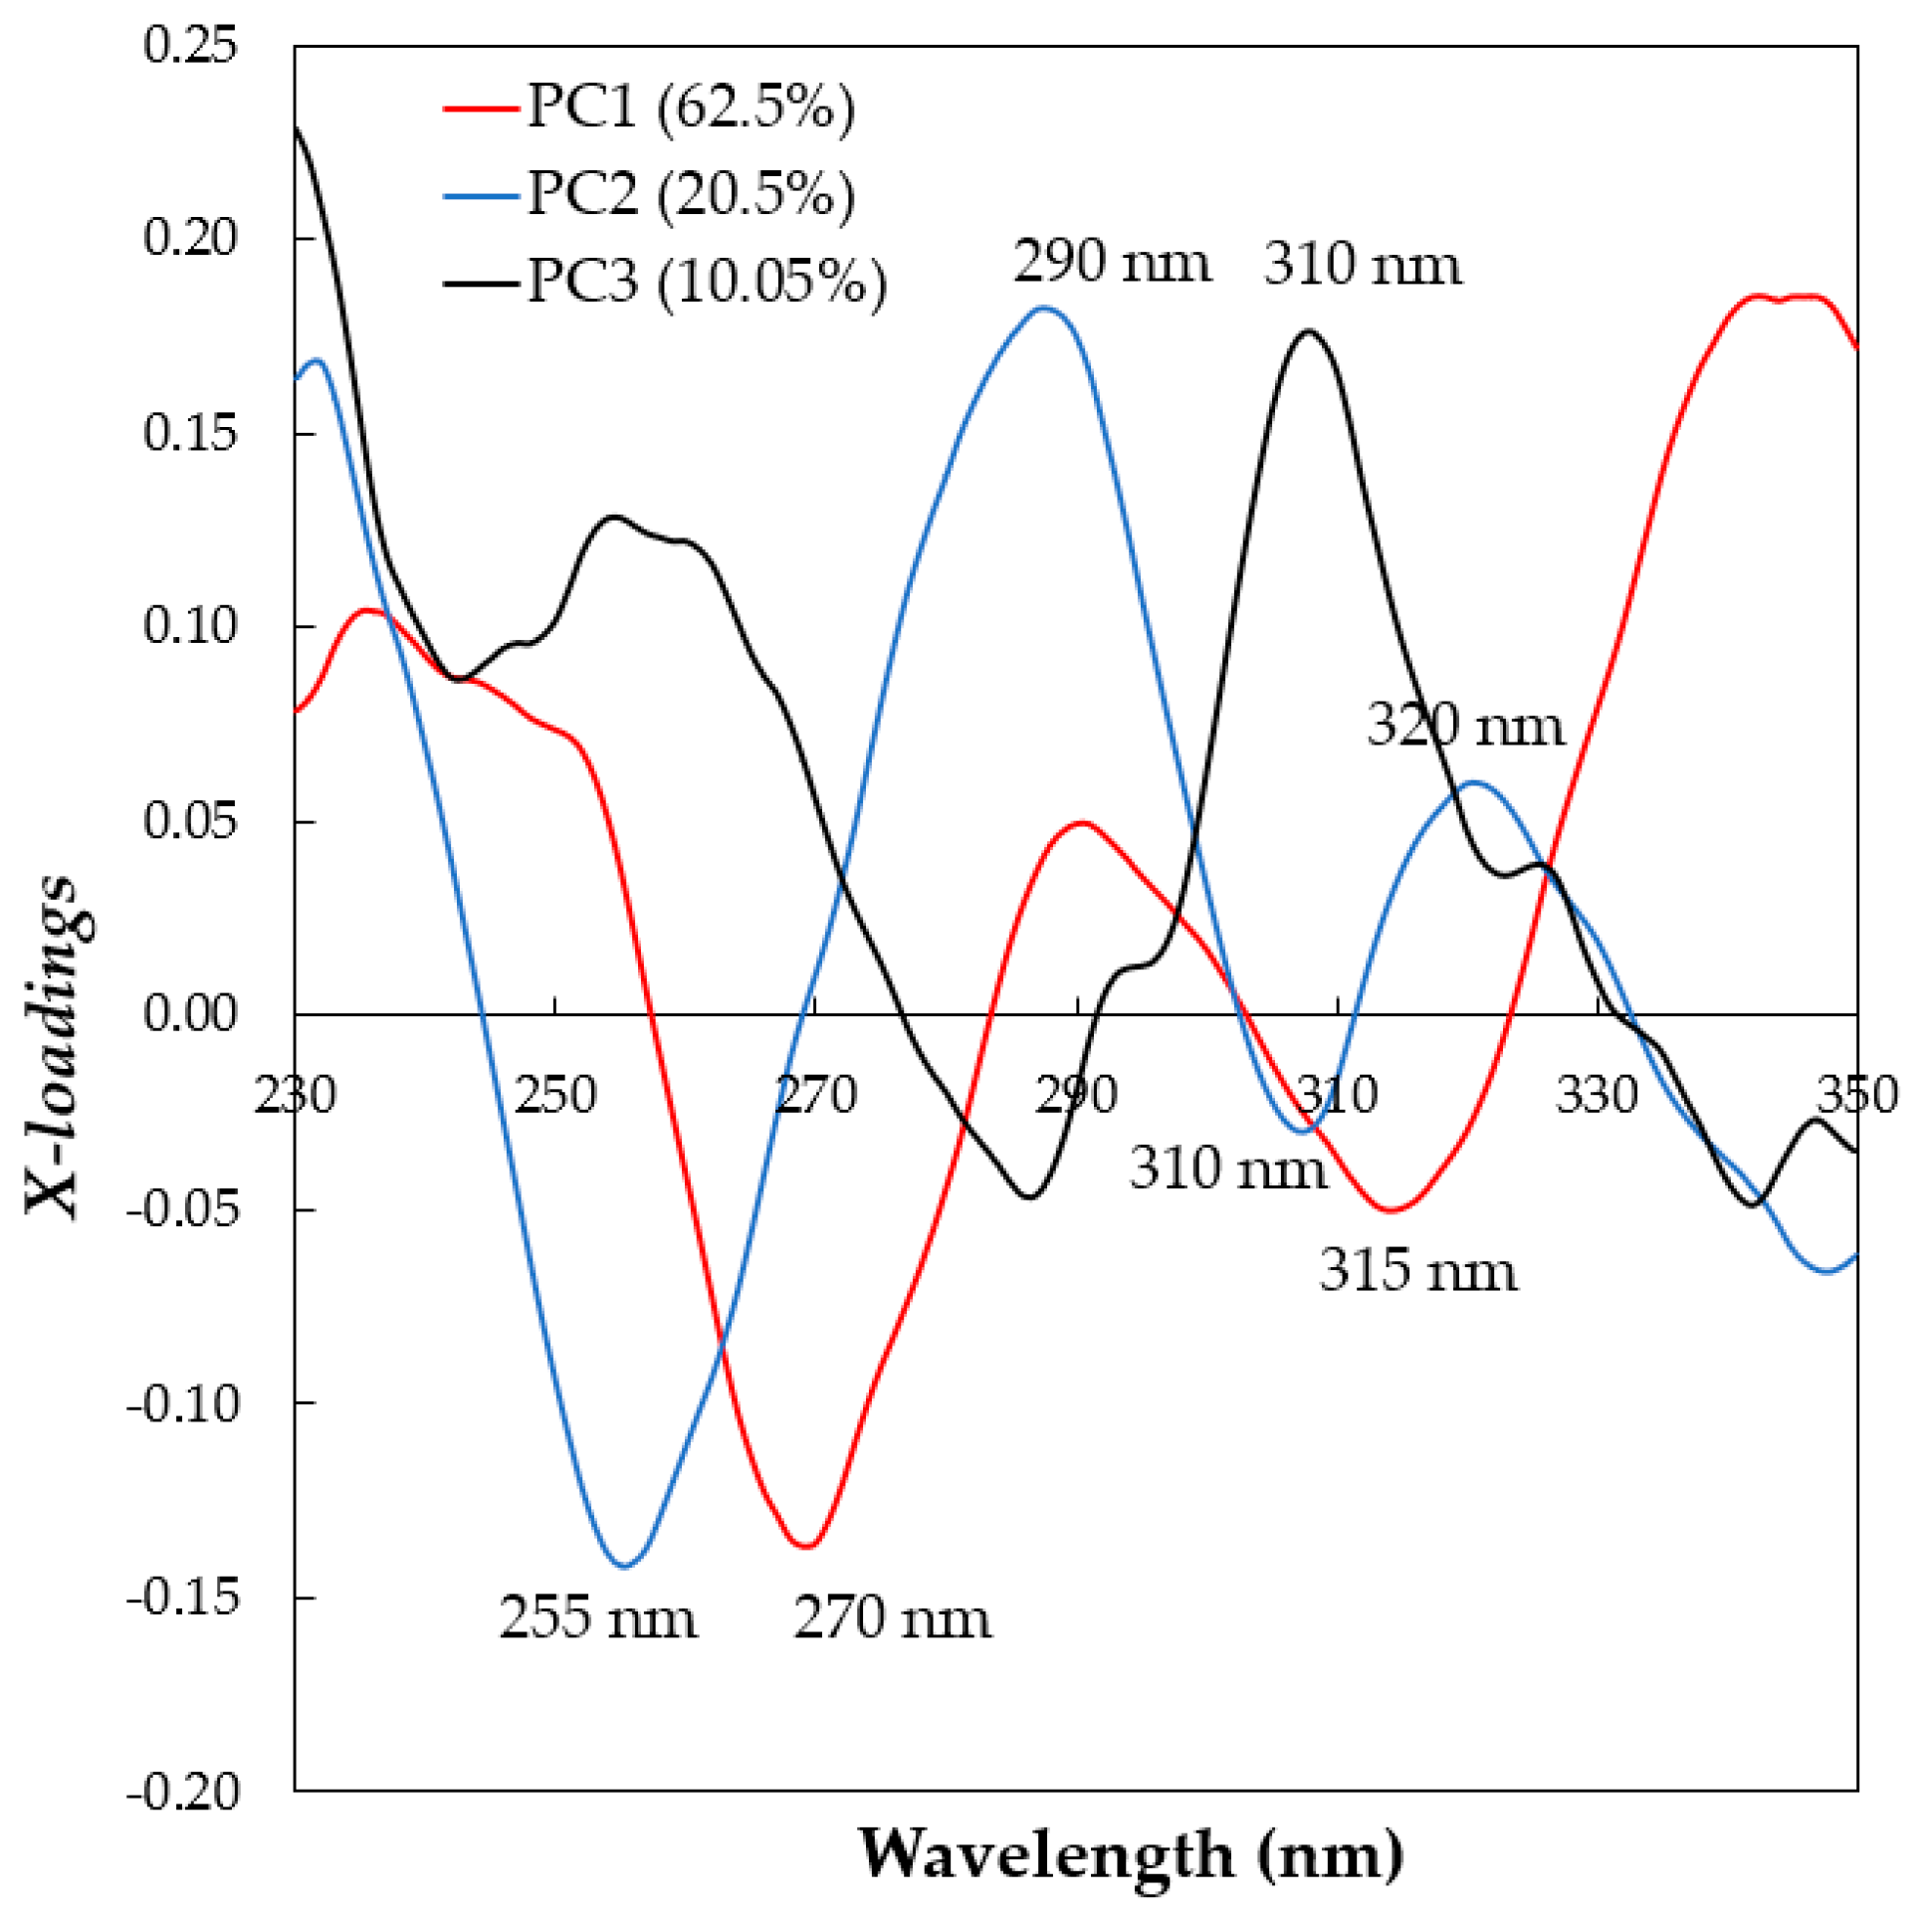
3.2. Principal Component Analysis (PCA)
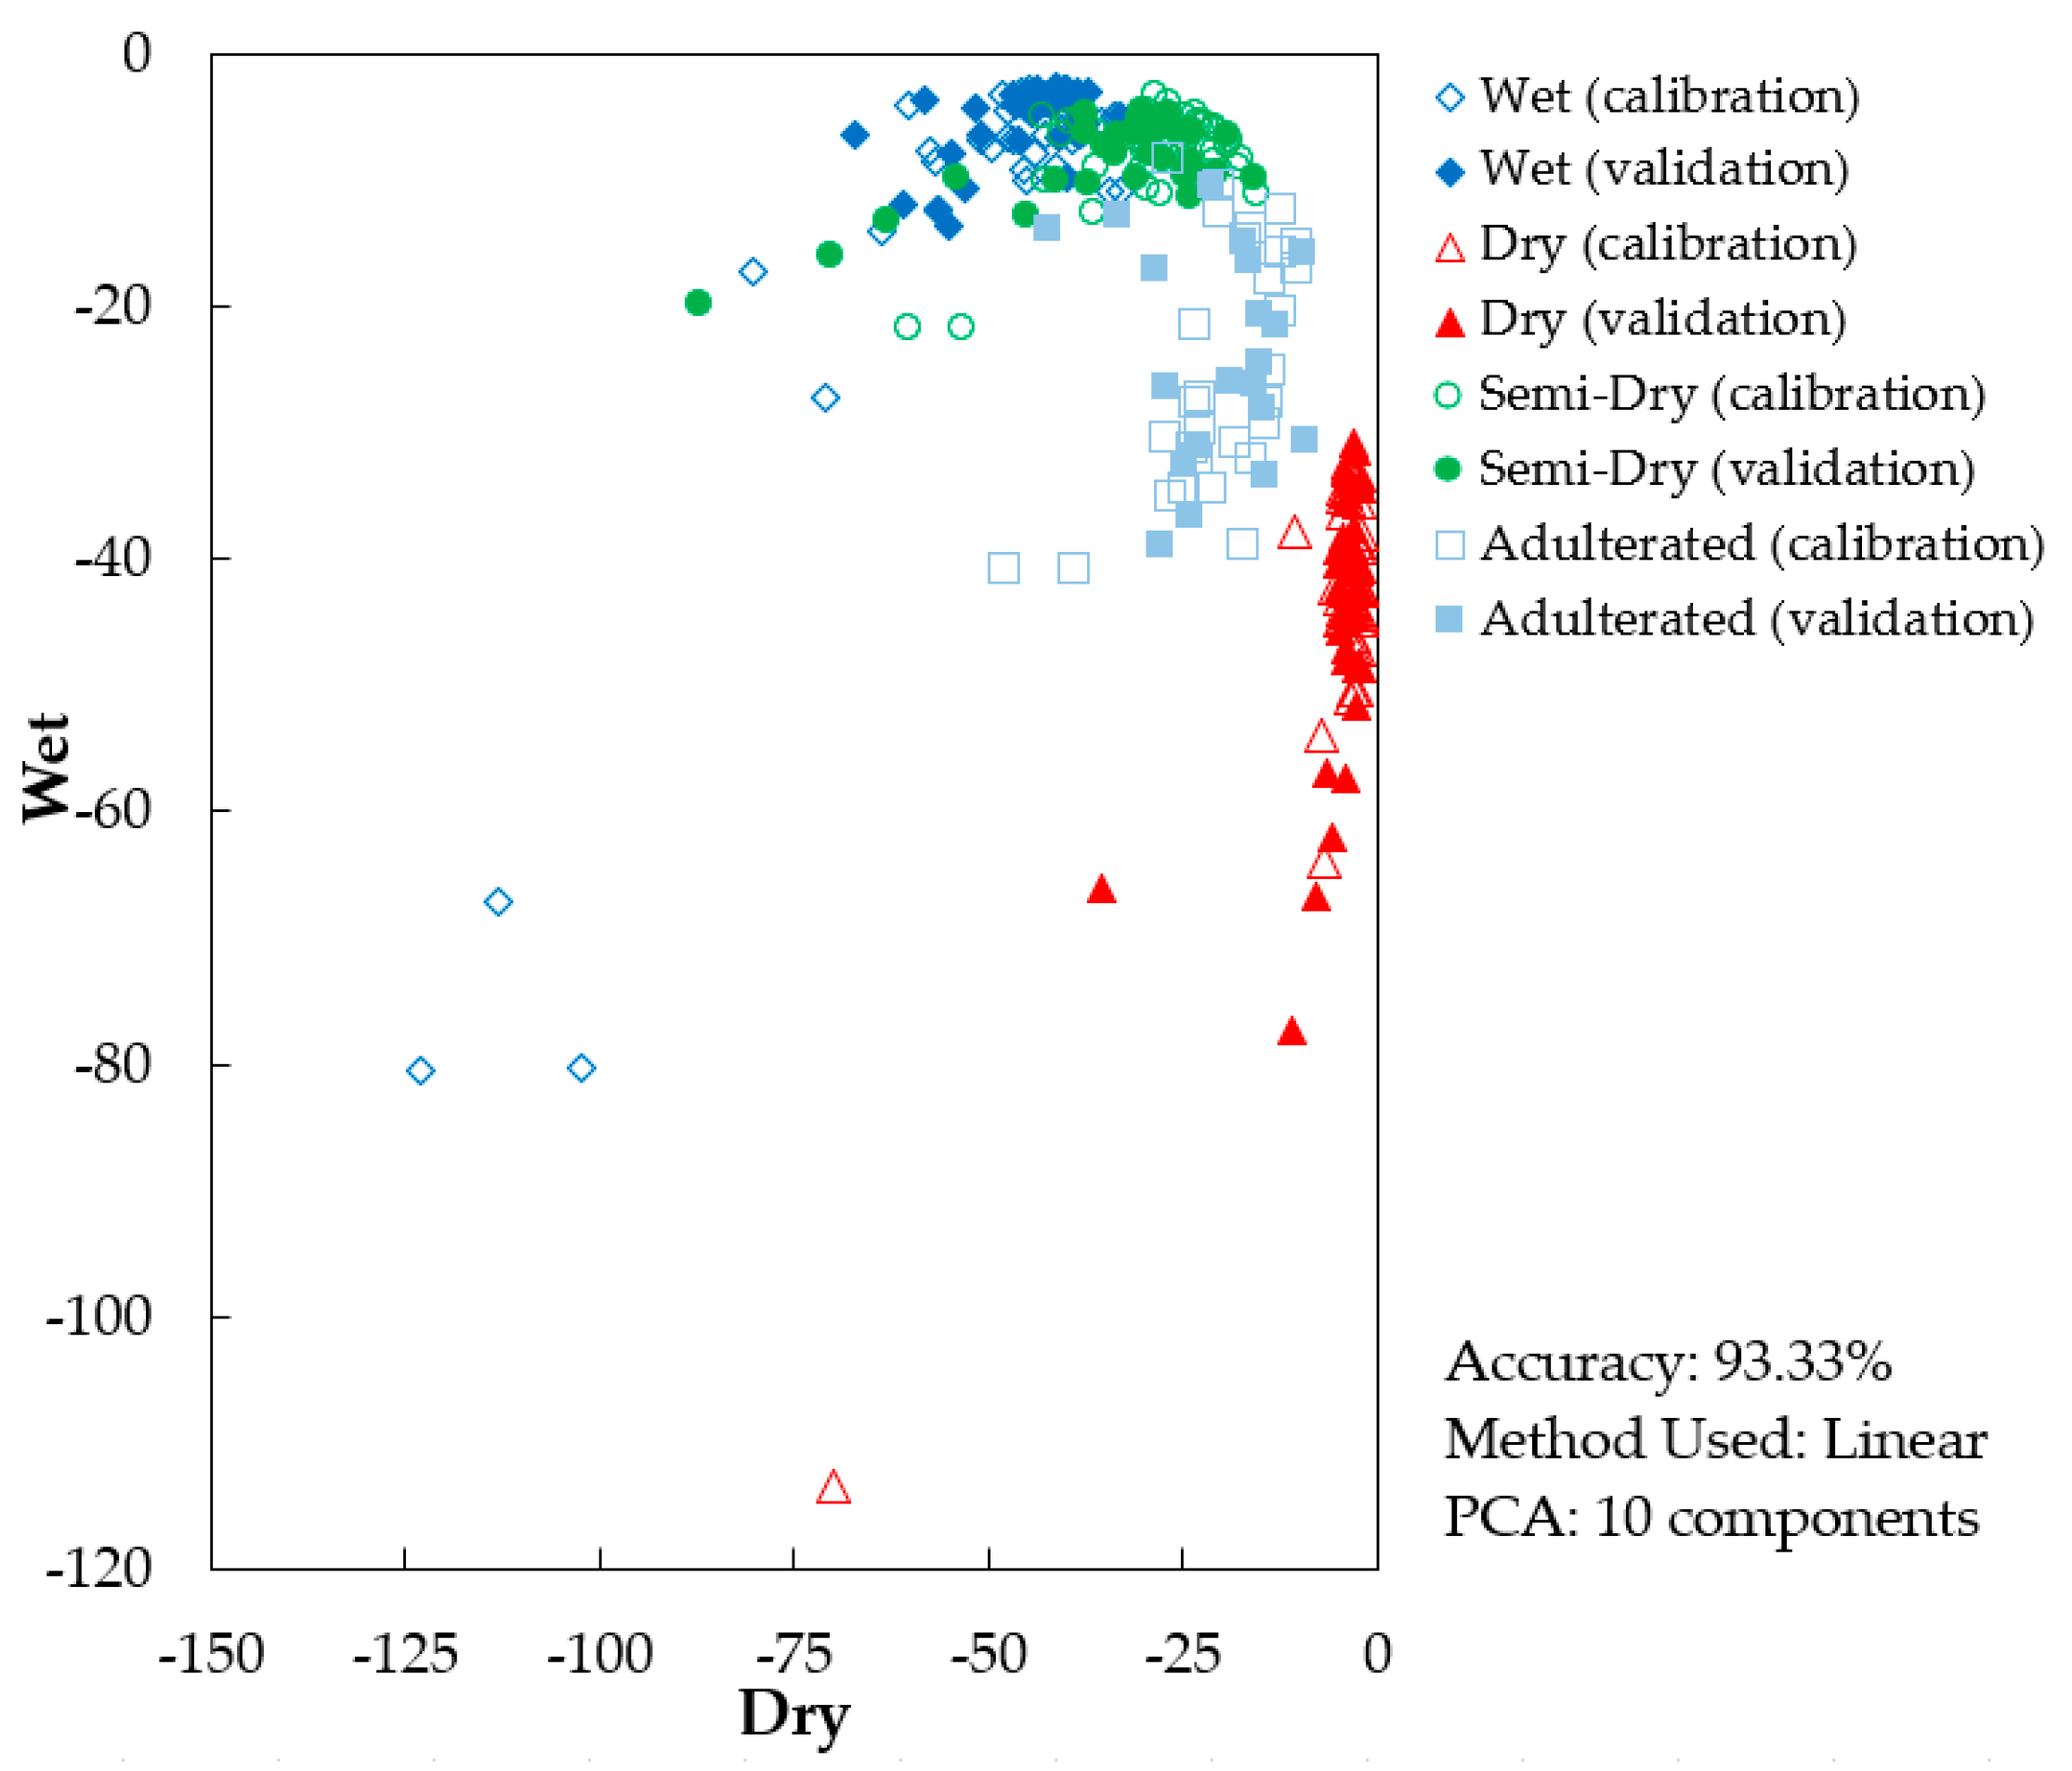
3.3. Supervised Classification Results
4. Conclusions
Author Contributions
Funding
Acknowledgments
Conflicts of Interest
References
- Rocchetti, G.; Braceschi, G.P.; Odello, L.; Bertuzzi, T.; Trevisan, M.; Lucini, L. Identification of markers of sensory quality in ground coffee: An untargeted metabolomics approach. Metabolomics 2020, 16, 127. [Google Scholar] [CrossRef]
- Coffee: World Markets and Trade. Available online: https://apps.fas.usda.gov/psdonline/circulars/coffee.pdf (accessed on 27 December 2020).
- Belitz, H.D.; Grosch, W.; Schieberle, P. Food Chemistry, 4th ed.; Springer: Berlin/Heidelberg, Germany, 2009; pp. 939–940. [Google Scholar]
- Ghosh, P.; Venkatachalapathy, N. Processing and drying of coffee—A review. Int. J. Eng. Res. Technol. 2014, 3, 784–794. [Google Scholar]
- Selmar, D.; Kleinwachter, M.; Bytof, G. Metabolic responses of coffee beans during processing and their impact on coffee flavor. In Cocoa and Coffee Fermentations; Schwan, R.F., Fleet, G.H., Eds.; CRC Press: Boca Raton, FL, USA, 2015; pp. 431–476. [Google Scholar]
- Toledo, P.R.A.B.; Pezza, L.; Pezza, H.R.; Toci, A.T. Relationship between the different aspects related to coffee quality and their volatile compounds. Compr. Rev. Food Sci. Food Saf. 2016, 15, 705–719. [Google Scholar] [CrossRef]
- Santos, J.R.; Lopo, M.; Rangel, A.O.S.S.; Lopes, J.A. Exploiting near infrared spectroscopy as an analytical tool for on-line monitoring of acidity during coffee roasting. Food Control 2015, 60, 408–415. [Google Scholar] [CrossRef]
- Duarte, G.S.; Pereira, A.A.; Farah, A. Chlorogenic acids and other relevant compounds in Brazilian coffees processed by semi-dry and wet post-harvesting methods. Food Chem. 2010, 118, 851–855. [Google Scholar] [CrossRef]
- Bytof, G.; Knopp, S.E.; Schieberle, P.; Teutsch, I.; Selmar, D. Influence of processing on the generation of g-aminobutyric acid in green coffee beans. Eur. Food Res. Technol. 2005, 220, 245–250. [Google Scholar] [CrossRef]
- Lachenmeier, D.W.; Teipel, J.; Scharinger, A.; Kuballa, T.; Walch, S.G.; Grosch, F.; Bunzel, M.; Okaru, A.O.; Schwarz, S. Fully automated identification of coffee species and simultaneous quantification of furfuryl alcohol using NMR spectroscopy. J. AOAC Int. 2020, 103, 306–314. [Google Scholar] [CrossRef]
- Teixeira, A.A.; Brando, C.H.J.; Thomaziello, R.A.; Teixeira, R. The raw bean. In Espresso Coffee the Science of Quality; Illy, A., Viani, R., Eds.; Elsevier Academic Press: Berkeley, CA, USA, 2005; pp. 87–95. [Google Scholar]
- Buratti, S.; Sinelli, N.; Bertone, E.; Venturello, A.; Casiraghi, E.; Geobaldo, F. Discrimination between washed arabica, natural arabica and robusta coffees by using near infrared spectroscopy, electronic nose and electronic tongue analysis. J. Sci. Food Agric. 2015, 95, 2192–2200. [Google Scholar] [CrossRef]
- Flambeau, K.J.; Lee, W.J.; Yoon, J. Discrimination and geographical origin prediction of washed specialty bourbon coffee from different coffee growing areas in Rwanda by using electronic nose and electronic tongue. Food Sci. Biotechnol. 2017, 26, 1245–1254. [Google Scholar] [CrossRef]
- Suhandy, D.; Yulia, M. Peaberry coffee discrimination using uv-visible spectroscopy combined with SIMCA and PLS-DA. Int. J. Food Prop. 2017, 20, S331–S339. [Google Scholar] [CrossRef]
- Suhandy, D.; Yulia, M. The use of partial least square regression and spectral data in uv-visible region for quantification of adulteration in Indonesian palm civet coffee. Int. J. Food Sci. 2017, 2017, 6274178. [Google Scholar] [CrossRef] [PubMed]
- Suhandy, D.; Yulia, M. Unsupervised classification of three specialty coffees from java based on principal component analysis and uv-visible spectroscopy. IOP Conf. Ser. Earth Environ. Sci. 2020, 537, 012034. [Google Scholar] [CrossRef]
- Suhandy, D.; Yulia, M. The classification of arabica gayo wine coffee using uv-visible spectroscopy and PCA-DA method. MATEC Web Conf. 2018, 197, 09002. [Google Scholar] [CrossRef][Green Version]
- Petisca, C.; Pérez-Palacios, T.; Farah, A.; Pinho, O.; Ferreira, I.M.P.L.V.O. Furans and other volatile compounds in ground roasted and espresso coffee using headspace solid-phase microextraction: Effect of roasting speed. Food Bioprod. Process. 2013, 91, 233–241. [Google Scholar] [CrossRef]
- Yergenson, N.; Aston, D.E. Monitoring coffee roasting cracks and predicting with in situ near-infrared spectroscopy. J. Food Process Eng. 2020, 43, e13305. [Google Scholar] [CrossRef]
- Suhandy, D.; Yulia, M. The development of classification model of peaberry and civet ground roasted coffee using uv-visible spectroscopy and two different compensation methods. J. Phys. Conf. Ser. 2019, 1341, 022007. [Google Scholar] [CrossRef]
- Ball, D.W. The Basics of Spectroscopy; SPIE Publications: Bellingham, WA, USA, 2001; pp. 59–60. [Google Scholar]
- Jiménez-Carvelo, A.M.; González-Casado, A.; Bagur-González, M.G.; Cuadros-Rodríguez, L. Alternative data mining/machine learning methods for the analytical evaluation of food quality and authenticity—A review. Food Res Int. 2019, 122, 25–39. [Google Scholar] [CrossRef]
- Medina, S.; Perestrelo, R.; Silva, P.; Pereira, J.A.M.; Câmara, J.S. Current trends and recent advances on food authenticity technologies and chemometric approaches. Trends Food Sci. Technol. 2019, 85, 163–176. [Google Scholar] [CrossRef]
- Jia, S.; Yang, L.; An, D.; Liu, Z.; Yan, Y.; Li, S.; Zhang, X.; Zhu, D.; Gu, J. Feasibility of analysing frost-damaged and non-viable maize kernels based on near infrared spectroscopy and chemometrics. J. Cereal Sci. 2016, 69, 145–150. [Google Scholar] [CrossRef]
- Kennard, R.W.; Stone, L.A. Computer aided design of experiments. Technometrics 1969, 11, 137–148. [Google Scholar] [CrossRef]
- Harvey, T.J.; Gazi, E.; Henderson, A.; Snook, R.D.; Clarke, N.W.; Brown, M.; Gardner, P. Factors influencing the discrimination and classification of prostate cancer cell lines by FTIR microspectroscopy. Analyst 2009, 134, 1083–1091. [Google Scholar] [CrossRef] [PubMed]
- Olivier, D.; Cyril, R.; Alexandra, D.; Ludovic, D.; Jean-Pierre, H. Support vector machines (SVM) in near infrared (NIR) spectroscopy: Focus on parameters optimization and model interpretation. Chemometr. Intell. Lab. Syst. 2009, 96, 27–33. [Google Scholar] [CrossRef]
- Lee, L.C.; Liong, C.Y.; Jemain, A.A. Partial least squares-discriminant analysis (PLS-DA) for classification of high-dimensional (HD) data: A review of contemporary practice strategies and knowledge gaps. Analyst 2018, 143, 3526–3539. [Google Scholar] [CrossRef] [PubMed]
- Tharwat, A.; Gaber, T.; Ibrahim, A.; Hassanien, A.E. Linear discriminant analysis: A detailed tutorial. AI Commun. 2017, 30, 169–190. [Google Scholar] [CrossRef]
- Gislum, R.; Nikneshan, P.; Shrestha, S.; Tadayyon, A.; Deleuran, L.; Boelt, B. Characterisation of Castor (Ricinus communis L.) seed quality using Fourier transform near-infrared spectroscopy in combination with multivariate data analysis. Agriculture 2018, 8, 59. [Google Scholar] [CrossRef]
- Marfo, T.D.; Datta, R.; VranovÃ, V.; Ekielski, A. Ecotone dynamics and stability from soil perspective: Forest-agriculture land transition. Agriculture 2019, 9, 228. [Google Scholar] [CrossRef]
- Basri, K.N.; Hussain, M.N.; Bakar, J.; Sharif, Z.; Khir, M.F.A.; Zoolfakar, A.S. Classification and quantification of palm oil adulteration via portable NIR spectroscopy. Spectrochim. Acta A Mol. Biomol. Spectrosc. 2017, 173, 335–342. [Google Scholar] [CrossRef]
- Shawky, E.; Selim, D.A. NIR spectroscopy-multivariate analysis for discrimination and bioactive compounds prediction of different Citrus species peels. Spectrochim. Acta A Mol. Biomol. Spectrosc. 2019, 219, 1–7. [Google Scholar] [CrossRef]
- Santos, K.M.; Moura, M.F.V.; Azevedo, F.G.; Lima, K.M.G.; Raimundo, I.V.; Pasquini, C. Classification of Brazilian coffee using near-infrared spectroscopy and multivariate calibration. Anal. Lett. 2012, 45, 774–781. [Google Scholar] [CrossRef]
- Zhang, Z.; Wang, Y.; Yan, H.; Chang, X.; Zhou, G.; Zhu, L.; Liu, P.; Guo, S.; Dong, T.T.X.; Duan, J. Rapid geographical origin identification and quality assessment of angelicae sinensis radix by FT-NIR spectroscopy. J. Anal. Methods Chem. 2021, 2021, 8875876. [Google Scholar] [CrossRef]
- Souto, U.T.C.P.; Barbosa, M.F.; Dantas, H.V.; de Pontes, A.S.; Lyra, W.S.; Diniz, P.H.G.D.; de Araújo, M.C.U.; da Silva, E.C. Identification of adulteration in ground roasted coffees using uv–vis spectroscopy and SPA-LDA. LWT Food Sci. Technol. 2015, 63, 1037–1041. [Google Scholar] [CrossRef]
- Hu, L.; Yin, C.; Ma, S.; Liu, Z. Vis-NIR spectroscopy combined with wavelengths selection by PSO optimization algorithm for simultaneous determination of four quality parameters and classification of soy sauce. Food Anal. Methods 2019, 12, 633–643. [Google Scholar] [CrossRef]
- Yulia, M.; Suhandy, D. Identification of fresh and expired ground roasted robusta coffee using uv-visible spectroscopy and chemometrics. MATEC Web Conf. 2018, 197, 09003. [Google Scholar] [CrossRef]
- Diniz, P.H.G.D.; Barbosa, M.F.; de Melo Milanez, K.D.T.; Pistonesi, M.F.; de Araújo, M.C.U. Using uv–vis spectroscopy for simultaneous geographical and varietal classification of tea infusions simulating a home-made tea cup. Food Chem. 2016, 192, 374–379. [Google Scholar] [CrossRef] [PubMed]
- Dankowska, A.; Domagała, A.; Kowalewski, W. Quantification of coffea arabica and coffea canephora var. robusta concentration in blends by means of synchronous fluorescence and uv-vis spectroscopies. Talanta 2017, 172, 215–220. [Google Scholar] [CrossRef]
- Khuwijitjaru, P.; Boonyapisomparn, K.; Huck, C.W. Near-infrared spectroscopy with linear discriminant analysis for green ‘robusta’ coffee bean sorting. Int. Food Res. J. 2020, 27, 287–294. [Google Scholar]


| Samples | Samples Code | DRY (g) | WET (g) | SMD (g) | Number of Samples |
|---|---|---|---|---|---|
| DRY | DRY1–DRY100 | 1 ± 0.0001 | 0 | 0 | 100 |
| WET | WET1–WET100 | 0 | 1 ± 0.0001 | 0 | 100 |
| SMD | SMD1–SMD100 | 0 | 0 | 1 ± 0.0001 | 100 |
| ADT | ADT1–ADT10 | 0.05 ± 0.0001 | 0 | 0.95 ± 0.0003 | 10 |
| ADT11–ADT20 | 0.05 ± 0.0003 | 0.05 ± 0.0003 | 0.90 ± 0.0002 | 10 | |
| ADT21–ADT30 | 0.075 ± 0.0003 | 0.075 ± 0.0002 | 0.85 ± 0.0003 | 10 | |
| ADT31–ADT50 | 0.1 ± 0.0001 | 0.1 ± 0.0002 | 0.80 ± 0.0002 | 20 | |
| ADT51–ADT60 | 0.125 ± 0.0002 | 0.125 ± 0.0002 | 0.75 ± 0.0002 | 10 |
| Principal Components (PCs) | Cumulative Percent Variance (%) | |
|---|---|---|
| Calibration | Validation | |
| PC1 | 62.474 | 61.569 |
| PC2 | 82.972 | 81.596 |
| PC3 | 93.018 | 92.312 |
| PC4 | 96.275 | 95.200 |
| PC5 | 97.734 | 96.867 |
| PC6 | 98.634 | 98.309 |
| PC7 | 99.065 | 98.697 |
| PC8 | 99.464 | 99.340 |
| PC9 | 99.661 | 99.587 |
| PC10 | 99.756 | 99.704 |
| Classifiers | Samples | Actual | Accuracy Rate | ||||
|---|---|---|---|---|---|---|---|
| DRY | WET | SMD | ADT | ||||
| PLS-DA | Predicted | DRY | 10 | 4 | 3 | 1 | 56.7% |
| WET | 6 | 8 | 0 | 0 | |||
| SMD | 0 | 5 | 9 | 2 | |||
| ADT | 0 | 0 | 5 | 7 | |||
| SVMC | Predicted | DRY | 16 | 0 | 0 | 0 | 85.0% |
| WET | 0 | 15 | 5 | 0 | |||
| SMD | 0 | 2 | 12 | 2 | |||
| ADT | 0 | 0 | 0 | 8 | |||
| LDA | Predicted | DRY | 16 | 0 | 0 | 0 | 80.0% |
| WET | 0 | 12 | 5 | 1 | |||
| SMD | 0 | 5 | 12 | 1 | |||
| ADT | 0 | 0 | 0 | 8 | |||
| PCA-LDA | Predicted | DRY | 16 | 0 | 0 | 0 | 91.7% |
| WET | 0 | 17 | 4 | 0 | |||
| SMD | 0 | 0 | 13 | 1 | |||
| ADT | 0 | 0 | 0 | 9 | |||
Publisher’s Note: MDPI stays neutral with regard to jurisdictional claims in published maps and institutional affiliations. |
© 2021 by the authors. Licensee MDPI, Basel, Switzerland. This article is an open access article distributed under the terms and conditions of the Creative Commons Attribution (CC BY) license (http://creativecommons.org/licenses/by/4.0/).
Share and Cite
Suhandy, D.; Yulia, M. Classification of Lampung robusta Specialty Coffee According to Differences in Cherry Processing Methods Using UV Spectroscopy and Chemometrics. Agriculture 2021, 11, 109. https://doi.org/10.3390/agriculture11020109
Suhandy D, Yulia M. Classification of Lampung robusta Specialty Coffee According to Differences in Cherry Processing Methods Using UV Spectroscopy and Chemometrics. Agriculture. 2021; 11(2):109. https://doi.org/10.3390/agriculture11020109
Chicago/Turabian StyleSuhandy, Diding, and Meinilwita Yulia. 2021. "Classification of Lampung robusta Specialty Coffee According to Differences in Cherry Processing Methods Using UV Spectroscopy and Chemometrics" Agriculture 11, no. 2: 109. https://doi.org/10.3390/agriculture11020109
APA StyleSuhandy, D., & Yulia, M. (2021). Classification of Lampung robusta Specialty Coffee According to Differences in Cherry Processing Methods Using UV Spectroscopy and Chemometrics. Agriculture, 11(2), 109. https://doi.org/10.3390/agriculture11020109