
Assessing Food Insecurity and Its Drivers among Smallholder Farming Households in Rural Oyo State, Nigeria: The HFIAS Approach


Abstract
:1. Introduction
2. Materials and Methods
2.1. Study Area
2.2. Sampling Procedure and Data Collection
2.3. Measuring Food Access through HFIAS
2.4. Household Food Insecurity Access Prevalence (HFIAP)
2.5. Analytical Framework
3. Results and Discussion
3.1. Describing the Socioeconomic Features of Cassava Farming Households
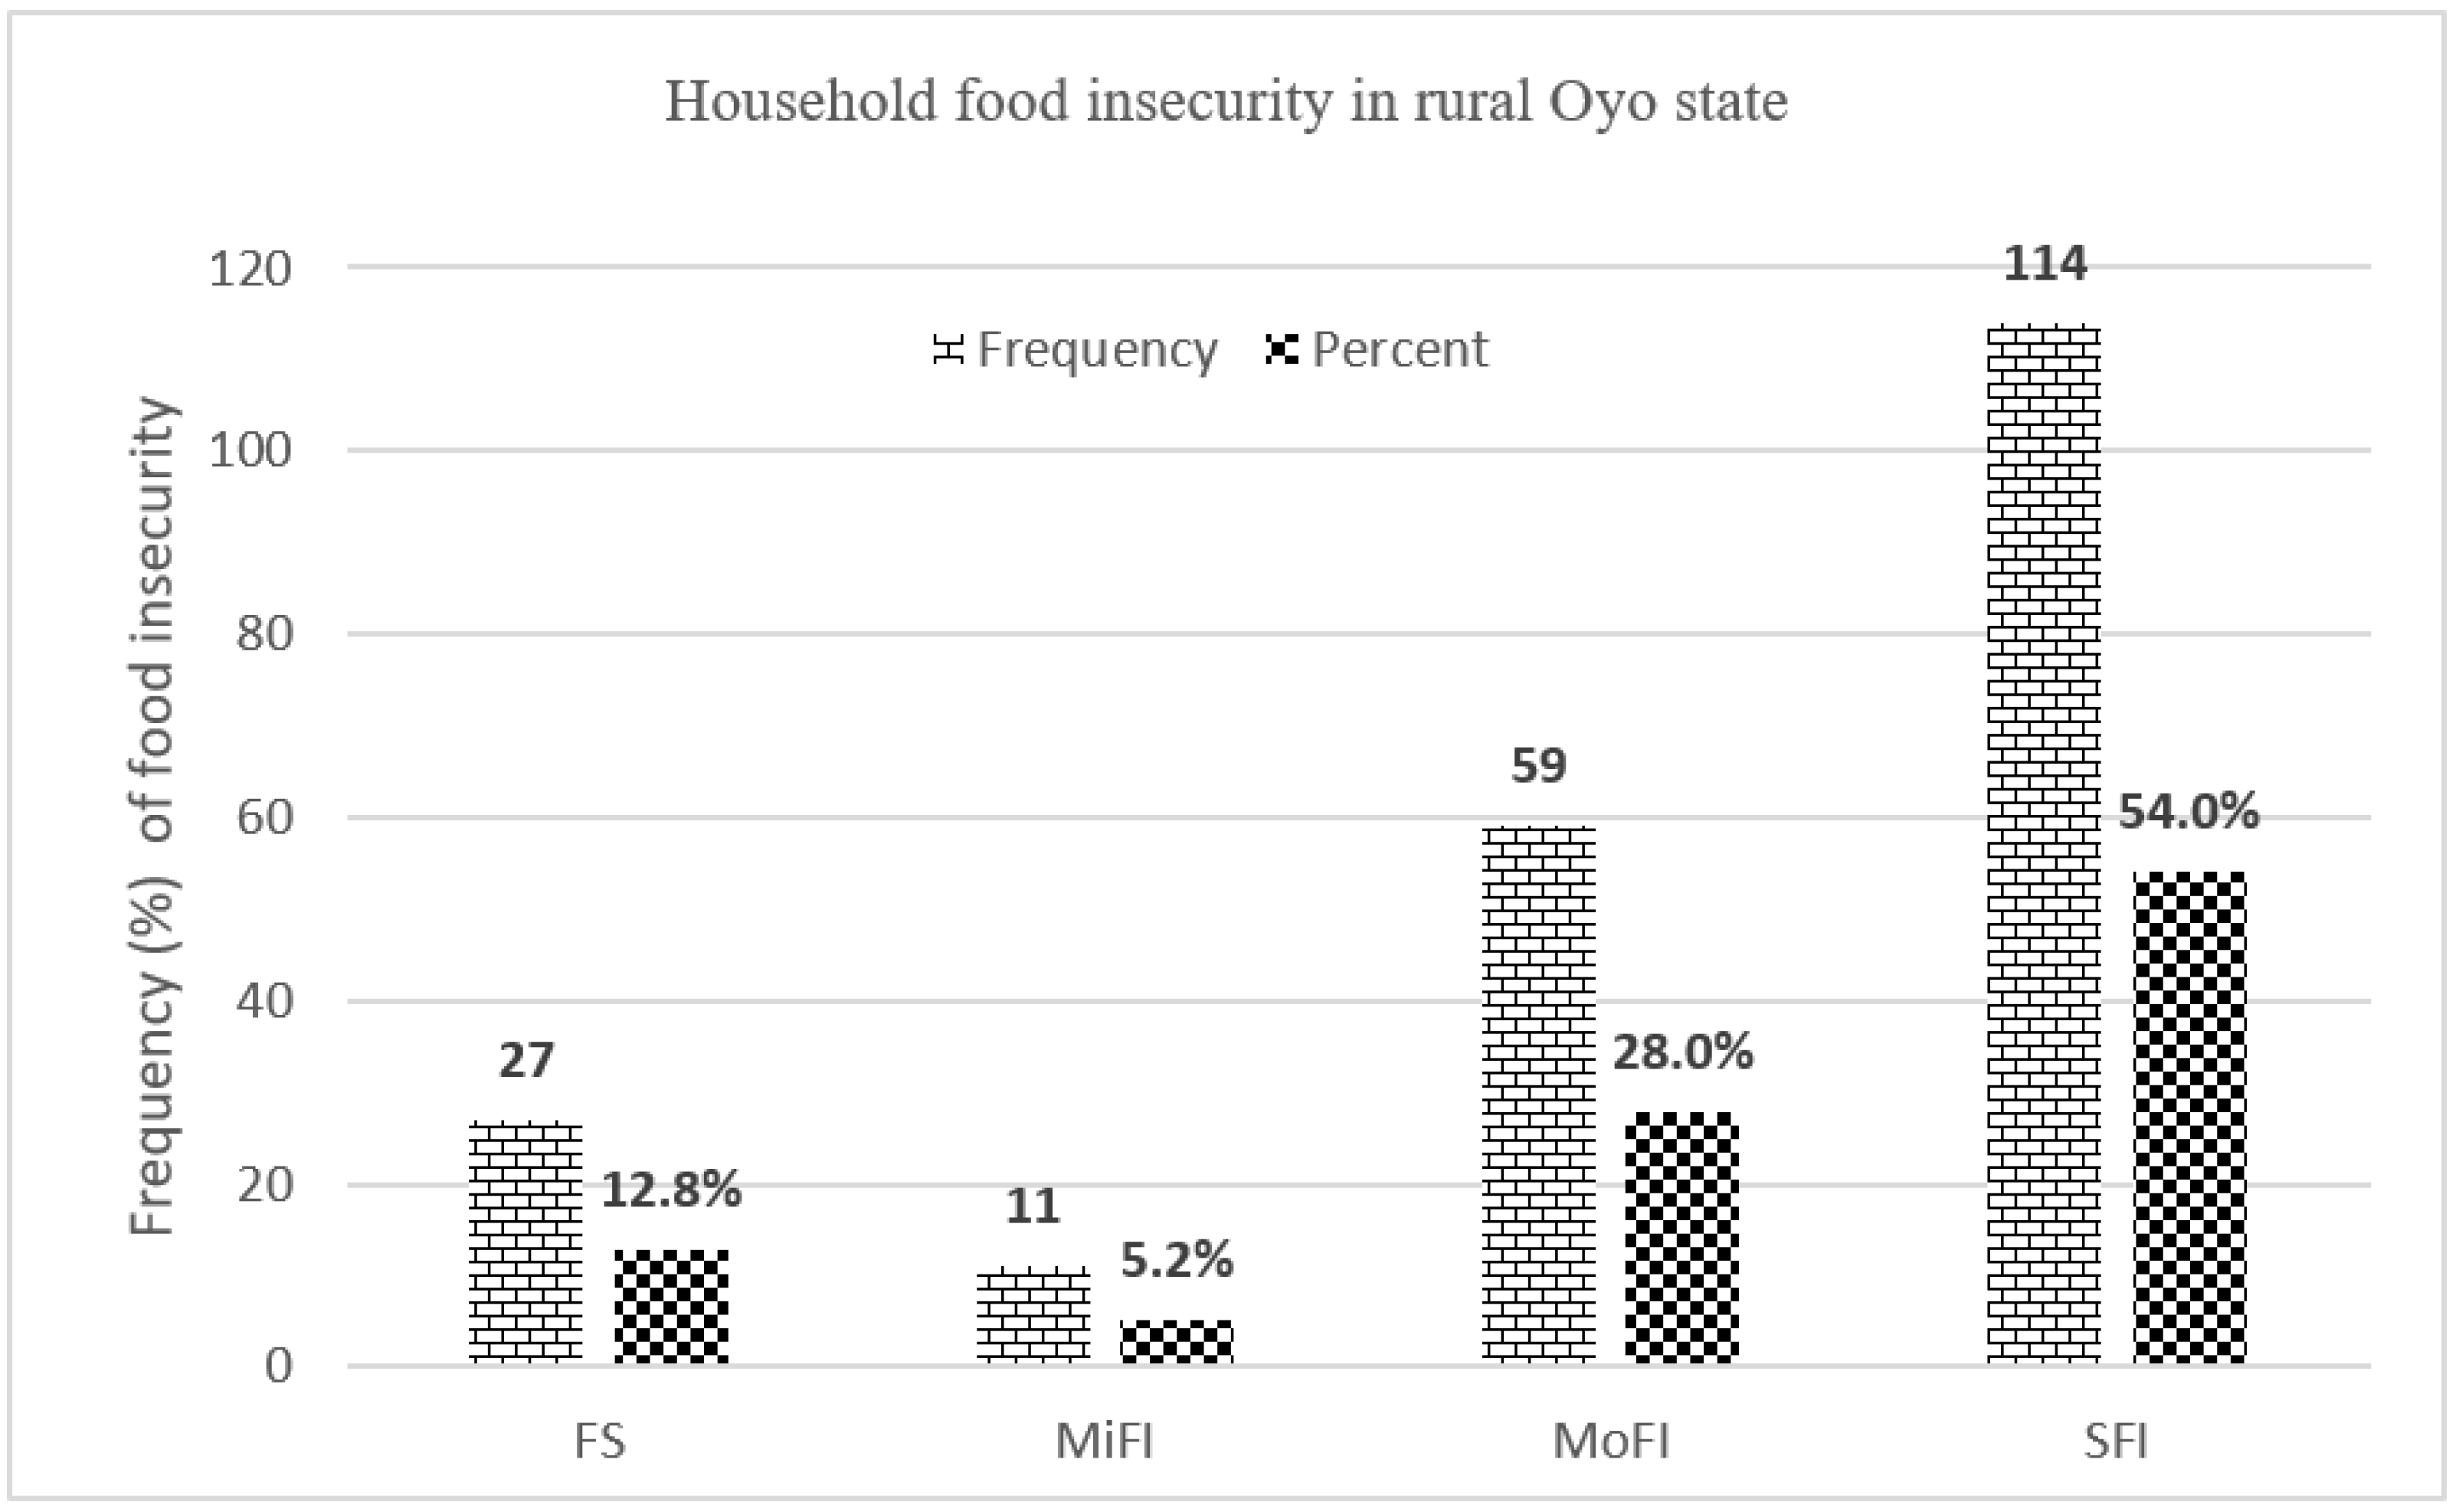
3.2. Food Insecurity Prevalence in Rural Farming Households
3.3. Socio-Demographic Characteristics of Farming Households According to Food Insecurity Category
3.4. Farm-Level Characteristics of Households according to Food Insecurity Category
3.5. Distribution of Environmental and Health-Related Factors of Farming Households according to Food Insecurity Category
3.6. Drivers of Food Insecurity among Rural Farming Households
3.7. The Study Limitations
4. Conclusions and Recommendations
Author Contributions
Funding
Institutional Review Board Statement
Informed Consent Statement
Data Availability Statement
Acknowledgments
Conflicts of Interest
References
- Ayinde, I.A.; Otekunrin, O.A.; Akinbode, S.O.; Otekunrin, O.A. Food Security in Nigeria: Impetus for growth and Development. J. Agric. Econ. Rural Dev. 2020, 6, 808–820. [Google Scholar]
- Otekunrin, O.A.; Otekunrin, O.A.; Fasina, F.O.; Omotayo, A.O.; Akram, M. Assessing the Zero Hunger Readiness in Africa in the Face of COVID-19 Pandemic. Caraka Tani. J. Sustain. Agric. 2020, 35, 213–227. [Google Scholar] [CrossRef]
- Otekunrin, O.A.; Fasina, F.O.; Omotayo, O.A.; Otekunrin, O.A.; Akram, M. COVID-19 in Nigeria: Why continuous spike in cases? Asian Pac. J. Trop. Med. 2021, 14, 1–4. [Google Scholar]
- FAO; IFAD; UNICEF; WFP; WHO. The State of Food Security and Nutrition in the World 2021. In Transforming Food Systems for Food Security, Improved Nutrition and Affordable Healthy Diets for All; FAO: Rome, Italy, 2021. [Google Scholar]
- Otekunrin, O.A.; Otekunrin, O.A. Healthy and Sustainable Diets: Implications for Achieving SDG2. In Zero Hunger. Encyclopedia of the UN Sustainable Development Goals; Leal Filho, W., Azul, A., Brandli Ozuyar, P., Wall, T., Eds.; Springer: Cham, Switzerland, 2021. [Google Scholar]
- Merridiam-Webster Dictionary. Definition of Food Insecurity. 2021. Available online: https://www.merriam-webster.com/dictionary/food%20insecure#h1 (accessed on 5 October 2021).
- Food and Agriculture Organization of the United Nations (FAO). Rome Declaration on World Food Security and World Food summit Plan of Action. World Food Summit 13–17 November 1996, Rome, Italy. 1996. Available online: https://www.fao.org/3/w3613e/w3613e00.htm (accessed on 10 October 2021).
- FAO. The State of Food Insecurity in the World 2002. Rome. Available online: https://www.fao.org/3/y7352e/y7352e00.htm (accessed on 6 October 2021).
- Clay, E. Food Security: Concepts and Measurement. In Proceedings of the FAO Expert Consultation on Trade and Food Security: Conceptualizing the Linkages, Rome, Italy, 11–12 July 2002; Available online: http://www.fao.org/3/y4671e/y4671e06.htm (accessed on 3 October 2021).
- Obayelu, O.A.; Akpan, E.I.; Ojo, A.O. Prevalence and correlates of food insecurity in rural Nigeria: A panel analysis. Econ. Agro-Aliment. 2021, 23, 1–25. [Google Scholar] [CrossRef]
- Hanushek, E.A. Economic growth in developing countries: The role of human capital. Econ. Edu. Rev. 2013, 37, 204–212. [Google Scholar] [CrossRef]
- Mutisya, M.; Kandala, N.B.; Ngware, M.W.; Kabiru, C.W. Household food (in) security and nutritional status of urban poor children aged 6 to 23 months in Kenya. BMC Public Health 2015, 15, 1052. [Google Scholar] [CrossRef] [Green Version]
- Otekunrin, O.A.; Otekunrin, O.A.; Momoh, S.; Ayinde, I.A. How far has Africa gone in achieving the Zero Hunger Target? Evidence from Nigeria. Glob. Food Secur. 2019, 22, 1–12. [Google Scholar] [CrossRef]
- Otekunrin, O.A.; Momoh, S.; Ayinde, I.A.; Otekunrin, O.A. How far has Africa gone in achieving the Sustainable Development Goals? Exploring the African dataset. Data Brief 2019, 27, 1–7. [Google Scholar] [CrossRef] [PubMed]
- Otekunrin, O.A.; Sawicka, B. Cassava, a 21st Century Crop: How can Nigeria Harness its Enormous Trade Potential? Acta Sci. Agric. 2019, 3, 194–202. [Google Scholar] [CrossRef]
- Ogunniyi, A.I.; Omotoso, S.O.; Salman, K.K.; Omotayo, A.O.; Olagunju, K.O.; Aremu, A.O. Socio-economic Drivers of food security among rural households in Nigeria: Evidence from Smallholder maize farmers. Soc. Indic. Res. 2021, 155, 583–599. [Google Scholar] [CrossRef]
- EIU. Global Food Security Index. Addressing Structural Inequalities to Build Strong and Sustainable Food Systems 2021. A Report from The Economist Intelligence Unit. Available online: https://impact.economist.com/sustainability/project/food-security-index/Resources?linkId=100000071119109 (accessed on 23 August 2021).
- FEWS NET. Nigeria Food Security Outlook, June 2021 to January 2021: Despite the Harvest in September, the Food Security Emergency Is Expected to Persist in the Northeast. 2021. Available online: https://fews.net/west-africa/nigeria/food-security-outlook/june-2021 (accessed on 15 October 2021).
- Otekunrin, O.A.; Otekunrin, O.A. Dietary Diversity Choices of Women: Evidence from Cassava Farming Households in Nigeria. Arch. Curr. Res. Int. 2021, 21, 11–22. [Google Scholar] [CrossRef]
- Otekunrin, O.A.; Sawicka, B.; Adeyonu, A.G.; Otekunrin, O.A.; Rachon, L. Cocoyam [Colocasia esculenta (L.) Schott]: Exploring the Production, Health and Trade Potentials in Sub-Saharan Africa. Sustainability 2021, 13, 4483. [Google Scholar] [CrossRef]
- World Data Lab. 2021. Available online: https://worldpoverty.io/headline (accessed on 12 October 2021).
- IFAD. “Annual Report. International Fund for Agricultural Development” 2012, Monte Forte. Available online: https://www.ifad.org/en/web/knowledge/-/publication/annual-report-2012-full-version (accessed on 10 September 2021).
- FAOSTAT. Food and Agriculture Organisation of the United Nations Statistical Database; Statistical Division; FAO: Rome, Italy, 2021; Available online: http://www.fao.org/statistics/en/ (accessed on 5 October 2021).
- UN. Sustainable Development Goal 2. 2017. Available online: https://sustainabledevelopment.un.org/sdg2 (accessed on 15 September 2021).
- von Grebmer, K.; Bernstein, J.; Alders, R.; Dar, O.; Knock, R.; Rampa, M.; Wiemers, M.; Acheampong, K.; Hanano, A.; Higgins, B.; et al. 2020 Global Hunger Index: One Decade to Zero Hunger: Linking Health and Sustainable Food Systems; Welthhungerhilfe: Bonn, Germany; Concern Worldwide: Dublin, Germany, 2020; pp. 1–80. [Google Scholar]
- Otekunrin, O.A.; Otekunrin, O.A.; Momoh, S.; Ayinde, A.I. Assessing the Zero Hunger Target Readiness in Africa: Global Hunger Index (GHI) patterns and Indicators. In Proceedings of the 33rd Annual National Conference of the Farm Management Association of Nigeria (FAMAN), Abeokuta, Nigeria, 7–10 October 2019; pp. 456–464. [Google Scholar]
- Akerele, D.; Momoh, S.; Aromolaran, A.B.; Oguntona, C.R.B.; Shittu, A.M. Food Insecurity and Coping Strategies in South-West Nigeria. Food Secur. 2013, 5, 407–414. [Google Scholar] [CrossRef]
- Agbola, P.O. Factors Influencing Food Insecurity among Small Farmers in Nigeria. Afr. J. Agric. Res. 2014, 9, 2104–2110. [Google Scholar]
- Ahmed, F.F.; Eugene, C.E.; Abah, P.O. Analysis of Food Security among Farming Households in Borno State, Nig. J. Agric. Econ. Environ. Soc. Sci. 2015, 1, 130–141. [Google Scholar]
- Ibrahim, H.Y.; Adeola, S.S.; Ibrahim, H.I. Determinants of Food Insecurity among Farming Households in Katsina State, North Western Nigeria: An Ordinal Logit Regression Approach. J. Agric. Sci. 2016, 61, 291–301. [Google Scholar] [CrossRef] [Green Version]
- Foster, J.; Greer, J.; Thorbecke, E. Foster–Greer–Thorbecke (FGT) poverty measures: Twenty-five years later. J. Econ. Inequal. 2010, 8, 491–524. [Google Scholar] [CrossRef]
- Biam, C.K.; Tavershima, T. Food Security in Rural Farming Households in Benue State, Nigeria. Afr. J. Food Agric. Nutr. Dev. 2020, 20, 15677–15694. [Google Scholar] [CrossRef]
- Omotayo, A.O.; Olagunju, K.O.; Omotoso, A.B.; Ogunniyi, A.I.; Otekunrin, O.A.; Daud, A.S. Clean water, sanitation and under-five children diarrhea incidence: Empirical evidence from the South Africa’s General Household Survey. Environ. Sci. Pollut. Res. 2021, 28, 63150–63162. [Google Scholar] [CrossRef]
- Owoo, S.N. Food insecurity and family structure in Nigeria. SSM-Pop Health 2018, 4, 117–125. [Google Scholar]
- Obayelu, O.A.; Oyekola, T. Food Insecurity in Urban Slums: Evidence from Ibadan Metropolis, Southwest Nigeria. J. Adv. Dev. Econ. 2018, 7, 1–17. [Google Scholar]
- Nour, S.S.; Abdalla, E.M. Food security in Sudan: The case of Kassala state. WJSTSD 2021, 18, 1–20. [Google Scholar]
- Samim, S.A.; Hu, Z.; Stepien, S.; Amini, S.Y.; Rayee, R.; Niu, K.; Mgendi, G. Food Insecurity and Related Factors among Farming Families in Takhar Region, Afghanistan. Sustainability 2021, 13, 10211. [Google Scholar] [CrossRef]
- Find Latitude and Longitude. Available online: https://www.findlatitudeandlongitude.com/I/southwest+nigeria+africa/501431/ (accessed on 7 October 2021).
- National Population Commission (NPC), National Bureau of Statistics (NBS), 2018. National Population Estimates. Available online: https://nigerianstat.gov.ng/download/474 (accessed on 12 September 2021).
- Lawal, B.O.; Samuel, F.O. Determinant of Nutritional Status of Children in Farming Households in Oyo State, Nigeria. Afr. J. Food Agric. Nutr. Dev. 2010, 10, 4235–4253. [Google Scholar] [CrossRef]
- Coates, J.; Swindale, A.; Bilinsky, P. Household Food insecurity access scale (HFIAS) for measurement of household food access: Indicator guide (v.3). In Food and Nutrition Technical Assistance Project; Academy for Educational Development: Washington, DC, USA, 2007. [Google Scholar]
- Jones, A.D.; Ngure, F.M.; Pelto, G.; Young, S.L. What are we assessing when we measure food security? A Compendium and review of current metrics. Adv. Nutr. 2013, 4, 481–505. [Google Scholar] [CrossRef] [PubMed] [Green Version]
- Greene, W.H. Econometric Analysis, 7th ed.; Pearson: London, UK, 2012. [Google Scholar]
- Obayelu, A.E. Households’ food security status and its determinants in the North-Central Nigeria. Food Econ. 2012, 9, 241–256. [Google Scholar] [CrossRef]
- Long, J.S.; Long, J.S. Regression Models for Categorical and Limited Dependent Variables, 1st ed.; Sage Publications: London, UK, 1997; Volume 7, pp. 114–145. [Google Scholar]
- Cordero-Ahiman, O.V.; Vanegas, J.L.; Beltrán-Romero, P.; Quinde-Lituma, M.E. Determinants of food insecurity in rural households: The case of the Paute River basin of Azuay Province, Ecuador. Sustainability 2020, 12, 946. [Google Scholar] [CrossRef] [Green Version]
- Torres-Reyna, O. Getting Started in Logit and Ordered Logit. Data and Statistical Services, Princeton University. 2014. Available online: https://www.princeton.edu/~otorres/Logit.pdf (accessed on 28 September 2021).
- Booroah, V.K. Logit and probit: Ordered and multinomial models. In Quantitative Applications in the Social Sciences; Series No. 138; Sage Publications: Thousand Oaks, CA, USA, 2002. [Google Scholar]
- Otekunrin, O.A. The Effect of Human Capital Accumulation on Resource Use Efficiency among Cassava-Based Farmers in Oyo State. Master’s Thesis, Department of Agricultural Economics, University of Ibadan, Ibadan, Nigeria, 2011. [Google Scholar]
- Awoyemi, T.T.; Odozi, J.C.; Otekunrin, O.A.; Ehirim, N.C. Efficient Resource Use: Does Human Capital Matter? The Case of Cassava Production farmers in Oyo State, Nigeria. Int. J. Agric. Rural Dev. 2015, 18, 2064–2074. [Google Scholar]
- Adeyemo, T.; Amaza, P.; Okoruwa, V.; Akinyosoye, V.; Salmom, K.K.; Abass, A. Determinants of Biomass Utilization: Evidence from Cassava Smallholders in Nigeria. Sustainability 2019, 11, 2516. [Google Scholar] [CrossRef] [Green Version]
- Effiong, E.O. Efficiency of Production in Selected Livestock Enterprises in Akwa Ibom State. Ph.D. Thesis, Department of Agricultural Economics, Michael Okpara University of Agriculture, Umudike, Nigeria, 2015. [Google Scholar]
- Opondo, F.A.; Dannenberg, P.; Willkomm, M. Characterization of the levels of cassava commercialization among smallholder farmers in Kenya: A multinomial regression approach. Afri. J. Agric. Res. 2017, 41, 3024–3036. [Google Scholar]
- Okoye, B.C.; Abass, A.; Bachwenkizi, B.; Asumugha, G.; Alenkhe, B.; Ranaivoson, R.; Randrianarivelo, R.; Rabemanantsoa, N.; Ralimanana, I. Effect of Transaction Costs of Market Participation among Smallholder Cassava Farmers in Central Madagascar. Cogent. Econ. Fin. 2016, 4, 1–20. [Google Scholar] [CrossRef] [Green Version]
- Kolapo, A.; Yusuf, O.J.; Abdulmumin, M.O. Market Participation and Food Security Status of Bio-fortified Cassava Processors in South Western Nigeria. Int. J. Sustain. Agric. Res. 2020, 7, 174–184. [Google Scholar]
- Willett, W.; Rockström, J.; Loken, B.; Springmann, M.; Lang, T.; Vermeulen, S.; Garnett, T.; Tilman, D.; DeClerck, F.; Wood, A.; et al. Food in the Anthropocene: The EAT–lancet commission on healthy diets from sustainable food systems. Lancet 2019, 393, 447–492. [Google Scholar] [CrossRef]
- Quddus, M.A.; Bauer, S. Food security and morbidity of elderly in disadvantaged rural Bangladesh. J. Bangladesh Agric. Univ. 2014, 12, 95–104. [Google Scholar] [CrossRef] [Green Version]
- Fadare, O.; Amare, M.; Mavrotas, G.; Akerele., D.; Ogunniyi, A. Mother’s nutrition-related knowledge and child nutrition outcomes: Empirical evidence from Nigeria. PLoS ONE 2019, 14, e0212775. [Google Scholar]
- National Population Commission (NPC) [Nigeria]; ICF. Nigeria Demographic and Health Survey 2018; NPC and ICF: Abuja, Nigeria; Rockville, MD, USA, 2019.
- United Nations Children’s Fund (UNICEF). Young People Rally to Put an End to Open Defecation in West and Central Africa. 2021. Available online: https://www.unicef.org/nigeria/press-release/young-people-rally-put-end-open-defecation-west-and-central-africa (accessed on 18 October 2021).
- Babatunde, R.O.; Adejobi, A.O.; Fakayode, S.B. Income and calorie intake among farming households in rural Nigeria: Results of parametric and nonparametric analysis. J. Agric. Sci. 2010, 2, 135–146. [Google Scholar] [CrossRef] [Green Version]
- Adeyemo, T.A.; Olajide, O.A. Urban rural pattern of remittances and effects on food security of rural households in Nigeria. In Proceedings of the Conference on International Research on Food Security, Natural Resource Management and Rural Development Organised by the University of Hohenheim Tropentag 2013, Stuttgart, Germany, 17–19 September 2013. [Google Scholar]
- Smith, M.D.; Kassa, W.; Winters, P. Assessing food insecurity in Latin America and the Caribbean using FAO’s Food Insecurity Experience Scale. Food Policy 2017, 71, 48–61. [Google Scholar] [CrossRef] [Green Version]
- Olagunju, K.O.; Ogunniyi, A.I.; Awotide, B.A.; Adenuga, A.H.; Ashagidigbi, W.M. Evaluating the distributional impacts of drought-tolerant maize varieties on productivity and welfare outcomes: An instrumental variable quantile treatment effects approach. Climate Dev. 2019, 12, 1–11. [Google Scholar] [CrossRef]
- Omonona, B.T.; Agoi, A.G. An analysis of food security situation among Nigerian urban households: Evidence from Lagos State, Nigeria. J. Cent. Eur. Agric. 2007, 8, 397–406. [Google Scholar]
- Oluyole, K.A.; Oni, O.A.; Omonoma, B.T.; Adenegan, K.O. Food security among cocoa farming households of Ondo State, Nigeria. J. Agric. Bio. Sci. 2009, 4, 7–13. [Google Scholar]
- Paddy, F. Gender differentials in land ownership and their impact on household food security: A case study of Masaka district. Master’s Thesis, University of Hohenheim, Hohenheim, Germany, 2003. [Google Scholar]
- Babatunde, R.O.; Qaim, M. Impact of off-farm income on food security and nutrition in Nigeria. Food Policy 2010, 35, 303–311. [Google Scholar] [CrossRef]
- Nkomoki, W.; Bavorová, M.; Banout, J. Factors associated with household food security in Zambia. Sustainability 2019, 11, 2715. [Google Scholar] [CrossRef] [Green Version]
- Otekunrin, O.A.; Otekunrin, O.A.; Ayinde, I.A.; Sanusi, R.A.; Onabanjo, O.O.; Ariyo, O. Dietary diversity, environment and health-related factors of under-five children: Evidence from cassava commercialization households in rural South-West Nigeria. Environ. Sc. Pollut. Res. 2021, 1–15. [Google Scholar] [CrossRef] [PubMed]

| Global Food Security Index (GFSI) Score (0–100) | |||||||||||||
|---|---|---|---|---|---|---|---|---|---|---|---|---|---|
| S/N | Rank G/A | Δ | Country | 2012 | 2013 | 2014 | 2015 | 2016 | 2017 | 2018 | 2019 | 2020 | Δ |
| 1 | 58/2 | ▼1 | Algeria | 50.1 | 55.4 | 54.7 | 56.9 | 60.0 | 59.1 | 61.8 | 62.8 | 61.8 | −1.0 |
| 2 | 97/19 | ▲3 | Angola | 41.6 | 41.7 | 39.1 | 36.1 | 35.6 | 38.4 | 41.1 | 40.5 | 42.1 | +1.6 |
| 3 | 92/15 | ↔ | Benin | 41.2 | 43.0 | 43.3 | 41.5 | 44.5 | 46.6 | 45.7 | 46.1 | 46.2 | +0.1 |
| 4 | 74/6 | ▲1 | Botswana | 53.3 | 54.7 | 53.7 | 54.2 | 52.8 | 54.2 | 55.0 | 54.3 | 55.5 | +1.2 |
| 5 | 88/12 | ▼3 | Burkina Faso | 40.6 | 43.1 | 43.8 | 43.5 | 45.2 | 45.0 | 47.0 | 48.7 | 47.4 | −1.3 |
| 6 | 107/27 | ▲5 | Burundi | 38.2 | 37.5 | 40.5 | 36.9 | 38.3 | 39.2 | 38.4 | 35.8 | 37.1 | +1.3 |
| 7 | 94/17 | ↔ | Cameroon | 42.5 | 43.5 | 44.7 | 45.8 | 47.3 | 46.3 | 45.8 | 44.4 | 44.7 | +0.3 |
| 8 | 103/24 | ↔ | Chad | 32.4 | 34.8 | 32.9 | 36.3 | 35.5 | 35.4 | 36.4 | 39.3 | 39.4 | +0.1 |
| 9 | 98/20 | ▲3 | Congo (Dem. Rep) | 37.3 | 37.7 | 38.0 | 37.4 | 35.2 | 39.5 | 39.8 | 40.4 | 40.7 | +0.3 |
| 10 | 82/9 | ↔ | Cote d’Ivoire | 45.0 | 46.1 | 46.2 | 44.6 | 46.3 | 46.1 | 48.5 | 50.9 | 51.0 | +0.1 |
| 11 | 60/4 | ▼11 | Egypt | 63.2 | 59.3 | 64.0 | 62.9 | 60.0 | 60.1 | 62.9 | 65.4 | 61.1 | −4.3 |
| 12 | 108/28 | ↔ | Ethiopia | 34.7 | 39.3 | 38.8 | 37.3 | 41.5 | 38.6 | 40.0 | 37.1 | 37.0 | −0.1 |
| 13 | 77/7 | ▲4 | Ghana | 48.6 | 49.5 | 50.4 | 51.3 | 52.1 | 53.2 | 54.3 | 53.4 | 53.0 | −0.4 |
| 14 | 102/23 | ▼5 | Guinea | 35.2 | 36.7 | 43.2 | 36.8 | 40.1 | 40.3 | 42.2 | 42.6 | 39.5 | −3.1 |
| 15 | 86/10 | ↔ | Kenya | 43.2 | 41.7 | 42.2 | 41.1 | 42.2 | 46.5 | 48.7 | 48.5 | 49.0 | +0.5 |
| 16 | 106/26 | ▲1 | Madagascar | 38.8 | 36.8 | 37.8 | 37.5 | 37.9 | 34.8 | 37.0 | 38.0 | 37.5 | −0.5 |
| 17 | 110/30 | ↔ | Malawi | 32.2 | 34.6 | 35.2 | 32.5 | 32.9 | 37.7 | 42.3 | 36.1 | 36.7 | +0.6 |
| 18 | 79/8 | ↔ | Mali | 49.7 | 50.9 | 50.4 | 50.2 | 49.6 | 49.8 | 51.7 | 51.9 | 52.7 | +0.8 |
| 19 | 57/1 | ▲1 | Morocco | 55.4 | 57.8 | 58.7 | 60.2 | 60.1 | 60.3 | 61.7 | 61.4 | 62.0 | +0.6 |
| 20 | 99/21 | ▲5 | Mozambique | 37.8 | 39.4 | 40.2 | 34.7 | 32.6 | 41.8 | 42.0 | 38.7 | 40.6 | +1.9 |
| 21 | 87/11 | ▲2 | Niger | 43.2 | 42.7 | 42.6 | 44.7 | 44.1 | 42.9 | 47.0 | 47.9 | 47.6 | −0.3 |
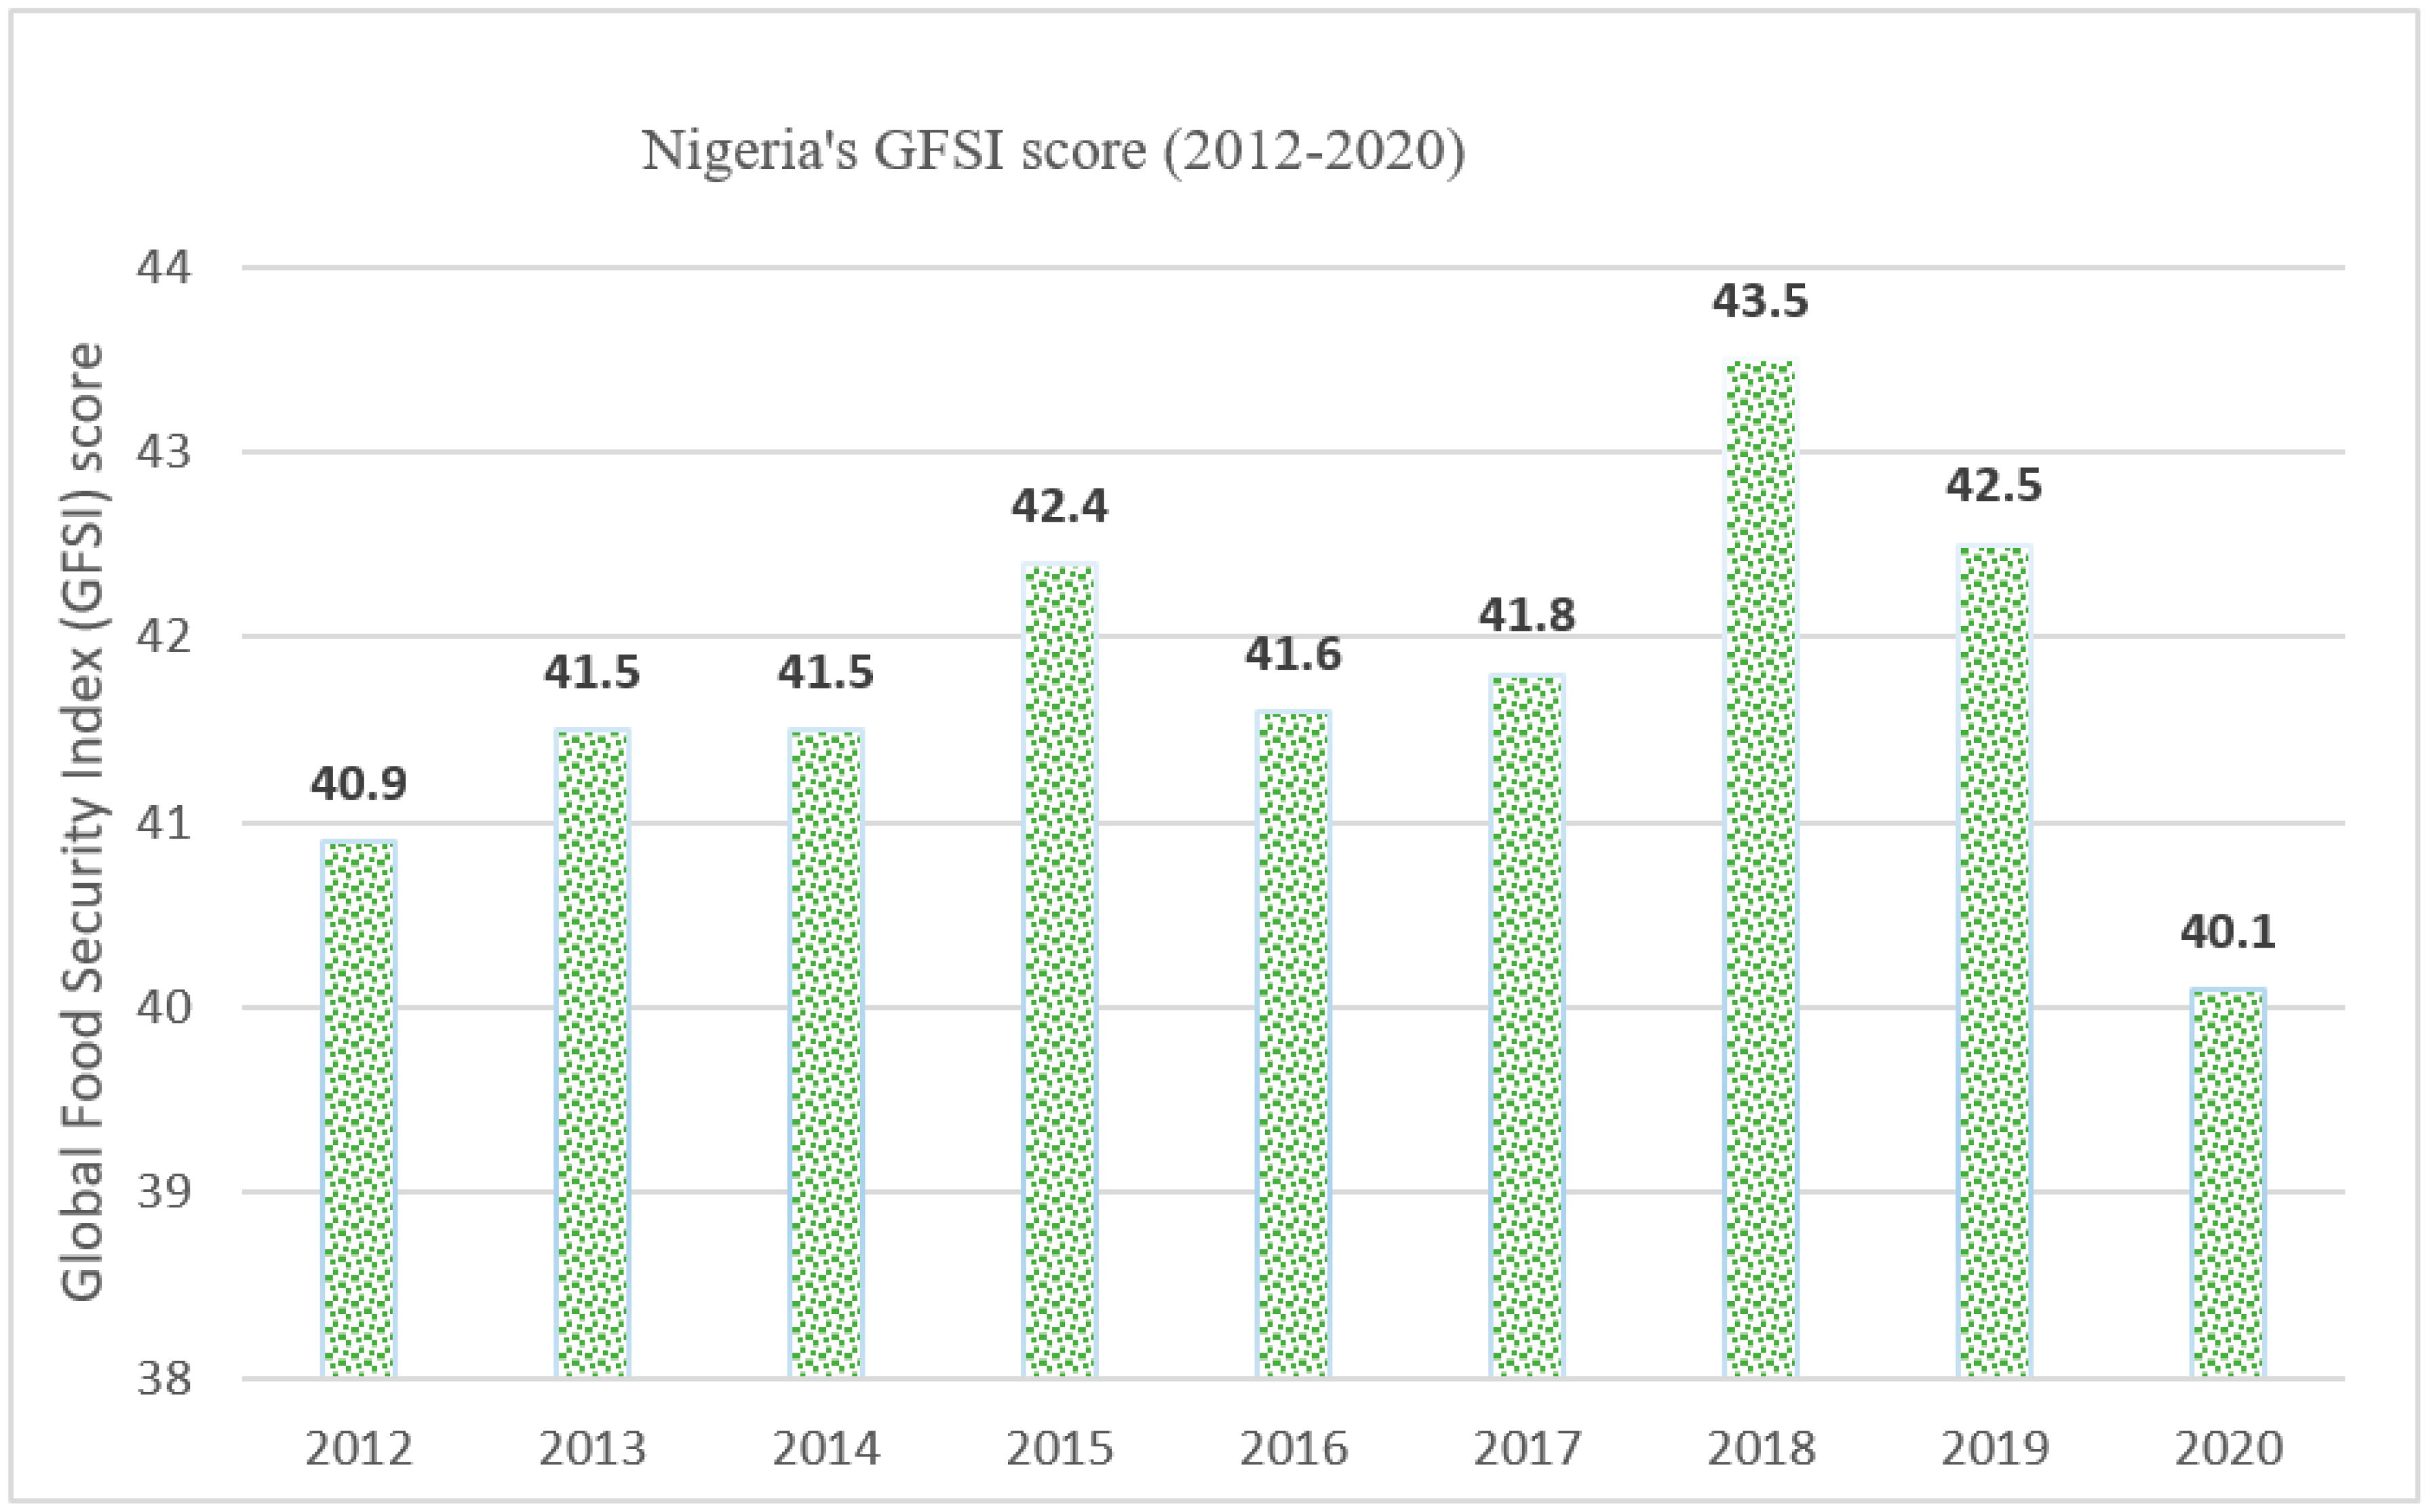
| 22 | 100/22 | ▼2 | Nigeria | 40.9 | 41.5 | 41.5 | 42.4 | 41.6 | 41.8 | 43.5 | 42.5 | 40.1 | −2.4 |
| 23 | 104/25 | ▲1 | Rwanda | 38.0 | 42.1 | 45.2 | 40.8 | 39.6 | 44.6 | 45.1 | 38.5 | 38.8 | +0.3 |
| 24 | 90/14 | ▼2 | Senegal | 44.4 | 44.9 | 45.6 | 49.2 | 46.3 | 47.3 | 47.0 | 48.1 | 46.4 | −1.7 |
| 25 | 108/28 | ▼6 | Sierra Leone | 33.2 | 33.8 | 40.4 | 39.8 | 38.4 | 37.4 | 37.4 | 39.4 | 37.0 | −2.4 |
| 26 | 69/5 | ▼2 | South Africa | 57.4 | 61.0 | 60.1 | 63.7 | 61.0 | 62.7 | 63.2 | 59.2 | 57.8 | −1.4 |
| 27 | 112/32 | ▼3 | Sudan | 28.2 | 28.1 | 33.0 | 37.8 | 36.0 | 37.5 | 38.0 | 36.6 | 36.0 | −0.6 |
| 28 | 89/13 | ▲4 | Tanzania | 37.8 | 40.4 | 40.4 | 39.9 | 44.1 | 45.1 | 47.0 | 45.6 | 47.1 | +1.5 |
| 29 | 93/16 | ▼2 | Togo | 40.4 | 43.0 | 43.5 | 39.3 | 42.6 | 46.1 | 44.0 | 46.5 | 44.9 | −1.6 |
| 30 | 59/3 | ▲2 | Tunisia | 56.8 | 57.8 | 59.5 | 60.4 | 61.3 | 59.4 | 62.2 | 60.8 | 61.4 | +0.6 |
| 31 | 95/18 | ↔ | Uganda | 43.2 | 42.4 | 44.1 | 42.3 | 44.6 | 45.6 | 45.0 | 43.4 | 42.9 | −0.5 |
| 32 | 111/31 | ▼5 | Zambia | 38.0 | 41.0 | 39.3 | 35.2 | 43.5 | 43.0 | 41.2 | 38.3 | 36.6 | −1.7 |
| Question | Frequency | ||
|---|---|---|---|
| Rarely (1) | Sometimes (2) | Often (3) | |
| Q1a | |||
| Q2a | |||
| Q3a | |||
| Q4a | |||
| Q5a | |||
| Q6a | |||
| Q7a | |||
| Q8a | |||
| Q9a |
 FS;
FS;  MiFI;
MiFI;  MoFI;
MoFI;  SFI.
SFI.| Variable | Description | Mean | Std. Dev |
|---|---|---|---|
| AGE | Age of household heads (years) | 50.18 | 11.72 |
| GEND | Gender of farmers (1 male, 0 female) | 0.85 | 0.36 |
| MARSTAT | Marital status of household heads (1 married, 0 otherwise) | 0.89 | 0.32 |
| HHSIZE | Number of Household members | 6.42 | 3.18 |
| EDULEVEL | Number of years spent in school | 6.84 | 4.93 |
| FARMSIZ | Size of the farm used for cassava production (hectare) | 1.51 | 1.05 |
| FARMEXP | Cassava Farming experience (years) | 15.23 | 10.87 |
| FARMINC | Farm income of the farmers (Naira) | ₦102,682.46 | ₦74,199.14 |
| NONFARMINC | Non-farm income of the farmers (Naira) | ₦47,052.13 | ₦79,839.14 |
| COOPMEMSHP | Member of farmers’ association (1 if yes, 0 otherwise) | 0.16 | 0.36 |
| EXTENSION | Access to extension services (if yes 1, 0 otherwise) | 0.22 | 0.41 |
| FOODEXP | Farmers’ household Food expenditure (Naira) | ₦21,535.55 | ₦11,180.02 |
| No | Yes | ||
|---|---|---|---|
| Incidence Question (N = 211) | Frequency (%) | Frequency (%) | |
| 1 | Concerned about not with food to eat? | 47 (22.27) | 164 (77.73) |
| 2 | Eating food you did not desire? | 47 (22.27) | 164 (77.73) |
| 3 | Eating monotonous foods? | 49 (23.22) | 162 (76.78) |
| 4 | Eating foods you did not want to eat? | 41 (19.43) | 170 (80.57) |
| 5 | Eating smaller size of meals? | 52 (24.64) | 159 (75.36) |
| 6 | Skipping some meals in a day? | 69 (32.70) | 142 (67.30) |
| 7 | No food to eat at all? | 112 (53.08) | 99 (46.92) |
| 8 | Go to bed hungry? | 154 (72.99) | 57 (27.01) |
| 9 | Not eating anything throughout the day (24 h)? | 196 (92.89) | 15 (7.11) |
| Repetitiveness of Food Insecurity Condition | ||||
|---|---|---|---|---|
| Incidence Question | Rarely | Sometimes | Often | Total (N) |
| Freq (%) | Freq (%) | Freq (%) | ||
| 1a. Concerned about not with food to eat? | 28 (17.07) | 62 (37.80) | 74 (45.12) | 164 |
| 2a. Eating food you did not like? | 28 (17.07) | 76 (46.34) | 60 (36.59) | 164 |
| 3a. Eating monotonous foods? | 13 (8.02) | 88 (54.32) | 61 (37.65) | 162 |
| 4a. Eating foods you did not want to eat? | 21 (12.35) | 100 (58.82) | 49 (28.82) | 170 |
| 5a. Eating smaller size of meals? | 23 (14.47) | 84 (52.83) | 52 (32.70) | 159 |
| 6a. Skipping some meals in a day? | 16 (11.27) | 81 (57.04) | 45 (31.69) | 142 |
| 7a. No food to eat at all? | 29 (29.29) | 48 (48.48) | 22 (22.22) | 99 |
| 8a. Go to bed hungry? | 18 (31.58) | 25 (43.86) | 14 (24.56) | 57 |
| 9a. Not eating anything throughout the day (24 h)? | 11 (73.33) | 3 (20.00) | 1 (6.67) | 15 |
| Food Secure (n = 27) | Mildly Food Secure (n = 11) | Moderately Food Secure (n = 59) | Severely Food Secure (n = 114) | Pooled (n = 211) | |
|---|---|---|---|---|---|
| Frequency (%) | Frequency (%) | Frequency (%) | Frequency (%) | Frequency (%) | |
| Age of household head | |||||
| ≤40 years | 4 (14.8) | 2 (18.2) | 7 (11.9) | 27 (23.7) | 40 (19.0) |
| 41–50 years | 10 (37.0) | 5 (45.5) | 28 (47.5) | 45 (39.5) | 88 (41.7) |
| 51–60 years | 9 (33.3) | 2 (18.2) | 10 (16.9) | 28 (24.6) | 49 (23.2) |
| >60 years | 4 (14.8) | 2 (18.2) | 14 (23.7) | 14 (12.3) | 34 (16.1) |
| Gender | |||||
| Male headed households | 26 (96.3) | 11 (100.0) | 52 (88.1) | 91 (79.8) | 180 (85.3) |
| Female headed households | 1 (14.7) | 0 (0.0) | 7 (11.9) | 23 (20.2) | 31 (14.7) |
| Marital Status | |||||
| Married/Co-habiting | 26 (96.3) | 10 (90.9) | 48 (81.4) | 103 (90.4) | 187 (88.6) |
| Single/Separated/Widow(er) | 1 (3.7) | 1 (9.1) | 11 (18.6) | 11 (9.6) | 24 (11.4) |
| Education level (years) | |||||
| No formal education | 7 (25.9) | 3 (27.3) | 17 (28.8) | 24 (21.1) | 51 (24.2) |
| Primary | 9 (33.3) | 6 (54.5) | 26 (44.1) | 47 (41.2) | 88 (41.7) |
| Secondary | 7 (25.9) | 2 (18.2) | 15 (25.4) | 35 (30.7) | 59 (28.0) |
| Tertiary | 4 (14.8) | 0 (0.0) | 1 (1.7) | 8 (7.0) | 13 (6.2) |
| Household size (persons) | |||||
| ≤5 | 11 (40.7) | 6 (54.5) | 24 (40.7) | 54 (47.4) | 95 (45.0) |
| 6–10 | 15 (55.6) | 3 (27.3) | 29 (49.2) | 50 (43.9) | 97 (46.0) |
| 11–15 | 1 (3.7) | 1 (9.1) | 6 (10.2) | 8 (7.0) | 16 (7.6) |
| >16 | 0 (0.0) | 1 (9.1) | 0 (0.0) | 2 (1.8) | 3 (1.4) |
| Membership of cooperative | |||||
| Yes | 4 (14.8) | 0 (0.0) | 2 (3.4) | 27 (23.7) | 33 (15.6) |
| No | 23 (85.2) | 11 (100.0) | 57 (96.6) | 87 (76.3) | 178 (84.4) |
| Food expenditure (Naira) | |||||
| ≤₦10,000 | 4 (14.8) | 3 (27.3) | 7 (11.9) | 11 (9.6) | 25 (11.8) |
| ₦11,000–₦20,000 | 17 (63.0) | 5 (45.5) | 32 (54.2) | 63 (55.3) | 117 (55.5) |
| ₦21,000–₦30,000 | 2 (7.4) | 1 (9.1) | 8 (13.6) | 21 (18.4) | 32 (15.2) |
| >₦30,000 | 4 (14.8) | 2 (18.2) | 12 (20.3) | 19 (20.3) | 37 (17.5) |
| Extension service | |||||
| Have access | 4 (14.8) | 0 (0.0) | 4 (6.8) | 38 (33.3) | 46 (21.8) |
| No have access | 23 (85.2) | 11 (100.0) | 55 (93.2) | 76 (66.7) | 165 (78.2) |
| Food Secure (n = 27) | Mildly Food Secure (n = 11) | Moderately Food Secure (n = 59) | Severely Food Secure (n = 114) | Pooled (n = 211) | |
|---|---|---|---|---|---|
| Frequency (%) | Frequency (%) | Frequency (%) | Frequency (%) | Frequency (%) | |
| Farm size (hectare) | |||||
| ≤1.00 | 10 (37.0) | 5 (45.5) | 16 (27.1) | 52 (45.6) | 83 (39.3) |
| 1.01–2.00 | 7 (25.9) | 2 (18.2) | 20 (33.9) | 36 (31.6) | 65 (30.8) |
| 2.01–3.00 | 8 (29.6) | 3 (27.3) | 12 (20.3) | 18 (15.8) | 41 (19.4) |
| >3.00 | 2 (7.4) | 1 (9.1) | 11 (18.6) | 8 (7.0) | 22 (10.4) |
| Farm experience (years) | |||||
| ≤10 | 9 (33.3) | 6 (54.5) | 25 (42.4) | 54 (47.4) | 94 (44.5) |
| 11–20 | 12 (44.4) | 4 (36.4) | 23 (39.0) | 35 (30.7) | 74 (35.1) |
| 21–30 | 4 (14.8) | 1 (9.1) | 5 (8.5) | 18 (15.8) | 28 (13.3) |
| >30 | 2 (7.4) | 0 (0.0) | 6 (10.2) | 7 (6.1) | 15 (7.1) |
| Farm income (Naira) | |||||
| ≤₦50,000 | 9 (33.3) | 1 (9.1) | 12 (20.3) | 26 (22.8) | 48 (22.7) |
| ₦51,000–₦100,000 | 11 (40.7) | 2 (18.2) | 17 (28.8) | 32 (28.1) | 62 (29.4) |
| ₦101,000–₦200,000 | 5 (18.5) | 5 (45.5) | 27 (45.8) | 47 (41.2) | 84 (39.8) |
| >₦200,000 | 2 (7.4) | 3 (27.3) | 3 (5.1) | 9 (7.9) | 17 (8.1) |
| Nonfarm income (Naira) | |||||
| ≤₦50,000 | 6 (22.2) | 3 (27.3) | 15 (25.4) | 27 (23.7) | 51 (24.2) |
| ₦51,000–₦100,000 | 9 (33.3) | 5 (45.5) | 36 (61.0) | 63 (55.3) | 113 (53.6) |
| ₦101,000–₦200,000 | 9 (33.3) | 2 (18.2) | 6 (10.2) | 21 (18.4) | 38 (18.0) |
| >₦200,000 | 3 (11.1) | 1 (9.1) | 2 (3.4) | 3 (2.6) | 9 (4.3) |
| Transport cost (Naira) | |||||
| ≤₦2000 | 3 (11.1) | 1 (9.1) | 10 (16.9) | 19 (16.7) | 33 (15.6) |
| ₦2100–₦4000 | 17 (63.0) | 7 (63.6) | 38 (64.4) | 61 (53.5) | 123 (58.3) |
| >₦4000 | 7 (25.9) | 3 (27.3) | 11 (18.6) | 34 (29.8) | 55 (26.1) |
| Food Secure (n = 27) | Mildly Food Secure (n = 11) | Moderately Food Secure (n = 59) | Severely Food Secure (n = 114) | Pooled (n = 211) | |
|---|---|---|---|---|---|
| Frequency (%) | Frequency (%) | Frequency (%) | Frequency (%) | Frequency (%) | |
| Access to nutrition training | |||||
| Have access | 4 (14.8) | 0 (0.0) | 2 (3.4) | 21 (18.4) | 27 (12.8) |
| No access | 23 (85.2) | 11 (100.0) | 57 (96.6) | 93 (81.6) | 184 (87.2) |
| Access to Electricity | |||||
| Have access | 4 (14.8) | 0 (0.0) | 2 (3.4) | 37 (32.5) | 43 (20.4) |
| No access | 23 (85.2) | 11 (100.0) | 57 (96.6) | 77 (67.5) | 168 (79.6) |
| Access to Piped water | |||||
| Have access | 3 (11.1) | 0 (0.0) | 0 (0.0) | 5 (4.4) | 8 (3.8) |
| No access | 24 (88.9) | 11 (100.0) | 59 (100.0) | 109 (95.6) | 203 (96.2) |
| Access to improved toilet | |||||
| Have access | 4 (14.8) | 0 (0.0) | 2 (3.4) | 32 (28.1) | 38 (18.0) |
| No access | 23 (85.2) | 11 (100.0) | 57 (96.6) | 82 (71.9) | 173 (82.0) |
| Access to healthcare service | |||||
| Have access | 11 (40.7) | 2 (18.2) | 18 (30.5) | 57 (50.0) | 88 (41.7) |
| No access | 16 (59.3) | 9 (81.8) | 41 (69.5) | 57 (50.0) | 123 (58.3) |
| Food Secure | Mildly Food Insecure | Moderately Food Insecure | Severely Food Insecure | ||
|---|---|---|---|---|---|
| Variable | Coefficients | dy/dx | dy/dx | dy/dx | dy/dx |
| Age | 0.0365 ** | 0.0029 ** | 0.0012 * | 0.0049 * | −0.0089 ** |
| (0.0185) | (0.0014) | (0.0007) | (0.0027) | (0.0045) | |
| +Gender | 1.3049 *** | 0.0719 *** | 0.0323 ** | 0.1754 *** | −0.2796 *** |
| (0.5022) | (0.0228) | (0.0131) | (0.0621) | (0.0858) | |
| +Marital Status | −0.4313 | −0.0388 | −0.0153 | −0.0530 | 0.1071 |
| (0.4348) | (0.0442) | (0.0172) | (0.0488) | (0.1081) | |
| Household Size | 0.0129 | 0.0010 | 0.0004 | 0.0017 | −0.0032 |
| (0.0588) | (0.0046) | (0.0019) | (0.0079) | (0.0144) | |
| Years of schooling | 0.1498 ** | 0.0117 ** | 0.0049 ** | 0.0201 ** | −0.0368 ** |
| (0.0600) | (0.0050) | (0.0024) | (0.0088) | (0.0147) | |
| Farm Size | 0.3360 *** | 0.0263 ** | 0.0110 ** | 0.0452 ** | −0.0824 *** |
| (0.1292) | (0.0107) | (0.0049) | (0.0194) | (0.0315) | |
| Farm Experience | −0.0412 ** | −0.0032 ** | −0.0014 * | −0.0055 ** | 0.0101** |
| (0.0178) | (0.0013) | (0.0007) | (0.0027) | (0.0043) | |
| Farm Income | −8.53 × 10⁻⁷ | −6.67 × 10⁻⁸ | −2.79 × 10⁻⁸ | −1.15 × 10⁻⁷ | 2.09 × 10⁻⁷ |
| (1.97 × 10⁻⁶) | (0.0000) | (0.0000) | (0.0000) | (0.0000) | |
| Non-farm Income | 4.00 × 10⁻⁶ ** | 3.12 × 10⁻⁷ ** | 1.31 × 10⁻⁷ * | 5.37 × 10⁻⁷ ** | −9.81 × 10⁻⁷ ** |
| (1.87 × 10⁻⁶) | (0.0000) | (0.0000) | (0.0000) | (0.0000) | |
| +Membership of Cooperative | −0.3875 | −0.0272 | −0.0117 | −0.0538 | 0.0927 |
| (0.9964) | (0.0617) | (0.0279) | (0.1416) | (0.2305) | |
| Food Expenditure | −0.000036 ** | −2.79 × 10⁻⁶ ** | −1.17 × 10⁻⁶ * | −4.81 × 10⁻⁶ * | 8.77 × 10⁻⁶ ** |
| (0.00002) | (0.0000) | (0.0000) | (0.0000) | (0.0000) | |
| +Access to extension service | −2.2925 *** | −0.1182 *** | −0.0516 *** | −0.2741 *** | 0.4439 *** |
| (0.7985) | (0.0383) | (0.0190) | (0.0680) | (0.1038) | |
| +Access to piped water | 1.2061 | 0.1478 | 0.0473 | 0.0923 *** | −0.2874 |
| (1.6349) | (0.2886) | (0.0653) | (0.0311) | (0.3398) | |
| +Access to healthcare services | −0.8199 * | −0.0615 * | −0.0258 | −0.1093 * | 0.1966 * |
| (0.4711) | (0.0349) | (0.0162) | (0.0637) | (0.1090) | |
| /cut1 | 2.4761 | ||||
| (0.9205) | |||||
| /cut2 | 4.1299 | ||||
| (0.9565) | |||||
| /cut3 | 4.5726 | ||||
| (0.9740) |
Publisher’s Note: MDPI stays neutral with regard to jurisdictional claims in published maps and institutional affiliations. |
© 2021 by the authors. Licensee MDPI, Basel, Switzerland. This article is an open access article distributed under the terms and conditions of the Creative Commons Attribution (CC BY) license (https://creativecommons.org/licenses/by/4.0/).
Share and Cite
Otekunrin, O.A.; Otekunrin, O.A.; Sawicka, B.; Pszczółkowski, P. Assessing Food Insecurity and Its Drivers among Smallholder Farming Households in Rural Oyo State, Nigeria: The HFIAS Approach. Agriculture 2021, 11, 1189. https://doi.org/10.3390/agriculture11121189
Otekunrin OA, Otekunrin OA, Sawicka B, Pszczółkowski P. Assessing Food Insecurity and Its Drivers among Smallholder Farming Households in Rural Oyo State, Nigeria: The HFIAS Approach. Agriculture. 2021; 11(12):1189. https://doi.org/10.3390/agriculture11121189
Chicago/Turabian StyleOtekunrin, Olutosin A., Oluwaseun A. Otekunrin, Barbara Sawicka, and Piotr Pszczółkowski. 2021. "Assessing Food Insecurity and Its Drivers among Smallholder Farming Households in Rural Oyo State, Nigeria: The HFIAS Approach" Agriculture 11, no. 12: 1189. https://doi.org/10.3390/agriculture11121189
APA StyleOtekunrin, O. A., Otekunrin, O. A., Sawicka, B., & Pszczółkowski, P. (2021). Assessing Food Insecurity and Its Drivers among Smallholder Farming Households in Rural Oyo State, Nigeria: The HFIAS Approach. Agriculture, 11(12), 1189. https://doi.org/10.3390/agriculture11121189