Article

Estimation of Dry Matter Production and Yield Prediction in Greenhouse Cucumber without Destructive Measurements

National Agricultural and Food Research Organization, Tsukuba 305-8519, Japan
*
Author to whom correspondence should be addressed.
Agriculture 2021, 11(12), 1186; https://doi.org/10.3390/agriculture11121186
Submission received: 26 October 2021 / Revised: 23 November 2021 / Accepted: 23 November 2021 / Published: 24 November 2021
(This article belongs to the Section Crop Production)

Abstract

:
In this study, we aimed to estimate dry matter (DM) production and fresh fruit yield in “Fresco-dash” (FD) and “Project X” (PX) cucumber cultivars using an empirical model developed for tomatoes. First, we cultivated the two cucumber cultivars under a hydroponic system for about six months. Also, parameters related to DM production such as light use efficiency (LUE), light extinction coefficient (k), DM distribution of fruits (DMD), and fruit dry matter content (DMC) were measured via destructive measurements. The k, DMD and DMC values were 0.99 and 0.93, 46.0 and 45.2, 3.84 and 3.78 in “Fresco Dash” and “Project X”, respectively. Second, we cultivated cucumbers to estimate DM production and fruit fresh yield using the model without destructive measurement for about eight months and validated the model’s effectiveness. The predicted DM fell within the range of the observed DM ± standard error at 51 and 132 d after transplantation (DAT) in PX as well as 51 (DAT) in FD. The predicted and observed DM at 163 DAT were 2.08 and 1.82 kg m−2, 2.09 and 1.87 kg m−2 in “Fresco Dash” and “Project X”, respectively. The predicted and observed fruit yield at 200 DAT were 30.3 and 31.7, 30.5 and 29.1 in “Fresco Dash” and “Project X”, respectively, which were 4.4% lower than the observed fruit yield in FD and 4.9% higher than that in PX. These results suggest that the model applies to cucumbers in predicting dry matter production and fresh fruit yield.

1. Introduction

The cultivation area and yield of Japanese cucumber (Cucumis sativus L.) in 2020 were 10,300 ha and 548,100 t, respectively [1]. Compared to 15 years ago, these indicate 23% and 19% decreases in cultivation area (13,400 ha) and yield (674,600 t), respectively [1]. Furthermore, low yields for Japanese cucumbers grown in the greenhouse and open field have been reported in the summer-autumn (3.4 kg m−2) and winter-spring (10.7 kg m−2) seasons [1]. This is significantly lower than the yield (72.8 kg m−2) reported in the Netherlands [2]. It is, therefore, necessary to develop methods that could increase yield and maintain cucumber production in Japan.
Prediction of growth and yield aid in the optimization of plant management and environmental control and improving labor management and sales planning. Plant growth models are tools based on scientific principles and mathematical relationships, allowing us to evaluate the different effects in plant management, environment, water supply. Moreover, a model is useful for analyzing potential and actual yields to detect declining factors [3]. Plant growth models are distinguished descriptive and explanatory models. A descriptive model is based on statistical and regression models with existing theoretical knowledge and practical experience. The explanatory model consists of a quantitative description of the mechanisms and processes [4]. Several models have been developed to predict yield and dry matter (DM) production [4,5,6,7,8,9,10], especially, functional–structural plant models have been used these days widely [11], and these models have been improved in various methods [12,13,14,15]. On the other hand, a mechanical photosynthesis-based yield prediction model for cucumbers that simulated yield and fruit size as well as improved plant management, has been reported [16]. However, the fruit potential growth rate was difficult to determine under a real greenhouse environment. Also, an empirical growth model for tomatoes, improving yield by optimizing their leaf area index (LAI), has been formulated [17,18]. The model consists of physiological and morphological features of the plant. DM production, is determined by the product of light interception in plants and light-use efficiency (LUE) [19]. The Intercepted light is determined by photosynthetically active radiation (PAR), leaf area index (LAI), and light extinction coefficients in the plant canopy. Several studies have previously also investigated these parameters in tomatoes [19,20].However, most previous research on greenhouse cucumbers in Japan has focused on pests, diseases and fruit quality [21]. While the model may apply to cucumbers, no previous applications or parameters have been identified.
In this study, the abovementioned tomato model was applied to cucumbers to validity. The parameters necessary for predicting DM production and fresh fruit yield in hydroponically cultivated cucumbers were determined. Additionally, estimated values calculated using the parameters obtained in our initial experiments were compared with measured values.

2. Materials and Methods

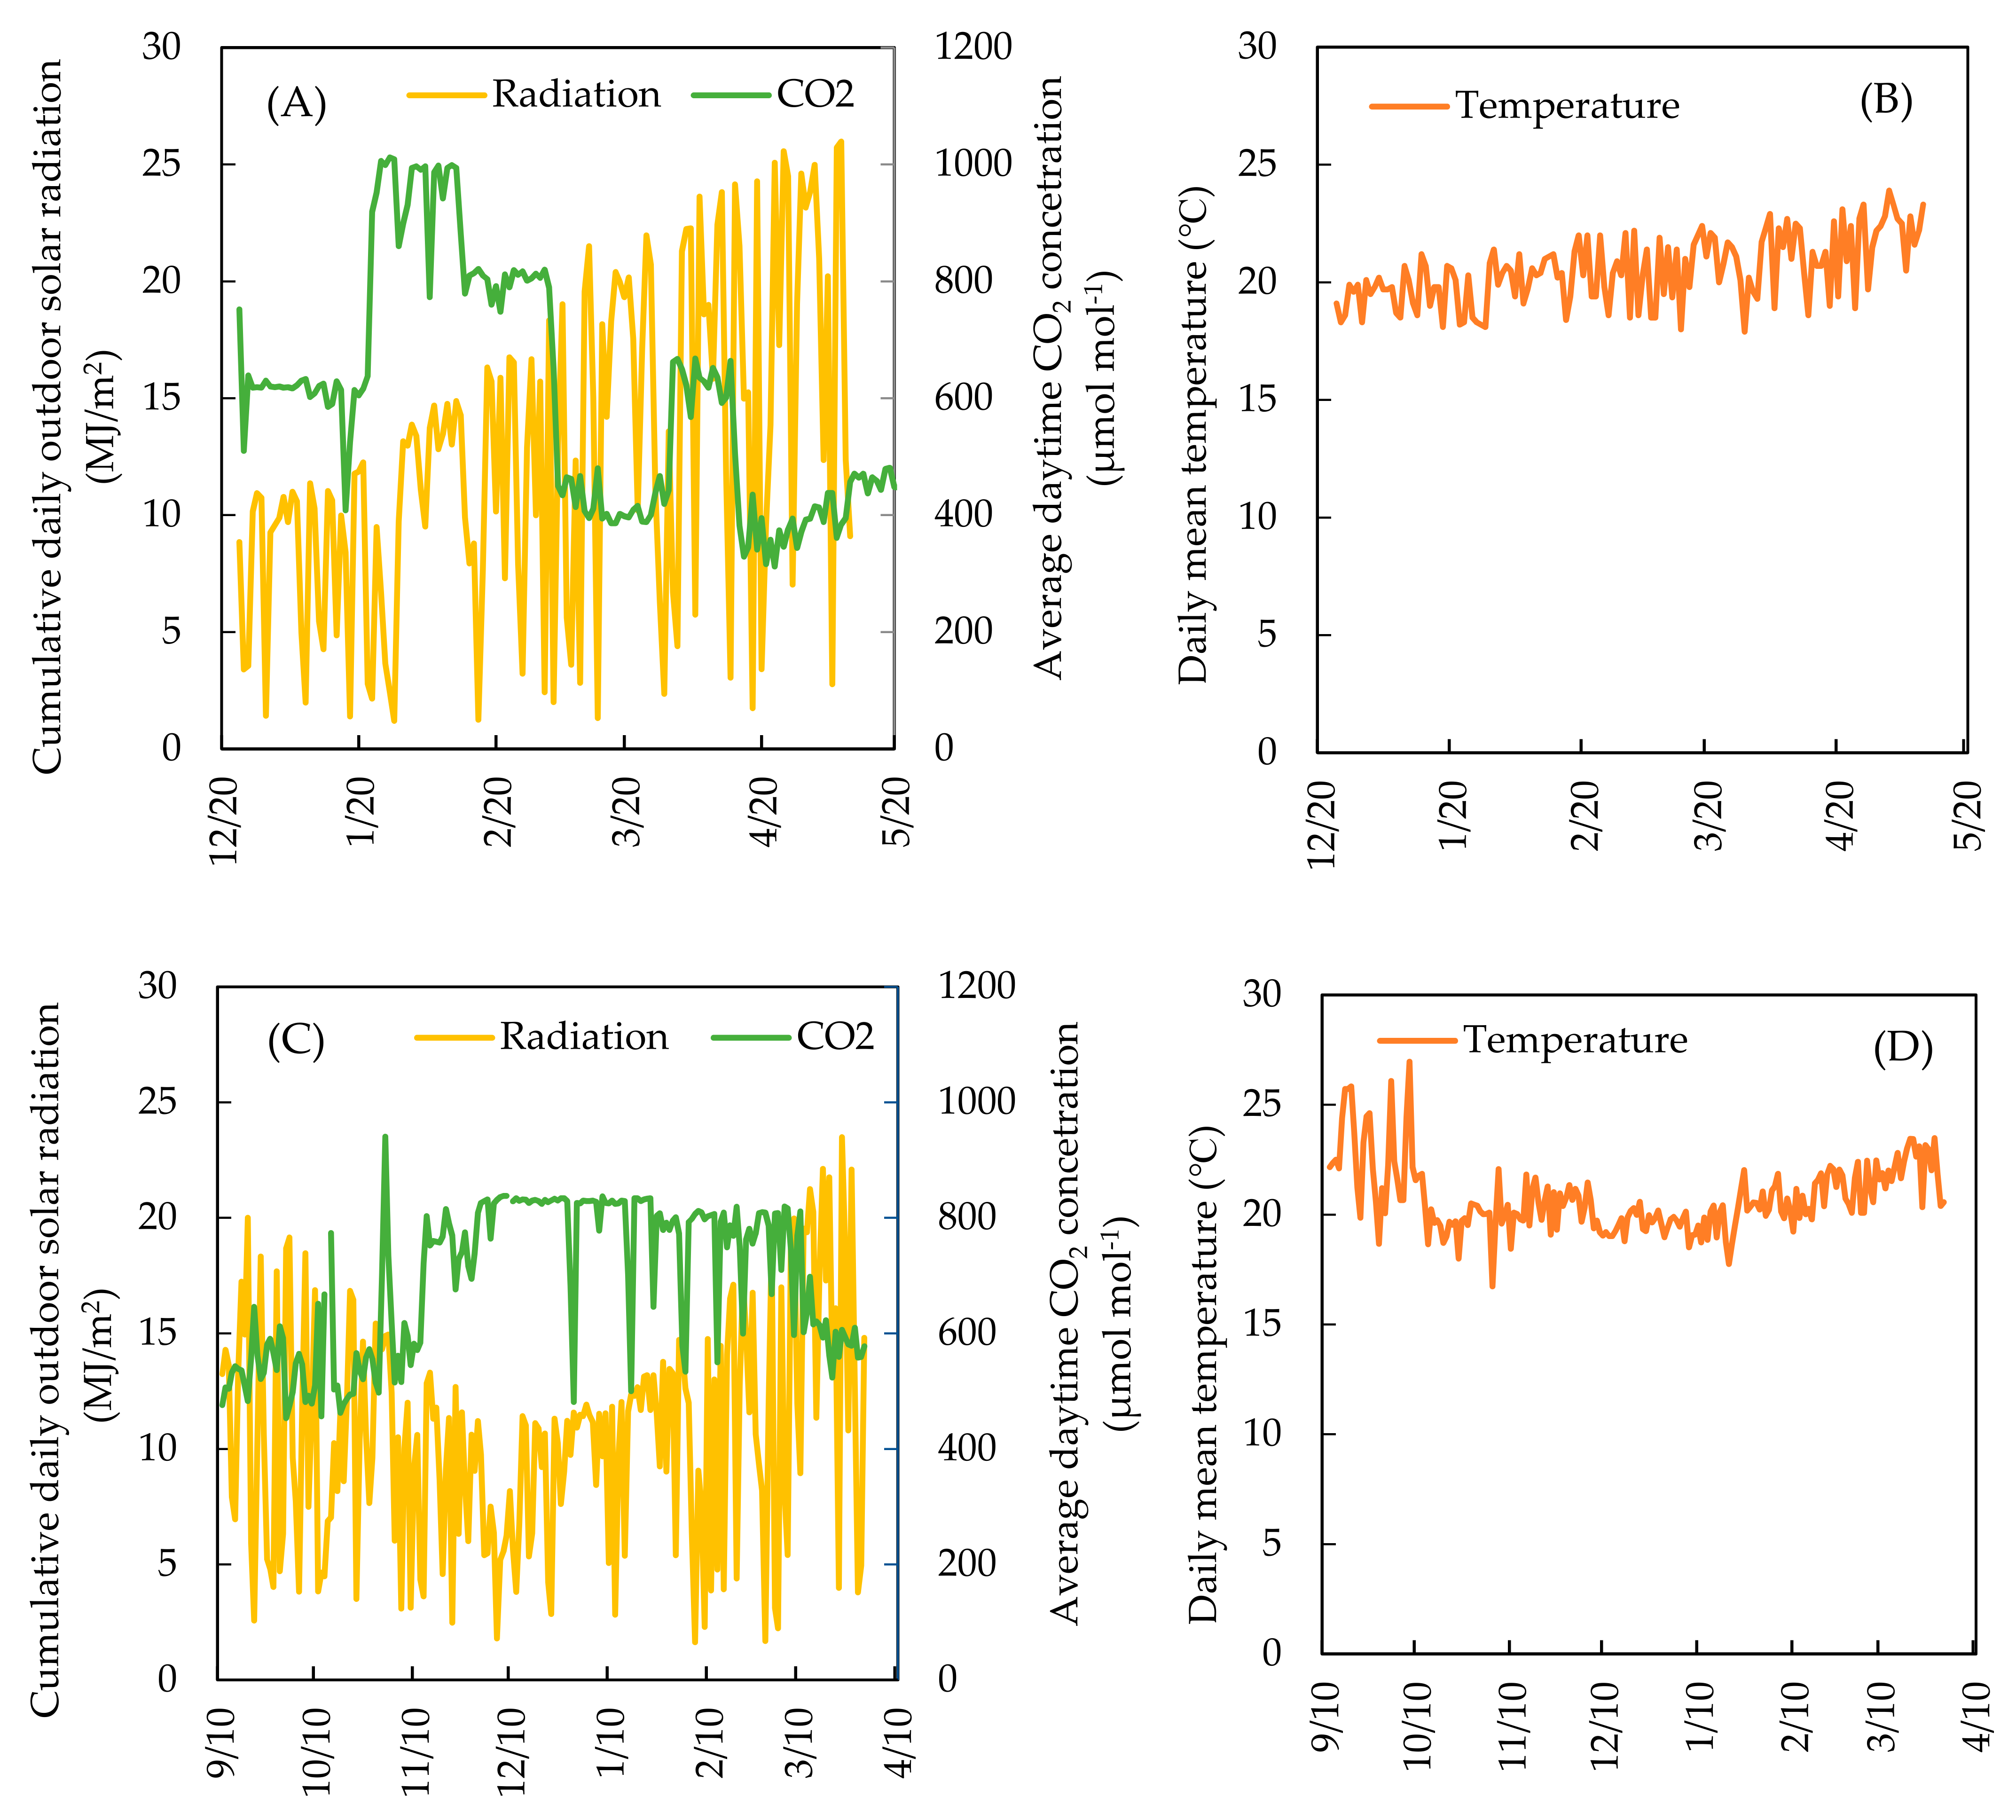
2.1. Plant Material and Growth Conditions

Parameters such as light extinction coefficient, DM distribution in fruit, fruit dry matter content, and the relationship between LUE and CO2 level of Japanese cucumbers were determined. The experiments were conducted in a greenhouse (7.15 m width, 16 m length, and 4.0 m height; covered with polyolefin film) at the National Agriculture and Food Research Organization Institute of Vegetable and Floriculture Science (Tsukuba, Ibaraki, Japan). On 6 December 2019, two cucumber cultivars, seeds of “Fresco-dash” (FD; Kurume Vegetable Breeding Co., Ltd., Fukuoka, Japan) and “Project X” (PX; Tokiwa Co., Ltd., Saitama, Japan), were sown in cell trays filled with commercial soil included peat moss, vermiculite, perlite (Takii Cell Media TM-1, Takii & Co., Ltd., Kyoto, Japan). After germination under dark conditions at 28 °C for 1 d, they were transferred to a seedling growth chamber (NAE Terrace; Mitsubishi Chemical Agri Dream Co., Ltd., Tokyo, Japan) and grown for 15 d under a light/dark period of 16 h/8 h, light/dark temperature of 28 °C/20 °C, CO2 concentration of 1000 µmol mol−1, and light intensity of 400 µmol m−2 s−1. The plants were fertilized daily using a commercial nutrient solution (High-Tempo; Sumitomo Chemicals, Tokyo, Japan). Constitution of the nutrient solution was; 10.7 mmol·L−1 NO3−, 6.3 mmol·L−1 K+, 5.4 mmol·L−1 Ca2+, 1.9 mmol·L−1 Mg2+, 7.2 mmol·L−1 H2PO4, 3.8 mg·L−1 Fe, 0.38 mg·L−1 Mn, 0.26 mg·L−1 B, 0.15 mg·L−1 Zn, 0.05 mg·L−1 Cu, and 0.07 mg·L−1 Mo, adjusted to electrical conductivity of 1.8 dS·m−1. The seedlings were then transplanted in Rockwool slabs (1000 × 150 × 75 mm3) in the greenhouse. Plants were trained by the lowering method without pinching the main stems, but all laterals with the lower leaves were pruned weekly. The intra- and inter-row spacings were 16.7 and 80 cm, respectively, with planting densities of 3.75 plants·m−2. Four double rows (12 rockwool slabs per row) and side double rows were considered guard plants, and each double row was divided in two blocks (36 plants per block). Each cultivar was arranged over these blocks with two replications. The plants were supplied via drip irrigation with a commercial nutrient solution (OAT House fertilizer with modified-SA prescription; OAT Agrio Co., Ltd., Tokyo, Japan), which consisted of 17.6 mmol·L−1 NO3, 10.2 mmol·L−1 K+, 4.1 mmol·L−1 Ca2+, 1.5 mmol·L−1 Mg2+, 4.4 mmol·L−1 H2PO4, 2.3 mg·L−1 Fe, 1.2 mg·L−1 Mn, 0.58 mg·L−1 B, 0.09 mg·L−1 Zn, 0.03 mg·L−1 Cu, and 0.03 mg·L−1 Mo at an electrical conductivity of 2.6 dS·m−1. The nutrient solution supply interval was controlled based on the outdoor solar radiation. The environment of the greenhouse was controlled using an ubiquitous environmental control system (DIY Environmental Control System, WaBit Inc., Tokyo, Japan), in which data were recorded every minute (Figure 1). The temperature settings of the side window ventilation and hot air heater were 30 °C and 15 °C, respectively.

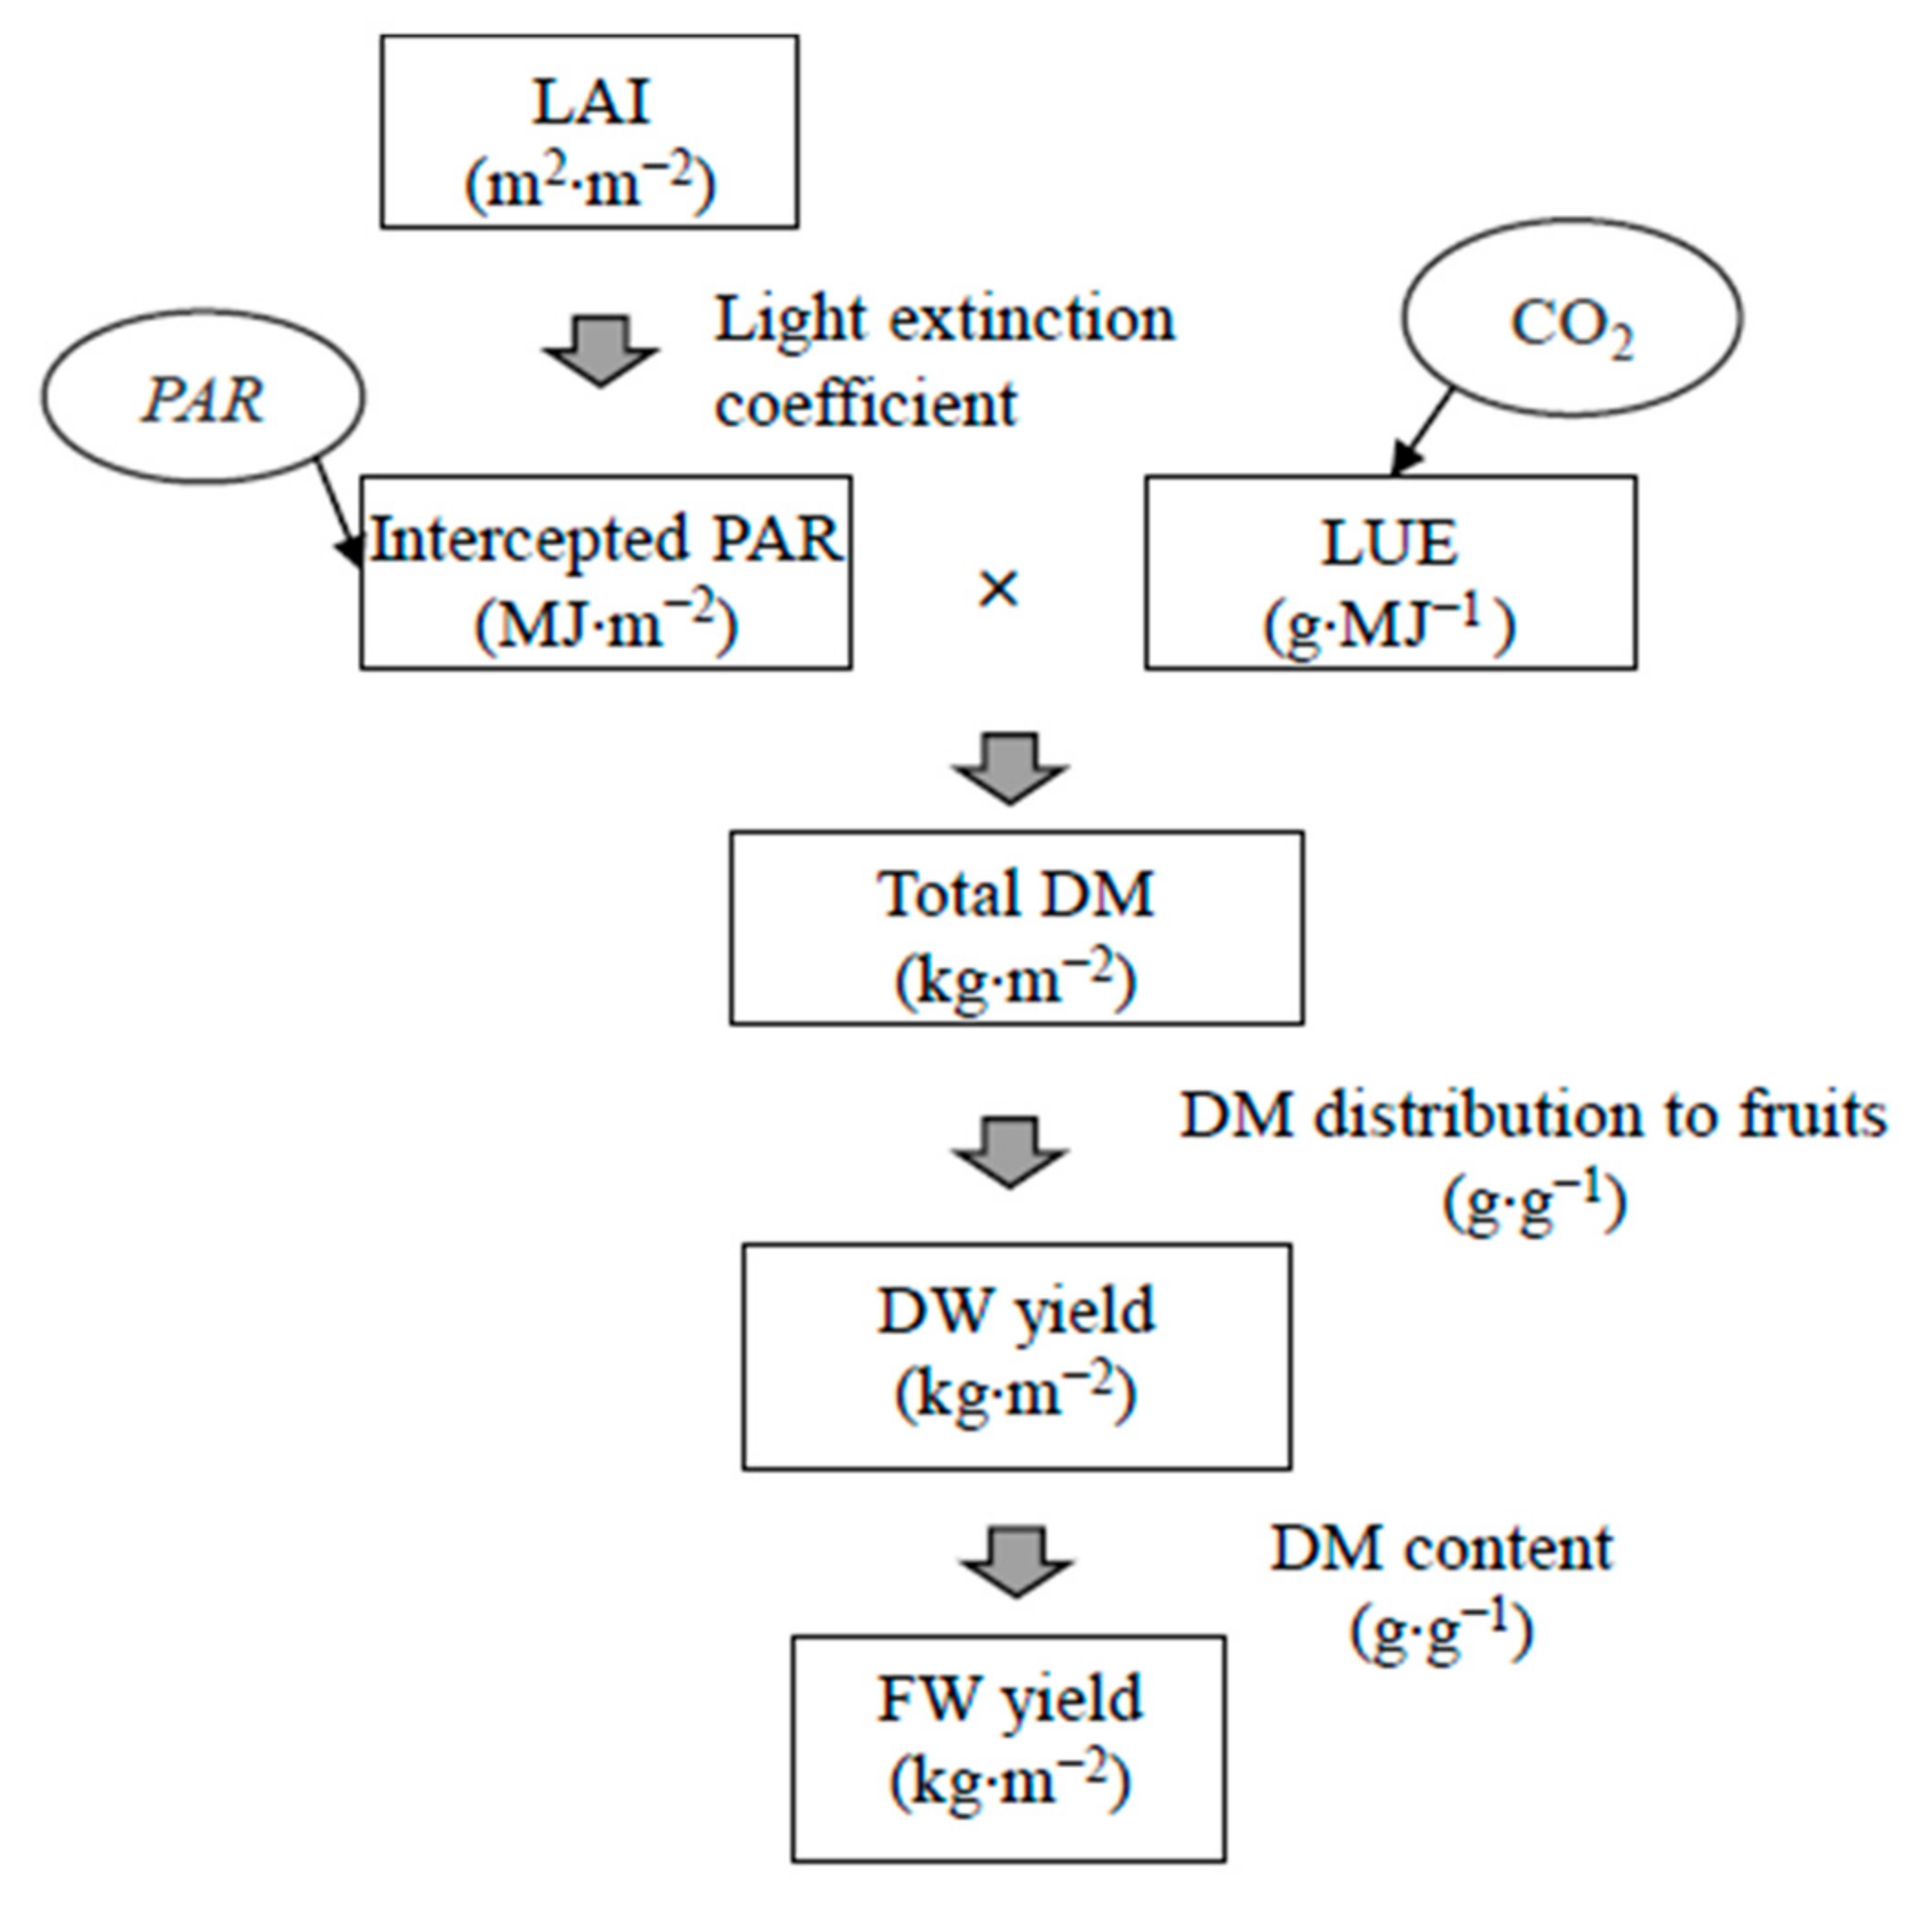
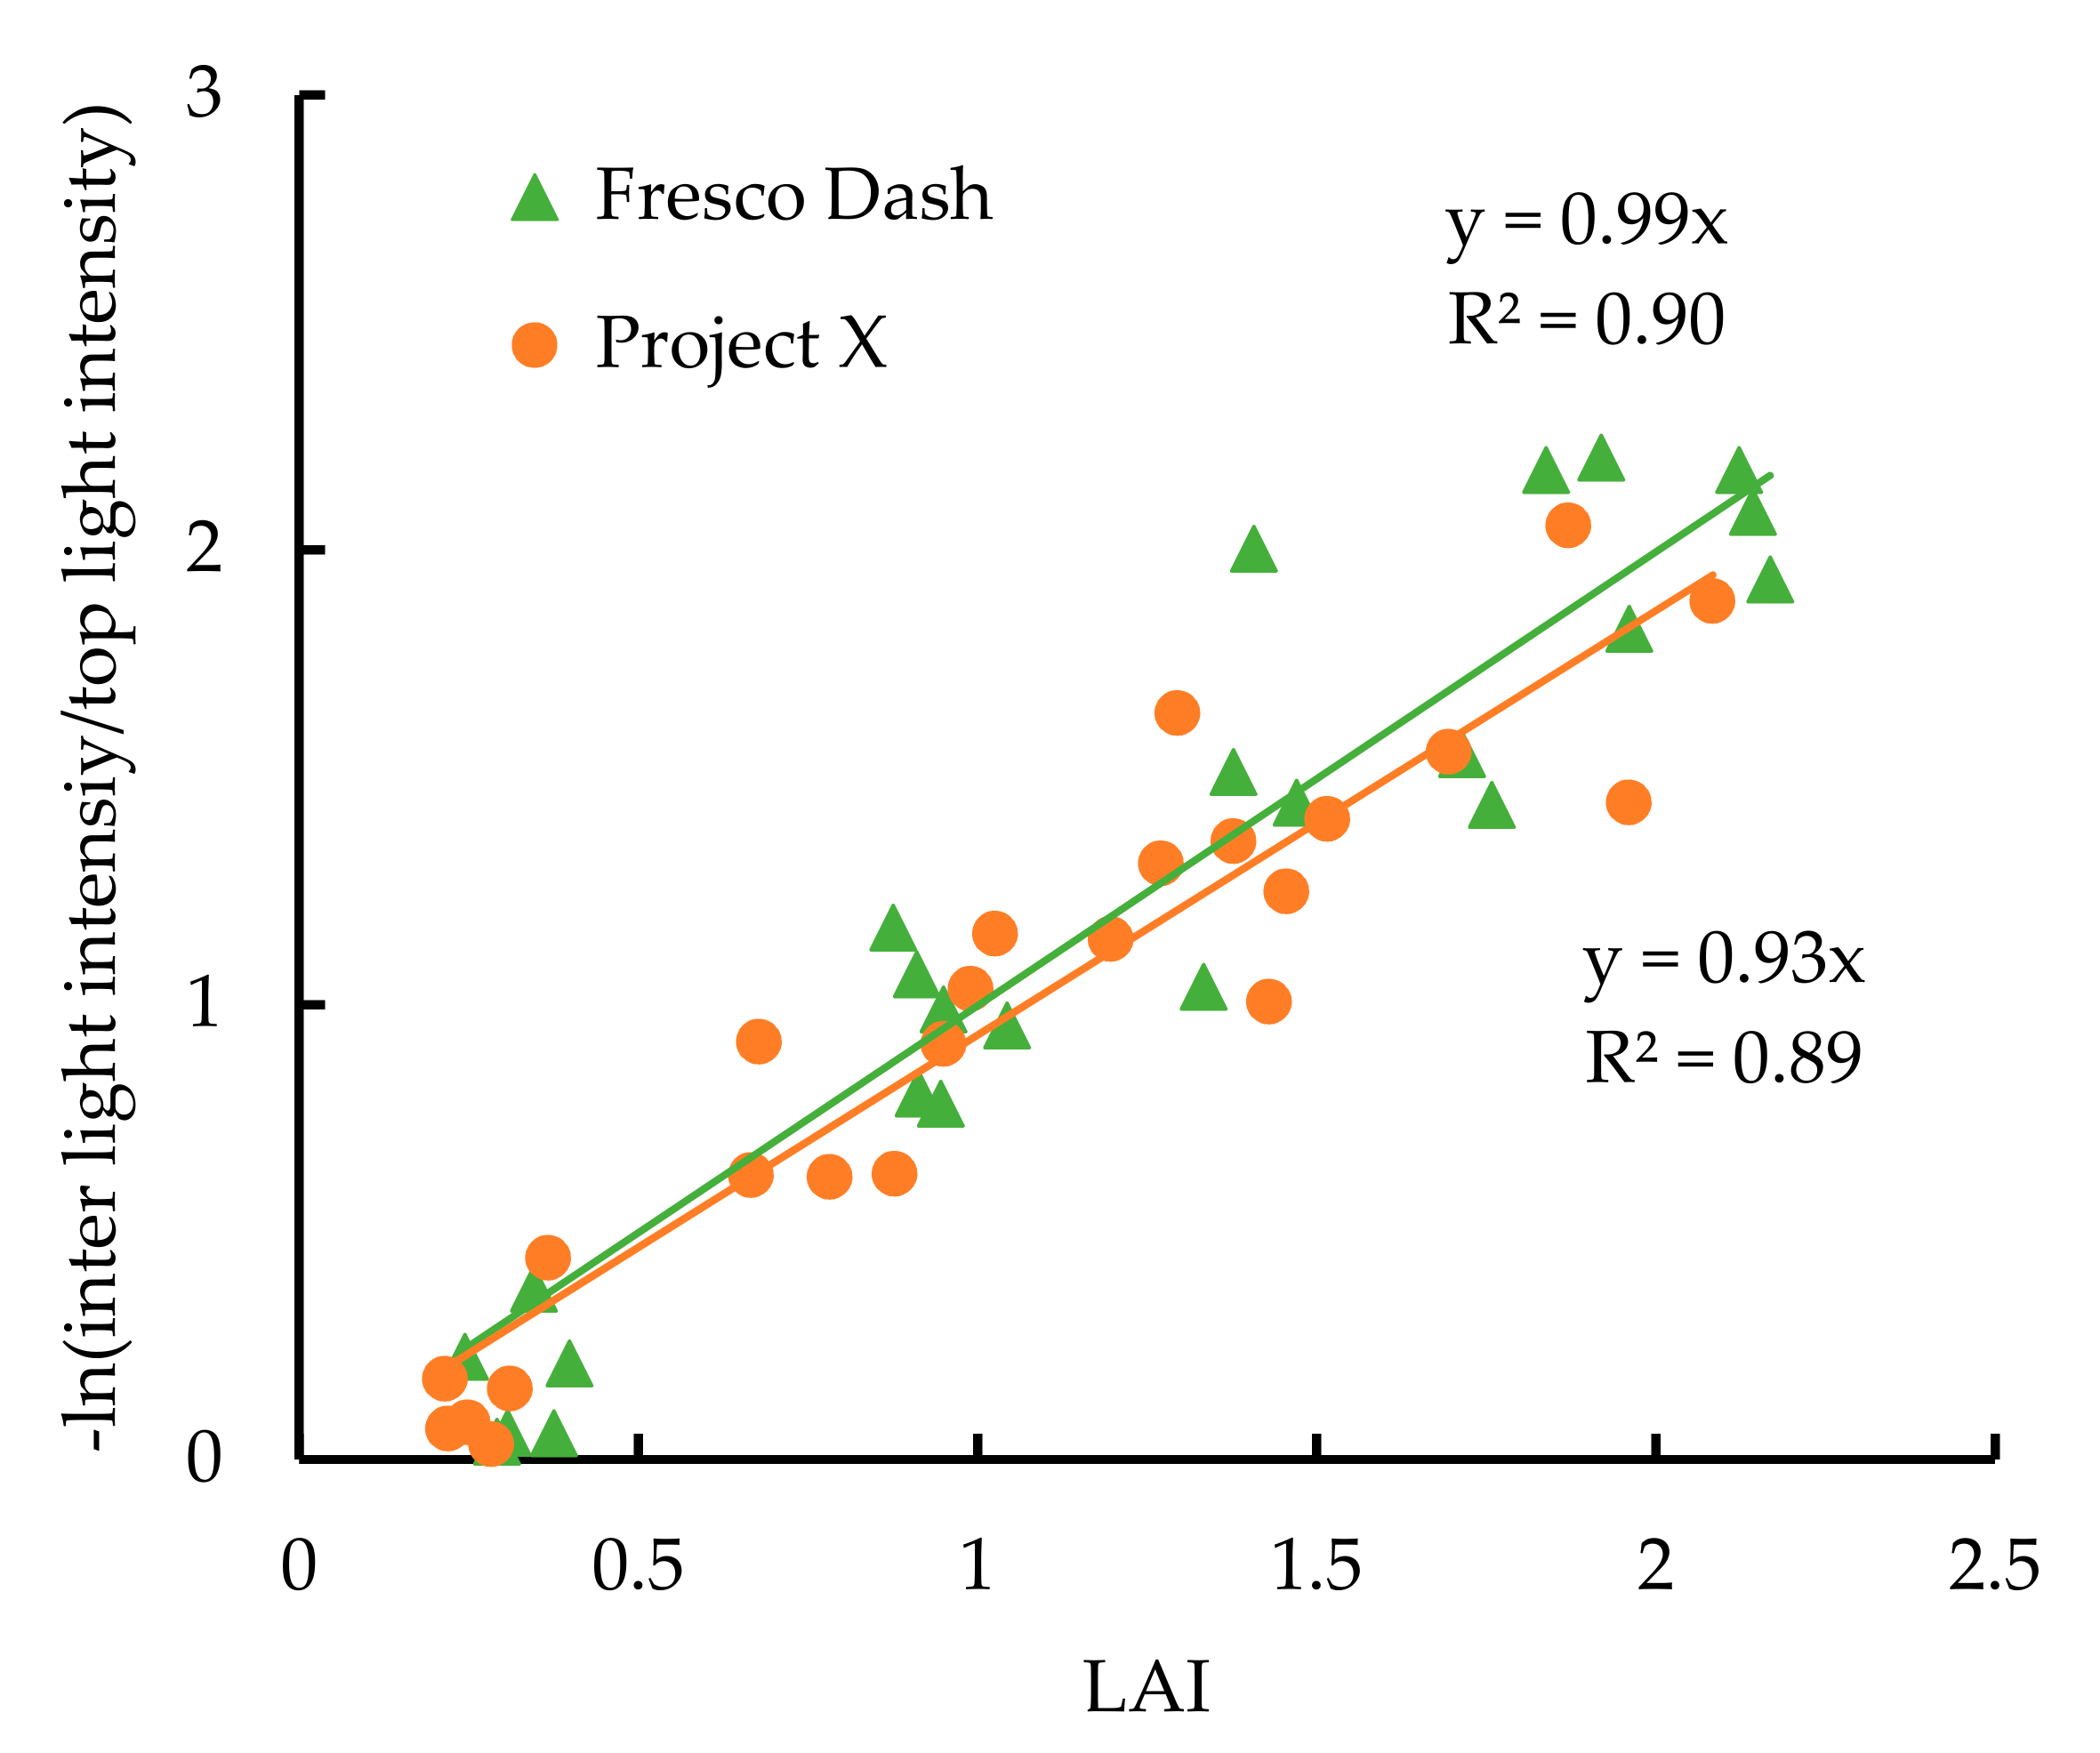
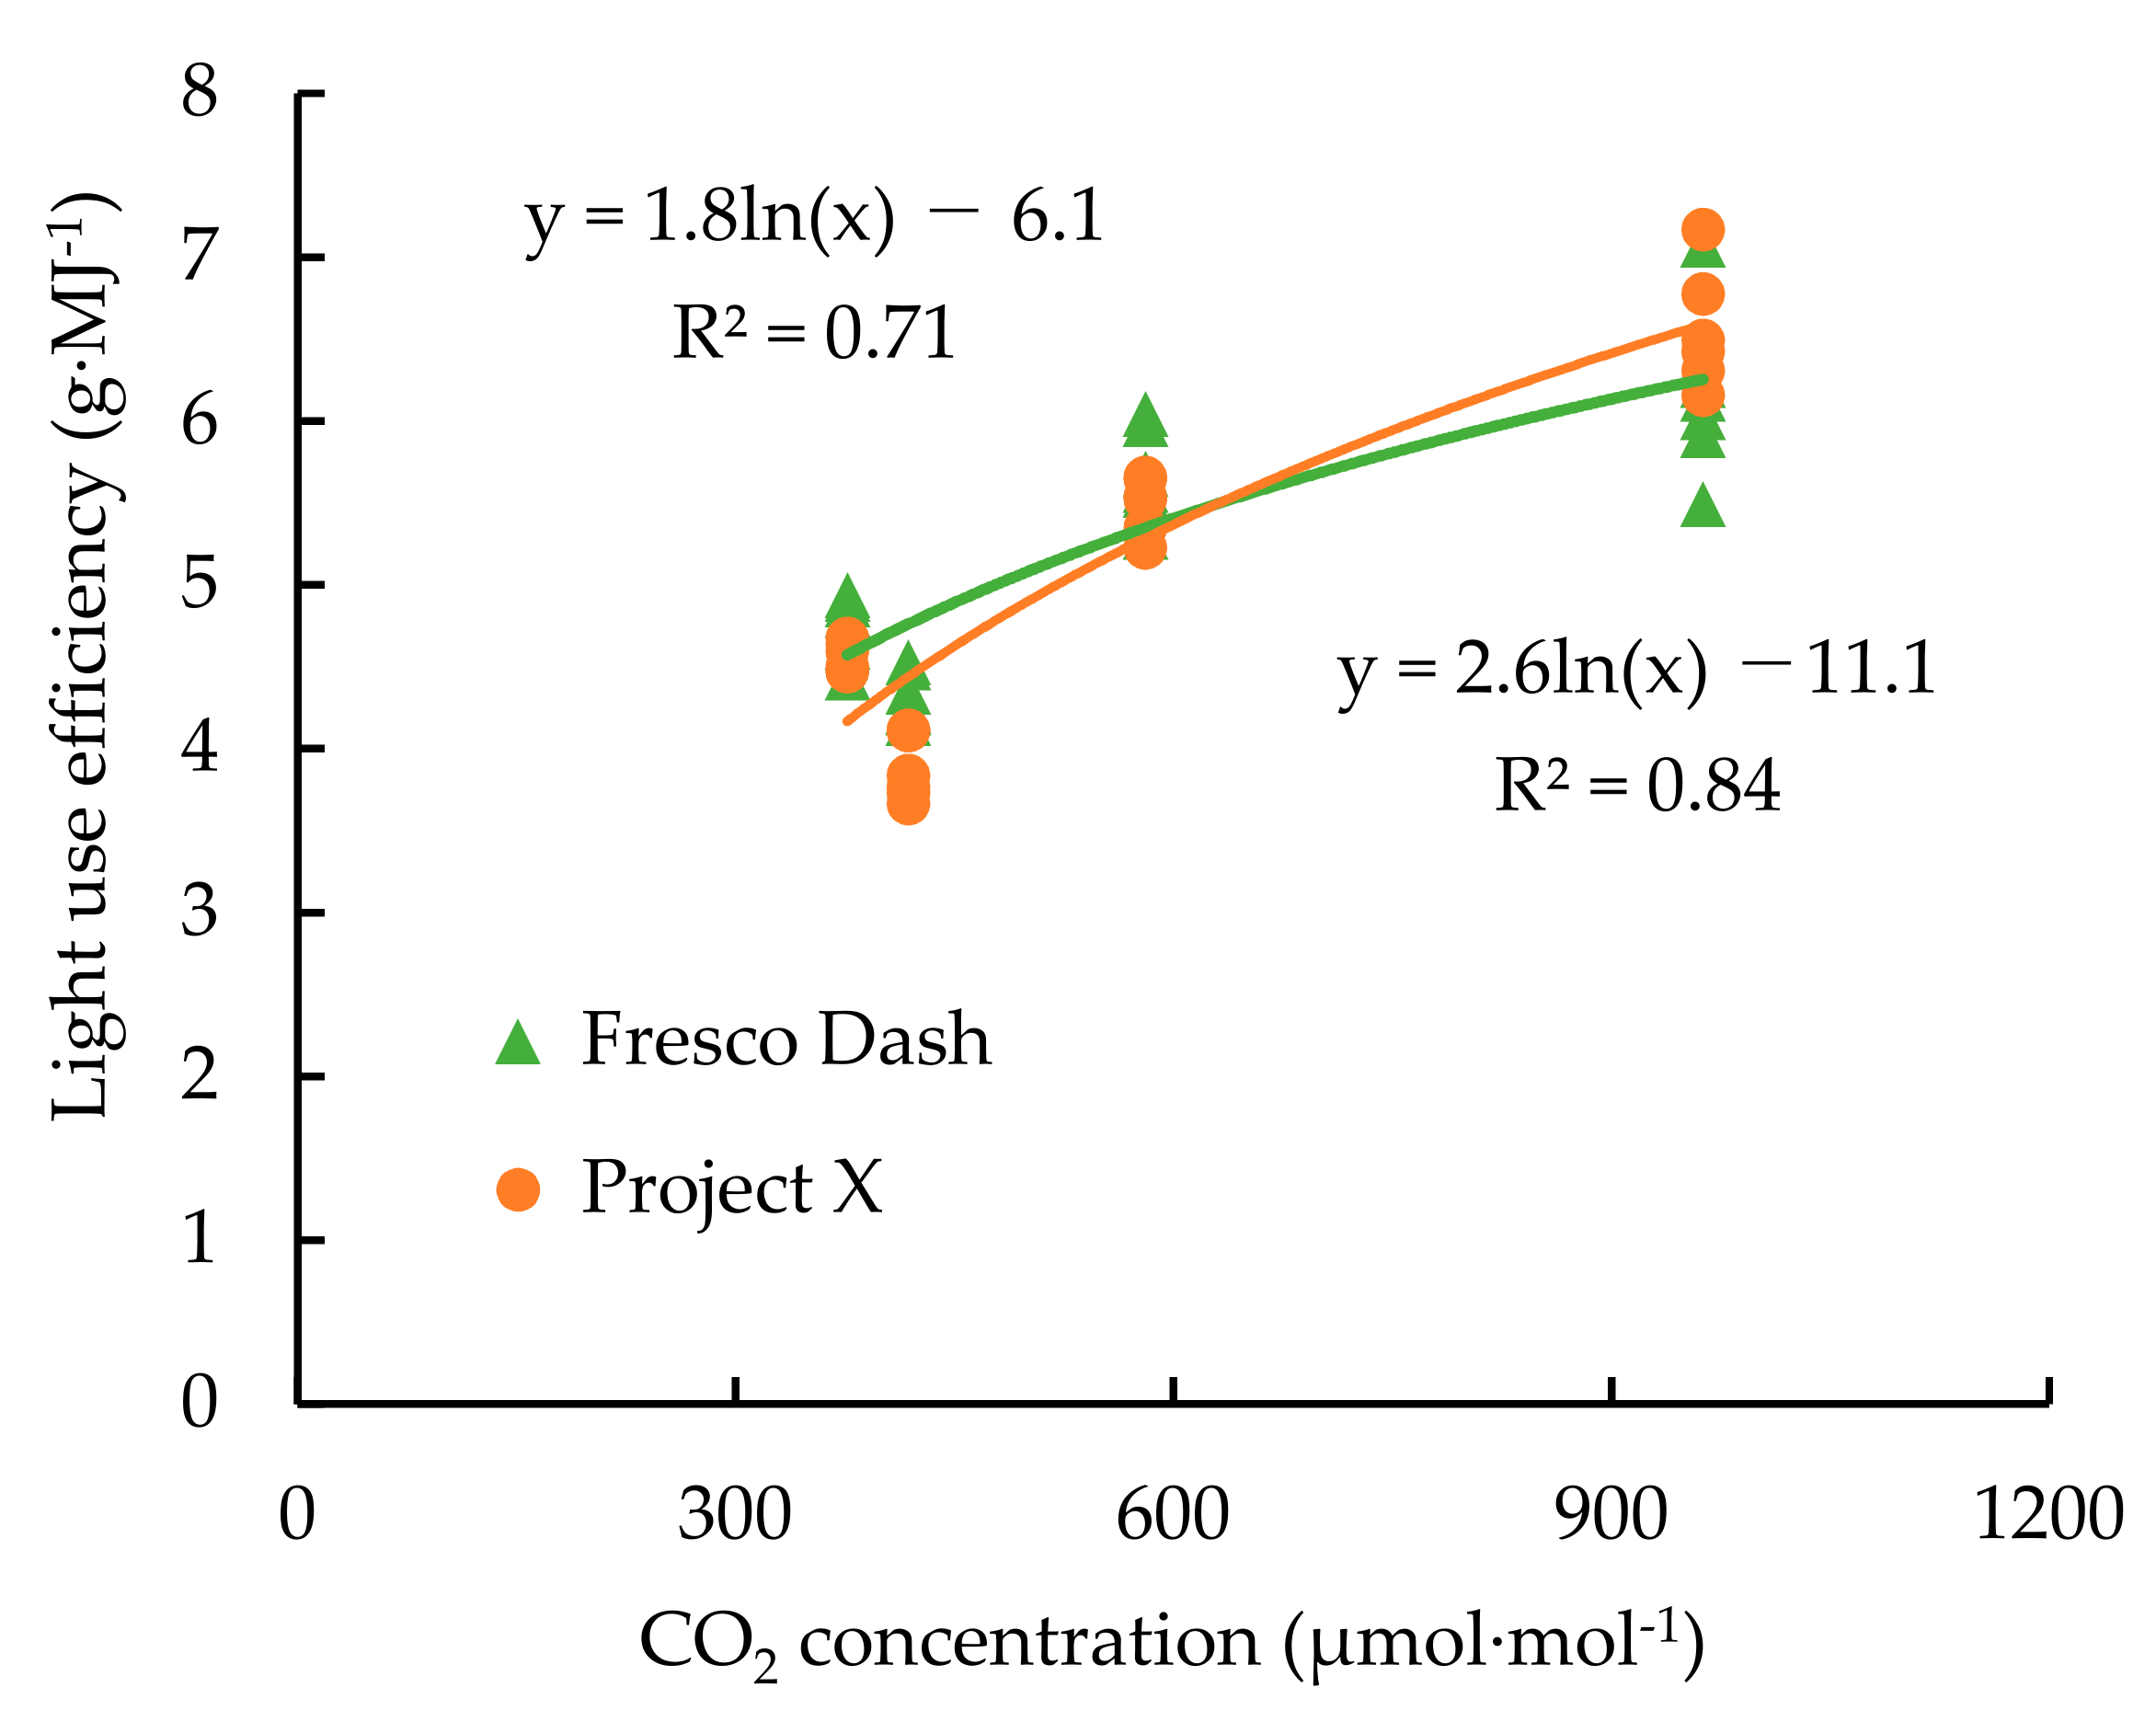
2.2. Empirical Growth Model and Plant Growth Measurement

In this study, we used an empirical growth model to estimate the yield, as shown in a flow chart in Figure 2. The leaf area was measured on twelve plants (two plants per slab) once a week. We calculated leaf area (LA) (m−2 plant−1) before pruning leaves in initial experiments according to the previous study [22] as:
LA   = a   Ll × Lw .  
where “Ll” is the leaf length, and “Lw” is the leaf width. The “a” value was calculated from the Ll, Lw, and measured individual leaf area values (n = 30). LA was obtained by integrating the individual leaves. The leaf area index (m2·m−2) was calculated as follows:
LAI = LA × PD .  
ere PD is plant density (plant·m−2). Light extinction within the plant canopies was determined using the following equation [23]:
I = I 0   e k · L A I
where I represents the light intensity at a given point of the plant canopy, I0 represents the light intensity above the canopy, k represents the light extinction coefficient, and LAI represents the cumulative leaf area from the top to each point in the canopy. To obtain the k values of each treatment, we measured the photosynthetic photon flux densities (PPFDs) at four different heights within the closed plant canopy on March 24 using a line quantum sensor (LI-191SA; LI-COR, Lincoln, NE, USA). The PPFDs above the plant canopies were also measured using a PPFD sensor (LI-190R; LI-COR, Lincoln, NE, USA). The k values were calculated from the correlation between the relative light intensity (I/I0) and LAIs obtained using Equation (3).
The daily intercepted light (MJ · m−2) from the plants were calculated using the daily LAI, k, and effective photosynthetically active radiation in the room using the following equation:
IL   = 1 e k   L A I × PAR
The indoor PARs were calculated based on the measured outdoor solar radiation using a facility light transmittance of 52% obtained before the experiment. The ratio of photosynthetically active radiation to solar radiation was assumed to be 50% [24]. Daily LAI values were obtained by linearly interpolating the estimated LAI from the weekly measurements.
The LUE is represented by the production of dry matter per IL. Destructive measurements were conducted 50, 92, 112, and 136 d after transplanting (DAT), and the fresh and dry weights of the leaves, stems, and fruits of six plants in each cultivar were measured. The cumulative IL values up to the time of the destructive measurements were plotted against increases in total DM production (TDM), and linear regression was performed, in which the slope of the line was defined as the LUE (g·MJ−1 PAR).
Throughout these experiments, the plants were cultivated at different CO2 concentrations (approximately 400, 600, and 1000 ppm), as described in Figure 1A, and the regression equations between the LUEs at different CO2 levels were calculated. This was done via curvilinear regression of LUE using the following equation:
LUE = b × ln CO 2 + c
where b and c are coefficients obtained from the regression analysis.
The DM distributions (DMDs) in fruits were calculated using the following equation: the total dry weights of harvested and immature fruits of the plants divided by the total dry matter at the final destructive measurement. The DM contents (DMCs) of the fruits were calculated from the dry and fresh fruit weights by measuring every ten fruits (two fruits at five replicates) at 50, 88, 108, and 138 DAT.

2.3. Model Validation

To validate the model, the same two cultivars (PX, FD) were cultivated from 27 August 2018 to 31 March 2019. The planting density, experimental arrangement, and cultivation method were the same as those used in the initial experiments. To simulate the LAI in second experiments, we measured the weight of largest pruned leaf and calculated the largest leaf area once a week before pruning leaves with the previous reference [25]. From the largest leaf area, we calculated the LAI using the following equation:
LAI = ( 24.8   Mlw + 57.8 ) 0.896 1 + 14.811   e 0.51 n     · PD
where Mlw represents maximum leaf weight, and n represents the leaf node. The previously obtained parameters (LUE, k, DMD and DMC) were applied to calculate the, TDMs, and fresh fruit yields. The TDMs (g·m−2) were calculated using the following equation:
TDM = LUE × IL
The dry and fresh fruit yields were then calculated using the following equation:
Dry   fruit   yield = TDM × DMD
Fresh   fruit   yield = Dry   fruit   yield × DMC
The actual yields of the cultivars were recorded based on fruit harvested from 15 samples (five plants and three replicates) from 28 to 171 DAT. To measure the actual TDMs and LAIs, we sampled six plants from each cultivar at 51, 132, and 163 DAT and measured the leaf areas as well as fresh and dry weights of the tops (leaves, stems, and fruits). The TDMs were calculated by adding the dry weights of the harvested fruits and leaves removed during the cultivation period to the total dry weight of the tops during the destructive measurements.

3. Result

To obtain the coefficients of the linear equation from the relationship between LUE and CO2, we controlled daytime CO2 concentrations during cultivation (Figure 1A).
In the initial experiments, cumulative daily outdoor solar radiation showed an increasing trend, with minimum, maximum, and average values of 2.0, 26.0, and 12.6 MJ·m−2, respectively, during cultivation. The daily average temperature was 20.5 °C during the cultivation period (data not shown). No significant differences were observed in the light extinction coefficients between the two cultivars (FD: 0.99, PX: 0.93; Figure 3).
The R2 values were 0.90 and 0.89 in FD and PX, respectively, indicating significant correlations. The LUEs were significantly correlated with daytime CO2 concentrations (Figure 4; R2 = 0.71 in FD, 0.84 in PX; n = 24; p < 0.001). Based on 95% confidence intervals, no significant differences in LUEs were observed between the two cultivars.
From the destructive measurements, the fractions of DMD to fruit did not differ between the two cultivars (FD: 46.0%, PX: 45.2%). There were no significant differences in DMCs between the two cultivars (FD: 3.84%, PX: 3.78; data not shown).
In the model validation experiment, the average daytime CO2 concentrations were approximately 550 (10 September to 10 November), 800 (11 November to 10 March), and 600 (11 March to 31 March) µmol·mol−1 (Figure 1B). The daily average temperature was 20.8 °C during the cultivation period (data not shown). The observed LAIs with destructive measurements did not differ significantly between the two cultivars during cultivation (Figure 5). LAI prediction using the non-destructive measurements showed that the estimated LAIs were within the ranges of observed LAI ± SE at 51 and 132 DAT in both cultivars. However, at 163 DAT, the observed LAI was lower than the estimated LAI.
The cumulative IL at 51, 132, and 163 DAT, calculated by Equation (4), were 98, 100, 281, 284, 372, and 374 MJ·m−2 for PX and FD, respectively. The observed TDM did not differ significantly between the two cultivars during cultivation (Figure 6). At 51 DAT, the estimated TDM was within the range of observed TDM ± SE in both cultivars. At 132 DAT, the estimated TDM was within the range of observed TDM ± SE in PX but not in FD. Moreover, at 163 DAT, the observed TDM was lower than the estimated TDM in both cultivars.
The observed cumulative fruit yield in FD was significantly higher than that in PX (FD: 31.7 kg·m−2, PX: 29.1 kg·m−2; Figure 7). The estimated cumulative fruit yield was lower than the observed yield during cultivation in FD and higher during the cultivation of PX. At the end of the cultivation period, the predicted cumulative fruit yields were 4.4% lower than the observed yield in FD and 4.9% higher than that in PX.

4. Discussion

In the previous study, the high CO2 levels increased LUE by approximately 25% (LUE: 3.4 vs. 4.3 g·MJ−1 for low (364 ppm) and high CO2 (620 ppm) levels, respectively), indicating an increase of 10% per 100 μmol·mol−1 CO2 [26]. In this study, the LUEs under 362 and 620 μmol·mol−1 CO2 were 4.5 and 5.5 g·MJ−1, respectively, for FD and 4.1 and 5.5 g·MJ−1, respectively, for PX. These indicate increases of 8.6 and 13% per 100 μmol·mol−1 CO2 for FD and PX, respectively. Since these results were similar to those of the previous study on cucumber, the coefficients of the obtained equation were considered to be reasonable.
The predicted TDMs fell within the ranges of the observed TDM ± standard error. These results suggest that the coefficients of the developed empirical model are reasonable for predicting dry matter production. However, the observed TDMs were lower than the predictions at 163 DAT in both cultivars, and this overestimation of TDM might have been due to overestimated LAIs and decreased LUEs at the late developmental stage. We initially calculated individual LA from the constant specific leaf areas (SLAs). However, SLA is affected by temperature, light intensity, and sink demand, which may alter the values during cultivation [27,28,29]. Additionally, a decrease in LUE was observed during the late developmental stages in tomatoes [30]. Therefore, the accuracy of prediction of LAI and LUE is important parameter in this model. On the other hand, in recent years, there has been a lot of interest in using image analysis techniques and machine learning models to obtain physiological and biological information [7,31,32], and we suggest that these techniques can be used to improve the accuracy of prediction of LAI, LUE, and then yield.
In FD, the yield gap between the predicted yield and observed yield occurred at approximately 80 DAT. The DMD of fruits may have caused the observed yield difference at 80 DAT. The simulation of DMD of fruits was one of the weak points of this model. Actually, DMD of fruits varies with many factors, such as temperature, irradiance, number of fruits on the stem. In PX, the yield gap between the predicted and measured yields was similar to that of the TDM, suggesting that the prediction error of TDM caused the yield gap.

5. Conclusions

We cultivated cucumbers twice with hydroponic system to obtained parameters and validated the model. The empirical model was able to estimate the TDM and fresh fruit yield of cucumbers with high accuracy. However, estimation errors occurred due to deviations in LAI and DMD of fruits. It is important to expand the application of this model in different areas to support producers in their decision-making on environmental control, plant and labor management.

Author Contributions

Conceptualization, K.M. and D.-H.A.; methodology, K.M. and D.-H.A.; software, K.M. and D.-H.A.; validation, K.M. and D.-H.A.; formal analysis, K.M.; investigation, K.M. and D.-H.A.; resources, K.M. and D.-H.A.; data curation, K.M. and D.-H.A.; writing—original draft preparation, K.M. and D.-H.A.; writing—review and editing, K.M. and D.-H.A.; visualization, K.M. and D.-H.A.; supervision, K.M. and D.-H.A. All authors have read and agreed to the published version of the manuscript.

Funding

This research received no external funding.

Conflicts of Interest

We (Kazuya Maeda and Dong-Hyuk Ahn) declare that there is no conflict of interest as far as our work is concerned.

References

  1. MAFF. 2020. Available online: https://www.maff.go.jp/j/seisan/ryutu/engei/NextGenerationHorticulture/ (accessed on 12 March 2021).
  2. FAOSTAT. 2018. Available online: http://faostat (accessed on 14 May 2019).
  3. Van Ittersum, M.K.; Cassman, K.G.; Grassini, P.; Wolf, J.; Tittonell, P.; Hochman, Z. Yield gap analysis with local to global relevance—A review. Field Crops Res. 2013, 143, 4–17. [Google Scholar] [CrossRef] [Green Version]
  4. Lin, D.; Wei, R.; Xu, L. An Integrated Yield Prediction Model for Greenhouse Tomato. Agronomy 2019, 9, 873. [Google Scholar] [CrossRef] [Green Version]
  5. Dayan, E.; Vankeulen, H.; Jones, J.W.; Zipori, I.; Shmuel, D.; Challa, H. Development, Calibration and Validation of a Greenhouse Tomato Growth-Model.1. Description of the Model. Agr. Syst. 1993, 43, 145–163. [Google Scholar] [CrossRef]
  6. Vanthoor, B.; de Visser, P.; Stanghellini, C.; van Henten, E. A methodology for model-based greenhouse design: Part 2, description and validation of a tomato yield model. Biosyst. Eng. 2011, 110, 378–395. [Google Scholar] [CrossRef]
  7. Lopez, A.K.; Benavides, M.A.; Gonzalez, M.S.; Maldonado, A.J.; Chinas, S.P.; Morelos, M.A. Artificial neural network modeling of greenhouse Tomato yield and aerial dry matter. Agriculture 2020, 10, 97. [Google Scholar] [CrossRef] [Green Version]
  8. Chang, C.-L.; Chung, S.-C.; Fu, W.-L.; Huang, C.-C. Artificial intelligence approaches to predict growth, harvest day, and quality of lettuce (Lactuca sativa L.) in a IoT-enabled greenhouse system. Biosyst. Eng. 2021, 212, 77–105. [Google Scholar] [CrossRef]
  9. Wang, Y.; Xiao, R.; Yin, Y.; Liu, T. Prediction of Tomato Yield in Chinese-Style Solar Greenhouses Based on Wavelet Neural Networks and Genetic Algorithms. Information 2021, 12, 336. [Google Scholar] [CrossRef]
  10. Gong, L.; Yu, M.; Jiang, S.; Cutsuridis, V.; Pearson, S. Deep Learning Based Prediction on Greenhouse Crop Yield Combined TCN and RNN. Sensors 2021, 21, 4537. [Google Scholar] [CrossRef]
  11. Louarn, G.; Song, Y. Two decades of functional-structural plant modelling: Now addressing fundamental questions in systems biology and predictive ecology. Ann. Bot. 2020, 126, 501–509. [Google Scholar] [CrossRef]
  12. Wen, W.; Wang, Y.; Wu, S.; Liu, K.; Gu, S.; Guo, X. 3D phytomer-based geometric modelling method for plants—The case of maize. AoB Plants 2021, 13, plab055. [Google Scholar] [CrossRef]
  13. Pao, Y.-C.; Kahlen, K.; Chen, T.-W.; Wiechers, D.; Stützel, H. How does structure matter? Comparison of canopy photosynthesis using one- and three-dimensional light models: A case study using greenhouse cucumber canopies. Silico Plants 2021, diab031. [Google Scholar] [CrossRef]
  14. Van der Meer, M.; de Visser, P.H.B.; Heuvelink, E.; Marcelis, L.F.M. Row orientation affects the uniformity of light absorption, but hardly affects crop photosynthesis in hedgerow tomato crops. Silico Plants 2021, 3, diab025. [Google Scholar] [CrossRef]
  15. O’Sullivan, H.; Raumonen, P.; Kaitaniemi, P.; Perttunen, J.; Sievänen, R. Integrating terrestrial laser scanning with functional–structural plant models to investigate ecological and evolutionary processes of forest communities. Ann. Bot. 2021, 128, 663–684. [Google Scholar] [CrossRef] [PubMed]
  16. Marcelis, L.; Gijzen, H. Evaluation under commercial conditions of a model of prediction of the yield and quality of cucumber fruits. Sci. Hortic. 1998, 76, 171–181. [Google Scholar] [CrossRef]
  17. Saito, T.; Kawasaki, Y.; Ahn, D.-H.; Ohyama, A.; Higashide, T. Prediction and Improvement of Yield and Dry Matter Production Based on Modeling and Non-destructive Measurement in Year-round Greenhouse Tomatoes. Hortic. J. 2020, 89, 425–431. [Google Scholar] [CrossRef] [Green Version]
  18. Saito, T.; Mochizuki, Y.; Kawasaki, Y.; Ohyama, A.; Higashide, T. Estimation of Leaf Area and Light-use Efficiency by Non-destructive Measurements for Growth Modeling and Recommended Leaf Area Index in Greenhouse Tomatoes. Hortic. J. 2020, 89, 445–453. [Google Scholar] [CrossRef]
  19. Higashide, T.; Heuvelink, E. Physiological and Morphological Changes Over the Past 50 Years in Yield Components in Tomato. J. Am. Soc. Hortic. Sci. 2009, 134, 460–465. [Google Scholar] [CrossRef] [Green Version]
  20. Kaneko, S.; Higashide, T.; Yasuba, K.-I.; Ohmori, H.; Nakano, A. Effects of Planting Stage and Density of Tomato Seedlings on Growth and Yield Component in Low-truss Cultivation. Hortic. Res. 2015, 14, 163–170. [Google Scholar] [CrossRef] [Green Version]
  21. Maeda, K.; Ahn, D.-H. A Review of Japanese Greenhouse Cucumber Research from the Perspective of Yield Components. Hortic. J. 2021, 90, 263–269. [Google Scholar] [CrossRef]
  22. Cho, Y.Y.; Oh, S.; Oh, M.M.; Son, J.E. Estimation of individual leaf area, fresh weight, and dry weight of hydroponically grown cucumbers (Cucumis sativus L.) using leaf length, width, and SPAD value. Sci. Hortic. 2007, 111, 330–334. [Google Scholar] [CrossRef]
  23. Monsi, M.; Saeki, T. On the factor light in plant communities and its importance for matter production. Ann. Bot. 2005, 95, 549. [Google Scholar] [CrossRef] [PubMed] [Green Version]
  24. Ohtani, Y. Effective radiation, micrometeorological phenomena. In Agricultural Meteorology Glossary; Society for Agricultural Meteorology of Japan: Tokyo, Japan, 1997; pp. 106–107. (In Japanese) [Google Scholar]
  25. Ahn, D.; Higashide, T.; Iwasaki, Y.; Kawasaki, Y.; Nakano, A. Estimation of leaf area index of cucumbers (Cucumis sαtivus L.) trained on a high -wir. Bull. Natl. Inst. Veg. Tea Sci. 2015, 14, 23–29. [Google Scholar]
  26. Nederhoff, E.M. Effects of CO2 Concentration on Photosynthesis, Transpiration and Production of Greenhouse Fruit Vegetable Crops; Wageningen University and Research: Wageningen, The Netherlands, 1994. [Google Scholar]
  27. Kleinendorst, A.; Veen, B. Responses of young cucumber plants to root and shoot temperatures. Neth. J. Agric. Sci. 1983, 31, 47–61. [Google Scholar] [CrossRef]
  28. Marcelis, L. Effects of Sink Demand on Photosynthesis in Cucumber. J. Exp. Bot. 1991, 42, 1387–1392. [Google Scholar] [CrossRef]
  29. Alsadon, A.A.; Al-Helal, I.M.; Ibrahim, A.A.; Abdel-Ghany, A.M.; Al-Zaharani, S.M.; Gulrez, S.K.H. Growth response of cucumber under greenhouses covered with plastic films. J. Anim. Plant Sci. 2016, 26, 139–148. [Google Scholar]
  30. Heuvelink, E.; Kierkels, T. Plant Physiology in Greenhouses; Horti-Text: Woerden, The Netherlands, 2015. [Google Scholar]
  31. Shimomoto, K.; Takayama, K.; Takahashi, N.; Nishina, H.; Inaba, K.; Isoyama, Y.; Oh, S.-C. Real-time Monitoring of Photosynthesis and Transpiration of a Fully-grown Tomato Plant in Greenhouse. Environ. Control. Biol. 2020, 58, 65–70. [Google Scholar] [CrossRef]
  32. Wang, R.; Sun, Z.; Yang, D.; Ma, L. Simulating cucumber plant heights using optimized growth functions driven by water and accumulated temperature in a solar greenhouse. Agric. Water Manag. 2021, 259, 107170. [Google Scholar] [CrossRef]
Figure 1. Change in daily mean temperature, cumulative daily outdoor solar radiation and observed daytime CO2 concentration. (A,B) Initial experiments. (C,D) Model validation experiment.
Agriculture 11 01186 g001
Figure 2. Flow chart for the calculation of yield and dry matter production (Saito, 2020a). LAI, leaf area index; PAR, photosynthetically active radiation; LUE, light-use efficiency; DM, dry matter; DW, dry weight; FW, fresh weight.
Agriculture 11 01186 g002
Figure 3. Extinction coefficient (k) of two cucumber cultivars. The k values were 0.99 and 0.93 in “Fresco Dash” and “Project X”, respectively. The values were measured at 10:30–11:00 a.m. on 24 March 2020. (R2 = 0.90 for Fresco Dash, R2 = 0.89 for Project X; p < 0.001).
Agriculture 11 01186 g003
Figure 4. Observed light-use efficiency (g MJ−1, where MJ is a unit of photosynthetically active radiation) of two cultivars as a function of the average daytime CO2 concentration in cucumber plants. (R2 = 0.71 for “Fresco-dash”, R2 = 0.84 for “Project X”; p < 0.001; n = 24).
Agriculture 11 01186 g004
Figure 5. Simulated observed leaf area index (LAI) in two cucumber cultivars. Observed LAIs show the average ± SE (51, 132, and 163 d after transplantation, n = 6).
Agriculture 11 01186 g005
Figure 6. Predicted and observed TDMs in two cucumber cultivars. Observed TDM shows the average ± SE (51, 132, and 163 d after transplantation, n = 6).
Agriculture 11 01186 g006
Figure 7. Predicted and observed cumulative fresh fruit yields in two cucumber cultivars. (A) “Fresco-dash”; (B) indicate “Project X”. The fruits were observed daily and harvested when they reached approximately 100 g (n = 15).
Agriculture 11 01186 g007
Publisher’s Note: MDPI stays neutral with regard to jurisdictional claims in published maps and institutional affiliations.

