Abstract
Pooling animals with extreme phenotypes can improve the accuracy of genetic evaluation or provide genetic evaluation for novel traits at relatively low cost by exploiting large amounts of low-cost phenotypic data from animals in the commercial sector without pedigree (data from commercial ranches, feedlots, stocker grazing or processing plants). The average contribution of each animal to a pool is inversely proportional to the number of animals in the pool or pool size. We constructed pools with variable planned contributions from each animal to approximate errors with different numbers of animals per pool. We estimate pool construction error based on combining liver tissue, from pulverized frozen tissue mass from multiple animals, into eight sub-pools containing four animals with planned proportionality (1:2:3:4) by mass. Sub-pools were then extracted for DNA and genotyped using a commercial array. The extracted DNA from the sub-pools was used to form super pools based on DNA concentration as measured by spectrophotometry with planned contribution of sub-pools of 1:2:3:4. We estimate technical error by comparing estimated animal contribution using sub-samples of single nucleotide polymorphism (SNP). Overall, pool construction error increased with planned contribution of individual animals. Technical error in estimating animal contributions decreased with the number of SNP used.
1. Introduction
Large scale genotyping using high-density arrays or next-generation sequencing techniques has revolutionized genetic prediction and identification of causal chromosomal regions through genome-wide association studies (GWAS). Furthermore, apportioning genetic variation to chromosomal regions (a goal of GWAS and an estimation of regional heritability using best linear unbiased prediction using a regional genomic relationship matrix and restricted maximum likelihood estimation of variance components) can improve genome prediction accuracy []. Genetic prediction accuracy is improved by increased variance in regional genomic relationships and higher, more consistent linkage disequilibrium between observed SNP and unknown or unobserved quantitative trait loci compared to the whole genome. Hence, GWAS and genome prediction are complimentary activities. However, effective implementation of genomic prediction or high-powered GWAS for complex and/or low heritability traits may require thousands of animals with phenotypes and genotypes. Individually genotyping seedstock populations is cost effective when the cost is spread among large suites of routinely recorded traits. However, individually genotyping can be prohibitively expensive when collecting novel traits on commercial animals, without recorded pedigree, for which only one trait is recorded.
DNA pooling can be an effective tool to reduce genotyping cost, and it captures greater than 80% of the power of individual genotyping in GWAS []. If costs of collecting phenotypes are much lower than genotyping costs, DNA pooling can reduce experimental costs by 90%. Our group has established the utility of GWAS using DNA pooling for novel complex traits such as fertility and disease resistance [,,].
In addition to GWAS, early efforts have been proposed to apply pooling results to genomic prediction. Marker predictions from high and low phenotype groups could be used to accurately rank candidates for selection []. An alternative strategy could be the estimation of genomic relationships between pools and candidates for selection; for instance, genomic relationships could be used to derive estimated breeding values for sires of multiple-sire progeny in pools of extreme phenotypes []. Both techniques involve genomic prediction of animals that are known to have close relationships with animals in the pool. Commercial data capture is complicated by the fact that whole genome relationships between commercial cattle (source of data) and seedstock animals (selection candidates) are more distant and less variable compared to relationships between animals with data and animals being selected within the seedstock sector. The effectiveness of using SNP chip data from pools for genomic prediction depends on the signal to noise ratio, with the signal being allele frequency differences or haplotype frequency differences between pools of animals with extreme phenotypes, and noise being pooling errors. Greater genetic differences occur when the trait has higher heritability or when phenotypes are more extreme. Pooling errors include pool construction error and technical error. Pool construction error includes weighing error, errors in measuring or recording DNA concentration, incomplete sample mixing, pipetting error, variation in DNA content of the tissue, variation in DNA extraction efficiency, and DNA fragmentation. In this study, technical error is defined as variation in estimates of sub-pool, animal, or haplotype contributions among replicate arrays for identical pools (same animals in same proportions). However, replicate arrays were not run in this study because technical error can be estimated at a lower cost as the variance in estimated animal contribution among sub-samples of SNP, sampled without replacement. This is the approach that we took. Technical error depends on variation in in allelic ratio (Y/X) for intensity within genotype for each SNP and the number of SNP; specifically, we estimate pooling allele frequency using the same formula that Illumina uses, Illumina θ = 2 * tan−1(Y/X)/π [], for calling genotypes and detecting copy number variation (or structural variants). The number of animals in the pool is inversely proportional to the average contribution from each animal; hence, we deliberately varied the contribution from each animal to approximate the influence of each pool’s size on error without spending a lot of money genotyping individual animals. In this way, we can approximate error for pool sizes of 100 with only 16 animals. Our objectives were to evaluate pool construction, technical error, and the influence of factors that affect these errors, such as number of SNP and planned representation of animals within the pool.
2. Materials and Methods
Animal samples utilized in this study were recovered from abattoirs. Therefore, no Institutional and Animal Care and Use approval was obtained.
Sample pooling strategy: Pools comprising many animals are more economical because the cost of genotyping a pool is spread over more animals. Pools with many animals have small contributions from each animal. To approximate variable numbers of animals per pool at a reasonable cost, we selected an experimental design with variable contributions from individual animals. Liver tissue samples were obtained from a set of 50 Holstein steers with severely abscessed livers and 50 Holstein steers with no liver abscesses in close chain proximity from a commercial abattoir. From these pairs of matched samples, 16 samples from abscessed and 16 samples from non-abscessed animals were randomly selected. There were no common animals between the two phenotypes; however, there were likely steers with abscessed livers that were related to animals with non-abscessed livers. Disease status (abscessed and non-abscessed livers) was used as a basis for dividing samples in this experiment into biological replicates.
Four sub-pools were created for each liver phenotype (abscessed/non-abscessed). A sub-pool was comprised of four different liver tissue samples in parts of 1:2:3:4 (each part was 0.1 g) and placed in a 10 mL tube for the designated sub-pool with 2 mL phosphate buffered saline for homogenization. Each liver tissue sample only contributed to one sub-pool (4 sub-pools × 4 samples/sub-pool = 16 samples total per phenotype). Isolation of DNA from each sub-pool was performed by a standard phenol/chloroform extraction protocol. Two super pools were then derived from the extracted DNA of the sub-pools in two different arrangements, with the four sub-pools again representing parts of 1:2:3:4. As shown in Figure 1, four different sub-pools and two different super pools were formed, as previously described, for each liver phenotype. Thus, the planned representation of 16 individual animals are in Table A1 and Table A2 based on the design presented in Figure 1. Individual DNA from the 32 animals used in the liver tissue pools was extracted using the QiAamp DNA Mini Kit following the manufacturer’s instructions (Qiagen, Santa Clarita, CA, USA). All individual DNA samples and pools were then mixed, by placing individual samples on a rotator, and quantified by the DeNovix DS-11 FX+ Spectrophotometer/Fluorometer (DeNovix Inc., Wilmington, DE, USA) using 2 µL of sample and the dsDNA photometric setting. Quality of the DNA was evaluated for all individual samples and pools using gel electrophoresis to ensure that a high molecular weight DNA was present and intact.
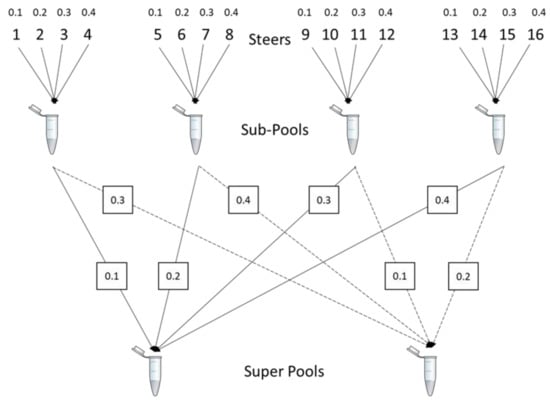
Figure 1.
Graphical representation of the designed relative proportions of liver tissue from individual animals used to form sub-pools and DNA proportions used to form super pools. This design was replicated across two different liver phenotypes, abscessed and normal, to use a total of 32 animal samples. Planned contributions of animals to sub-pools ranged for 10 to 40 % and animal contributions to super pools ranged from 1 to 16 % (Table A2).
Our experimental design resulted in pools with a broad range of sample contributions ranging from 1 to 40% (Figure 1; Table A1 and Table A2). Furthermore, there was planned proportionality in sample representation that was constant between sub-pools and super pools, allowing us to evaluate the stability of proportionality estimates at different dilutions. Discrepancy from proportionality would indicate instability of pool composition, changes in real animal proportions over time, or technical error. Realized or observed animal contributions were estimated from Illumina θ []. Illumina θ for super pools and sub-pools was computed by 2 * tan−1(Y/X)/π where X is the red intensity identifying the ‘A’ allele and Y is the green intensity representing the ‘B’ allele, using the Illumina AB nomenclature []. We term pooling error sources as ‘pool construction’ (estimated DNA quantity does not match planned quantity), ‘technical error’ (caused by variation in Illumina θ within genotype or pools with the same animal representation or replicated arrays of the same pool construction), and error in estimating animal contributions. All 32 animals, eight sub-pools, and four super pools were genotyped using the Illumina BovineHD array (Illumina, Inc., San Diego, CA, USA) by Neogen Corporation (Lincoln, NE, USA).
Statistical analysis: For each sub-pool and super pool, we estimated the contribution of each of the 32 animals in the eight sub-pools (four animals that contribute to each sub-pool) and four super pools (16 animals in each) using quadratic programming to minimize the residual sums of squares, subject to the constraints that the estimated animal contributions were positive and summed to 1, using the solve.QP() within contributed package quadprog in R [,] with Illumina θ for super pool or sub-pool as the dependent variable and genotype (number of copies of B allele)/2 as the independent variable.
Theoretically, pool construction error should be greater for larger planned animal contributions compared to smaller planned animal contributions based on the Dirichlet distribution, which is commonly assumed for the probabilities underlying the multinomial distribution. We tested for equality of variance in pool construction error among groups of planned contributions using a Levene type test, which is robust to deviations from normality [] using the levene test function in R []. There were four unique values among animal contributions to sub-pools and nine unique values among animal contributions to super pools. The Levene test requires greater replication within planned contribution level than our experiment allowed to achieve adequate power to detect differences in pool construction variance. In our analysis, we clustered similarly planned comparisons to overcome the small number of replicates within planned comparison level (Table A3) and looked at sensitivity to the level of granularity or aggregation to evaluate the robustness of our results. We used default parameters with the exception of correction.method = “zero.correction”, kruskal.test = TRUE, bootstrap = TRUE, and num.bootstrap = 100,000, which implemented a bootstrap rank-based (Kruskal-Wallis) modified robust Brown-Forsythe Levene-type test based on the absolute deviations from the median with modified structural zero removal method and correction factor.
We evaluated technical error as influenced by the number of SNP by subsampling all 777,962 SNP without replacement, computing animal contributions for each subsample, estimating the standard deviation for each animal across subsample, and averaging the result across sub-pools and super pools within the number of subsamples. The number of subsamples and SNP per subsample are in Table 1.

Table 1.
Standard deviation among technical errors for animals contributions estimated by bootstrapping sub-samples of SNP; sampled without replacement 1.
To evaluate the consistency of proportionality between sub-pools and super pools, we regressed animal contribution to the super pool on animal contribution to the sub-pool. If the r2 from this analysis is high, then there is a strong proportionality between animal contributions to sub-pools and super pools, and the estimated contribution of each animal is not affected much by being diluted in a pool of additional animals.
We estimated haplotypes without pedigree using Beagle version 5.2 [] and hap-ibd version 1.0 [] to identify shared identity by descent segments among the 32 liver samples plus hapmap animals [].
Breed composition of the 32 liver samples was estimated using a multiple regression method [], with the exception that we constrained the breed contributions to sum to 1 and be ≥ 0 using quadratic programming [], and the breed SNP frequency reference data were derived from BovineHD 770 k data for multiple diverse breeds [].
3. Results
The raw data produced in this study have been uploaded to Ag Data Commons (see Data Availability Statement).
3.1. Pool Construction Error
Pool construction error was 6.3-times greater when creating super pools from extracted sub-pools based on DNA concentration measurements compared to creating sub-pools from individual animals based on liver tissue mass (p < 0.045); variance for forming super pools from sub-pools was 0.0163 compared to 0.0026 when forming sub-pools from individual animals.
Pool construction error variation increased with the level of planned animal contribution, both within and between super pools and sub-pools (Figure 2; Table 2). Variation in pool construction error increased with larger planned contributions. Equality of variances was rejected for course and intermediate granularity (p < 0.0154; Table 2). At the finest level of granularity possible, equality of variance among distinct planned contributions was not rejected (p = 0.121), demonstrating the need to cluster planned contributions into bins to achieve sufficient replication within the bin of similar planned contributions to detect differences in variance. Significant results for rejecting equality of variance occurred for five levels of granularity, supporting the hypothesis that increasing variance with increasing planned contribution was not simply a function of lucky placement of bin boundaries.
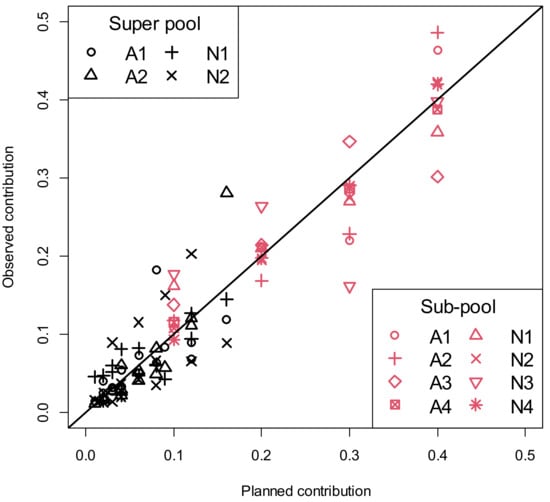
Figure 2.
Pool construction errors are deviations of observed animal contributions from planned contributions for super and sub-pools. The solid black line depicts where observed and planned animal contributions are equal. Observed animal contributions were estimated by quadratic programming [] minimizing error sums of squares subject to animal contributions summing to 1 and animal contributions ≥0. In legends, sub-pools or super pools starting with A or N are from cattle with liver abscess or normal livers, respectively.
Table 2.
Testing equality of variance for pool construction error; granularity of tests.
3.2. Technical Error
In this section we characterize where technical error originates at the individual SNP level and evaluate the impact of individual SNP variation in Illumina θ on multiple SNP estimates of animal contribution to a pool. Mean Illumina θ was obtained from approximately 500 cattle of diverse ancestry by Illumina []. Technical error at the individual SNP level varied both within and between SNP, and the between SNP differences were consistent with differences in mean Illumina θ for heterozygotes [] (Figure 3).
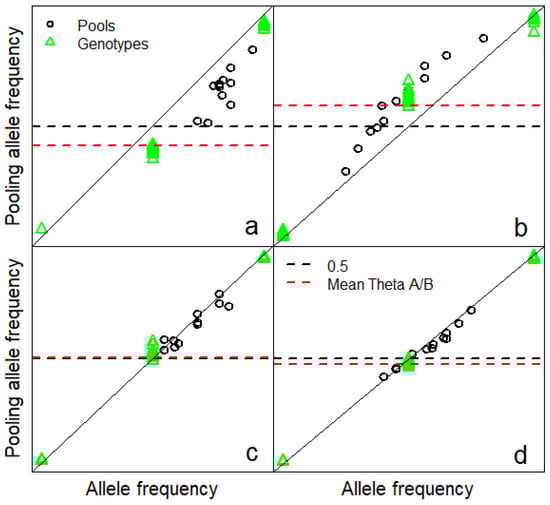
Figure 3.
Technical error expressed as deviations of observed pooling allele frequency from allele frequency. All vertical and horizontal coordinates in this figure range from 0 to 1. Pooling allele frequency was estimated as Illumina θ = 2 * tan−1(Y/X)/π in this study where Y/X is the allelic ratio for green/red intensity for both pools and individuals. Considering pooling allele frequency for individuals is not ridiculous, because individuals are technically a pool of two haplotypes with equal representation. Technical error varies within and between SNP, and we present four examples, (a–d). (a) Pooling allele frequency was low compared to allele frequency for both pools and heterozygotes which was consistent with low mean Illumina θ for heterozygotes (depicted A/B in figure legend. (b) Pooling allele frequency and mean heterozygote Illumina θ were high compared to allele frequency. (c,d) Pooling allele frequency and mean heterozygote Illumina θ were similar to allele frequency.
Technical error of estimated animal contributions for random samples of SNP decreased with increasing numbers of SNP per sample (Table 2).
3.3. Proportionality of Animal Contributions Conserved with Dilution
Estimated animal contributions to super pools were proportional to the contribution of the same animal to the sub-pool even though any given animal was diluted to different extents in the two super pools they were in (each animal was in one sub-pool and two super pools); linear regression of the super pool observed contribution on the sub-pool observed contribution yielded r2 = 0.99 for super pool abscess 1, 0.98 for super pool abscess 2, 0.96 for super pool normal 1 and 0.99 for super pool normal 2.
3.4. Identity by Descent Sharing
Haplotypes within animals in sub-pools or super pools share identity by descent (IBD) with at least one animal not in a sub-pool or super pool for 85 to 95% of their genome. Each haplotype within each sub-pool was checked for shared IBD with 1492 haplotypes outside the sub-pool; two haplotypes for each of the 746 animals, comprising 718 animals from [], 32 animals from the current study, minus four animals in each sub-pool. Each haplotype within each super pool was checked for shared IBD with 1468 haplotypes outside the super pool; two haplotypes for each of the 734 animals, comprising 718 animals from [], 32 animals from the current study minus 16 animals in each super pool.
To further evaluate the structure of our population, we estimated breed composition of the liver samples using a regression analysis similar to [], with the exception that we used BovineHD 770k data from []. One animal was a mix of Holstein and Jersey, four were crossbred beef females, and 27 were purebred Holstein. Hence, our assumption prior to analysis that all 32 animals were Holstein steers proved to be incorrect.
4. Discussion
Pool construction error increased with planned animal contribution (p ≤ 0.0154), which implies that pool construction error decreases with an increasing numbers of animals equally represented in a pool, because planned contribution is the reciprocal of the number of animals equally represented. Based on these results, we recommend more animals per pool, as also supported by previous literature [].
Technical error in animal contributions decreases as more SNP are used to estimate animal contribution, which is consistent with the Central Limit Theorem coming into play and reducing technical error in estimating animal contributions as more SNP are included in the computation. An implication of this result is that we can accurately estimate haplotype contributions within a chromosomal region if there are adequate numbers of SNP within the region.
The four animals in each sub-pool are each represented in two super pools at two different dilutions. The proportion of the animals in the sub-pool were strongly correlated with the proportion in the two super pools regardless of the dilution; furthermore, the two dilutions in the super pools were strongly correlated. This finding suggests that pools of animals with extreme phenotypes from different breeds can be combined into larger pools to save money. Similarly, pools of animals with extreme phenotypes from different seasons, pens within a feedlot, feedlots, and pastures can be combined. Commercial feedlot cattle being collected from a packing plant are generally comprised of multiple breeds and crossbreeds, and phenotypically extreme animals in a particular pen of animals is likely to contain more than one breed; indeed, in most circumstances we do not know the breed makeup when we are processing the samples into pools. The phenotypic extremes of animals within a particular pen may not comprise of very many animals. For example, the top 5% of 200 animals in a pen is only 10 animals. Combining animals with extreme phenotypes from 10 pens to make one pool of 100 animals results in a savings of 90% relative to genotyping 10 pools with 10 animals each.
Although not typically thought of this way, the number of copies of a B allele for an individual divided by two is the allele frequency of two haplotypes in the individual, one of maternal and the other of paternal origin. When we regress Illumina θ for a pool of genotypes for individuals, we are estimating the representation of pools of two haplotypes in a larger pool context. If phenotypically extreme animals in the pool share chromosomal regions IBD with other animals not in the pool, then the distribution of haplotypes of animals not in the pool can be accurately estimated, and those haplotype contributions can be used to inform the estimated breeding value of other animals with shared IBD through the IBD sharing. Using 718 animals from 18 diverse breeds, we found that all 32 animals in our pools each shared between 85 and 95 % of their genomes in IBD with at least one reference haplotype from 746 or 734 animals not in the pool representing multiple diverse breeds. This demonstrates that reference haplotypes from approximately 750 diverse animals (1500 haplotypes) is sufficient to cover IBD for 85 to 95% of the genome for a purebred Holstein or crossbred beef animal; it all hinges on whether the haplotypes in the pool are covered by reference haplotypes, and they were in this case. It is unknown whether the high coverage in this case was due to a small sample of Holstein haplotypes or due to fairly large haplotype segments being ubiquitous across populations as a result of historical natural and artificial selection or random drift [,].
5. Conclusions
Pool construction error decreases as more animals are incorporated into the pool; hence, pools with more equally represented animals would be expected to have less pool construction error, that is, the actual contribution would be closer to the planned contribution compared to pools with fewer animals. Technical error decreases as more SNP are used to estimate haplotype contributions. Similar proportionality of animal contribution estimates in the sub-pool and after dilution to the super pool indicates that animals with extreme phenotypes of different breeds can be mixed into larger pools to save cost without much loss of information. Pools of phenotypically extreme animals can inform genetic evaluation if there is IBD sharing between animals in the pool and selection candidates outside the pool; hence, population distant IBD ensures the relevance of pools of phenotypically extreme animals for the purpose of genetic evaluation.
Author Contributions
Conceptualization, J.K., T.M., L.K., J.J. and T.L.; methodology, T.M., J.K. and T.L.; software, J.K.; validation, J.K. and L.K.; formal analysis, J.K.; investigation, J.J. and T.L.; resources, J.J. and T.L.; data curation, T.L., T.M. and J.K.; writing—original draft preparation, J.K. and L.K.; writing—review and editing, J.K., L.K.,T.M., T.L. and J.J.; visualization, J.K.; supervision, L.K., J.J. and T.L.; project administration, L.K.; funding acquisition, L.K., J.J. and T.L. All authors have read and agreed to the published version of the manuscript.
Funding
This research received no external funding.
Institutional Review Board Statement
Animal samples utilized in this study were recovered post mortem from abattoirs. Therefore, no Institutional and Animal Care and Use approval was obtained.
Informed Consent Statement
Not applicable because study did not involve humans.
Data Availability Statement
Raw data are available at Ag Data Commons, https://doi.org/10.15482/USDA.ADC/1523112 (accessed on 15 September 2021); and Ag Data Commons, https://doi.org/10.15482/USDA.ADC/1523111 (accessed on 15 September 2021).
Acknowledgments
We acknowledge the technical contributions of Sandra Nejezchleb and Tammy Sorensen. Mention of trade names or commercial products in this publication is solely for the purpose of providing specific information and does not imply recommendation or endorsement by the U.S. Department of Agriculture.
Conflicts of Interest
The authors declare no conflict of interest. The funders had no role in the design of the study; in the collection, analyses, or interpretation of data; in the writing of the manuscript, or in the decision to publish the results.
Appendix A
Planned sub-pool contributions to super pools are in Table A1 as depicted in Figure 1. This design is replicated with sub-pools of animal with liver abscess or normal livers.
Table A1.
Sub-pool contributions to super pools.
Table A1.
Sub-pool contributions to super pools.
| Super Pools | ||
|---|---|---|
| Sub-Pool | 1 | 2 |
| 1 | 0.1 | 0.3 |
| 2 | 0.2 | 0.4 |
| 3 | 0.3 | 0.1 |
| 4 | 0.4 | 0.2 |
Planned animal contributions to super pools and sub-pools are in Table A2 for animals with abscessed on normal livers based on Figure 1. The same design was applied to each phenotype (abscessed or normal livers) with a different set of animals for each phenotype.
Table A2.
Animal contributions to super pools and sub-pools.
Table A2.
Animal contributions to super pools and sub-pools.
| Sub-Pools | Super Pools | |||||
|---|---|---|---|---|---|---|
| Animal | 1 | 2 | 3 | 4 | 1 | 2 |
| 1 | 0.1 | 0.0 | 0.0 | 0.0 | 0.01 | 0.03 |
| 2 | 0.2 | 0.0 | 0.0 | 0.0 | 0.02 | 0.06 |
| 3 | 0.3 | 0.0 | 0.0 | 0.0 | 0.03 | 0.09 |
| 4 | 0.4 | 0.0 | 0.0 | 0.0 | 0.04 | 0.12 |
| 5 | 0.0 | 0.1 | 0.0 | 0.0 | 0.02 | 0.04 |
| 6 | 0.0 | 0.2 | 0.0 | 0.0 | 0.04 | 0.08 |
| 7 | 0.0 | 0.3 | 0.0 | 0.0 | 0.06 | 0.12 |
| 8 | 0.0 | 0.4 | 0.0 | 0.0 | 0.08 | 0.16 |
| 9 | 0.0 | 0.0 | 0.1 | 0.0 | 0.03 | 0.01 |
| 10 | 0.0 | 0.0 | 0.2 | 0.0 | 0.06 | 0.02 |
| 11 | 0.0 | 0.0 | 0.3 | 0.0 | 0.09 | 0.03 |
| 12 | 0.0 | 0.0 | 0.4 | 0.0 | 0.12 | 0.04 |
| 13 | 0.0 | 0.0 | 0.0 | 0.1 | 0.04 | 0.02 |
| 14 | 0.0 | 0.0 | 0.0 | 0.2 | 0.08 | 0.04 |
| 15 | 0.0 | 0.0 | 0.0 | 0.3 | 0.12 | 0.06 |
| 16 | 0.0 | 0.0 | 0.0 | 0.4 | 0.16 | 0.08 |
Boundaries separating bins for planned contributions to enable testing for equality of variance among levels of planned contributions are int Table A3. Granularity increases with number of bins. The maximum number of bins would be the number of unique values for planned contributions.
Table A3.
Boundaries between bins for planned contribution bins.
Table A3.
Boundaries between bins for planned contribution bins.
| Number of Bins | |||||
|---|---|---|---|---|---|
| Item 1 | 2 | 3 | 4 | 5 | 6 |
| Boundary | 0.010 | 0.010 | 0.010 | 0.010 | 0.010 |
| Label | 1 | 1 | 1 | 1 | 1 |
| Boundary | 0.082 | 0.045 | 0.035 | 0.035 | 0.025 |
| Label | 2 | 2 | 2 | 2 | 2 |
| Boundary | 0.400 | 0.110 | 0.085 | 0.065 | 0.045 |
| Label | 3 | 3 | 3 | 3 | |
| Boundary | 0.400 | 0.165 | 0.110 | 0.085 | |
| Label | 4 | 4 | 4 | ||
| Boundary | 0.400 | 0.165 | 0.125 | ||
| Label | 5 | 5 | |||
| Boundary | 0.40 | 0.25 | |||
| Label | 6 | ||||
| Boundary | 0.400 | ||||
1 Items are either boundaries between bins or labels for bins.
References
- Visscher, P.M.; Hemani, G.; Vinkhuyzen, A.A.E.; Chen, G.B.; Lee, S.H.; Wray, N.R.; Goddard, M.E.; Yang, J. Statistical Power to Detect Genetic (Co)Variance of Complex Traits Using SNP Data in Unrelated Samples. PLoS Genet. 2014, 10, e1004269. [Google Scholar] [CrossRef] [PubMed]
- MacGregor, S.; Zhao, Z.Z.; Henders, A.; Nicholas, M.G.; Montgomery, G.W.; Visscher, P.M. Highly cost-effective genome-wide association studies using DNA pools and dense SNP arrays. Nucleic Acids Res. 2008, 36, e35. [Google Scholar] [CrossRef] [PubMed]
- McDaneld, T.G.; Kuehn, L.A.; Thomas, M.G.; Snelling, W.M.; Smith, T.P.; Pollak, E.J.; Cole, J.B.; Keele, J.W. Genomewide association study of reproductive efficiency in female cattle. J. Anim. Sci. 2014, 92, 1945–1957. [Google Scholar] [CrossRef] [PubMed]
- Keele, J.W.; Kuehn, L.A.; McDaneld, T.G.; Tait, R.G., Jr.; Jones, S.A.; Smith, T.P.L.; Shackelford, S.D.; King, D.A.; Wheeler, T.L.; Lindholm-Perry, A.K.; et al. Genomewide association study of lung lesions in cattle using sample pooling. J. Anim. Sci. 2015, 93, 956–964. [Google Scholar] [CrossRef] [PubMed]
- Keele, J.W.; Kuehn, L.A.; McDaneld, T.G.; Tait, R.G., Jr.; Jones, S.A.; Keel, B.N.; Snelling, W.M. Genomewide association of liver abscesses in beef cattle. J. Anim. Sci. 2016, 94, 490–499. [Google Scholar] [CrossRef] [PubMed]
- Sonesson, A.K.; Meuwissen, T.H.; Goddard, M.E. The use of communal rearing of families and DNA pooling in aquaculture genomic selection schemes. Genet. Sel. Evol. 2010, 42, 41. [Google Scholar] [CrossRef] [PubMed][Green Version]
- Bell, A.M.; Henshall, J.M.; Porto-Neto, L.R.; Dominik, S.; McCulloch, R.; Kijas, J.; Lehnert, S.A. Estimating the genetic merit of sires by using pooled DNA from progeny of undetermined pedigree. Genet. Sel. Evol. 2017, 49, 28. [Google Scholar] [CrossRef] [PubMed]
- Improved Genotype Clustering with Gentrain3.0. 370-2016-015-A. Available online: Illumina.com (accessed on 2 September 2021).
- Goldfarb, D.; Idnani, A. Dual and Primal-Dual Methods for Solving Strictly Convex Quadratic Programs. In Numerical Analysis; Hennart, J.P., Ed.; Springer: Berlin, Germany, 1982; pp. 226–239. [Google Scholar]
- R Core Team. R: A Language and Environment for Statistical Computing; R Foundation for Statistical Computing: Vienna, Austria, 2020; Available online: https://www.R-project.org/ (accessed on 15 September 2021).
- Brown, M.B.; Forsythe, A.B. Robust tests for the equality of variances. J. Am. Stat. Assoc. 1974, 69, 364–367. [Google Scholar] [CrossRef]
- Browning, B.L.; Zhou, Y.; Browning, S.R. A one-penny imputed genome from next generation reference panels. Am. J. Hum. Genet. 2018, 103, 338–348. [Google Scholar] [CrossRef]
- Zhou, Y.; Browning, S.R.; Browning, B.L. A fast and simple method for detecting identity by descent segments in large-scale data. Am. J. Hum. Genet. 2020, 106, 426–437. [Google Scholar] [CrossRef] [PubMed]
- Porto-Neto, L.R.; Sonstegard, T.S.; Liu, G.E.; Bickhart, D.M.; Da Silva, M.V.; Machado, M.A.; Utsunomiya, Y.T.; Garcia, J.F.; Gondro, C.; Van Tassell, C.P. Genomic divergence of zebu and taurine cattle identified through high-density SNP genotyping. BMC Genom. 2013, 14, 87. [Google Scholar] [CrossRef] [PubMed]
- Kuehn, L.A.; Keele, J.W.; Bennett, G.L.; McDaneld, T.G.; Smith, T.P.; Snelling, W.M.; Sonstegard, T.S.; Thallman, R.M. Predicting breed composition using breed frequencies of 50,000 markers from the US Meat Animal Research Center 2000 Bull Project. J. Anim. Sci. 2011, 89, 1742–1750. [Google Scholar] [CrossRef] [PubMed]
- BovineHD Genotyping BeadChip Datasheet. 370-2010-018, BovineHD Genotyping BeadChip. Available online: Illumina.com (accessed on 7 September 2021).
- Peiris, B.L.; Ralph, J.; Lamont, S.J.; Dekkers, J.C. Predicting allele frequencies in DNA pools using high density SNP genotyping data. Anim. Genet. 2011, 42, 113–116. [Google Scholar] [CrossRef] [PubMed]
- Vargas Jurado, N.; Kuehn, L.A.; Keele, J.W.; Lewis, R.M. Accuracy of GEBV of sires based on pooled allele frequency of their progeny. G3 2021, 11, jkab231. [Google Scholar] [CrossRef] [PubMed]
- Nait Saada, J.; Kalantzis, G.; Shyr, D.; Cooper, F.; Robinson, M.; Gusev, A.; Palamara, P.F. Identity-by-descent detection across 487,409 British samples reveals fine scale population structure and ultra-rare variant associations. Nat. Commun. 2020, 11, 6130. [Google Scholar] [CrossRef] [PubMed]
- Zhou, Y.; Browning, S.R.; Browning, B.L. IBDkin: Fast estimation of kinship coefficients from identity by descent segments. Bioinformatics 2020, 36, 4519–4520. [Google Scholar] [CrossRef] [PubMed]
Publisher’s Note: MDPI stays neutral with regard to jurisdictional claims in published maps and institutional affiliations. |
© 2021 by the authors. Licensee MDPI, Basel, Switzerland. This article is an open access article distributed under the terms and conditions of the Creative Commons Attribution (CC BY) license (https://creativecommons.org/licenses/by/4.0/).