Article

Production Efficiency and Total Protein Yield in Quinoa Grown under Water Stress

1
Departamento de Producción Vegetal, Facultad de Agronomía, Universidad de Concepción, Concepción 4030000, Chile
2
Department of Plant Sciences, North Dakota State University, Fargo, ND 58108, USA
*
Author to whom correspondence should be addressed.
Agriculture 2021, 11(11), 1089; https://doi.org/10.3390/agriculture11111089
Submission received: 3 September 2021 / Revised: 25 October 2021 / Accepted: 29 October 2021 / Published: 3 November 2021

Abstract

:
The increasing water scarcity affects the agricultural sector, and it is a significant constraining factor for crop production in many areas of the world. Water resource management and use related to crop productivity is the most important factor in many crops. Since consumer demands healthy food, the nutritive quality and the active ingredient need to be considered within the productive issue. The objective of this study was to determine water technical efficiency related to seed yield and seed protein content and composition in quinoa (Chenopodium quinoa Willd.) under water stress using data envelopment analysis (DEA). The study was conducted in Chillan, Chile in two growing seasons. As water availability increased, seed yield, globulin, and albumin yield increased, particularly in the genotype Cahuil. The higher average efficiency levels for the DEA were 46.7% and 39.2% in Cahuil in both seasons at 20% available water (AW). The highest average efficiency of globulin yield was recorded in the same genotype (Cahuil). The highest multi-product technical efficiency levels in all input and output included in this study were observed in Cahuil, Regalona, and Morado under water scarcity in both seasons. In future studies related to crop management, DEA provides a good framework for estimating efficiency under restricted factors and multi-product results.

1. Introduction

In recent years, agricultural regions around the globe have been subjected to extensive and increasing water constraints and scarcity, resulting in negative impacts to the environment, economy, and society [1,2,3]. Climate change is projected to increase fluctuations in precipitation and surface water supplies, affecting crops’ water requirements [4,5]. This poses challenges to agriculture around the world, which will adapt farming practices to cope with water stress limiting crop yield, growth, and plant’s bioactive content. This while minimizing negative environmental impact; and feeding an ever-growing population efficiently by supplying healthy food [6,7].
Special attention has been given to the development of functional foods rich in bioactive ingredients, due to their role in disease prevention, particularly of chronic degenerative diseases such as diabetes Type 2 [8,9,10]. A wide range of new food products are emerging, particularly those related to protein sources. Protein deficiency is one of the major nutritional problems in developing word [11]. Protein derived from plant sources represent approximately 65% of the world’s supply of edible protein [12,13,14], pseudocereals and most of the legumes have important impact in the food and pharmaceutical industries due to their high nutritional value, mainly connected to their protein and allergens fraction compared with cereals [15].
Quinoa is an Andean pseudocereal that has been cultivated since ancient times by the Incas and Mapuches [16,17]. Quinoa proteins are mainly composed of globulins (37%) and albumins (35%) and a lower percentage of prolamin (0.5–7.0%), making it appropriate for celiac diets [18,19,20,21]. Furthermore, the protein content in this pseudocereal is higher than in most cereal grains, but less than in legume seeds [20,22], ranging between 130 and 200 g kg−1, and being particularly rich in histidine and lysine, two essential amino acids deficient in most cereals [23]. Quinoa phenology easily adapts to overcome several adverse abiotic factors [24,25,26,27] offering a clear potential to flourish under salt-prone area and limited water resources [28,29].
Improving water use and productivity in quinoa has been the subject of research by many [30,31,32]. Nevertheless, current water changes are expected to impact agriculture, making necessary to focus on efforts that increase overall water use efficiency to reduce the sector’s impact on freshwater resources [33,34]. Therefore, optimization of agronomic management and selection of water stress-resistant genotypes with high seed yield and quality are becoming key issues for sustainable agricultural production [18,35,36].
There are several techniques to measure efficiency in agricultural production by parametric and non-parametric methods [37,38,39,40,41,42,43,44,45]. Data envelopment analysis is a non-parametric linear programming-based technique of frontier estimation for measuring the efficiency of several decision-making units (DMUs) based on multiple inputs and outputs [46]. Efficiency is an input-output-revenue measure, which relates the maximum number of outputs or revenue reachable given the used input vector. The efficiency is estimated for each DMU comparing among DMUs according to the most efficient, and therefore this can be measured regardless of the inputs, outputs, and revenues of the production system [46,47]. The main advantage of a non-parametric method, like DEA, compared with parametric approaches, is that it does not require any prior assumption on the underlying functional relationships between inputs and outputs [35,48,49] and it is flexible enough to be used in different areas and contexts [40]. Resti [50] and Zhang [51] used a DEA model to estimate efficiency based on a multi-output. They noticed that DEA could achieve satisfactory results across measurement techniques. Llyas et al. [44] used DEA for analyzing dairy farms efficiency to identify management systems that used energy inputs more efficiently. Gamboa et al. [43] calculated eco-efficiency using environmental input and net revenue as the product in 367 quinoa farms. They noticed that 5% of the farms were eco-efficient using DEA. Laso et al. [42] assessed efficiency for the Spanish agri-food system to reduce emission and energy and noticed that energy consumption could be reduced up to 70% and reach efficient levels. Hosseinzadeh-Bandbafha et al. [52] estimated efficiency using DEA in dairy farms, and they found that half of the farms were using energy efficiently and reducing greenhouse gases (GHG) emissions. Most DEA researches are focused on farms and crop levels, and none measures efficiency of a plant in terms of nutritional content and seed yield.
Due to this, our work proposes the use of this technique as a methodology to adjust water supply to reach productive efficiency in quinoa protein content and composition, since ANOVA measurements only allow estimating significant differences and not a relationship of inputs use with productivity and efficiency. The objective of this study was to determine water technical efficiency related to seed yield and total seed protein content in quinoa under water stress using DEA.

2. Materials and Methods

2.1. Field Establishment and Experimental Design

The experiments were conducted in Chillán, at “El Nogal” Experimental Station (−36°35′43.2″ S, −72°04′39.9″ W, and 140 m.a.s.l.), Diguillín Province, Ñuble Region, Chile, during two consecutive seasons (2014/2015 and 2015/2016). The soil belongs to the Arrayán series (medial, thermic, humid Haploxerand), with a leveled topography and good drainage, and an annual average rainfall of 1000 mm [53]. The climate of this location is classified as temperate Mediterranean [54]. Measurements of daily temperature, and rainfall were made at the meteorological station (Datalogger ThiesClima model DLx-Met, AdolfThies GmbH & Co., Göttingen, Deutschland) located at experimental station “El Nogal” in Chillán. Figure 1 shows maximum and minimum T° in both seasons, the maximum T° during crop season were 34.0 °C and 34.5 °C in the summer of 2014/2015 and 2015/2016, respectively. The minimum temperatures were 0.8 °C and 0.5 °C in the spring of 2014/2015 and 2015/2016. Soil samples were taken prior to the sowing date in each replicate both years. Soil analysis that was performed on 0–20 cm depth samples included pH, organic matter, P, K, and NO3-N in both seasons (Table 1).
In both years, soil samples had an average bulk density of 1.28 mg m−3, field capacity (FC) on the surface was 0.33 m3 m−3, varying at 0.39 m3 m−3 at 0.6 m depth. Permanent wilting point (PWP) on the surface was 0.17 m3 m−3, varying at 0.21 m3 m−3 in 0.6 m depth, determined by the pressure plate method [55]. Additionally, previous crop at the experimental site was oat (Avena sativa L.).
The field experimental design, for both seasons, was a randomized complete block design (RCBD) with a split-plot arrangement and four replicates. The main plot was the level of available water (AW) at 0.6-m soil depth, once 50% of the grains were in the grain filling stage. Treatments applied in the main plot were five irrigation soil water content- levels, (95%, 70%, 40%, 20% and 0% of AW). The following equation was used to determine AW:
AW = (θfc − θpwp) × Z
where θfc is soil water content at FC and θpwp is soil water content at PWP, representing soil water potential at −30 and −1500 J kg−1 respectively, and Z is root zone depth (0.6 m) [56]. Both field capacity and permanent wilting point were measured with a neutron probe (CPN, 503-DR Hydroprobe, Campbell Pacific Nuclear International, Concord, CA, USA), previously calibrated according to the conditions of the study site (FC = 0.52 m3 m−3 and PWP = 0.25 m3 m−3). Water irrigation in the treatments 0%, 20%, 40%, 70% and 95% of AW were 0 mm, 142.2 mm, 196.6 mm, 254.9 mm and 320 mm in season 2014/2015, respectively, and precipitation during cultivation was 24.9 mm. In season 2015/2016, water irrigation in the treatments 0%, 20%, 40%, 70% and 95% of AW were 0 mm, 255.5 mm, 333.3 mm, 391.6 mm and 424 mm respectively; and precipitation during cultivation was 113.3 mm.
The sub-plot consisted of four quinoa genotypes (lowland Mediterranean ecotype): Regalona (official variety recorded in the national catalog of the Agriculture and Livestock Service (SAG) of the Chilean Ministry of Agriculture), the breeding line AG 2010 (obtained from Agrogen E-I-R-L, Temuco, Chile), and the local landraces Cahuil and Morado.
Experimental units under both seasonal experiments consisted of four rows, 5-m long, and spaced 0.45-m apart. Seeding dates at each experiment were 5 October 2014 (2014/2015 season) and 20 September 2015 (2015/2016 season). Sowing was made by hand, seeding rate was 15 kg pure live seed ha−1 and target sowing depth was 5-mm. Once the 4–6-true leaf stage was reached, seedlings were thinned, leaving 12 plants per linear meter. Phosphorus was applied and incorporated at the moment of soil preparation at 4-cm deep in the last tilling before planting, in doses of 100 kg of P2O5 in the form of monocalcium phosphate monohydrate, Ca(H2PO4)2·2H2O and 50 kg of K2O ha−1 using potassium sulfate, K2SO4. The application of nitrogen was 160 kg N ha−1, applied as urea, CO(NH2)2, split in two applications, 50% at the second true-leaf stage, and the other 50% at the beginning of the reproductive stage.
Broadleaved weeds and grasses were controlled with glyphosate (N-phosphonomethyl glycine) in pre-emergence, applying 0.96 a.i. L ha−1. After the emergence of the quinoa plants, all the weeds were manually controlled.
The irrigation system was installed after the emergence of the plants, using an irrigation tape with drippers incorporated every 10 cm, and an average flow rate of 5 L m−1 h−1 throughout the season. From planting until the beginning of the grain filling phenological state, the experiment was irrigated each time the soil moisture reached 70% of the AW at the 60-cm soil root depth [57]. To homogenize soil water content before starting with the differential irrigation treatments, the trial was irrigated until reaching field capacity.
Quinoa was harvested in the summer on 2014/2015 and 2015/2016 seasons, once 50% of the panicles had reached physiological maturity [58]; plants from 4-m in length, from the center-two rows (3.6 m2) of each experimental unit were cut at the soil surface and then placed in a paper bag to dry in the field. Seven days later, plants were threshed with a stationary plot combine (Bill’s Welding Pullman, WA, USA). Once seeds were dried and impurities removed, seed yield was determined.
Total protein quantification was conducted using the official method described by [59], which is based on the quantification of total nitrogen content in the sample as described by Kjedahl (Method 981.10) using the conversion factor of total nitrogen to protein content determined by [60] in quinoa, equivalent to a value of 5.39. Extraction of albumin and globulin protein fractions was conducted according to the protocols described by [61,62], with some modifications [17].

2.2. Input and Output Indicators

One input and three outputs were used to measure technical efficiency. Technical efficiency is estimated comparing the relationship between water availability and output levels across genotype with a production frontier, which represents the maximum outputs attainable from each water availability level and replicate [46,47]. The outputs represent seed yield and the amount of protein (either globulins or albumins) produced by each genotype and replicate. For each replicate, the level of efficiency was measured between all repetitions, regardless of the irrigation regime or genotype. The studied input was the quantity of water supplied to the soil in each irrigation regime. In this research, AW is the only input for the model; hence, technical efficiency is related to water use efficiency. If there were more inputs, an overall technical efficiency would be estimated. Data was collected in 2014/2015 and 2015/2016 seasons.

2.3. The Model

This study assumes that production exhibits variable returns to scale, and it is input oriented with slack-based measure. Outputs are seed yield, and globulins or albumins in kg per hectare, while the main input component is available water throughout the season in m3 per hectare.
Based on a DEA oriented to inputs, the model is structured to determine how much an input level can be reduced while maintaining the same level of output. Data Envelopment Analysis (DEA) models can also include slack variables as proposed by [63] to approach and assign relative importance of inputs and outputs. The model used to measure technical efficiency was the following:
min θ 0 λ   θ 0 ε i I S i + k K S i +
Subject to:
θ   X g w r i 0 g G w W r R λ g w r X g w r i S i = 0 ,     i = 1 ,   ,   I Q g w r k 0 g G w W r R λ g w r Q g w r k S k + = 0 ,     k = 1 ,   ,   K λ g w r ,   S i ,   S k + 0 ,   θ   f r e e
where, ε is a infinitesimal constant, S+ and S are slack variables between input/output of each DMU, i is type of input, k is type of output, g is genotype, w is field capacity (water level), and r is replicate; θ is efficiency measurement, and 1 indicates total efficiency; λgwr is weight assigned to gth genotype; Xgwri is input (water level) used in genotype m, water level r, and n replicate; and Qqwrk is output k, i.e., yield, kg ha−1; globulins, kg ha−1; or albumins, kg ha−1.

2.4. Statistical Analysis

Statistical analysis was performed using standard procedures for a randomized complete block design with a split-plot arrangement, in each season, by analysis of variance (ANOVA). Seasons were considered a random effect, and genotypes and irrigation were considered fixed effects in the statistical analysis. Residual mean squares were tested for homogeneity among seasons. As they were heterogeneous, a combined analysis across seasons was not conducted. Means separation was performed by applying F-protected least square differences (LSD) comparisons at p ≤ 0.05 level of significance. The SAS University Edition software was used to process the data [64].

3. Results

3.1. Seed Yield

A decrease in seed yield of two genotypes and a significant interaction (p ≤ 0.05) between water restriction and genotypes was observed in 2014/2015 season, when plants were submitted to water-restriction. In particular, an increase in seed yield of Regalona and Morado were observed, when plants were submitted to increasing available water. Seed yield increased from 557 to 2475 kg ha−1 (Regalona) and from 409 to 1794 kg ha−1 (Morado) under increasing water availability (95, 70, 40, and 20% AW). The genotype with the highest seed yield was Cahuil with 2135 and 2806 kg ha−1 at 20 and 95% AW, respectively (Table 2). However, in the 2015/2016 season, the highest seed yield was observed in genotypes Cahuil and Morado (3348 and 3288 kg ha−1, respectively) with significant differences between Regalona and Ag2010, with 2875 and 2357 kg ha−1, respectively. Regarding water treatments in the 2015/2016 season, the highest seed yield was in the treatment with 95% AW, averaged across genotypes. Significant differences (p ≤ 0.05) were determined between the 95% AW treatment and no irrigation and 20% AW treatment (Table 3). However, there were no significant differences among 95, 70, and 40% AW treatments (p > 0.05) in the 2015/2016 season. It should be noted that the seed yield obtained with the 95% AW treatment was 23.7% and 20.6% higher than the 20% AW and no irrigation treatments, respectively.

3.2. Total Protein Content

Total protein content varied among genotypes in 2014/2015 season, where the highest protein content was in seeds of Morado, Regalona, and Cahuil. These genotypes were significantly different (p ≤ 0.05) with AG 2010 (Figure 2). However, in the 2015/2016 season there were no differences (p > 0.05) among genotypes.
In the 2015/2016 season, total protein ranged between 107 and 112 g kg−1 in Cahuil and Morado, respectively. In this season, the 95% AW treatment had the highest protein content averaged across genotypes. No significant differences (p > 0.05) in total protein were determined among 0, 40, 70 and 95% AW treatments (Figure 2).

3.3. Globulin and Albumin Yield

Globulin yield was different (p ≤ 0.05) in both seasons, reaching higher content in Cahuil seed with a value of 6.3 kg ha−1, which was not different (p > 0.05) than that of Regalona (5.1 kg ha−1) in the 2014/2015 season (Figure 3). However, in the season 2015/2016, Regalona’s globulin yield was 5.26 kg ha−1 and different (p ≤ 0.05) of that of ‘Cahuil’ (6.3 kg ha−1). Globulin yield in Morado was 3.4 kg ha−1 (season 2014/2015). However, Morado had greater globulin yield (6.6 kg ha−1) in the 2015/2016 season. Both Morado and Cahuil had less globulin yield (p ≤ 0.05) compared with Regalona and AG 2010, of which both had the highest average globulin yield in the 2015/2016 season. Globulins were the major fraction in mature quinoa seeds, except in AG2010 in the 2014/2015 season, where globulin yield was less than albumins (Figure 3). In all genotypes, globulins yield increased with greater water availability.
In the 2014/2015 season, the 95% AW treatment averaged the highest total globulin yield (6.9 kg ha−1), followed by the 70% AW treatment with 6.6 kg ha−1, but without significant differences between them (p > 0.05). The no irrigation treatment had the lowest globulin content (1.7 kg ha−1). In the 2015/2016 season, the 95% AW treatment also had the highest globulin yield (7.1 kg ha−1), while the lowest values were recorded with 20% AW and no irrigation treatments, with 4.4 kg ha−1 and 5.0 kg ha−1, respectively.
For albumin yield, there was a significant interaction between genotype and AW treatment. Regalona and Morado increased their albumin content from non irrigation to 95% AW, while AG 2010 had a less albumin yield at 95% AW. In the 2015/2016 season, the highest albumin yield was recorded in Regalona, Cahuil and Morado, with albumin yields of 3.5; 3.3 and 3.2 kg ha−1, respectively (Figure 3). In turn, total albumin yield averaged 4.4 kg ha−1 in the 95% AW treatment and was different (p ≤ 0.05) than the 40%, 20% AW and non irrigated treatments. The lowest albumin yield was observed in the no irrigation and 20% AW treatments in the 2014/2015 and 2015/2016 seasons, respectively.

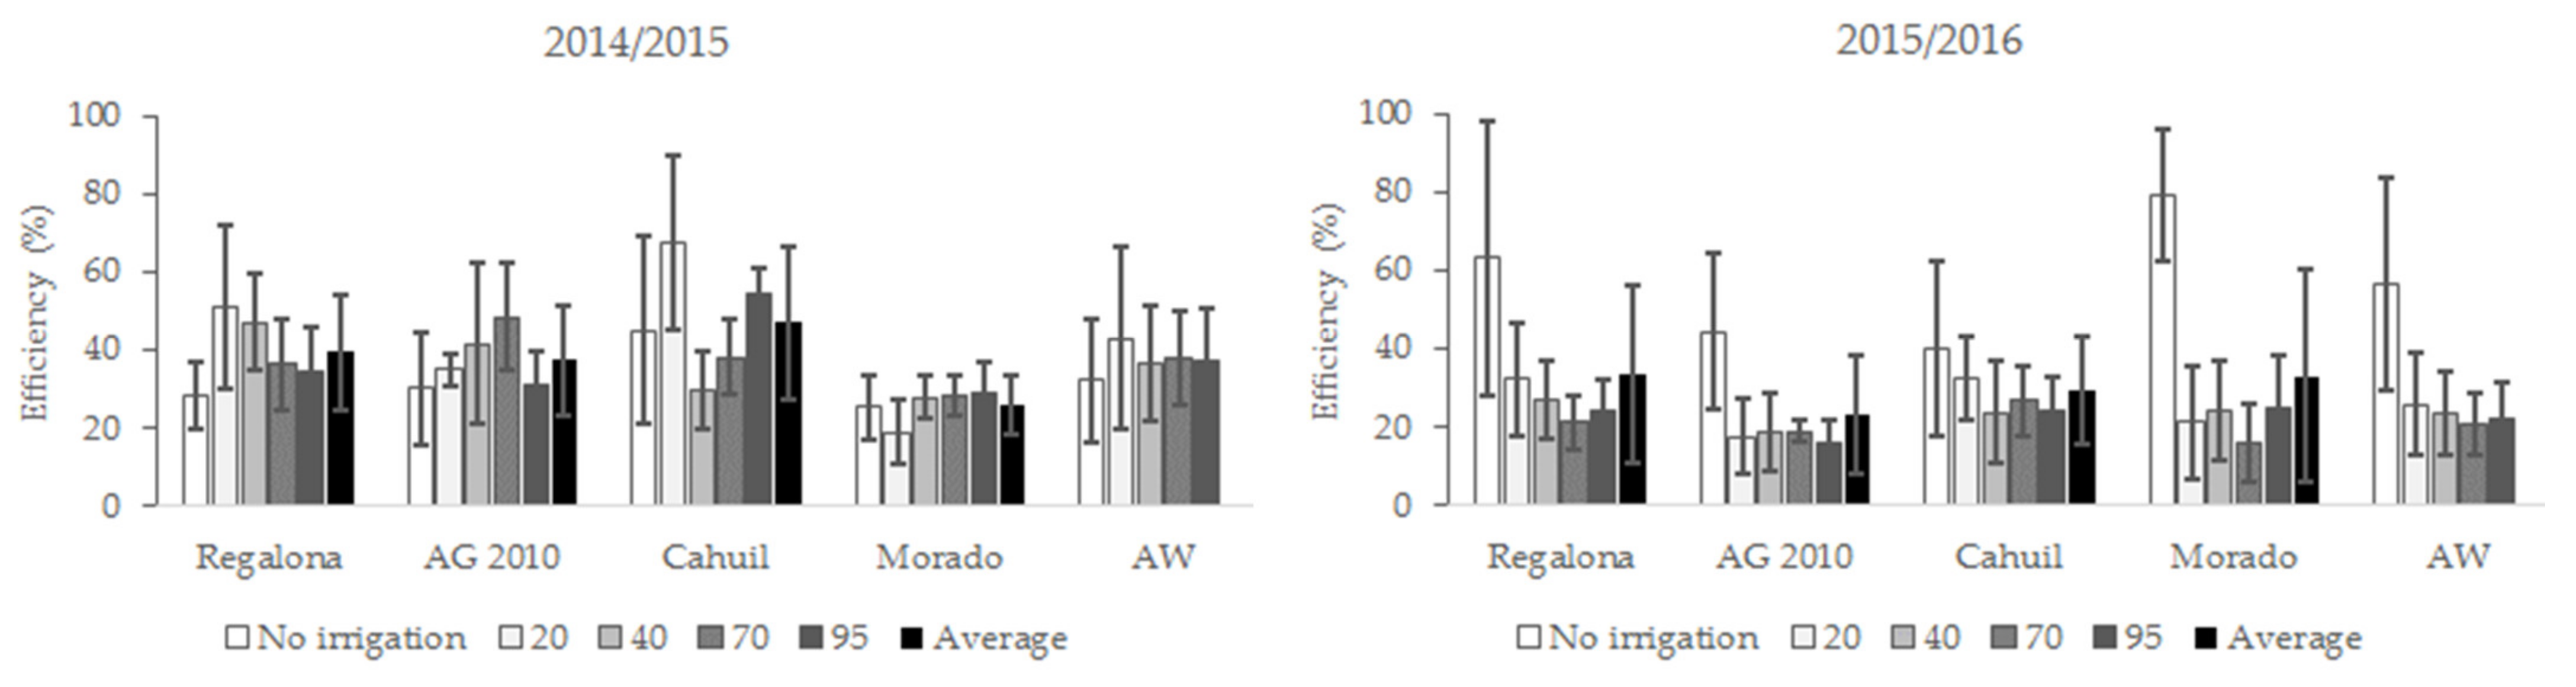
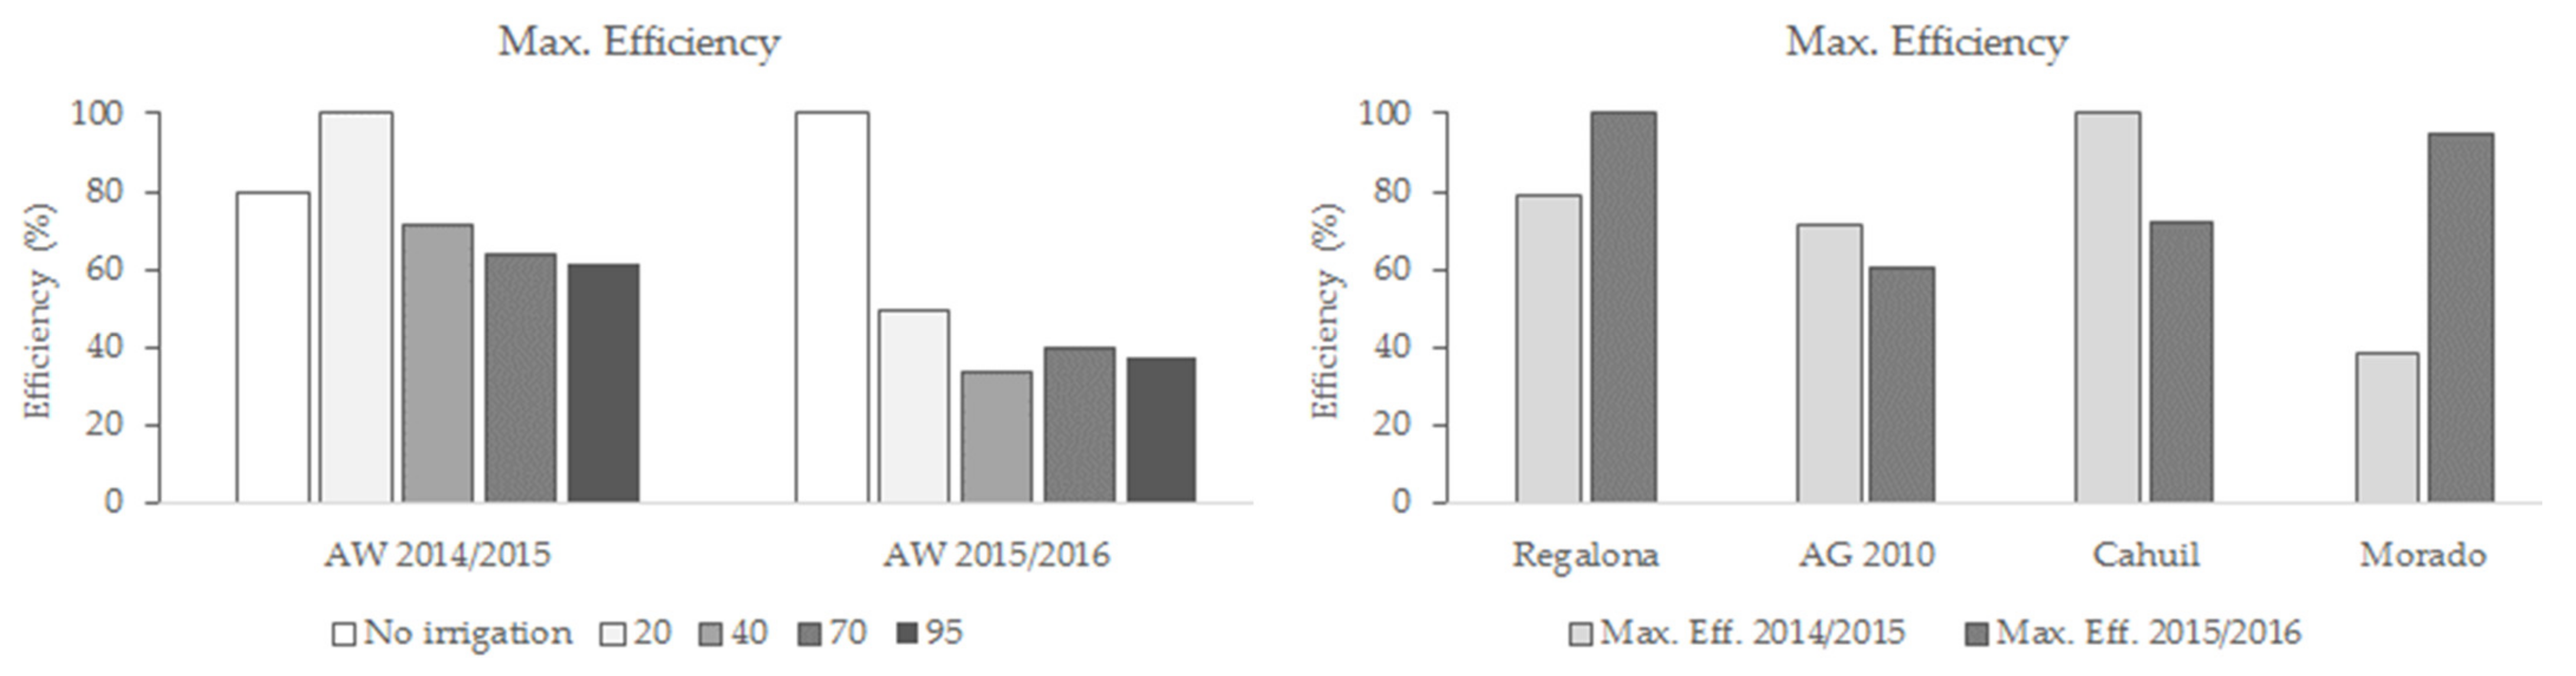
3.4. Seeds Yield Efficiency

The ANOVA showed significant differences (p ≤ 0.05) between the treatments as water availability increased, resulting in higher seed yield, and greater globulin and albumin yield, particularly in Cahuil, which showed significant differences compared with the other genotypes. These results would indicate that the selected genotype for highest seed yield efficiency would be Cahuil at 95% AW (Figure 4).
The highest average efficiency scores for DEA were 46.7% and 39.2% in Cahuil in the 2014/2015 and 2015/2016 seasons, respectively. The 20% AW treatment recorded a higher average efficiency value compared with the rest of the AW treatments in terms of seed yield per hectare (Figure 4). It is important to note that the genotype and water regime applied is technically efficient if and only if θ is equal to 100%, otherwise it is inefficient as higher efficiency levels would be reached with a different water regime and use of resources. This was observed in Cahuil, which had the highest efficiency score under 20% AW and no irrigation in the 2014/2015 and 2015/2016 seasons, respectively.

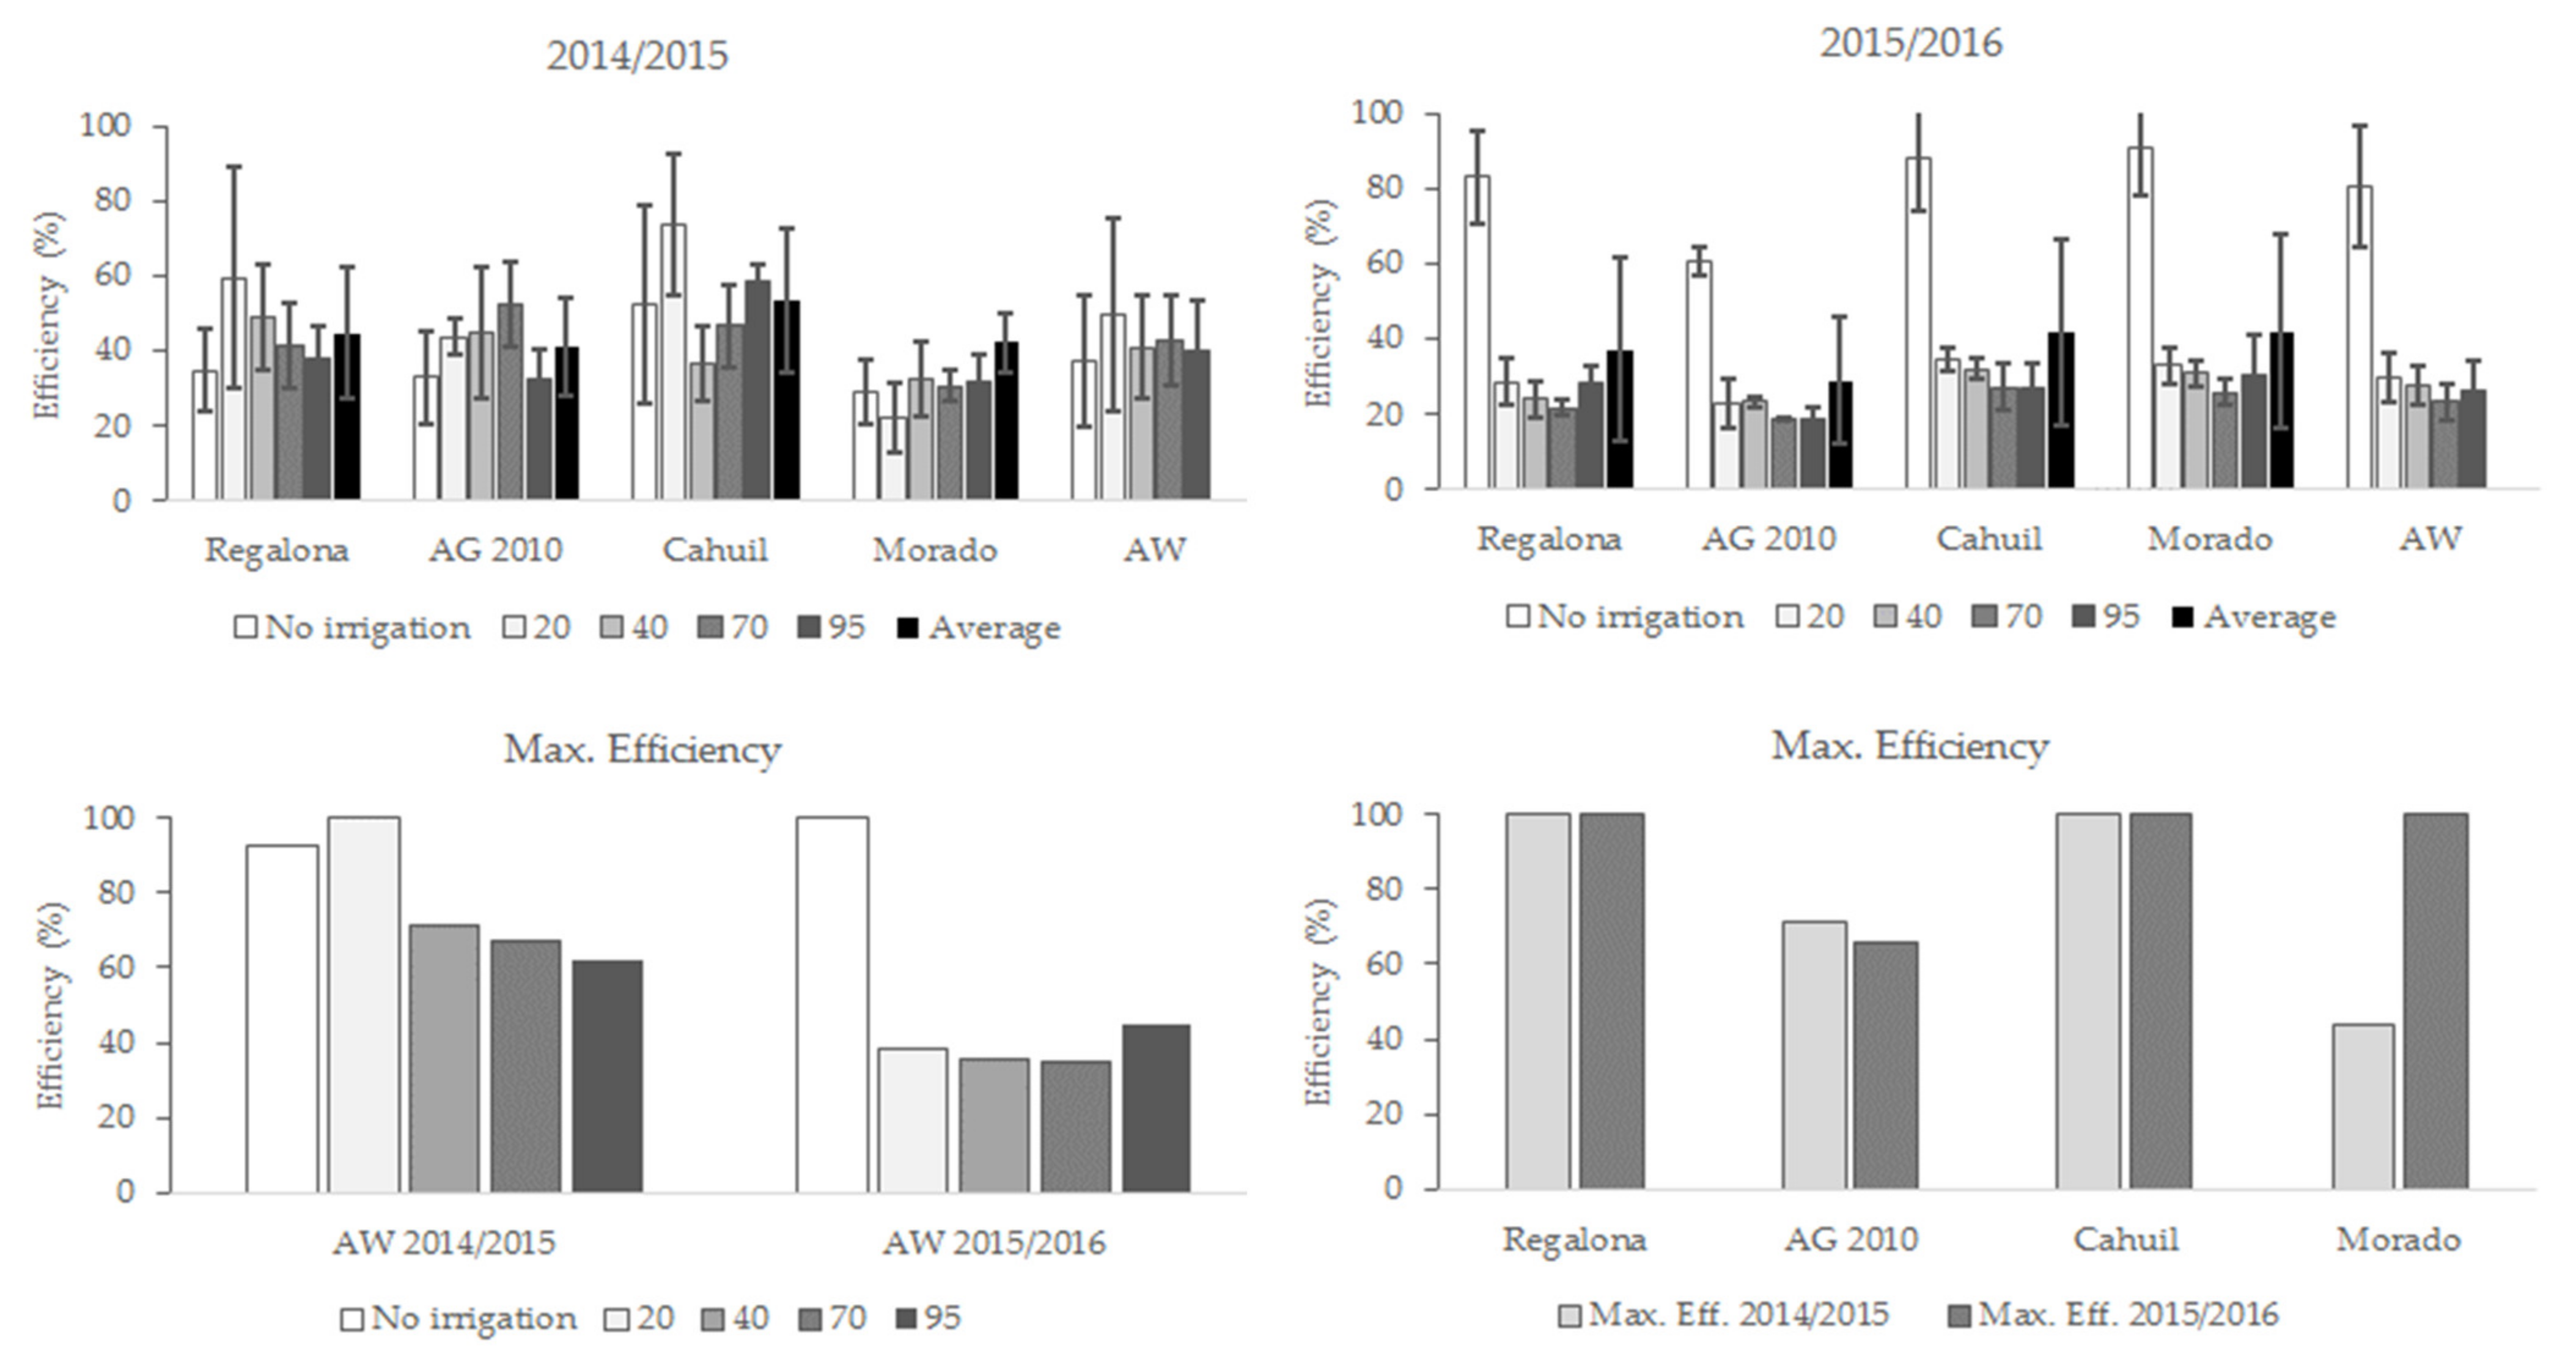
3.5. Technical Efficiency in Globulin and Albumin Yield

With respect to globulin yield, efficiency levels varied between genotypes, and between irrigation treatments in both seasons (Figure 5). In the 2014/2015 season, the highest average efficiency levels were recorded by Cahuil (40%), followed by Regalona (33.3%). In the 2015/2016 season, Cahuil and Morado reached the highest levels, with average values of 38.1% and 38.3% respectively. Maximum efficiency levels were recorded by ‘Regalona’ (100%), followed by Cahuil (78.9%) in the 2014/2015 season, and Cahuil (100%) in the 2015/2016 season.
Regarding the different water regime and soil available water, the highest average efficiency level was reached at 20% AW and no irrigation with 36.7% and 62%, in the 2014/2015 and 2015/2016 seasons, respectively (Figure 5).
Similar to globulin, the highest albumin production efficiency was observed in Cahuil and Regalona, with values of 100% and 79.2% in the 2014/2015 season, and 71.9% and 100% in the 2015/2016 season, respectively (Figure 6). In turn, the 20% AW and no irrigation treatments reached higher levels than the rest of the treatments, with values of 43.1% and 56.8% in the 2014/2015 and 2015/2016 seasons, respectively. In the 2014/2015 season, the maximum efficiency levels were observed in Cahuil and Regalona, followed by AG 2010, and the highest efficiency level was in Cahuil under 20% AW (67.5%).
In the following season, as it was observed in seed yield and globulin yield, the highest average efficiency levels in terms of irrigation regime were with no irrigation, followed by the 20% AW treatment. Whereas, in terms of quinoa genotypes, Regalona had the highest levels, with 33.6% efficiency, followed by Morado and Cahuil. Maximum efficiency levels were observed in Regalona and Morado with values of 100% and 94.9%, respectively (Figure 5 and Figure 6).
In the first season, the highest average value of field components was recorded by Cahuil, with 53.7%, and in the 2015/2016 season, the highest levels were recorded by Cahuil and Morado, with values of 41.8% and 42.1%, respectively (Figure 7).
Maximum efficiency levels were obtained in Cahuil and Regalona under 20% AW in the 2014/2015 season. These two genotypes, along with Morado, reached maximum efficiency levels under no irrigation in the 2015/2016 season.

4. Discussion

Agronomic management applies to agriculture needs to adapt to climate change effects, like water scarcity. Water use efficiency and efficient plant outputs like seed yield and nutritional quality need to be reevaluated to use energy inputs efficiently. Multi-product analysis was used to answer the questions, “How much productive are quinoa genotypes under different water input?” and “How much is gained in total protein content, globulins, and albumins yield?” Quinoa exhibits a strong variability to genotype-specific responses affecting crop seed yield and nutritional quality, according to the environment in which it grows [28,65]. These results showed potential improvement of technical efficiency when there is water restriction.

4.1. Seed Yield and Seeds Yield Efficiency

The low seed yield observed in the 2014/2015 season may be related to high temperature (average temperature of 30.2 °C) and solar radiation during the reproductive development of quinoa in the experiment (maximum PAR of 1218.5 µmol m−2 s−1). In this regard, the result could be attributed to heat events around anthesis, even if they are of short duration, causes a drastic reduction in seed yield in cool-season cereals [66,67,68], and in biomass yield in quinoa [69,70], and not a decrease of the photosynthetic capacity of the leaf by photoinhibition effect [48,49,50,57,70]. In addition, a higher air temperature promotes the closure of stomata and an increase in abscisic acid (ABA) concentration, especially in conditions of water restriction, which promotes rapid crop development, reducing the accumulation of dry matter in the seeds and the seed yield [57].
However, the water restriction applied after anthesis affected the yield of Regalona, Cahuil, and Morado in the 2025/2016 season. It has been shown that at flowering and milk stage seeds are sensitive to hydric stress [30].
Similar behavior was observed by Hirich et al. [71] in quinoa in Morocco with yield reductions of up to 36% if water availability was reduced to 50%. Garcia et al. [72] conducted a study in the irrigation requirements of quinoa and reported that 95% AW resulted in seed yield of about 3.7 Mg ha−1. Janssen et al. [18] found that water deficit in various crops improves water use productivity and does not necessarily cause reductions in seed yield. The latter could be explained that even though a lower foliar water potential decreased the Fv/Fm index, its value was close to the normal range, and photosynthetic activity was not affected [57]. In addition, other authors [73,74] mention that foliar photosynthesis is insensitive to water stress. Naana et al. [70] mention that quinoa plants exposed to water stress would be able to avoid the damage of PSII core complex, due to the recovery of the D1, D2, and CP47 proteins after rehydration.
In the specific case of quinoa, the plant can adapt to drought conditions developing different strategies [57,75,76]; for instance, deeper roots (for desiccation avoidance) and faster elongation, abundant and longer external branching of the roots (morphological strategy); accumulation of antioxidants [17], stomatal conductance [57], osmotic adjustment (physiological strategies); and synthesis of osmoprotectants (molecular strategies).
Our analysis was able to determine which genotype and water regime would either lead to higher efficiency level or be the most efficient to use under water scarcity. Our findings confirm that highest efficiency levels were observed under 20% AW and no irrigation treatments. Although seed yield of Cahuil increased as water supply increased, plant response to different water regimes resulted in a decrease in productivity (diminishing returns), while the relationship between seed yield and water unit (kg m−3) increased.

4.2. Total Protein Content, Globulins, and Albumins Yield Efficiency

The protein concentration obtained in this experiment were less than those reported for quinoa (140 a 160 g kg−1) in Chile [77], in Bolivia [78], and USA [79]. This difference could be partly explained by the high genetic variability observed in C. quinoa [16,79,80,81]. The increase in total protein content in the first season could be attributed to a plant-strategy in which low-molecular weight peptides and free amino acids sequester reactive species of oxygen (ROS) and osmotically active compounds, stabilizing the structure of cellular components under water stress conditions, e.g., high temperature, as it occurred in the 2014/2015 season [81,82]. However, this increased accumulation of metabolites in seeds is an ecophysiological compensation mechanism since other parameters may be affected, including seed yield [83,84].
Our results (Figure 3) are in agreement with those reported by Lindeboom [85] and Janssen et al. [18], who conducted a study in quinoa seeds and reported that albumins and globulins are the major protein fractions (44–77% of the total protein), with a higher globulin yield. The mature quinoa seed predominantly consists of 11S-type globulin, comprising about 37% of the total protein, and 2S albumin (35% of the seed protein) [18,19]. Since three novel peptides derived from 11S seed storage globulin were detected in the gastrointestinal digestion, showing ability to inhibit enzymes involved in degradation and digestion of dietary carbohydrates. Therefore, quinoa globulins could be applied for the management of diabetes [86,87].
The storage albumins in seeds of other species (Plukenetia volubilis L., Pisum sativum L., Morinda citrifolia) are not only a source of protein for nutrition but also have applications in the cosmetic, pharmaceutical, and food industries [88], as well having as anti-inflammatory effect [89,90].
In our research, Cahuil presented the higher average efficiency level in globulin yield (40%) followed by Regalona (33.3%) in the first season; while Cahuil and Morado (38.1% and 38.3%), were followed by Regalona in the second season. Similar to total protein concentration, water regime led to the highest efficiency under water scarcity. However, a trend across available water treatments in both seasons in terms of efficiency was not observed (Figure 5), compared with the positive trend observed in globulins yield under water availability in the first season (Figure 3). The TP content observed in the 2015/2016 season was 19% lower than that registered for the 2014/2015 season. Similarly, results have been described in wheat (Triticum aestivum L.) as globulins from mature endosperms play a key role in defensive responses to environmental stress [91]
Comparing wheat with quinoa seed/grain development, the accumulation of albumins and globulins occurs between anthesis and approximately 20 days after anthesis and does not vary later [92]. Therefore, if the milky-grain stage in quinoa is reached approximately 30 days after flowering [93], it could be assumed that albumins and globulins were synthesized in this period and that the irrigation deficit treatments applied during this growth stage no longer affected the accumulation of albumins and globulins in the seed. It is known that environmental factors affect protein content and composition, and, therefore, these results are relevant in food science related to health quality. Quinoa protein has potential uses such as a novel bioactive peptide with anti-diabetic property [86]. In addition, peptide inhibitors of interaction of spike protein SARS-CoV-2 angiotensin converting enzyme-2, can be used as an effective strategy to treat patients with COVID-19 [94,95].
The genotype Cahuil reached the highest efficiency level for albumin yield (Figure 6), similar to seed yield efficiency, with less water availability plants had higher efficiency (Figure 3), and on average efficiency increased with less water availability regime. The major seed storage proteins of quinoa are the 2S albumin, which is characterized by its high content of cysteine (15.6 mol%), arginine, histidine and lysine, with a relatively low content of methionine (0.6 mol%) [20].
While the main globulin 11S or chenopodin, is rich in glutamine/glutamic acid, asparagine/aspartic acid, arginine, serine, leucine, and glycine, but low in methionine and cysteine [96,97]. Valdivia-Cea et al. [57] suggest that in response to adverse environmental conditions, metabolites can accumulate in seeds, in order to improve the nutrients available at the time of embryo germination. While Liu et al. [98] observed that under conditions of hydric stress, the genic expression of HSP70 proteins (heat shock proteins) is modified.
In Table 3, it is shown an average summary of technical efficiency of the genotypes under different efficiency products measures in no-irrigation and 20% AW. For all yield parameters included in this study, i.e., seed yield, albumins, and globulins yield, the highest multiproduct technical efficiency levels were observed in Cahuil, Regalona, and Morado genotypes, under low soil water availability in both seasons.

5. Conclusions

In quinoa under conditions of water stress, the multi-product analysis and use of DEA allowed us to determine the production efficiency in terms of seed yield, protein concentration, and total globulin and albumin yield. The trend was that the efficiency increased with a lower water level regime in both seasons. In terms of seed yield, the highest average efficiency was observed with 20% AW in the first season, while in the second season it was achieved with no-irrigation. The highest average efficiency was observed for both globulins and albumin within the most restrictive irrigation (20% AW) in the first season and no-irrigation in the second season. Determining the efficiency for the optimal water use, especially in environments with water availability restrictions, is relevant to the albumin and globulins production under climate change scenarios. The albumin and globulins productions are of interest as input for the cosmetic, pharmaceutical, and food industries. The genotype efficiency response was variable in both seasons; however, Cahuil was the genotype that had the best performance regarding seed yield and globulin content.
Therefore, our study provides background regarding better decision making in crop management that should be considered under water scarcity and using DEA as a framework for estimating technical efficiency under water availability restriction and a multiproduct analysis. This allows for achieving the aim to improve agriculture techniques and efficiency uses.

Author Contributions

Conceptualization and methodology, A.A.P. and S.F.; software, A.A.P.; validation, A.A.P.; formal analysis; A.A.P.; Investigation, L.B. and S.F.; funding acquisition, S.F.; resources, writing-review and editing, S.F., R.W. and M.T.B. All authors have read and agreed to the published version of the manuscript.

Funding

This work was founded by FONDECYT regular (number 1140661, 2013–2015).

Institutional Review Board Statement

Not applicable.

Informed Consent Statement

Not applicable.

Data Availability Statement

Not applicable.

Acknowledgments

The authors acknowledge the FONDECYT regular (number 1140661, 2013–2015) for the financial support.

Conflicts of Interest

The authors declare no conflict of interest.

References

  1. Schewe, J.; Heinke, J.; Gerten, D.; Haddeland, I.; Arnell, N.W.; Clark, D.B.; Dankers, R.; Eisner, S.; Fekete, B.M.; Colón-González, F.J. Multimodel assessment of water scarcity under climate change. Proc. Natl. Acad. Sci. USA 2014, 111, 3245–3250. [Google Scholar] [CrossRef] [PubMed] [Green Version]
  2. Hoekstra, A.Y. Water scarcity challenges to business. Nat. Clim. Chang. 2014, 4, 318–320. [Google Scholar] [CrossRef]
  3. Gosling, S.N.; Arnell, N.W. A global assessment of the impact of climate change on water scarcity. Clim. Chang. 2016, 134, 371–385. [Google Scholar] [CrossRef] [Green Version]
  4. Fellmann, T.; Witzke, P.; Weiss, F.; Doorslaer, B.; Drabik, D.; Huck, I.; Salputra, G.; Jansson, T.; Leip, A. Major challenges of integrating agriculture into climate change mitigation policy frameworks. Mitig. Adapt. Strat. Glob. Chang. 2018, 23, 451–468. [Google Scholar] [CrossRef] [PubMed] [Green Version]
  5. Gil, J.D.B.; Reidsma, P.; Giller, K.; Todman, L.; Whitmore, A.; Van Ittersum, M. Sustainable development goal 2: Improved targets and indicators for agriculture and food security. Ambio 2019, 48, 685–698. [Google Scholar] [CrossRef] [PubMed] [Green Version]
  6. Cao, X.C.; Shu, R.; Guo, X.P.; Wang, W.G. Scarce water resources and priority irrigation schemes from agronomic crops. Mitig. Adapt. Strat. Glob. Chang. 2017, 24, 399–417. [Google Scholar] [CrossRef]
  7. Sala, S.; McLaren, S.J.; Notarnicola, B.; Saouter, E.; Sonesson, U. In quest of reducing the environmental impacts of food production and consumption. J. Clean. Prod. 2017, 140, 387–398. [Google Scholar] [CrossRef]
  8. Pravst, I. Functional Foods in Europe: A Focus on Health Claims. Scientific, Health and Social Aspects of the Food Industry. Available online: https://www.intechopen.com/books/scientific-health-and-social-aspects-of-the-food-industry/functional-foods-in-europe-a-focus-on-health-claims (accessed on 1 June 2021).
  9. Daliu, P.; Santini, A.; Novellino, E. From pharmaceuticals to nutraceuticals: Bridging disease prevention and management. Expert Rev. Clin. Pharmacol. 2019, 12, 1–7. [Google Scholar] [CrossRef]
  10. Lionetti, V.; Tuana, B.S.; Casieri, V.; Parikh, M.; Pierce, G.N. Importance of functional food compounds in cardioprotection through action on the epigenome. Eur. Heart J. 2019, 40, 575–582. [Google Scholar] [CrossRef]
  11. Semba, R.D. The rise and fall of protein malnutrition in global health. Ann. Nutr. Metab. 2016, 69, 79–88. [Google Scholar] [CrossRef] [Green Version]
  12. Aiking, H. Future protein supply. Trends Food Sci. Technol. 2011, 22, 112–120. [Google Scholar] [CrossRef]
  13. Henchion, M.; Hayes, M.; Mullen, A.M.; Fenelon, M.; Tiwari, B. Future protein supply and demand: Strategies and factors influencing a sustainable equilibrium. Foods 2017, 6, 53. [Google Scholar] [CrossRef] [PubMed] [Green Version]
  14. Reedy, J.; Cudhea, F.; Shi, P.; Zhang, J.; Onopa, J.; Miller, V.; Mozaffarian, D. Global intakes of total protein and sub-types; findings from the 2015 global dietary database (P10-050-19). Curr. Dev. Nutr. 2018, 3 (Suppl. 1). [Google Scholar] [CrossRef] [Green Version]
  15. Gorinstein, S.; Pawelzik, E.; Delgado-Licon, E.; Haruenkit Weisz, M.; Trakhtenberg, S. Characterization of pseudocereal and cereal proteins by protein and amino acid analyses. J. Sci. Food Agric. 2002, 82, 886–891. [Google Scholar] [CrossRef]
  16. Zurita-Silva, A.; Fuentes, F.; Zamora, P.; Jacobsen, S.E.; Schwember, A.R. Breeding quinoa (Chenopodium quinoa Willd.): Potential and perspectives. Mol. Breed. 2014, 34, 13–30. [Google Scholar] [CrossRef]
  17. Fischer, S.; Wilckens, R.; Jara, J.; Aranda, M.; Valdivia, W.; Bustamante, L.; Graf, F.; Obal, I. Protein and antioxidant composition of quinoa (Chenopodium quinoa Willd.) sprout from seeds submitted to water stress, salinity and light conditions. Ind. Crop Prod. 2017, 107, 558–564. [Google Scholar] [CrossRef]
  18. Janssen, F.; Pauly, A.; Rombouts, I.; Jansens, K.J.; Deleu, L.J.; Delcour, J.A. Proteins of amaranth (Amaranthus spp.), buckwheat (Fagopyrum spp.), and quinoa (Chenopodium spp.): A food science and technology perspective. Compr. Rev. Food Sci. 2017, 16, 39–58. [Google Scholar] [CrossRef]
  19. Dakhili, S.; Abdolalizadeh, L.; Hosseini, S.M.; Shojaee-Aliabadi, S.; Mirmoghtadaie, L. Quinoa protein: Composition, structure and functional properties. Food Chem. 2019, 299, 125–161. [Google Scholar] [CrossRef]
  20. Abugoch, L.E.; Romero, N.; Tapia, C.A.; Silva, J.; Rivera, M. Study of some physicochemical and functional properties of quinoa (Chenopodium quinoa Willd) protein isolates. J. Agric. Food Chem. 2008, 56, 4745–4750. [Google Scholar] [CrossRef]
  21. Guo, H.; Hao, Y.; Yang, X.; Ren, G.; Richel, A. Exploration on bioactive properties of quinoa protein hydrolysate and peptides: A review. Crit. Rev. Food. 2021, 1–14. [Google Scholar] [CrossRef]
  22. López, D.N.; Galante, M.; Robson, M.; Boeris, V.; Spelzini, D. Amaranth, quinoa and chia protein isolates: Physicochemical and structural properties. Int. J. Biol. Macromol. 2018, 109, 152–159. [Google Scholar] [CrossRef] [PubMed] [Green Version]
  23. Escudero, O.; Gonzalez, M.I.; Wells, G.; Fischer, S.; Hernández, J.M. Amino acid profile of the quinoa (Chenopodium quinoa Willd.) using near infrared spectroscopy and chemometric techniques. J. Cereal Sci. 2014, 60, 67–74. [Google Scholar] [CrossRef]
  24. Bertero, H.D.; de la Vega, A.J.; Correa, G.; Jacobsen, S.E.; Mujica, A. Genotype and genotype-by-environment interaction effects for grain yield and grain size of quinoa (Chenopodium quinoa Willd.) as revealed by pattern analysis of multi-environment trials. Field Crop Res. 2014, 89, 299–318. [Google Scholar] [CrossRef]
  25. Geerts, S.; Raes, D.; Garcia, M.; Mendoza, J.; Huanca, R. Crop water use indicators to quantify the flexible phenology of quinoa (Chenopodium quinoa Willd.) in response to drought stress. Field Crop Res. 2008, 108, 150–156. [Google Scholar] [CrossRef]
  26. Delatorre-Herrera, J.; Rojas-Urrutia, J.; Rojo, L.E.; Graf, B.L. Osmotic stress in Chenopodium quinoa Willd.: Variations in osmoprotectants at different phenological stages. Afr. J. Agric. Res. 2019, 14, 361–368. [Google Scholar] [CrossRef]
  27. Sellami, M.H.; Pulvento, C.; Lavini, A. Agronomic practices and performances of quinoa under field conditions: A systematic review. Plants 2021, 10, 72. [Google Scholar] [CrossRef]
  28. Khaitov, B.; Karimov, A.A.; Toderich, K.; Sultanova, Z.; Mamadrahimov, A.; Allanov, K.; Islamov, S. Adaptation, grain yield and nutritional characteristics of quinoa (Chenopodium quinoa) genotypes in marginal environments of the Aral Sea basin. J. Plant Nutr. 2021, 44, 1365–1379. [Google Scholar] [CrossRef]
  29. Da Silva, P.C.; Ribeiro, W.Q., Jr.; Ramos, M.L.G.; Celestino, S.M.C.; Silva, A.D.N.; Casari, R.; Vinson, C.C. Quinoa for the Brazilian Cerrado: Agronomic characteristics of elite genotypes under different water regimes. Plants 2021, 10, 1591. [Google Scholar] [CrossRef]
  30. Geerts, S.; Raes, D.; Garcia, M.; Vacher, J.; Mamani, R.; Mendoza, J.; Huanca, R.; Morales, B.; Miranda, R.; Cusicanqui, J.; et al. Introducing deficit irrigation to stabilize yields of quinoa (Chenopodium quinoa Willd.). Eur. J. Agron. 2008, 28, 427–436. [Google Scholar] [CrossRef]
  31. Dalla, M.A.; Eitzinger, J.; Kersebaum, K.C.; Todorovic, M.; Altobelli, F. Assessment and monitoring of crop water use and productivity in response to climate change. J. Agric. Sci. 2018, 156, 575–576. [Google Scholar] [CrossRef] [Green Version]
  32. Wang, N.; Wang, F.X.; Shock, C.C.; Meng, C.B.; Huang, Z.J.; Gao, L.; Zhao, J.Y. Evaluating quinoa stem lodging susceptibility by a mathematical model and the finite element method under different agronomic practices. Field Crop Res. 2021, 271, 108241. [Google Scholar] [CrossRef]
  33. Geerts, S.; Raes, D. Deficit irrigation as an on-farm strategy to maximize crop water productivity in dry areas. Agric. Water Manag. 2009, 96, 1275–1284. [Google Scholar] [CrossRef] [Green Version]
  34. Zahoor, S.A.; Ahmad, S.; Ahmad, A.; Wajid, A.; Khaliq, T.; Mubeen, M.; Nasim, W. Improving water use efficiency in agronomic crop production. In Agronomic Crops; Hasanuzzaman, M., Ed.; Springer: Singapore, 2019; pp. 13–29. [Google Scholar] [CrossRef]
  35. Field, C.B.; Barros, V.; Stocker, T.F.; Dahe, Q. (Eds.) Managing the Risks of Extreme Events and Disasters to Advance Climate Change Adaptation: Special Report of the Intergovernmental Panel on Climate Change; Cambridge University Press: Cambridge, MA, USA, 2012; Available online: https://www.ipcc.ch/report/managing-the-risks-of-extr (accessed on 10 June 2021). [CrossRef]
  36. Jaramillo Roman, V.; van de Zedde, R.; Peller, J.; Visser, R.G.; van der Linden, C.G.; van Loo, E.N. High-resolution analysis of growth and transpiration of quinoa under saline conditions. Front. Plant Sci. 2021, 1627. [Google Scholar] [CrossRef]
  37. Battese, G.E.; Coelli, T.J. Frontier production functions, technical efficiency and panel data: With application to paddy farmers in India. J. Prod. Anal. 1992, 3, 153–169. [Google Scholar] [CrossRef]
  38. Chavas, J.P.; Aliber, M. An analysis of economic efficiency in agriculture: A nonparametric approach. J. Agric. Res. Econ. 1993, 18, 1–16. [Google Scholar] [CrossRef]
  39. Latruffe, L.; Balcombe, K.; Davidova, S.; Zawalinska, K. Technical and scale efficiency of crop and livestock farms in Poland: Does specialization matter? Agric. Econ. 2005, 32, 281–296. [Google Scholar] [CrossRef]
  40. Hansson, H. Strategy factors as drivers and restraints on dairy farm performance: Evidence from Sweden. Agric. Syst. 2007, 94, 726–737. [Google Scholar] [CrossRef]
  41. Asmild, M.; Baležentis, T.; Hougaard, J.L. Multi-directional program efficiency: The case of Lithuanian family farms. J. Prod. Anal. 2016, 45, 23–33. [Google Scholar] [CrossRef]
  42. Laso, J.; Hoehn, D.; Margallo, M.; García-Herrero, I.; Batlle-Bayer, L.; Bala, A.; Aldaco, R. Assessing energy and environmental efficiency of the Spanish agri-food system using the LCA/DEA methodology. Energies 2018, 11, 3395. [Google Scholar] [CrossRef] [Green Version]
  43. Gamboa, C.; Bojacá, C.R.; Schrevens, E.; Maertens, M. Sustainability of small holder quinoa production in the Peruvian Andes. J. Clean. Prod. 2020, 264, 121657. [Google Scholar] [CrossRef]
  44. Llyas, H.M.A.; Safa, M.; Bailey, A.; Rauf, S.; Khan, A. Energy efficiency outlook of New Zealand dairy farming systems: An application of data envelopment analysis (DEA) approach. Energies 2020, 13, 251. [Google Scholar] [CrossRef] [Green Version]
  45. Amiryousefi, M.; Tadayon, M.R.; Ebrahimi, R. Energy and exergy efficiencies assessment for two quinoa cultivars production. Energy Rep. 2021, 7, 2324–2331. [Google Scholar] [CrossRef]
  46. Charnes, A.; Cooper, W.W.; Rhodes, E. Measuring the efficiency of decision making units. Eur. J. Oper. Res. 1978, 2, 429–444. [Google Scholar] [CrossRef]
  47. Coelli, T.J.; Rao, D.S.P.; O’Donnell, C.J.; Battese, G.E. An Introduction to Efficiency and Productivity Analysis, 2nd ed.; Springer: New York, NY, USA, 2005. [Google Scholar] [CrossRef]
  48. Seiford, L.M.; Thrall, R.M. Recent developments in DEA: The mathematical programming approach to frontier analysis. J. Econ. 1990, 46, 7–38. [Google Scholar] [CrossRef]
  49. Liu, J.S.; Lu, L.Y.; Lu, W.M.; Lin, B.J. A survey of DEA applications. Omega 2013, 41, 893–902. [Google Scholar] [CrossRef]
  50. Resti, A. Efficiency measurement for multi-product industries: A comparison of classic and recent techniques based on simulated data. Eur. J. Oper. Res. 2000, 121, 559–578. [Google Scholar] [CrossRef]
  51. Zhang, T. Decomposing allocative efficiency for multi-product production systems. EM Ekon. Manag. 2010, 13, 71–77. [Google Scholar]
  52. Hosseinzadeh-Bandbafha, H.; Safarzadeh, D.; Ahmadi, E.; Nabavi-Pelesaraei, A. Optimization of energy consumption of dairy farms using data envelopment analysis—A case study: Qazvin city of Iran. J. Saudi Soc. Agric. Sci. 2018, 17, 217–228. [Google Scholar] [CrossRef] [Green Version]
  53. Stolpe, N. Descripciones de los principales suelos de la VIII Región de Chile. In Publicaciones Departamento de Suelos y Recursos Naturales; Universidad de Concepción: Chillán, Chile, 2006. [Google Scholar]
  54. Del Pozo, A.; del Canto, P. Áreas agroclimáticas y sistemas productivos en la VII y VIII Regiones. In Serie Quilamapu N◦ 113; INIA Quilamapu: Chillán, Chile, 1999. [Google Scholar]
  55. Klute, A. Water Retention: Laboratory Methods. Methods of Soil Analysis Part. 5-Mineralogical Methods; American Society of Agronomy, Inc.: Madison, WI, USA; Soil Science Society of America, Inc.: Madison, WI, USA, 1986; pp. 635–662. [Google Scholar] [CrossRef]
  56. Fischer, S.; Wilckens, R.; Jara, J.; Aranda, M. Variation in antioxidant capacity of quinoa (Chenopodium quinoa Willd) subjected to drought stress. Ind. Crop Prod. 2013, 46, 341–349. [Google Scholar] [CrossRef]
  57. Valdivia-Cea, W.; Bustamante, L.; Jara, J.; Fischer, S.; Holzapfel, E.; Wilckens, R. Effect of soil water availability on physiological parameters, yield, and seed quality in four quinoa genotypes (Chenopodium quinoa Willd.). Agronomy 2021, 11, 1012. [Google Scholar] [CrossRef]
  58. Berti, M.T.; Serri, H.; Wilckens, R.; Urbina, A.; Figueroa, I. Determination of physiological maturity and optimal harvest date in quinoa (Chenopodium quinoa Willd.). Agro Cienc. 1997, 13, 135–141. [Google Scholar]
  59. AOAC International. Official Methods of Analysis, 20th ed.; AOAC International: Rockville, MD, USA, 2016; Available online: www.aoac.org (accessed on 1 June 2021).
  60. Fujihara, S.; Sasaki, H.; Aoyagi, Y.; Sugahara, T. Nitrogen-to-protein conversion factors for some cereal products in Japan. J. Food Sci. 2008, 73, 204–209. [Google Scholar] [CrossRef] [PubMed]
  61. Stegemann, H.; Pietsch, G. Methods for characterization of the seed proteins in cereals and legumes. In Seed Proteins; Gottschalk, W., Müller, H.P., Eds.; Springer: Dordrecht, The Netherlands, 1983; pp. 45–75. [Google Scholar] [CrossRef]
  62. Wilckens, R.; Hevia, F.; Tapia, M.; Albarrán, R. Caracterización de dos genotipos de quinoa (Chenopodium quinoa Willd) chilena. I. Electroforesis de proteínas de semilla. Agro Cienc. 1996, 12, 51–56. [Google Scholar]
  63. Tone, K. A slacks-based measure of efficiency in data envelopment analysis. Eur. J. Oper. Res. 2011, 130, 498–509. [Google Scholar] [CrossRef] [Green Version]
  64. SAS Institute. SAS User´s Guide: Statististics; SAS Institute: Cary, NC, USA, 2014. [Google Scholar]
  65. Curti, R.N.; de la Vega, A.J.; Andrade, A.J.; Bramardi, S.J.; Bertero, H.D. Multi-environmental evaluation for grain yield and its physiological determinants of quinoa genotypes across Northwest Argentina. Field Crop Res. 2014, 166, 46–57. [Google Scholar] [CrossRef]
  66. Rezaei, E.E.; Webber, H.; Gaiser, T.; Naab, J.; Ewert, F. Heat stress in cereals: Mechanisms and modelling. Eur. J. Agron. 2015, 64, 98–113. [Google Scholar] [CrossRef]
  67. Deng, N.; Ling, X.; Sun, Y.; Zhang, C.; Fahad, S.; Peng, S.; Huang, J. Influence of temperature and solar radiation on grain yield and quality in irrigated rice system. Eur. J. Agron. 2015, 64, 37–46. [Google Scholar] [CrossRef]
  68. Farooq, M.; Bramley, H.; Palta, J.A.; Siddique, K.H. Heat stress in wheat during reproductive and grain-filling phases. Crit. Rev. Plant Sci. 2011, 30, 491–507. [Google Scholar] [CrossRef]
  69. Matías, J.; Cruz, V.; Reguera, M. Heat stress impact on yield and composition of quinoa straw under Mediterranean field conditions. Plants 2021, 10, 955. [Google Scholar] [CrossRef]
  70. Manaa, A.; Goussi, R.; Derbali, W.; Cantamessa, S.; Essemine, J.; Barbato, R. Photosynthetic performance of quinoa (Chenopodium quinoa Willd.) after exposure to a gradual drought stress followed by a recovery period. Bioch. Biophys. Acta Bioenerg. 2021, 1862, 148383. [Google Scholar] [CrossRef]
  71. Hirich, A.; Allah, R.C.; Jacobsen, S.E.; El Youssfi, L.; El Homaria, H. Using deficit irrigation with treated wastewater in the production of quinoa (Chenopodium quinoa Willd.) in Morocco. Rev. Científica UDO Agrícola 2012, 12, 570–583. [Google Scholar]
  72. García, M.; Raes, D.; Jacobsen, S.E. Evapotranspiration analysis and irrigation requirements of quinoa (Chenopodium quinoa) in the Bolivian highlands. Agric. Water Manag. 2003, 60, 119–134. [Google Scholar] [CrossRef]
  73. Killi, D.; Haworth, M. Diffusive and metabolic constraints to photosynthesis in quinoa during drought and salt stress. Plants 2017, 6, 49. [Google Scholar] [CrossRef] [PubMed] [Green Version]
  74. Winkel, T.; Méthy, M.; Thenot, F. Radiation use efficiency, chlorophyll fluorescence, and reflectance indices associated with ontogenic changes in water-limited Chenopodium quinoa leaves. Photosynthesis 2002, 40, 227–232. [Google Scholar] [CrossRef]
  75. Hinojosa, L.; González, J.; Barrios-Masias, F.; Fuentes, F.; Murphy, K. Quinoa abiotic stress responses: A review. Plants 2018, 7, 106. [Google Scholar] [CrossRef] [PubMed] [Green Version]
  76. Naz, H.; Akram, N.A.; Kong, H. Assessment of secondary metabolism involvement in water stress tolerance of quinoa (Chenopodium quinoa Willd.) Subjected to varying water regimes. Pak. J. Bot. 2020, 52, 1553–1559. [Google Scholar] [CrossRef]
  77. Miranda, M.; Vega-Gálvez, A.; Quispe-Fuentes, I.; Rodríguez, M.J.; Maureira, H.; Martínez, E.A. Nutritional aspects of six quinoa (Chenopodium quinoa Willd.) ecotypes from three geographical areas of Chile. Chil. J. Agric. Res. 2012, 72, 175. [Google Scholar] [CrossRef] [Green Version]
  78. Föste, M.; Elgeti, D.; Brunner, A.K.; Jekle, M.; Becker, T. Isolation of quinoa protein by milling fractionation and solvent extraction. Food Bioprod. Process. 2015, 96, 20–26. [Google Scholar] [CrossRef]
  79. Filho, A.M.M.; Pirozi, M.R.; Borges, J.T.D.S.; Pinheiro Sant’Ana, H.M.; Chaves, J.B.P.; Coimbra, J.S.D.R. Quinoa: Nutritional, functional, and antinutritional aspects. Crit. Rev. Food Sci. Nutr. 2017, 57, 1618–1630. [Google Scholar] [CrossRef]
  80. Bazile, D.; Jacobsen, S.-E.; Verniau, A. The global expansion of quinoa: Trends and limits. Front. Plant Sci. 2014, 7, 622. [Google Scholar] [CrossRef] [Green Version]
  81. Bascuñán-Godoy, L.; Reguera, M.; Abdel-Tawab, Y.M.; Blumwald, E. Water deficit stress-induced changes in carbon and nitrogen partitioning in Chenopodium quinoa Willd. Planta 2016, 243, 591–603. [Google Scholar] [CrossRef] [PubMed]
  82. Wang, Y.; Xu, H.; Zhu, H.; Tao, Y.; Zhang, G.; Zhang, L.; Ma, Z. Classification and expression diversification of wheat dehydrin genes. Plant Sci. 2014, 214, 113–120. [Google Scholar] [CrossRef] [PubMed]
  83. Gambín, B.L.; Borrás, L. Resource distribution and the trade-off between seed number and seed weight: A comparison across crop species. Ann. Appl. Biol. 2010, 156, 91–102. [Google Scholar] [CrossRef]
  84. Li, P.; Chen, J.; Wu, P. Agronomic characteristics and grain yield of 30 spring wheat genotypes under drought stress and non stress conditions. Agron. J. 2011, 103, 1619–1628. [Google Scholar] [CrossRef] [Green Version]
  85. Lindeboom, N. Studies on the Characterization, Biosynthesis and Isolation of Starch and Protein from Quinoa (Chenopodium quinoa Willd.). Ph.D. Thesis, College of Graduate Studies and Research, University of Saskatchewan, Saskatoon, SK, Canada, 2005. [Google Scholar]
  86. Vilcacundo, R.; Martínez-Villaluenga, C.; Hernández-Ledesma, B. Release of dipeptidyl peptidase IV, α-amylase and α-glucosidase inhibitory peptides from quinoa (Chenopodium quinoa Willd.) during in vitro simulated gastrointestinal digestion. J. Funct. Foods 2017, 35, 531–539. [Google Scholar] [CrossRef] [Green Version]
  87. Burrieza, H.P.; Rizzo, A.J.; Vale, E.M.; Silveira, V.; Maldonado, S. Shotgun proteomic analysis of quinoa seeds reveals novel lysine-rich seed storage globulins. Food Chem. 2019, 293, 299–306. [Google Scholar] [CrossRef] [PubMed]
  88. Sathe, S.; Hamaker, B.; Szetao, K.; Venkatachalam, M. Isolation, purification, and biochemical characterization of a novel water soluble protein from Inca peanut (Plukenetia volubilis L.). J. Agric. Food Chem. 2002, 50, 4906–4908. [Google Scholar] [CrossRef]
  89. Aranda-Olmedo, I.; Ruiz, R.; Peinado, M.; Rubio, L. A pea (Pisum sativum L.) seed albumin extract prevents colonic DSS induced dysbiosis in mice. J. Funct. Foods. 2017, 35, 279–294. [Google Scholar] [CrossRef]
  90. Campos, D.C.; Costa, A.S.; Luz, P.B.; Soares, P.M.; Alencar, N.M.; Oliveira, H.D. Morinda citrifolia lipid transfer protein 1 exhibits anti-inflammatory activity by modulation of pro- and anti-inflammatory cytokines. Int. J. Biol. Macromol. 2017, 103, 1121–1129. [Google Scholar] [CrossRef]
  91. Nadaud, I.; Tasleem-Tahir, A.; Chateigner-Boutin, A.L.; Chambon, C.; Viala, D.; Branlard, G. Proteome evolution of wheat (Triticum aestivum L.) aleurone layer at fifteen stages of grain development. J. Proteom. 2015, 123, 29–41. [Google Scholar] [CrossRef]
  92. Triboï, E.; Martre, P.; Triboï-Blondel, A.M. Environmentally-induced changes in protein composition in developing grains of wheat are related to changes in total protein content. J. Exp. Bot. 2003, 54, 1731–1742. [Google Scholar] [CrossRef] [PubMed]
  93. Ramírez, C.V.; Guerrero, G.R.; Piedras, J.J.G. Respuesta morfoagronómica y calidad en proteína de tres accesiones de quinua (Chenopodium quinoa Willd.) en la sabana norte de Bogotá. Rev. UDCA Actual. Divulg. Científica 2016, 19, 325–332. [Google Scholar] [CrossRef] [Green Version]
  94. Monteil, V.; Kwon, H.; Prado, P.; Hagelkrüys, A.; Wimmer, R.A.; Stahl, M.; Penninger, J.M. Inhibition of SARS-CoV-2 infections in engineered human tissues using clinical-grade soluble human ACE2. Cell 2020, 181, 905–913. [Google Scholar] [CrossRef]
  95. Rangaswamy, A.N.; Ashok, A.; Hanumanthappa, P.; Chandrashekaramurthy, A.S.; Kumbaiah, M.; Hiregouda, P.; Sosalegowda, A.H. Identification of potential peptide inhibitors of ACE-2 target of SARS-CoV-2 from buckwheat and quinoa. Int. J. Pept. Res. Ther. 2021, 27, 799–813. [Google Scholar] [CrossRef] [PubMed]
  96. Brinegar, C.; Goundan, S. Isolation and characterization of chenopodin, the 11S seed storage protein of quinoa (Chenopodium quinoa). J. Agric. Food Chem. 1993, 41, 182–185. [Google Scholar] [CrossRef]
  97. Brinegar, C.; Sine, B.; Nwokocha, L. High-cysteine 2S seed storage proteins from quinoa (Chenopodium quinoa). J. Agric. Food Chem. 1996, 44, 1621–1623. [Google Scholar] [CrossRef]
  98. Liu, J.; Wang, R.; Liu, W.; Zhang, H.; Guo, Y.; Wen, R. Genome-wide characterization of heat-shock protein 70S from Chenopodium quinoa and expression analyses of Cqhsp70s in response to drought stress. Genes 2018, 9, 35. [Google Scholar] [CrossRef] [Green Version]
Figure 1. Daily rainfall (PP), maximum and minimum temperature (T° Max, T° Min) at experimental station “El Nogal” in Chillán, Chile.
Agriculture 11 01089 g001
Figure 2. Seed yield and total protein content in four quinoa genotypes subjected to different water deficit conditions. Different lowercase letters indicate significant difference between water deficit conditions (p ≤ 0.05). Different capital letters are significant difference between genotype (p ≤ 0.05).
Agriculture 11 01089 g002
Figure 3. Globulin (Globu) and albumin (Album) yield in quinoa seeds subjected to different water deficit conditions in the 2014/2015 and 2015/2016 seasons. Different lowercase letters indicate significant difference between water deficit conditions (p ≤ 0.05). Different capital letters are significant difference between genotype (p ≤ 0.05).
Agriculture 11 01089 g003
Figure 4. Average technical efficiency in seed yield in quinoa genotypes subjected to different water deficit conditions in 2014/2015 and 2015/2016 seasons.
Agriculture 11 01089 g004
Figure 5. Average technical efficiency in globulin production in quinoa genotypes subjected to different water deficit conditions in 2014/2015 and 2015/2016 seasons.
Agriculture 11 01089 g005
Figure 6. Average technical efficiency in albumin production in quinoa genotypes subjected to different water deficit conditions in the 2014/2015 and 2015/2016 seasons.
Agriculture 11 01089 g006aAgriculture 11 01089 g006b
Figure 7. Average technical efficiency in multiproduct in quinoa genotypes subjected to different water deficit conditions in the 2014/2015 and 2015/2016 seasons.
Agriculture 11 01089 g007
Table 1. Initial soil analysis for experimental sites in Chillán, Ñuble, Chile in the 2014 to 2015 and 2015 to 2016 growing season.
SeasonpHOM
g kg−1
Pm
g kg−1
Km
g kg−1
NO3-N
mg kg−1
2014–20156.66.239.5398.621.8
2015–20166.66.236.2378.419.5
OM = Organic matter.
Table 2. Mean square values for seed yield, protein, globulins, and albumins for the analysis of variance in seasons 2014/2015 and 2015/2016.
Source of VariationdfSeed YieldTotal ProteinGlobulinAlbumin
2014/2015
Rep3146,9893.55.11.8
AW46,506,713309.871.1 *77.2
AWx Rep12214,41889.54.91.6
Genotype31,969,361440.4 *30.2 *19.8
Genotype × AW12367,172 *141.97.06.9 *
Error45130,44991.94.42.4
CV, % 247.1543.833.2
2015/2016
Rep3367,93111.32.37.2
AW41,675,102 *103.916.1 *9.8 *
AWx Rep12308,87475.53.82.4
Genotype34,195,026 *83.822.9 *4.4 *
Genotype × AW12144,26230.41.11.6
Error 164,94648.61.51.5
CV, % 146.421.938.9
* = Significant difference (p ≤ 0.05); available water = AW.
Table 3. Summary of average technical efficiencies under no-irrigation and 20% AW in the 2014/2015 and 2015/2016 seasons.
Available Water (AW)RegalonaAG 2010CahuilMoradoTotal Average
2014/2015
Seed yield efficiency (%)
No irrigation33.5 ± 10.529.9 ± 12.448.7 ± 22.424.6 ± 6.434.2 ± 15.7
2044.6 ± 21.240.8 ± 1.172.2 ± 20.922.4 ± 9.345.0 ± 23.1
Globulin production efficiency (%)
No irrigation24.4 ± 8.922.5 ± 4.039.4 ± 26.419.7 ± 7.826.5 ± 15.3
2051.2 ± 35.831.3 ± 11.050.0 ± 19.414.3 ± 6.936.7 ± 24.7
Albumin production efficiency (%)
No irrigation28.4 ± 8.830.1 ± 14.645.1 ± 24.025.3 ± 8.332.2 ± 15.8
2051.1 ± 20.834.9 ± 4.167.5 ± 22.319.0 ± 8.143.1 ± 23.5
Multiproducts efficiency (%)
No irrigation34.7 ± 10.933.0 ± 12.552.5 ± 26.729.0 ± 8.537.3 ± 17.3
2059.6 ± 29.843.7 ± 4.873.8 ± 19.122.4 ± 9.349.9 ± 25.7
2015/2016
Seed yield efficiency (%)
No irrigation78.6 ± 6.857.6 ± 2.984.6 ± 15.881.0 ± 14.875.4 ± 14.9
2026.2 ± 5.222.6 ± 6.432.6 ± 4.932.2 ± 5.128.4 ± 6.5
Globulin production efficiency (%)
No irrigation62.4 ± 7.143.6 ± 11.674.1 ± 23.267.9 ± 12.762.0 ± 17.8
2026.2 ± 7.123.4 ± 3.335.2 ± 5.737.7 ± 8.930.6 ± 8.5
Albumin production efficiency (%)
No irrigation63.2 ± 34.944.5 ± 20.140.1 ± 22.279.4 ± 16.956.8 ± 27.2
2032.2 ± 14.617.7 ± 9.632.4 ± 10.521.3 ± 14.625.9 ± 13.1
Multiproducts efficiency (%)
No irrigation83.0 ± 12.460.6 ± 4.088.2 ± 13.990.7 ± 12.380.6 ± 15.9
2028.4 ± 6.222.8 ± 6.334.6 ± 3.132.9 ± 4.929.7 ± 6.7
Publisher’s Note: MDPI stays neutral with regard to jurisdictional claims in published maps and institutional affiliations.

