Article

Affordable Use of Satellite Imagery in Agriculture and Development Projects: Assessing the Spatial Distribution of Invasive Weeds in the UNESCO-Protected Areas of Cuba

1
Faculty of Experimental Sciences, University of Huelva, Av. de las Fuerzas Armadas, S/N, 21071 Huelva, Spain
2
Departamento Ciencias Agroforestales, Escuela Tecnica Superior de Ingenieria, Universidad de Huelva, Av. de las Fuerzas Armadas, S/N, 21071 Huelva, Spain
3
Departamento de Agronomia, Facultad de Ciencias Agropecuarias, Universidad de Sancti Spiritus “Jose Marti”, Av. de los Martires, 360, Sancti Spiritus, Cuba
4
Institute of Geography, National Autonomous University of Mexico, Circuito de la Investigacion Cientifica, Ciudad Universitaria, Ciudad de Mexico 04510, Mexico
*
Author to whom correspondence should be addressed.
Agriculture 2021, 11(11), 1057; https://doi.org/10.3390/agriculture11111057
Submission received: 29 September 2021 / Revised: 24 October 2021 / Accepted: 25 October 2021 / Published: 28 October 2021

Abstract

:
The effective and regular remote monitoring of agricultural activity is not always possible in developing countries because the access to cloud-based geospatial analysis platforms or expensive high-resolution satellite images are not always available. Herein, using paid high-resolution satellite images first and then free medium-resolution satellite images, we aimed to develop a cost-free, affordable method for regularly mapping the spatial distribution of sicklebush (Dichrostachys cinerea), an archetypal allochthonous invasive plant in Cuba that is becoming impossible to control owing to its rapid growth in areas planted with sugar cane in the Trinidad-Valle de los Ingenios area (Cuba), a UNESCO World Heritage Site. Two types of images were used (WorldView-2 and Landsat-8); these were subjected to supervised classification, with accuracy values of 88.7% and 93.7%, respectively. Vegetation cover was first derived from the purchased WorldView-2 image, and this information was then used as the training field to obtain spectral signatures from the Landsat-8 free image so that Landsat images may be regularly used to monitor D. cinerea infestations. The results obtained in the spatial distribution map for sicklebush in the Landsat-8 images had an overall reliability of 93.7% and a Kappa coefficient reliability of 91.9%. These values indicate high confidence in the results, which suggests that sicklebush has invaded 52.7% of the total 46,807.26-ha area of the Trinidad-Valle de los Ingenios. This process proved extremely effective and demonstrated the benefits of using high-resolution spatial images from which information can be transferred to free satellite images with a larger pixel size.

1. Introduction

The sicklebush (Dichrostachys cinerea L. Wight & Arn.), also known as marabou and bell mimosa, is a semi-deciduous to deciduous tree with an open crown that can reach a height of 7 m. It is characterised by bark with green young branches, greyish dark-brown older branches, and stems with longitudinal fissures and strong, smooth, and slightly recurvate thorns to 8-cm long, which grow at nearly right angles from the branches and can support leaves at the base (ECOCROP, accessed on 4 November 2020). This species belongs to the Fabaceae family (subfamily Mimosaceae) and is originally from South Africa. However, in Cuba, it has become an allochthonous invasive plant that is extremely difficult to control. Its tolerance to stress, abundant thorns, resistance to cutting and burning, hardness of its stems, dispersal of seeds by livestock, and high capacity to re-sprout when not fully eliminated make its control so laborious and costly that invaded land is frequently abandoned. Many protected natural and semi-natural areas in Cuba have been completely infested by sicklebush, leading to the destruction of native plant communities [1]. The Valle de Los Ingenios and Villa de la Santisima Trinidad, Cuba, which was designated as a World Heritage Site by UNESCO in 1988, is an example of the severity of the problem [2]. The on-site evaluation of the extension of this plague is very challenging because access to marabou thickets is barely impossible due to the bush encroachment, which presents abundant long, hard thorns.
With the development of aerospace technologies and geospatial analysis, it is now possible to remotely monitor vegetation cover using satellite imagery [3,4]. Image processing using techniques such as digital classification obtains information from satellite imagery using digital levels (DLs) or reflectance. Digital image classification is a technique that allows pixels to be grouped in an image based on their values and to match them to specific land-cover types to generate maps and inventories [5]. The classification process can be considered as a form of pattern recognition involving the identification of patterns associated with the position of each pixel, depending on the characteristics present at the land surface [6,7]. Two classification methods are distinguished according to the way the training statistics are obtained, namely supervised and unsupervised classification [8]. The supervised classification used here is based on the prior knowledge of the terrain. The process allows the user to delimit representative areas for each category of interest. Pixels in the selected areas are then used to assign the remaining pixels to each category according to the similarity of their reflectivity or DL values. The input data provided by the user can be obtained from fieldwork, photo interpretation, articles, or maps of the area of interest [6]. According to I et al. [8], the following stages can be distinguished in digital image classification: (i) the training stage, where the categories of interest are digitally defined; (ii) the assignment stage, where the image pixels are grouped into one of the categories; and (iii) the checking stage, where the results are verified.
These remote monitoring techniques are of special interest in cooperation/development agriculture projects in developing countries, such as Cuba. In these countries, access to the desired zones is not always possible or granted; therefore, cheap, regular remote monitoring would be an invaluable tool for both international cooperation agencies and local authorities [9]. Unfortunately, neither the access to cloud-based geospatial analysis platforms nor the regular stream of costly high-resolution satellite images needed for such consistent analysis are always available or affordable for local authorities, so the desired technology transfer between international agencies and local institutions is impaired. As an initial stage for different scientific and agronomic analyses, the quantitative description of spatial patterns of plant species [10] has improved and accelerated in recent years with the development of new geographic information technologies, such as remote sensing [11,12]. These technologies, using medium- and high-resolution satellite imagery, have already demonstrated a strong capacity for mapping global forest alliances or similar detailed floristic associations [13,14]. The development of an analytical tool capable of remotely quantifying the degree of sicklebush infestation in wide areas using free, medium-resolution, satellite images would be of great interest when evaluating the problem of sicklebush in Cuba, as the only published study addressing the dispersion of marabou in Cuba does not describe any of the methodologies used [15]. Therefore, the objective of the present study was to develop a cost-free, easy-to-use tool to regularly map the spatial distribution of sicklebush using high-resolution, paid-for images first and then use this information as the training field to obtain spectral signatures from free, medium-resolution free images to gain insight into the spatial extent and location of its infestation over time using the Trinidad-Valle de los Ingenios UNESCO-Protected area as an experimental model.

2. Materials and Methods

2.1. Study Area

The World Heritage Site of Valle de los Ingenios and the city of Trinidad is a UNESCO-protected area in the province of Sancti Spiritus, which covers two of the region’s most important historic, touristic, and economic sites (Figure 1). The municipality of Trinidad comprises the city of Trinidad, located in central-southern Cuba, 450 km from Havana, the Valle de los Ingenios (north-east of Trinidad), and part of the Escambray Sierra (northeast and west of the Valle de los Ingenios), the third highest mountainous system in Cuba [16]. This area has a humid subtropical climate with two well-defined seasons. The dry season occurs in winter (November to April), and the wet season occurs in summer (May to October). The average summer and winter temperatures are 27 °C and 20 °C, respectively, with an average relative humidity of 80% and an annual rainfall of 1300 mm [17].

2.2. Data

A multispectral 8-band WorldView-2 image with 1.84 m resolution, captured on 20 January 2014 in cloud-free conditions (processing level: Ortho-ready standard), and a Landsat-8 image with 30 m resolution, captured on 1 April 2014 with a cloud cover of 3.76% and Level-1T processing (standard terrain correction), were obtained for the study region. Both images were obtained from the United States Geological Survey Global Visualisation Viewer Available online: http://glovis.usgs.gov/ (accessed on 4 December 2020).

2.3. Supervised Classification of WorldView-2 Image

There are two general approaches to image classification: supervised and unsupervised. They differ in how the classification is performed. In the case of supervised classification, the software system delineates specific landcover types based on statistical characterization data drawn from known examples in the image (known as training sites). With unsupervised classification, however, clustering software is used to uncover the commonly occurring landcover types, with the analyst providing interpretations of those cover types at a later stage.
Compared with the middle and low-resolution satellite images, the high-resolution satellite images have richer spatial but less spectral information. Previous studies have shown that the conventional pixel-based statistical methods cannot obtain very satisfying results [18]. Therefore, we used an object-oriented classification for the high-resolution satellite image. The WorldView-2 image was first segmented using eCognition software, which subdivides the image into separate regions. We used a multi-threshold segmentation procedure based on homogeneity and heterogeneity criteria in colour and shape parameters (0.8 and 0.2, respectively) and smoothness and compaction parameters (0.5 and 0.5, respectively) (Appendix A, Figure A1). However, several attempts were needed to determine the scale parameter (20 m) that was able to achieve the best fit for identifying the limits of ground-cover types.
The image was processed using Erdas Imagine software, within which a three-consecutive-stage supervised classification was conducted. In the first stage, the training stage [19], sample points and areas obtained on-site and, with the help of visual interpretation with Google Earth, were used to select regions that represented the different vegetation and land-use types and to build a working classification, as shown in Table 1. Despite being a cloud-free image, dark-tone regions were identified across the whole image, matching those associated with tree shadows, which likely reflected the time the image was taken. Therefore, a spectral signature was added to this specific category.
The training sites were digitised using the segmented image as a baseline, and spectral signatures were obtained for use in the following stage. In total, there were 389 training fields, from which 19 signatures were acquired for different vegetation types. After the spectral signatures were obtained, they were assessed using the transformed divergence separability method [20], in which index values over 1900 could be confidently distinguished, values between 1700 and 1900 indicated fair separation, and values below 1700 indicated poor separation. Signatures containing values below 1800 were eliminated to produce new spectral signatures at different training sites [21].
In the second stage, the assignment stage, and once the land-cover types were classified and their signatures derived, each pixel was analysed independently during the assignment or data classification stage. For this, pixels were classified using the maximum likelihood algorithm as the parametric rule and the parallelepiped algorithm as the non-parametric rule [22].
In the third and last stage, the accuracy assessment stage, the subsequent supervised classification was evaluated to assess accuracy using the “Accuracy Assessment” Erdas imaging in-built tool, which allowed comparison of certain pixels in the classified image with baseline data, for which real classes were known from field sampling. This tool provides an error matrix, accuracy percentage values, and Kappa coefficients [23]. The size of the samples, which were subsets of the field sampling, was 257 pixels in the WorldView-2 image and 240 pixels in the Landsat-8 image, which were distributed randomly as established by Congalton [23] and the Spiegel and Stephens [24] simplified formula for population estimation.

2.4. Supervised Classification of Landsat-8 Image

The land-cover categories obtained from the WorldView-2 image were exported as polygons, and those with an area less than 900 m2 were eliminated to match the 30-m pixel size of the Landsat-8 image. Before processing the Landsat-8 image, several corrections were made to eliminate radiometry anomalies using ENVI 5.1 software; radiometric and atmospheric corrections were applied involving the transformation of digital levels to radiance and reflectance. The atmospheric correction used in this study was based on the Fast Line of Sight Atmospheric Analysis of Hypercubes (FLAASH) method. This method corrects visible wavelengths to near-infrared (NIR) and short-wave regions to 3 µm (Exelis Visual Information Solutions, 2015). The specific parameters used in the correction were as follows: central scene location, Lat = 21°39′58.01″, Lon = −79°54′47.91″; sensor type = Landsat-8 OLI; sensor altitude = 705.00 km; pixel size = 30 m; flight date = 1 April 2014; flight time = 15:45:15; atmospheric model = tropical; aerosol model = rural; aerosol retrieval = 2-Band (K-T); and initial visibility = 30 m.
Once the corrected image was obtained, it was cropped to the WorldView-2 image and then to an area covering the Trinidad-Valle de los Ingenios. The methodology used in the classification was repeated for the first cropped image (excluding the training stage), from which spectral signatures were acquired using the WorldView-2 classifications as training fields. The number of classes were reduced to those that could be differentiated with Landsat-8 since the ability to discriminate features compared to WorldView-2 is lower (spatial resolution of 30 m versus 1.85 m). The spectral signatures for the land-use and vegetation categories shown in Table 2 were thereby derived.
After the signatures of the different training fields were acquired, they were assessed, classified, and verified using the accuracy assessment tool to determine the reliability of the resulting sicklebush distribution in the Landsat-8 image. Once the classification was produced in the first cropped image, the entire study area was processed. This was performed based on the spectral signatures of the first cropped image, which had previously been validated. Therefore, the final sicklebush distribution information was obtained with a high degree of confidence.

3. Results and Discussion

3.1. WorldView-2 Image

To identify all vegetation cover types in the WorldView-2 image, both the segmentation and diversity of plant covers were considered. In total, 389 training fields were used for the 19 different spectral signatures to include the spectral variability of each class. The results for the digital levels in the different bands obtained from the training fields for each spectral signature are displayed in Figure 2. Greater separation of each signature can be seen in band 7 (NIR), which registers plant activity parameters and is sensitive to moisture. This explains why this part of the spectrum generates high reflectivity [25].
The sicklebush and sicklebush with aroma (Vachellia farnesiana) categories obtained an average digital level in the NIR band of 583.64 and 514.71, respectively. These values are below those for the other classes of vegetation and reflect differences in the properties of the leaves, canopy structure, and orientation. For example, the portion of radiation reflected in different parts of the spectrum (the reflectivity pattern) depends on a leaf’s pigmentation, density, and composition (cellular structure) as well as the quantity of water in its tissues [26]. As such, our adopted spectral classification approach was able to confidently distinguish sicklebush from other species.
After recording the training pixels for the different categories of each class, spectral signatures were assessed using the transformed divergence separability method (Table 3). This showed that with the sicklebush class as baseline, the classes with lower spectral distances were Acacia plantation (PA), mamoncillo, mango, other (MMO), and sicklebush and aroma (MA). The values obtained for these classes were 1723, 1805, and 1855, respectively. Based on these values, the AP class had poor separability, whereas the MYA and MMO classes had medium separability.
The poor separation in Acacia, sicklebush, and aroma classes can be explained by the similarity in the alternate pinnate leaves of these species, both paripinnate and imparipinnate, which is a common characteristic of the Fabaceae family [27]. This implies that the reflectivity of these leaves will share similarly high values, making it impossible to obtain a greater level of separation within these classes.
Following the assessment of the signatures, an assignment was performed to select the best classifier. The parallelepiped method left a large number of pixels unclassified for sicklebush, producing a highly fragmented thematic image with fairly extensive regions of pixels with no specific assignment. The minimum distance method also gave an erroneous classification of pixels, including those belonging to other categories, and as a result, classes could not be determined for a large number of isolated pixels. To address this issue, two classifiers were employed. First, the maximum likelihood classifier was applied as a parametric rule, and the parallelepiped classifier was applied as a non-parametric rule. These separated each of the vegetation and land-use categories by assigning each pixel with an established category so that none were left unclassified. This follows the results of Ayala and Menenti [22], which suggest that these classifiers perform the best, as measured using the performance index.
The spatial distribution of sicklebush is shown in red in Figure 3, showing a homogeneous distribution in combination with other types of vegetation. In areas where sicklebush was found, the canopy was almost entirely classified as sicklebush. This indicates a correct supervised classification. While juvenile sicklebush growth occurs in some areas, the corresponding spectral values could not be acquired because the training fields only included adult growth, which was more easily identified from the satellite images.
To validate the accuracy of the resulting classification, 257 pixels were randomly selected to calculate the reliability and degree of accuracy of each class using a confusion matrix (Table 4). The data in Table 4 represent the degree of association between the classified and baseline classes, yielding an overall accuracy of 88.7%. This exceeds the 85% value recommended by Anderson et al. [28]. For sicklebush, an accuracy of 94.7% was obtained. Of all the pixels in this category, 94.7% coincided with pixels classified by the applied algorithms, while the remaining pixels were classified as the aroma class. As previously stated, such misclassification likely resulted from the similar physiological characteristics of these two species of Fabaceae. The accuracy obtained by the Kappa coefficient was 87.4%, close to the perfect level of reliability according to the value classification for the coefficient, as discussed by Landis and Koch [29].
Visual inspection of the classification revealed salt-and-pepper noise for some cover types despite image segmentation and pixel grouping. This noise was unavoidable and is similar to the observations of Estoque [30], who used different classifiers. Salt-and-pepper noise is more apparent in the classifiers used in this study than in those based on objects from high-resolution spectral images. Consequently, we conclude that our classification did not give a higher overall reliability level, as some of the sample pixels were likely affected by this noise even when their surroundings were correctly classified, based on field observations.

3.2. Landsat-8 Image

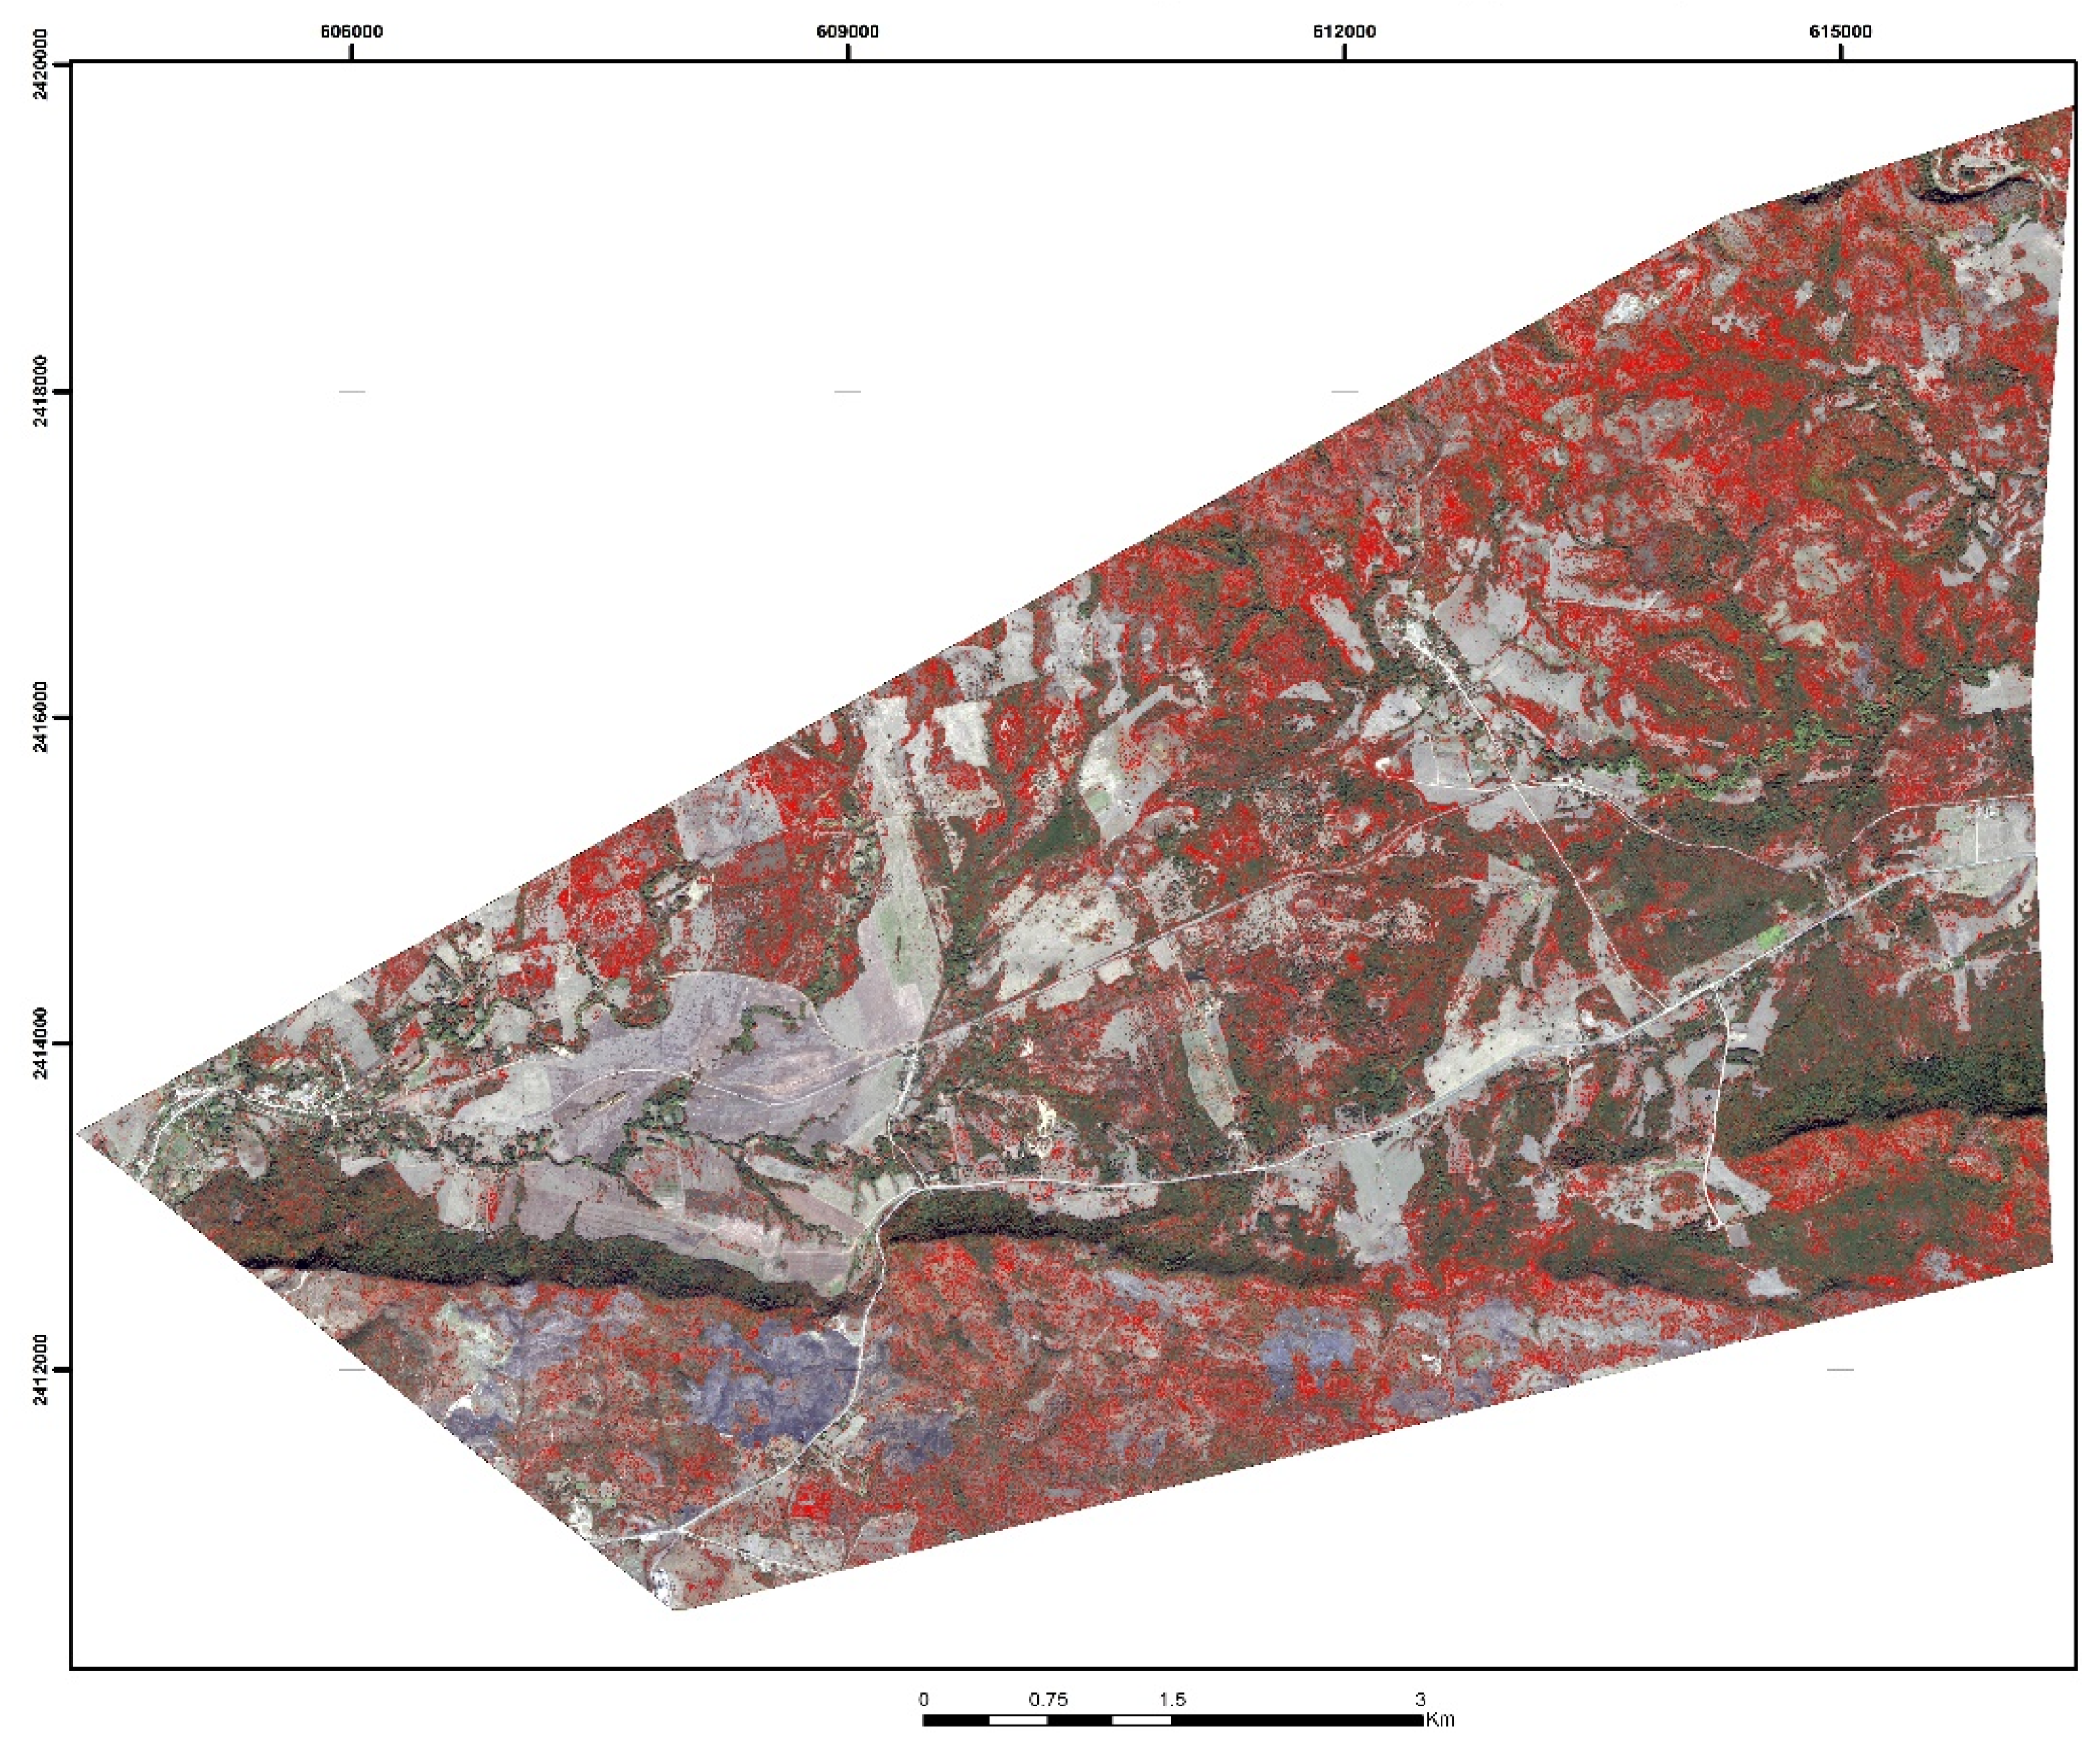
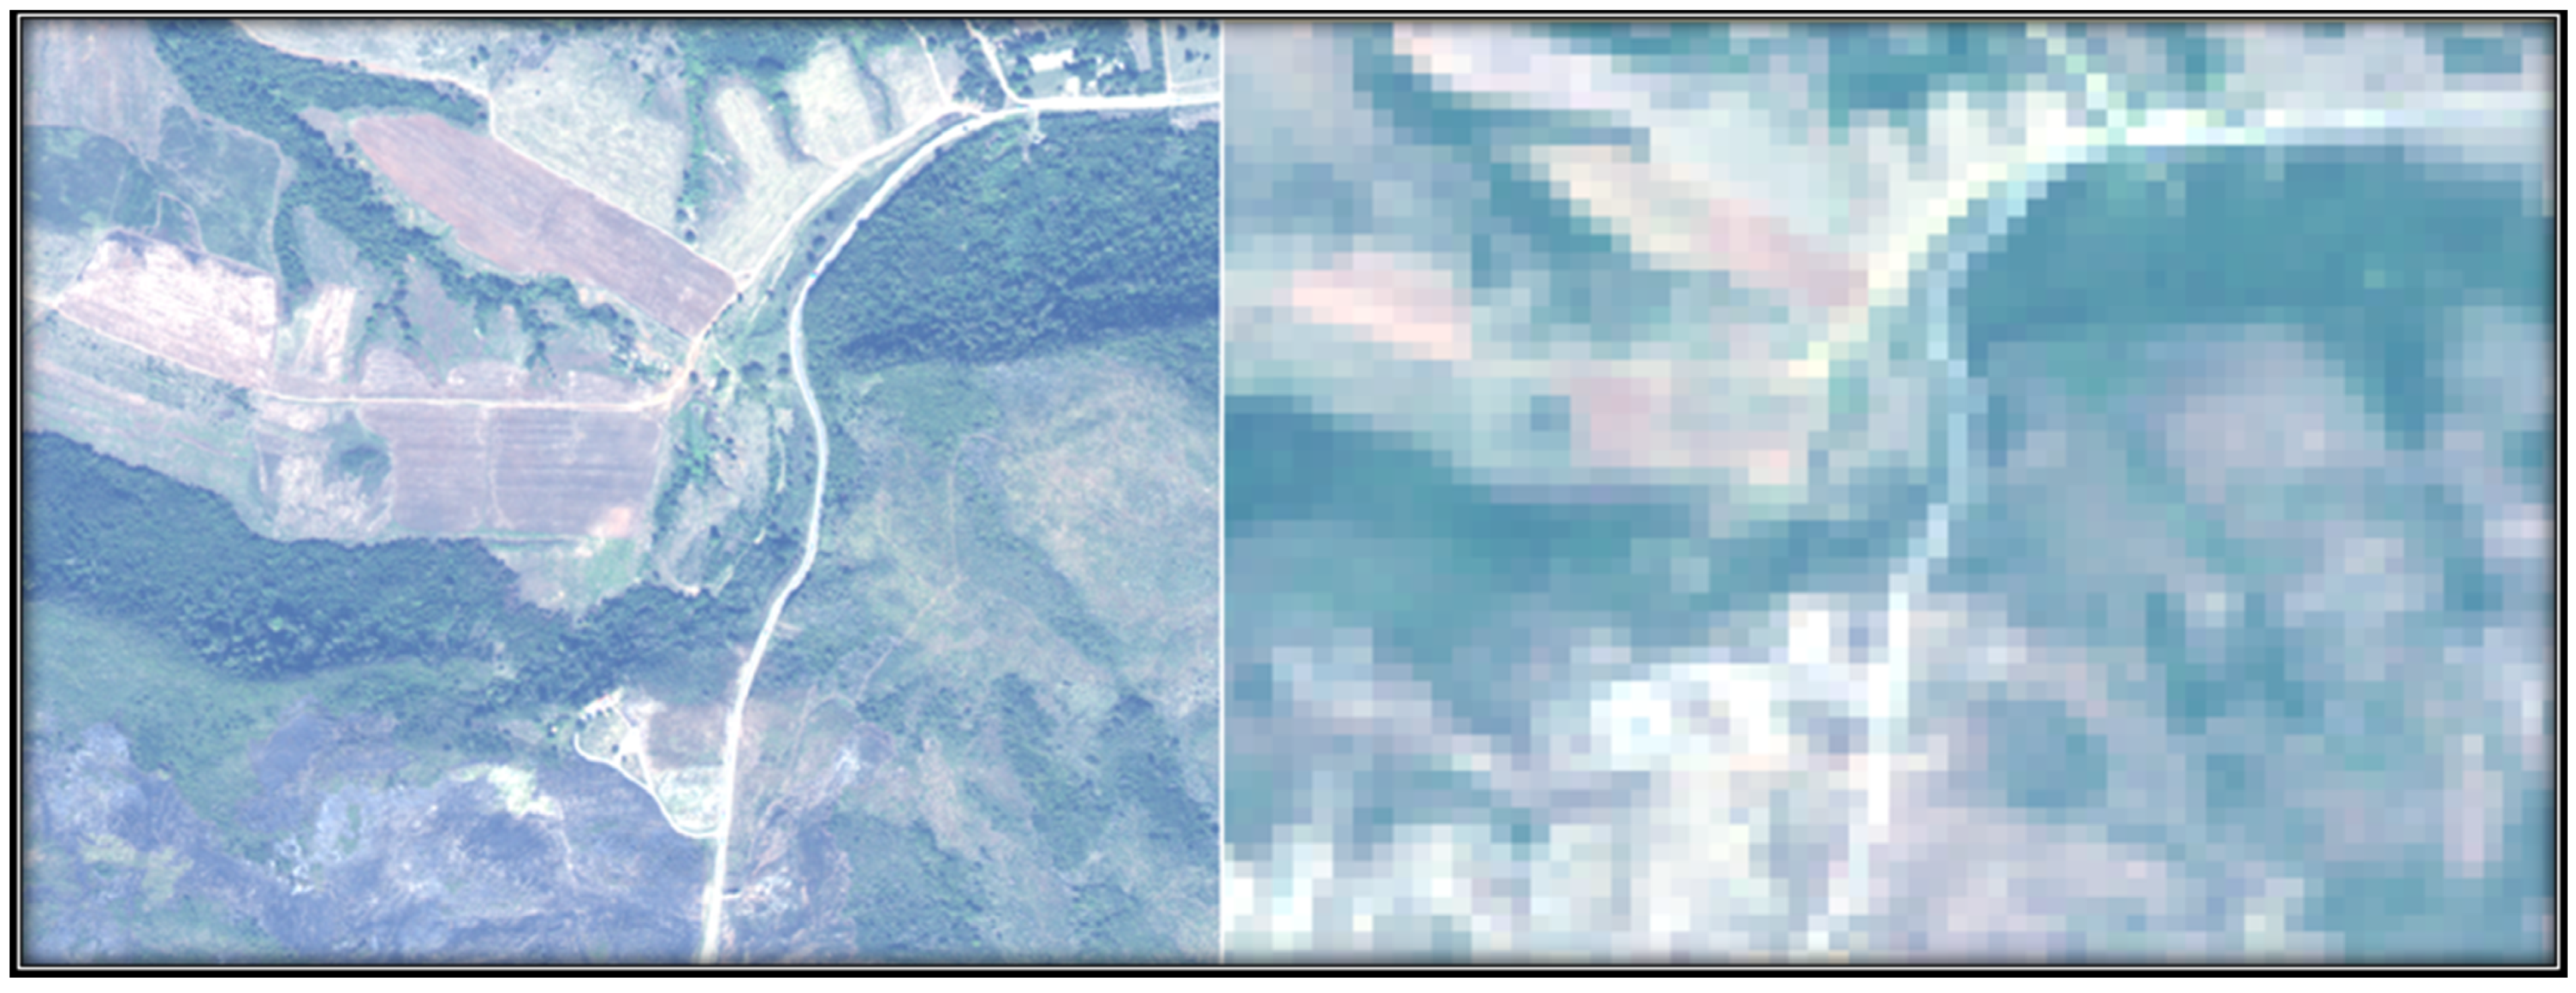
The Landsat-8 image was cropped to the size of the WorldView-2 image to use the previously acquired classifications as training fields to obtain spectral signatures for the different vegetation types. A working legend (Table 5) was established for different vegetation types and characteristics of the Landsat-8 image based on its ability to discriminate one object from another since the spatial resolution of the first classified image was 0.5 m, that is, the size of the pixel, and the Landsat-8 image had a spatial resolution of 30 m (Appendix A, Figure A2). Therefore, the number of classes or vegetation types was reduced to those that could be differentiated. Thus, 70 training fields were obtained for the 10 different spectral signatures to account for the spectral variability of each class.
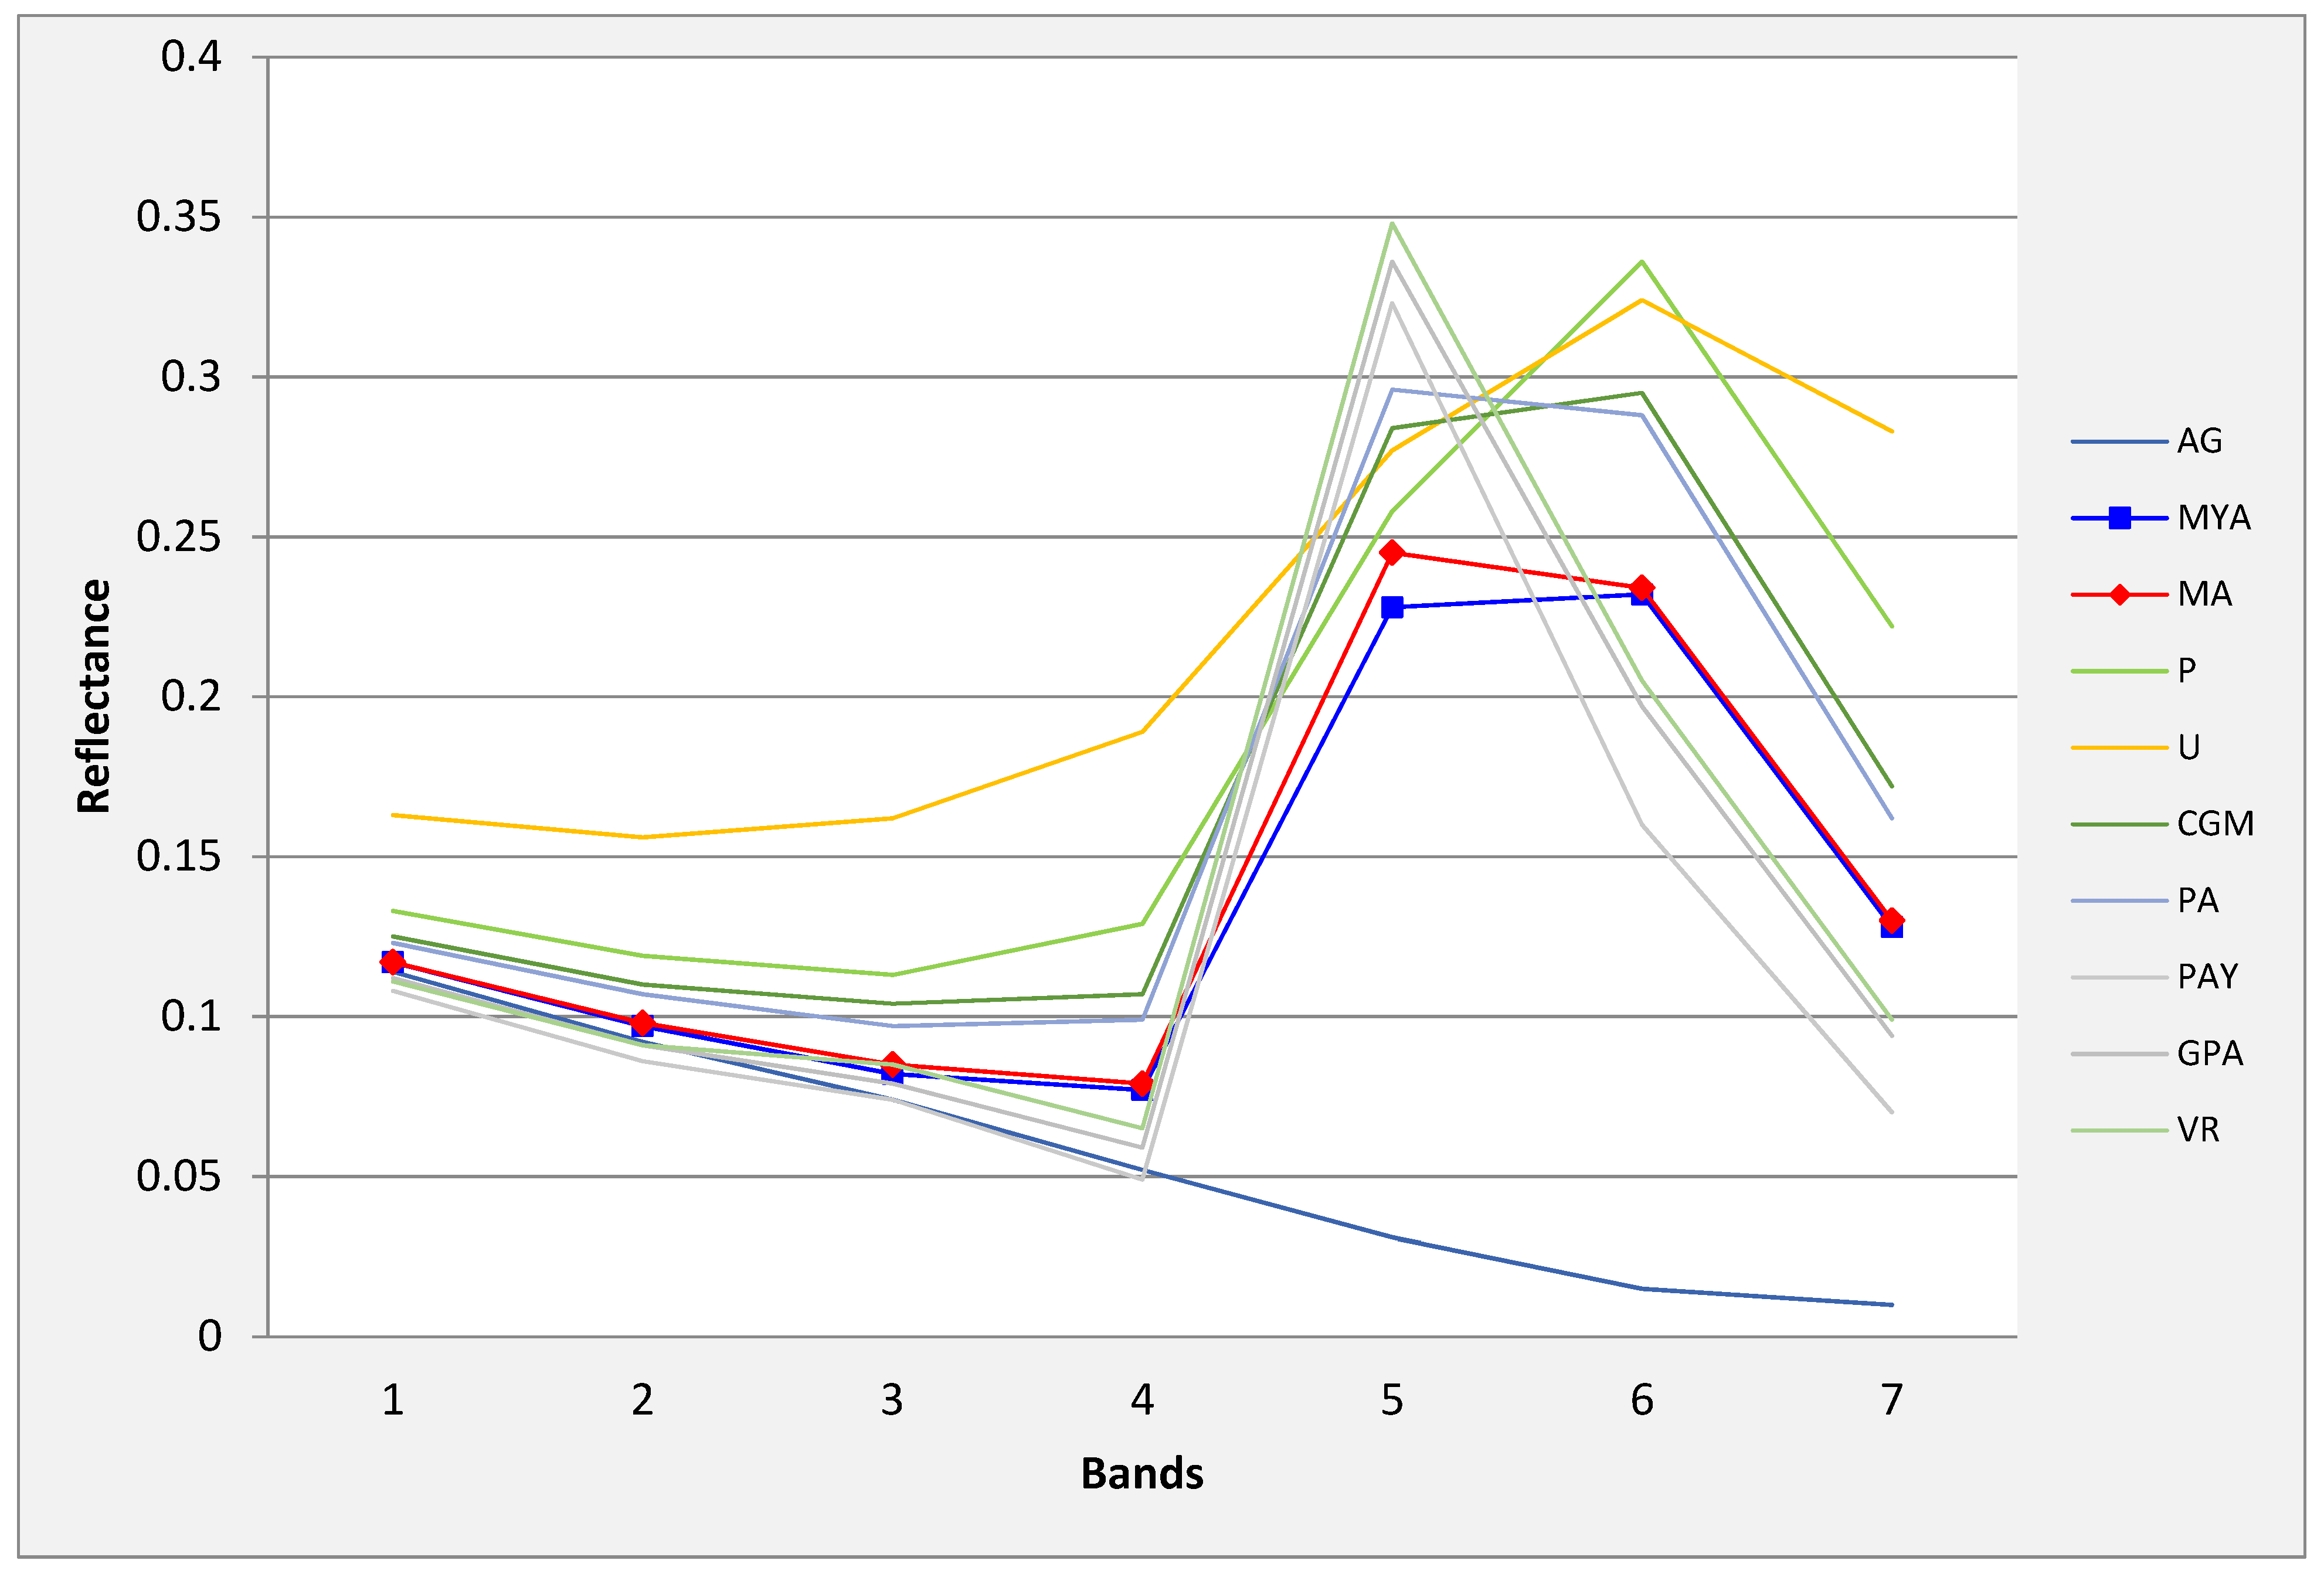
The spectral signatures obtained from the training areas (Figure 4) show that sicklebush (MA) and the combination of sicklebush and aroma (MYA) were distinguishable from the other classes in band 5 (NIR) and gave the lowest reflectivity, 0.245 and 0.228, respectively. The same result was obtained using the WorldView-2 image, in which the lowest reflectivity values were obtained for the same classes.
These reflectivity patterns are typical for vegetation and reveal low reflectivity in the visible bands, especially in the red portion, but high reflectivity in the NIR band [31]. The low reflectivity in the visible portion of the spectrum results from absorption by leaf pigments, primarily chlorophyll [32]. High reflectivity in the NIR region may be due to the internal structure of leaves (e.g., the spongy mesophyll layer), in which internal air cavities affect the diffusion and dispersion of radiation [33].
To confirm that the signatures obtained for the different vegetation and land-use types were separated spectrally from the sicklebush category, the transformed divergence separability method was applied. Good separability between the different vegetation types was apparent (Table 5); the majority of values exceeded 1900, as established by [21], apart from the sicklebush and aroma class, which exhibited a value of 1086, placing it in the poor separability category. This likely resulted from the combined signatures of both sicklebush and aroma, the growth of which were closely associated in the study area. Another explanation may be the choice of the training fields and pixel size given that the problem did not appear in the WorldView-2 image. This implies that the sites selected as training sites in the first classification had a greater cover of aroma than sicklebush, with the opposite apparent in the Landsat-8 image. In terms of pixel size, it is possible that the range of the sensor did not allow sicklebush and aroma to be differentiated, given their similar morphological characteristics, including bipinnate compound leaves.
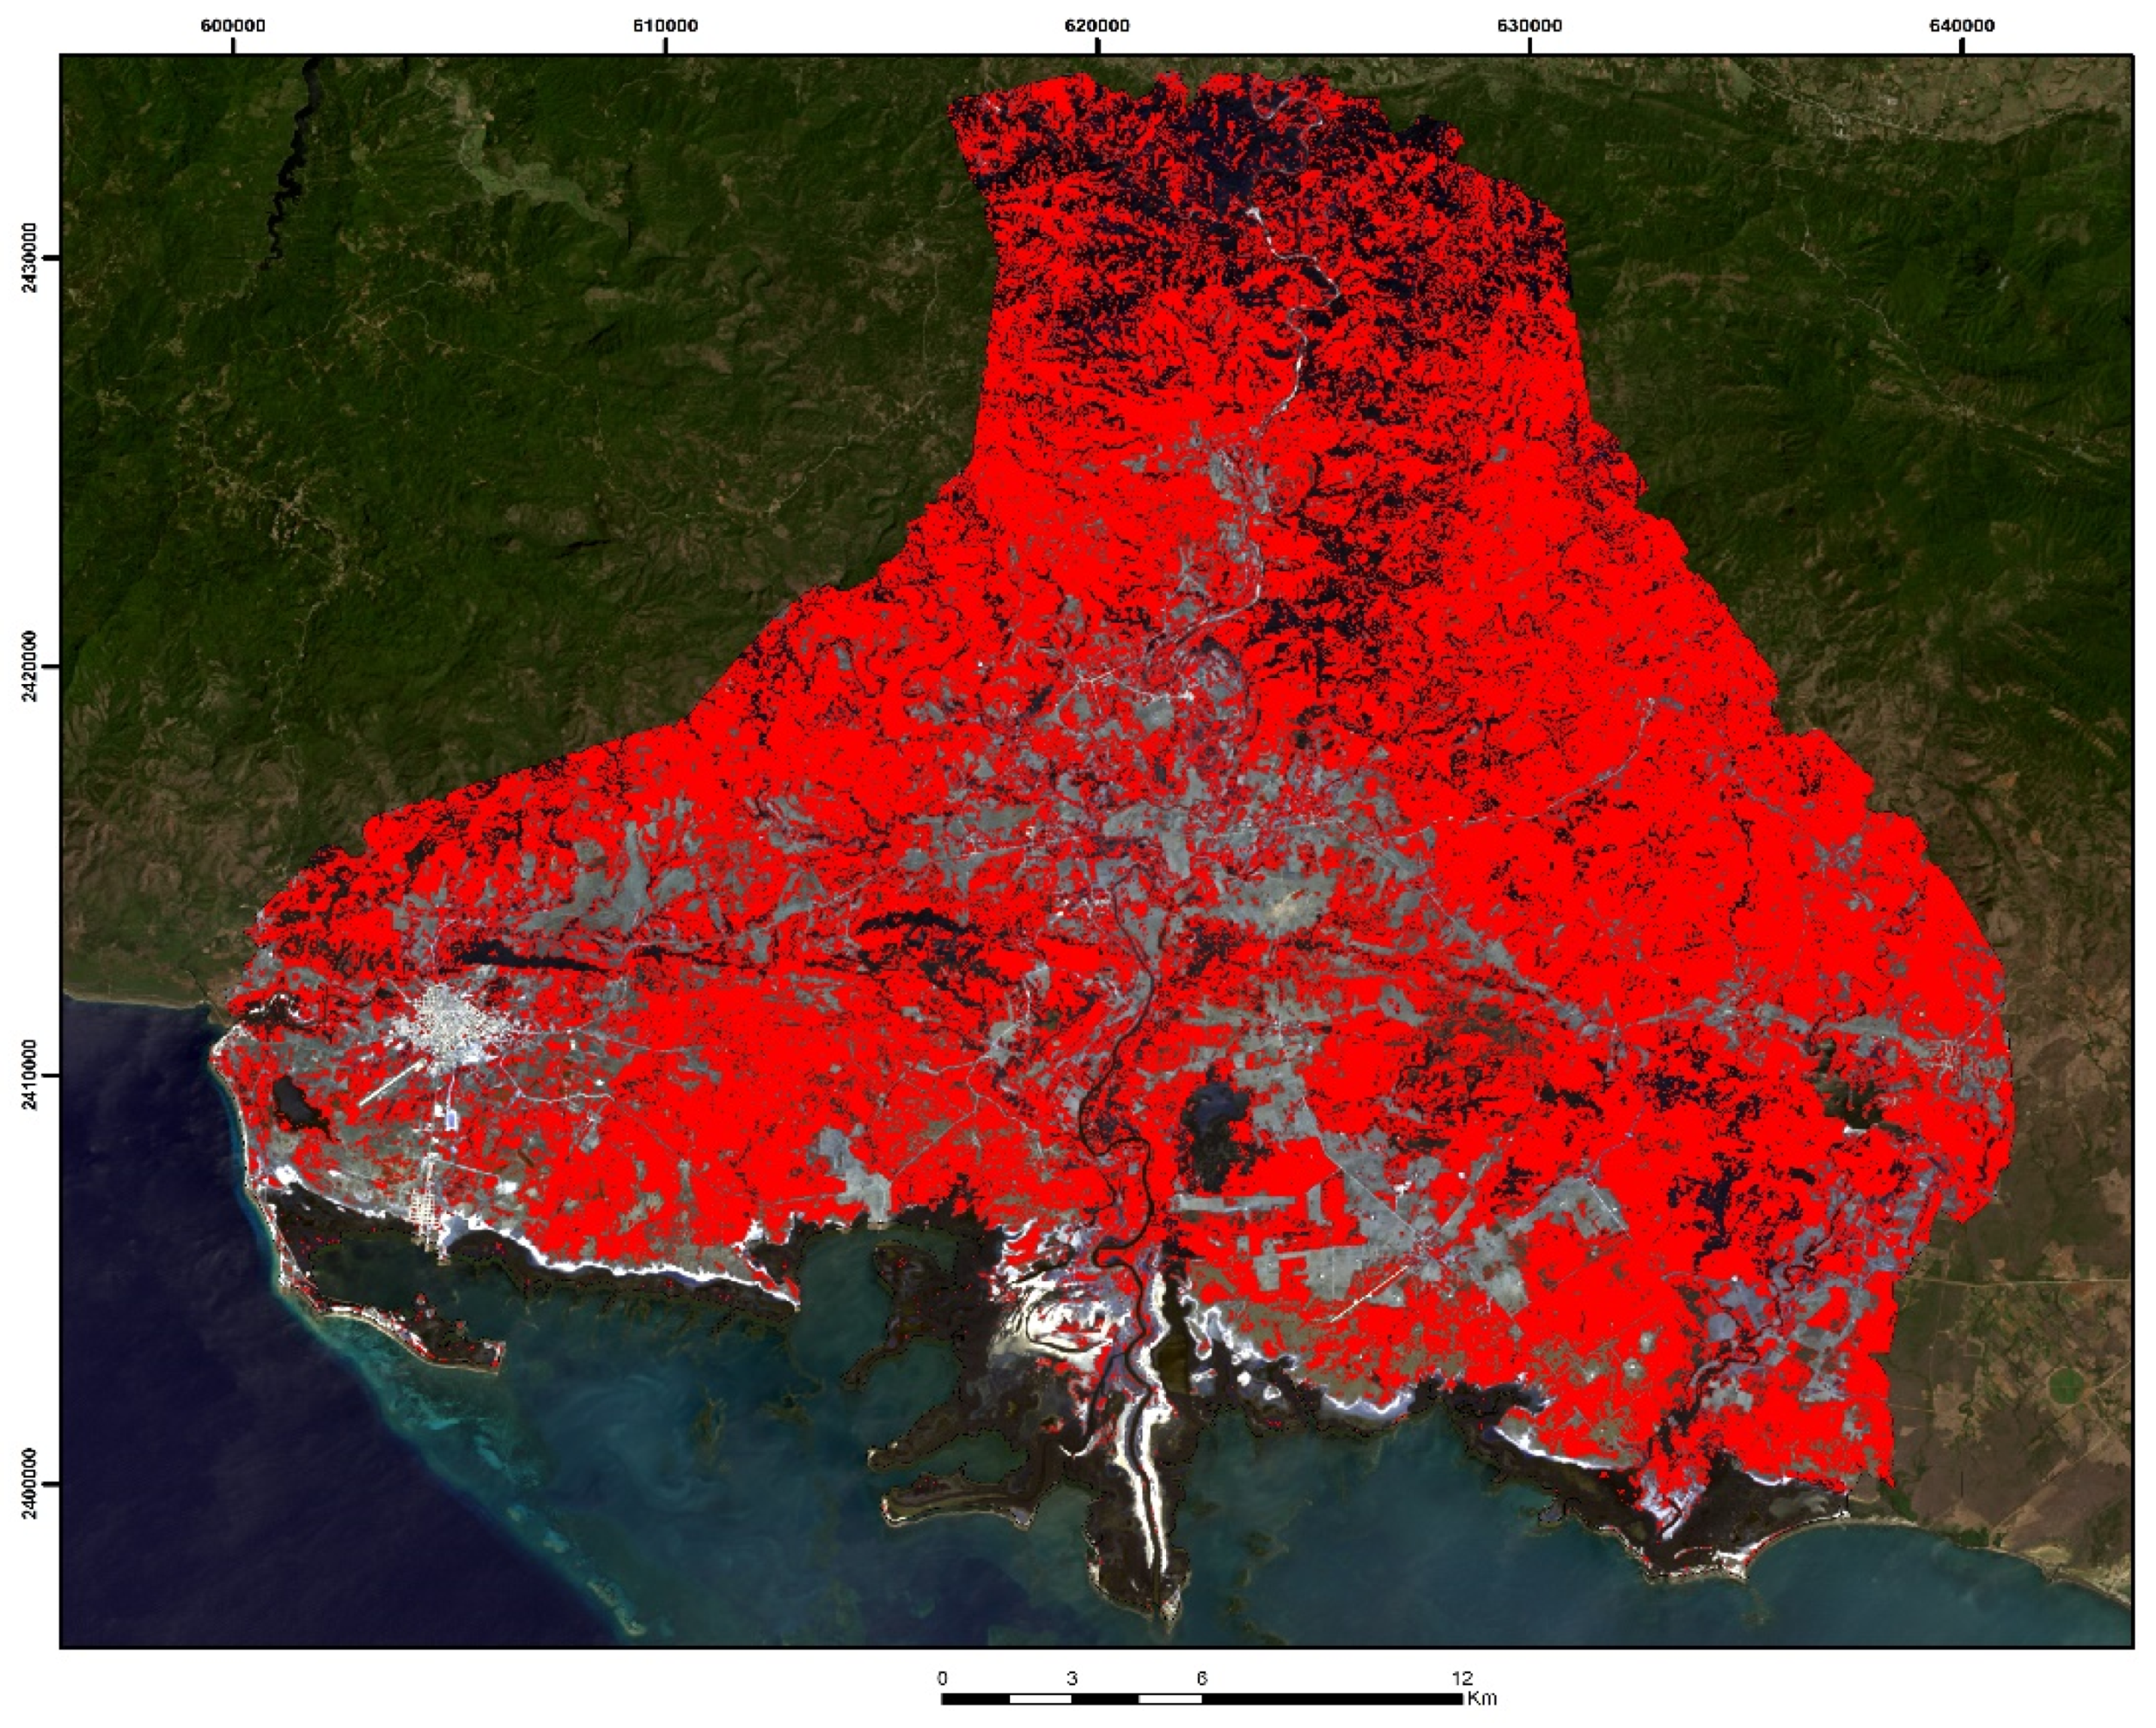
The assignment stage was undertaken to obtain the supervised classification using the maximum likelihood method as a parametric rule and the parallelepiped method as a non-parametric rule. This approach successfully separated the vegetation and land-use categories. While the classification was conducted for all vegetation types used in the spectral signatures, only the distribution of sicklebush was mapped in this study (Figure 5). Thus, sicklebush was distributed across the analysed area, mostly localised to the north, where the valley is superseded by the Escambray Sierra. The results obtained from the original Landsat-8 image demonstrated that sicklebush was colonising areas with low vegetation density or where vegetation is highly fragmented. This finding is in agreement with those of a study by Godinez et al. [34], who noted that as an invasive species, sicklebush colonises open ground by forming a structure of inaccessible branches and thorns and highlighted the prevalence of this species in areas of secondary scrubland.
Finally, the classification was checked using a confusion matrix produced with 240 random pixels verified in the field. The validation of the maximum likelihood classification of the Landsat-8 image is shown in Table 6, which yielded an overall accuracy of 93.7%, higher than that of Anderson et al. [28], who suggested that an accuracy of at least 85% is required (both overall and for each category) if results are to be used for future land-use management and planning. An accuracy of 91% was obtained for the Kappa coefficient, which, based on Landis and Koch [29], indicates very high reliability, where six of the ten categories exceeded 90%. This suggests that the visual interpretation and criteria used to separate the different categories were correct, reducing the likelihood of the misclassification of pixels.
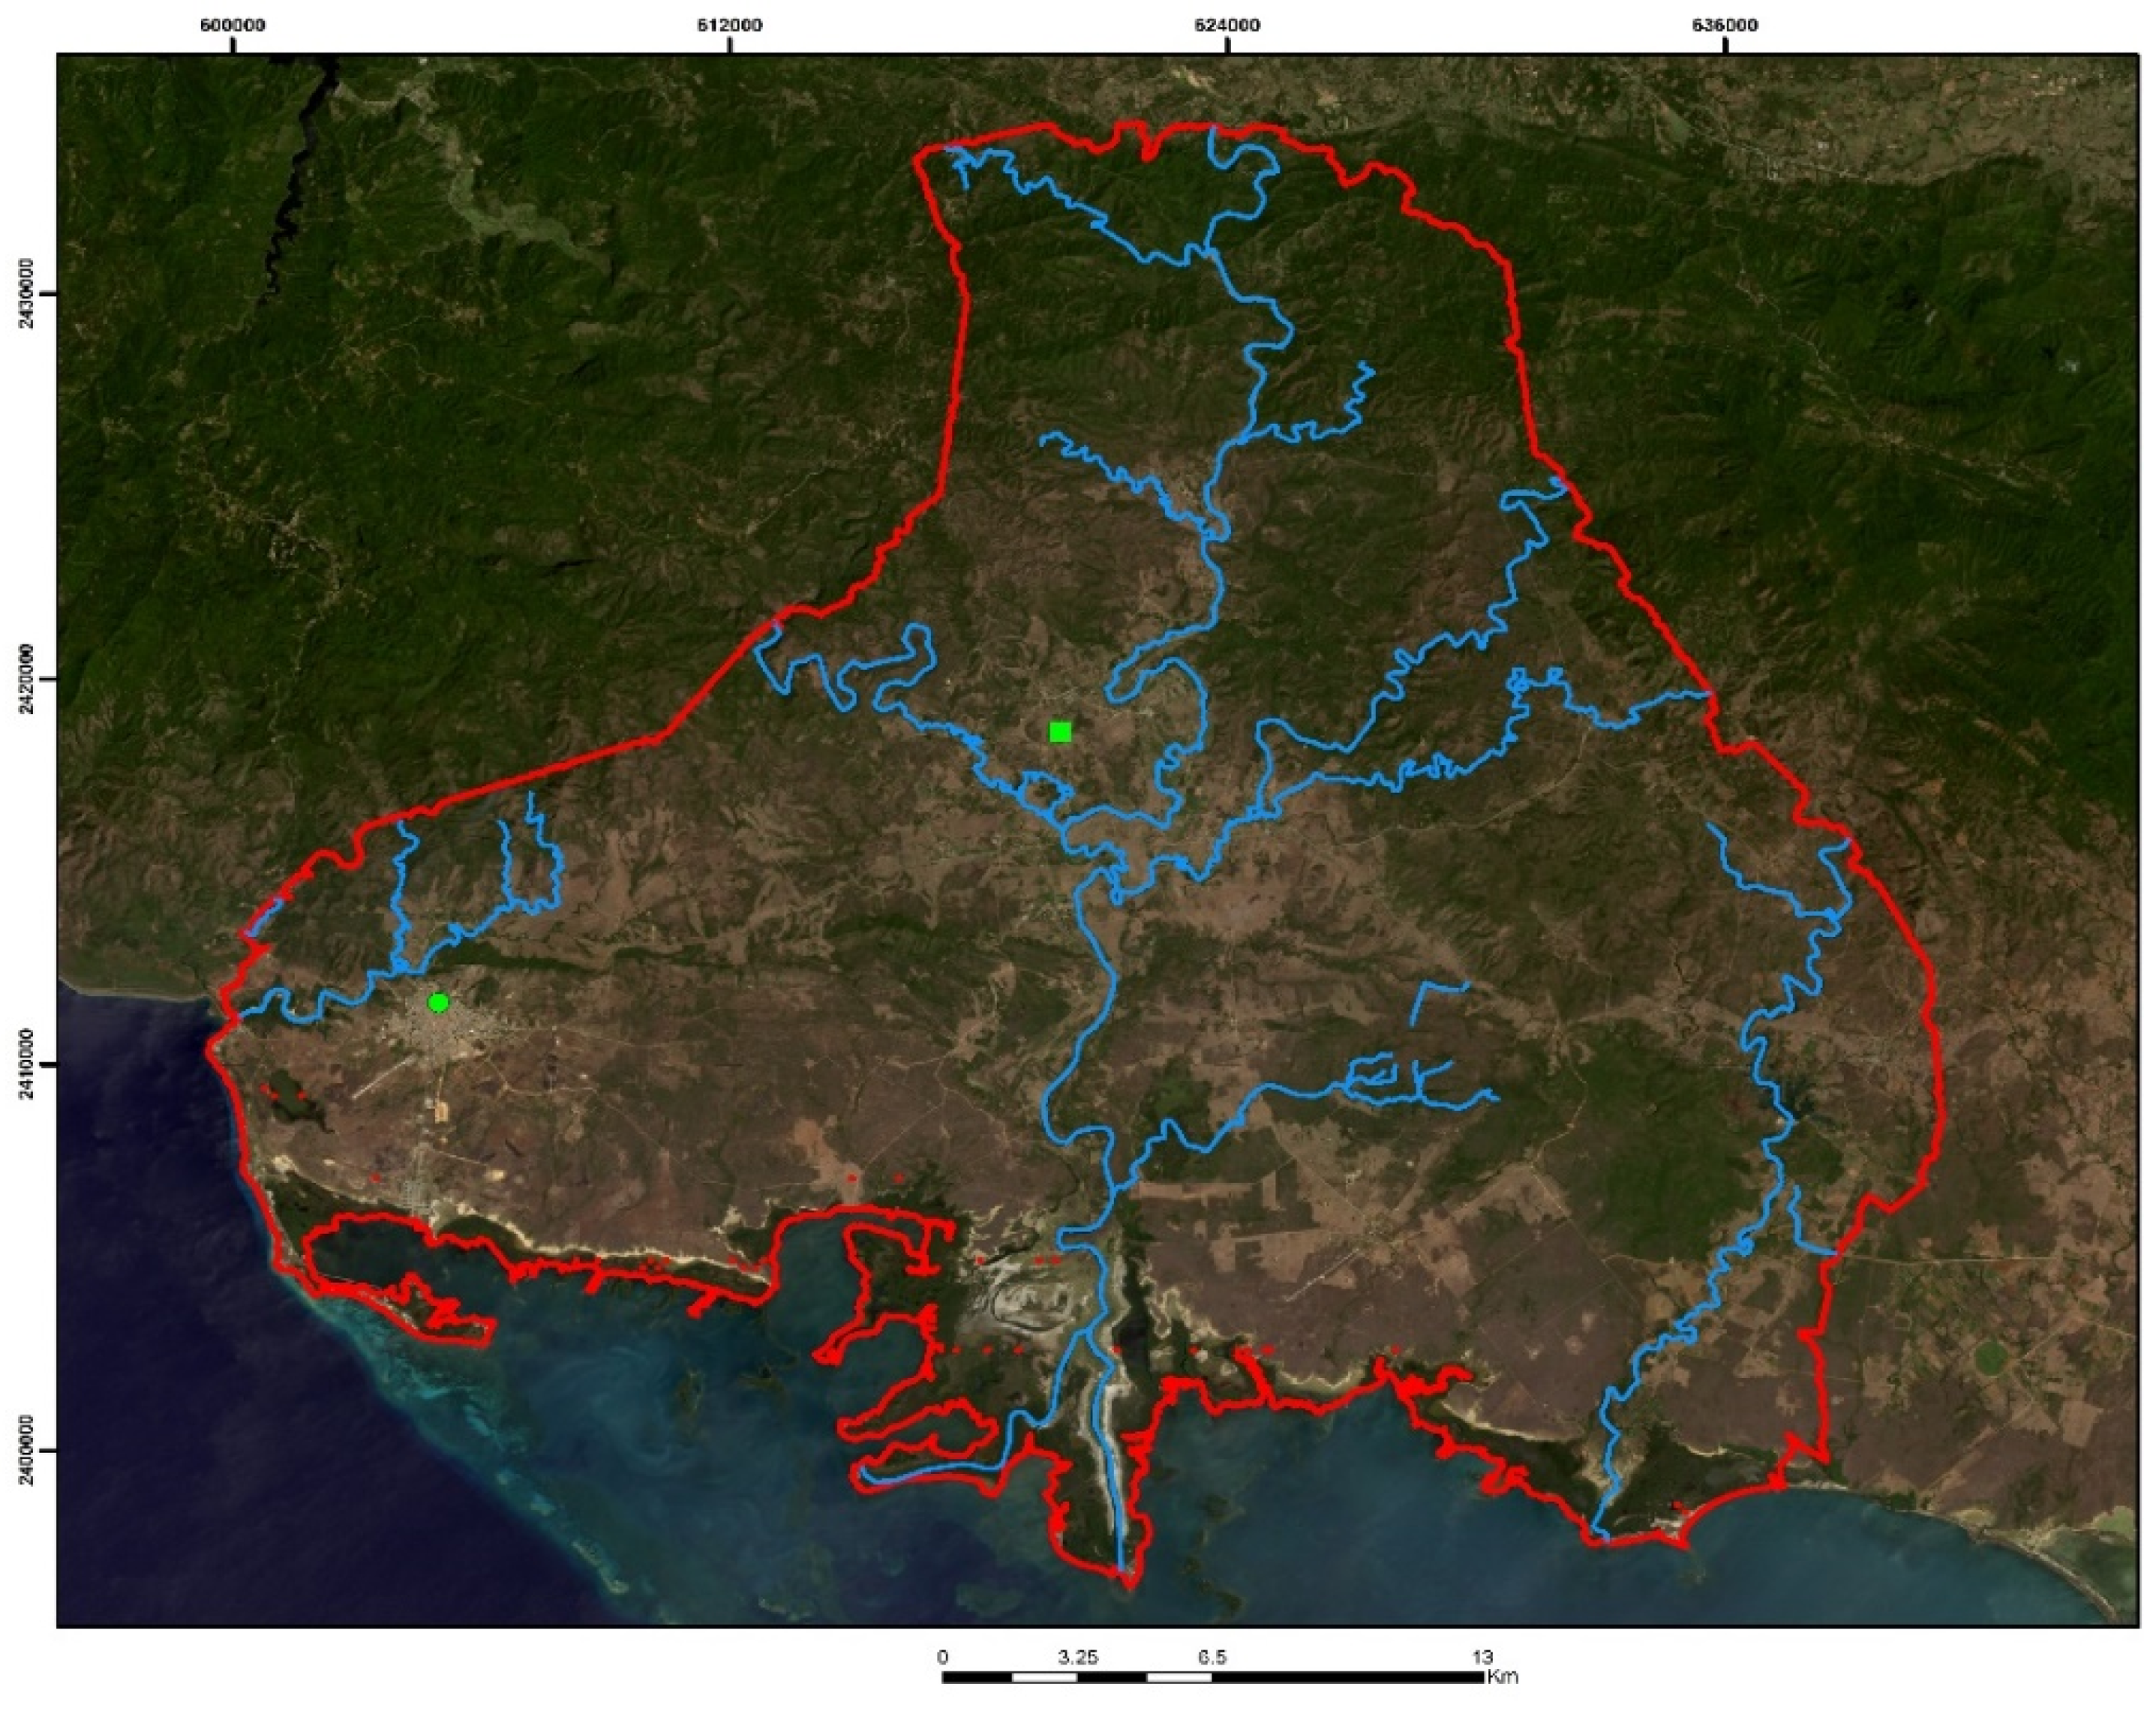
After acquiring the spectral signature and spatial distribution of sicklebush by cropping the Landsat-8 image, supervised classification was performed using the maximum likelihood method (Figure 6). Sicklebush was present in most of the municipality (shown in red in Figure 6), covering 52.7% of the total area analysed, and was mainly present in the northeast and west (Escambray Sierra) and south (seaside marshes) of the Valle de los Ingenios area, which is clearly delimited (Figure 6).
Given the scope of the project, the distribution of infestation could not be verified across non-cropped areas. Therefore, it was impossible to generate a matrix of confusion to determine the overall reliability of our model and to determine the effect of transferring the information from a small to a larger area. This is because there may be other types of vegetation in non-accessible zones, such as the sierra and marsh areas, which had not been distinguished spectrally in the model. Therefore, it is necessary to generate alternative signatures to avoid erroneous classification in the study area. However, our model was able to distinguish between local crops and marabou covers, which was the main goal of this study.

4. Conclusions

Training fields, generated using segmentation of WorldView-2 images, successfully yielded the spectral signatures of sicklebush (MA) and sicklebush with aroma (MYA) land-cover classes, enabling them to be distinguished from other types of vegetation identified in the study area. The resultant map of sicklebush distribution based on the WorldView-2 image had an overall precision of 88.7% overall accuracy and a Kappa coefficient reliability of 87.4%.
Once the training fields from the Worldview-2 image were obtained, we acquired spectral signatures from Landsat-8 images. Using this information, the spatial distribution map for sicklebush in the Landsat-8 image had an overall reliability of 93.7% and a Kappa coefficient reliability of 91.9%. These values indicate high confidence in the results, which suggest that sicklebush has invaded 52.7% of the total 46,807.26 ha of Trinidad-Valle de los Ingenios.
Access to both expensive, high-definition spatial satellite images and/or cloud-based, geospatial analysis platforms is one of the main problems when implementing geospatial analysis in developing countries. The cost of such data (23 $/km2 for WorldView-2) usually jeopardises the development of extensive and/or intensive studies that, in our case, would provide useful information about spatial and temporal patterns in sicklebush infestations. The use of vegetation covers retrieved from the WorldView-2 image as training fields to obtain spectral signatures from the Landsat-8 showed high effectiveness because, by obtaining the separability assessment in it, most of the index values fluctuated between 1900 and 2000 compared with the sicklebush signature. This demonstrates the effectiveness of using high-resolution spatial images to transfer information to free images with larger pixel sizes. Our results are providing local authorities with an affordable and accurate tool to check and measure a known problem described in Cuba some time ago: the progressive marabou infestation of natural and agricultural environments with great ecological value, which, in this case, compromises more than half of the municipality of Trinidad. Once the analytical methodology is developed, this technique will allow in the long-term further analysis of the temporal series of Landsat-8 images of other environmentally valuable areas affected by this weed. Short-term future lines of research would include the delimitation of the Valle de los Ingenios boundaries (as the valley has no fixed borders itself), following an exhaustive, time-related study to estimate the change and degree of infestation over time and space that renders hints about the nature of this weed infestation and its vectors and ways of dissemination to allow rapid implementation of integrated weed control techniques for sicklebush.

Author Contributions

Conceptualization, E.M., E.G. and J.M.; methodology, E.M. and E.G.; validation, R.A. and V.M.J.; formal analysis, E.M. and V.M.J.; investigation, R.A. and V.M.J.; resources, R.A.; data curation, R.A.; writing—original draft preparation, A.Z.; writing—review and editing, J.M.; visualization, A.Z.; supervision, J.M.; project administration, J.M.; funding acquisition, J.M. All authors have read and agreed to the published version of the manuscript.

Funding

This study was funded by the Spanish Agency for International Development and Cooperation (AECID) [grant number 11 CAP2 1423] and the Andalusian Agency for International Development and Cooperation (AACID) [grant number 2017DEC013].

Institutional Review Board Statement

Not applicable.

Informed Consent Statement

Not applicable.

Conflicts of Interest

The authors declare no conflict of interest.

Appendix A

Figure A1. Digitization of training fields in the WorldView-2 image and segmentation as performed in eCognition.
Agriculture 11 01057 g0a1
Figure A2. Difference in pixel size in WorldView-2 (left) and Landsat-8 (right) images.
Agriculture 11 01057 g0a2

References

  1. Germán, H.C.; Montesbravo, E.P.; Paredes Rodríguez, E.; Calas, P.B. Biologia Reproductiva de Dichrostachys Cinerea (L.) Wight & Arn. (Marabú). (I) Evaluación de Reproduccion Por Semillas. Fitosanidad 2008, 12, 39–43. [Google Scholar]
  2. Hernandez-Enriquez, O.; Alvarez, R.; Morelli, F.; Bastida, F.; Camacho, D.; Menendez, J. Low-Impact Chemical Weed Control Techniques in UNESCO World Heritage Sites of Cuba. Commun. Agric. Appl. Biol. Sci. 2012, 77, 387–393. [Google Scholar] [PubMed]
  3. Xie, Y.; Sha, Z.; Yu, M. Remote Sensing Imagery in Vegetation Mapping: A Review. J. Plant Ecol. 2008, 1, 9–23. [Google Scholar] [CrossRef]
  4. Chen, B.; Jin, Y.; Brown, P. Automatic Mapping of Planting Year for Tree Crops with Landsat Satellite Time Series Stacks. ISPRS J. Photogramm. Remote Sens. 2019, 151, 176–188. [Google Scholar] [CrossRef]
  5. Abburu, S.; Babu Golla, S. Satellite Image Classification Methods and Techniques: A Review. Int. J. Comput. Appl. 2015, 119, 20–25. [Google Scholar] [CrossRef]
  6. Paul, M.; Mather, M.K. Computer Processing of Remotely-Sensed Images: An Introduction; John Wiley & Sons: Hoboken, NJ, USA, 2011. [Google Scholar]
  7. Chen, B.; Tu, Y.; Song, Y.; Theobald, D.M.; Zhang, T.; Ren, Z.; Li, X.; Yang, J.; Wang, J.; Wang, X.; et al. Mapping Essential Urban Land Use Categories with Open Big Data: Results for Five Metropolitan Areas in the United States of America. ISPRS J. Photogramm. Remote Sens. 2021, 178, 203–218. [Google Scholar] [CrossRef]
  8. Hasmadi, M.; Hz, P.; Mf, S. Evaluating Supervised and Unsupervised Techniques for Land Cover Mapping Using Remote Sensing Data. Geogr. Malays. J. Soc. Space 2009, 5, 1–10. [Google Scholar]
  9. Panda, S.S.; Terrill, T.H.; Mahapatra, A.K.; Kelly, B.; Morgan, E.R.; van Wyk, J.A. Site-Specific Forage Management of Sericea Lespedeza: Geospatial Technology-Based Forage Quality and Yield Enhancement Model Development. Agriculture 2020, 10, 419. [Google Scholar] [CrossRef]
  10. Wiens, J.A. Spatial Scaling in Ecology. Funct. Ecol. 1989, 3, 385. [Google Scholar] [CrossRef]
  11. Blaschke, T.; Hay, G.J.; Kelly, M.; Lang, S.; Hofmann, P.; Addink, E.; Queiroz Feitosa, R.; van der Meer, F.; van der Werff, H.; van Coillie, F.; et al. Geographic Object-Based Image Analysis—Towards a New Paradigm. ISPRS J. Photogramm. Remote Sens. 2014, 87, 180–191. [Google Scholar] [CrossRef] [Green Version]
  12. Valjarević, A.; Milanović, M.; Valjarević, D.; Basarin, B.; Gribb, W.; Lukić, T. Geographical Information Systems and Remote Sensing Methods in the Estimation of Potential Dew Volume and Its Utilization in the United Arab Emirates. Arab. J. Geosci. 2021, 14, 1–15. [Google Scholar] [CrossRef]
  13. Clark, M.L. Comparison of Multi-Seasonal Landsat 8, Sentinel-2 and Hyperspectral Images for Mapping Forest Alliances in Northern California. ISPRS J. Photogramm. Remote Sens. 2020, 159, 26–40. [Google Scholar] [CrossRef]
  14. Oreti, L.; Giuliarelli, D.; Tomao, A.; Barbati, A. Object Oriented Classification for Mapping Mixed and Pure Forest Stands Using Very-High Resolution Imagery. Remote Sens. 2021, 13, 2508. [Google Scholar] [CrossRef]
  15. Sinoga, J.D.R.; Noa, R.R.; Perez, D.F. An Analysis of the Spatial Colonization of Scrubland Intrusive Species in the Itabo and Guanabo Watershed, Cuba. Remote Sens. 2010, 2, 740–757. [Google Scholar] [CrossRef] [Green Version]
  16. Sánchez, F.; De Julián, J.J.; Ordóñez, A. Tipologías Constructivas En Una Ciudad Patrimonio de La Humanidad: Trinidad, Cuba. Rev. Constr. 2010, 9, 89–97. [Google Scholar] [CrossRef] [Green Version]
  17. Luis, J.; Díaz, D.; Celada, M.S.; Gutiérrez, E.Q. Determinación de La Dinámica Del Relieve En Territorios Montañosos: Un Nuevo Enfoque Geomorfológico Ambiental En La Sierra de Trinidad, Cuba Central. Investig. Geográficas 2002, 24–43. [Google Scholar] [CrossRef]
  18. Huang, L.; Ni, L. Object-Oriented Classification of High Resolution Satellite Image for Better Accuracy. In Proceedings of the 8th International Symposium on Spatial Accuracy Assessment in Natural Resources and Environmental Sciences, Shangai, China, 25–27 June 2008; pp. 211–218. [Google Scholar]
  19. Rwanga, S.S.; Ndambuki, J.M. Accuracy Assessment of Land Use/Land Cover Classification Using Remote Sensing and GIS. Int. J. Geosci. 2017, 8, 611–622. [Google Scholar] [CrossRef] [Green Version]
  20. Swain, P.H.; King, R.C. Two Effective Feature Selection Criteria for Multispectral Remote Sensing; LARS Technical Reports; Pardue University Libraries: West Lafayette, IN, USA, 1973. [Google Scholar]
  21. Weiss, M.; Jacob, F.; Duveiller, G. Remote Sensing for Agricultural Applications: A Meta-Review. Remote Sens. Environ. 2020, 236, 111402. [Google Scholar] [CrossRef]
  22. Ayala, R.M.; Menenti, M. Metodología Para Búsqueda Del Mejor Clasificador de Imágenes de Satélite. In Proceedings of the Teledetección, Medio Ambiente y Cambio Global, Lleida, España, 19–22 September 2001; Volume 2, pp. 469–472. [Google Scholar]
  23. Congalton, R.G. A Review of Assessing the Accuracy of Classifications of Remotely Sensed Data. Remote Sens. Environ. 1991, 37, 35–46. [Google Scholar] [CrossRef]
  24. Spiegel Murray, R.; Stephens, L.J. Schaum’s Outline of Statistics, 6th ed.; McGraw-Hill: New York, NY, USA, 2017; ISBN 978-1260011463. [Google Scholar]
  25. Upadhyay, P.; Ghosh, S.K.; Kumar, A. High Resolution Temporal Normalized Difference Vegetation Indices for Specific Crop Identification. ISPRS Int. Arch. Photogramm. Remote Sens. Spat. Inf. Sci. 2013, XL-1/W1, 351–355. [Google Scholar] [CrossRef] [Green Version]
  26. Chen, J. Leaf Pigment Content. Ref. Modul. Earth Syst. Environ. Sci. 2017, 1–17. Available online: https://doi.org/10.1016/B978-0-12-409548-9.10547-0 (accessed on 1 May 2021). [CrossRef]
  27. Lewis, G.; Schrire, B.; MacKinder, B.; Lock, M. Legumes of the World. Royal Botanic Gardens, Kew. Edinb. J. Bot. 2005, 62, 195–196. [Google Scholar]
  28. Anderson, J.R.; Hardy, E.E.; Roach, J.T.; Witmer, R. A Land Use and Land Cover Classification System for Use with Remote Sensor DataTitle; Geological Survey Professional Paper; U.S. Department of the Interior: Washington, DC, USA, 1976. [Google Scholar]
  29. Landis, J.R.; Koch, G.G. The Measurement of Observer Agreement for Categorical Data. Biometrics 1977, 33, 159. [Google Scholar] [CrossRef] [PubMed] [Green Version]
  30. Estoque, R.C.; Murayama, Y.; Akiyama, C.M. Pixel-Based and Object-Based Classifications Using High- and Medium-Spatial-Resolution Imageries in the Urban and Suburban Landscapes. Geocarto Int. 2015, 30, 1113–1129. [Google Scholar] [CrossRef] [Green Version]
  31. Pahlevan, N.; Schott, J.R.; Franz, B.A.; Zibordi, G.; Markham, B.; Bailey, S.; Schaaf, C.B.; Ondrusek, M.; Greb, S.; Strait, C.M. Landsat 8 Remote Sensing Reflectance (Rrs) Products: Evaluations, Intercomparisons, and Enhancements. Remote Sens. Environ. 2017, 190, 289–301. [Google Scholar] [CrossRef]
  32. Gates, D.M.; Keegan, H.J.; Schleter, J.C.; Weidner, V.R. Spectral Properties of Plants. Appl. Opt. 1965, 4, 11. [Google Scholar] [CrossRef]
  33. Stéphane Jacquemoud, S.L.U. Leaf Optical Properties; Cambridge University Press: New York, NY, USA, 2019. [Google Scholar]
  34. Godínez, C.D.; Plasencia, F.J.M.; Enríquez, N. Flora y Vegetación de Loma La Llaga, Cuenca Del Río San Pedro, Camagüey, Cuba. Polibotánica 2006, 21, 123–140. [Google Scholar]
Figure 1. Trinidad-Valle de los Ingenios municipality in the Sancti Spiritus Province, Cuba (Landsat 8 image). Symbology: Town of Trinidad (green dot); Valle de los Ingenios (green square); rivers (blue lines). Datum: WGS1984; Spatial reference: UTM zone 17N; Latitude of origin: 0; Scale factor: 0.9996; Central meridian: −81; False northing: 0; False easting: 500,000.
Agriculture 11 01057 g001
Figure 2. Spectral signatures of different vegetation and land-use categories in the WorldView-2 Image of Trinidad-Valle de los Ingenios, Cuba.
Agriculture 11 01057 g002
Figure 3. Spatial distribution of sicklebush (shown in red) based on the maximum likelihood classification method in a WorldView-2 image of Trinidad-Valle de los Ingenios, Cuba. Datum: WGS1984; Spatial reference: UTM zone 17N; Latitude of origin: 0; Scale factor: 0.9996; Central meridian: −81; False northing: 0; False easting: 500,000.
Agriculture 11 01057 g003
Figure 4. Spectral signatures of different vegetation and land-use categories in the Landsat-8 image of Trinidad-Valle de los Ingenios, Cuba.
Agriculture 11 01057 g004
Figure 5. Spatial distribution of sicklebush (shown in red) based on the maximum likelihood classification of a Landsat-8 image of Trinidad-Valle de los Ingenios, Cuba. Datum: WGS1984; Spatial reference: UTM zone 17N; Latitude of origin: 0; Scale factor: 0.9996; Central meridian: −81; False northing: 0; False easting: 500,000.
Agriculture 11 01057 g005
Figure 6. Spatial distribution of sicklebush (shown in red) based on analysis of Landsat-8 image of Trinidad-Valle de los Ingenios, Cuba. Datum: WGS1984; Spatial reference: UTM zone 17N; Latitude of origin: 0; Scale factor: 0.9996; Central meridian: −81; False northing: 0; False easting: 500,000.
Agriculture 11 01057 g006
Table 1. Classification of land-use and vegetation types based on spectral signatures of WorldView-2 image of Trinidad-Valle de los Ingenios, Cuba.
Vegetation and Land Use
AGWater
ALAlbizia procera (Roxb.) Benth.
ARVachellia farnesiana (L.) Willd. y Arn.
BGGuazuma ulmifolia Lam. forest
CSugar Cane
CGMPsidium guajava L. + Mangifera indica L. cultivation
GPAGuazuma ulmifolia Lam., Roystonea regia (Kunth) O. F. Cook, Terminalia catappa L.
KGPennisetum purpureum Schumach
MMOMelicoccus bijugatus Jacq. + Mangifera indica L. + others
MADichrostachys cinerea
MYADichrostachys cinerea + Vachellia farnesiana
MODichrostachys cinerea + Others
PAYRoystonea regia, Bursera simaruba (L.) Sarg., Cecropia schreberiana Miq.
PAAcacia mangium Willd. plantation
PSGrass
SShadow
URUrban
VRRiparian vegetation
Table 2. Land-use and vegetation classification based on spectral signatures of a Landsat-8 image of Trinidad-Valle de los Ingenios, Cuba.
Vegetation and Land Use
AGWater
CGMPsidium guajava L. + Mangifera indica L. cultivation
GPAGuazuma ulmifolia Lam., Roystonea regia (Kunth) O. F. Cook, Terminalia catappa L.
MADichrostachys cinerea
MYADichrostachys cinerea + Vachellia farnesiana
PAYRoystonea regia, Bursera simaruba (L.) Sarg., Cecropia schreberiana Miq.
PAAcacia mangium Willd. plantation
PSGrass
URUrban
VRRiparian vegetation
Table 3. Separability matrix using the transformed divergence method for a WorldView-2 image of Trinidad-Valle de los Ingenios, Cuba.
CATEGORIESALMAMYACPSBGARGPAPAYCGMPAKGPAASURMOVRMMO
ALBIZIA01999198820002000138319992000705200020002000200020002000200079219981959
SICKLEBUSH1999018551999196619981981198219991999172320002000200020002000198919851805
SICKLEBUSH AND AROMA1988185502000200017511712200019912000200020002000200020002000185820001955
CANE2000199920000147320002000199720001943195718732000200020002000200020002000
GRASS2000196620001473020002000198720001685167219722000200020002000200019961995
GUACIMA FOREST1383199817512000200001868200014092000200020002000200020002000121820001978
AROMA1999198117122000200018680200019992000200020002000200020002000199320001993
RYEGRASS, PALM, ALMOND200019822000199719872000200001999199918772000200020002000200019922861447
PALM, GUMBO-LIMBO, YAGRUMA70519991991200020001409199919990200020002000200020002000200055219941923
GUAYABA AND MANGO CULTIVATION2000199920001943168520002000199920000192719822000200020002000200020002000
ACACIA PLANTATION2000172320001957167220002000187720001927020002000200020002000200019271881
KING GRASS2000200020001873197220002000200020001982200002000200020002000200020002000
PASTURELAND2000200020002000200020002000200020002000200020000200020002000200020002000
WATER2000200020002000200020002000200020002000200020002000020002000200020002000
SHADOW2000200020002000200020002000200020002000200020002000200002000200020002000
URBAN2000200020002000200020002000200020002000200020002000200020000200020002000
SICKLEBUSH AND OTHER79219891858200020001218199319925522000200020002000200020002000019711731
RIPARIAN VEGETATION199819852000200019962000200028619942000192720002000200020002000197101147
MAMONCILLO, MANGO AND OTHER1959180519552000199519781993144719232000188120002000200020002000173111470
Table 4. Confusion matrix for the validation of the supervised classification of a WorldView-2 image of Trinidad-Valle de los Ingenios, Cuba.
Baseline Data
CATEGORIESMYACVRMMOPSBGARGPAPAYCGMPAKGPAAGSURMOALMATOTALLevel of Accuracy
MYA560000000000000000015798.2%
C09001000000100000001181.8%
VR0020000100000000000366.7%
MMO001170001100000000002085%
PS0100300000000000000475%
BG100003402000000003104182.9%
AR0000004100000000000580%
GPA00000001000000000001100%
PAY000000001500000003001883.3%
CGM0000000005000000100683.3%
PA000000000015000001011788.2%
KG0000100000030000000475%
PA0000000000001300000013100%
AG00000000000000000000-
S00000000000000200002100%
UR0000000000000001100011100%
MO00000100000000008101080%
AL000000000000000031201580%
MA000000100000000000181994.7%
TOTAL571031753556165154130211191420257
Errors of omission1.7%10%33.3%0%40%2.9%20%83.3%6.2%0%0%25%0%-0%0%57.9%14.3%10%
Overall accuracy = 8.7%
Table 5. Separability matrix derived using the transformed divergence method on a Landsat-8 image of Trinidad-Valle de los Ingenios, Cuba.
CATEGORIESCGMPAMAGPAMYAVRPAGURPAY
GUAYABA AND MANGO CULTIVATION0200020002000200020002000200020002000
ACACIA PLANTATION2000019972000200020002000200020002000
SICKLEBUSH2000199701990108619861994200020002000
GAUDIN, PALM, ALMOND2000200019900199218682000200020001999
SICKLEBUSH AND AROMA2000200010861992019982000200020002000
RIPARIAN VEGETATION2000200019861868199802000200020001999
PASTURELAND2000200019942000200020000200020002000
WATER2000200020002000200020002000020002000
URBAN2000200020002000200020002000200002000
PALM, GUMBO-LIMBO, YAGRUMA2000200020001999200019992000200020000
Table 6. Separability matrix derived using the transformed divergence method on Landsat-8 image of Trinidad-Valle de los Ingenios, Cuba.
Baseline Data
CATEGORIESGPAMYAVRPAAGURPAYCGMPAYMATOTALLevel of Accuracy
GPA150000000011693.7%
MYA120000000042580%
VR0040001000580%
PA000250100002696.1%
AG00000000000-
UR000101000001190.9%
PAY200000380004095%
CGM0001000700887.5%
PAY000100001401593.3%
MA020000000929497.9%
TOTAL18224280113971497240
Errors of omission16.7%9%0%10.7%-9%2.6%0%0%5.1%
Overall
accuracy = 93.7%
Publisher’s Note: MDPI stays neutral with regard to jurisdictional claims in published maps and institutional affiliations.

