Article

WSPM-System: Providing Real Data of Rotor Speed and Pitch Angle for Numerical Simulation of Downwash Airflow from a Multirotor UAV Sprayer

1
College of Engineering, China Agricultural University, No.17 Qing Hua Dong Lu, Haidian District, Beijing 100083, China
2
Agricultural and Biosystems Engineering Department, Jomo Kenyatta University of Agriculture and Technology, Nairobi P.O. Box 62000-00200, Kenya
3
College of Engineering and Technology, Southwest University, Chongqing 400715, China
*
Author to whom correspondence should be addressed.
Agriculture 2021, 11(11), 1038; https://doi.org/10.3390/agriculture11111038
Submission received: 9 September 2021 / Revised: 12 October 2021 / Accepted: 14 October 2021 / Published: 23 October 2021

Abstract

:
The accurate setting of input parameters in the numerical simulation of downwash airflow from a UAV sprayer is important for acceptable simulation results. To provide real data of simulation parameters (rotor speed and pitch angle) for the numerical simulation of downwash airflow, a wireless simulation parameter measurement system (WSPM-System) was designed and tested in this study. The system consists of hardware and software designed based on Arduino and LabVIEW, respectively. Wireless communication was realized by nRF24L01. The lattice Boltzmann method (LBM) was applied for the numerical simulation of downwash airflow. The results showed that the valid communication distance of the WSPM-System was 100 m, with a packet loss rate of less than 1%. While hovering, the rotor speed dropped by about 30% when the load of the UAV sprayer changed from 16 kg to 4 kg, which resulted in the maximum vertical downward velocity (VVD) on the horizontal detection surface dropping by about 23%. Under forward flight, the rotor speed in the front (n1, n6) and rear (n3, n4) of the UAV sprayer, respectively, showed a negative linear correlation and positive linear correlation with flight speed (R2 > 0.95). Meanwhile, the rotor speed in the middle (n2, n5) was consistent with the rotor speed while hovering under the same load; the pitch angle showed a positive linear correlation with flight speed (R2 > 0.94). A correlation analysis of measured and simulated values of the VVD revealed that the numerical simulation of downwash airflow with the parameters provided by the WSPM-System was reliable (R2 = 0.91). This study confirmed that the input value of the rotor speed in the fluid software needed to be determined according to the application parameters of the UAV sprayer, thus providing a feasible method and system for obtaining real simulation parameters.

1. Introduction

The chemical control of pests and diseases is an integral activity in agricultural production systems, and it plays an important role in increasing the quality and yield of crops [1,2]. In recent years, a new spray application technology, based on an unmanned aerial vehicle (UAV) sprayer, has been rapidly developed, particularly in East Asian countries (such as China, South Korea, and Japan) [3], and it achieved good application results in field crops such as rice paddies, corn, wheat, and cotton [4,5,6,7]. In addition, the spraying of orchards with multirotor UAV sprayers has also been reported [8,9,10,11]. Additionally, the data (coverage, residue, and penetration) collected from one of the most difficult pest control systems (almond orchard) in US agriculture support reported successes in China [12]. Compared with a single-rotor helicopter (fuel-powered or electric-powered), electric multirotor UAV sprayers with a smaller payload (10–16 kg) are highly efficient, highly flexible, and affordable, and they are rapidly being commercialized for crop protection in small, fragmented, and complex terrains, as well as in irregular farms, thus increasing their worldwide interest [12,13]. Additionally, the reduced exposure of workers to pesticides makes the UAV sprayer more attractive [10]. At present, more than 90% of agricultural UAV sprayers in China used for crop protection are electric multirotor UAV sprayers [14]. In addition, the use of UAV sprayers has been extended to fertilizer applications [15], the release of predatory mites and other natural enemies [16], and for sowing rice seeds [17]. Moreover, during the COVID-19 pandemic, the UAV sprayers have been used for spraying disinfectants [18].
Although UAV sprayers have been adopted in commercial spray scenarios and have emerged as one of the main pesticide application approaches in China [19], there is still a lack of environmental risk assessment studies regarding off-target losses. The off-target losses of pesticides, including spray drift, result in heavy contamination of the ecosystem, including water resources and soil, as well as human health threats [20,21,22,23]. Based on European Regulation 1107/2009 [24], the objective of protecting human and animal health and the environment should take priority over the objective of improving crop production. European Directive 2009/128/CE [25] pointed out that the impact of pesticide uses on human health and the environment should be assessed by conducting an environmental risk assessment. However, in addition to field tests [14,26], a more efficient way to achieve this goal is to simulate the UAV sprayer’s downwash airflow and pesticide applications by using more efficient and low-cost numerical simulation technologies. This means higher requirements for the accuracy of the numerical simulation of downwash airflow using fluid software, such as Fluent, XFlow, etc. Hence, the input values of simulation parameters (rotor speed and pitch angle) in fluid software are very important.
In recent years, the downwash airflow from UAV sprayers has become a topic of interest. The use of numerical simulation technology to study downwash airflow is not only important for understanding spray drift but can also provide a rich database for the environmental risk assessment of drifted pesticides. Different sources of airflow can lead to different spatiotemporal distribution characteristics for airflow; as such, insights into the spatiotemporal distribution of airflow are an important prerequisite in the analysis of droplet deposition dynamics. Regarding traditional air-assisted sprayers, Qi et al. [27] found that the airflow from an air-assisted sprayer could effectively improve the distribution of droplets in tree canopies. Gu et al. [28] studied the unimpeded air velocity profiles of an air-assisted five-port sprayer. Their results showed that the airflow distribution pattern was different with various application parameters. Hong et al. [29] developed an integrated CFD model to predict air velocity distributions inside and around tree canopies blown by an air-assisted pesticide sprayer. Similar to the horizontal and/or vertical airflow from air-assisted sprayers, the downwash airflow of the UAV sprayer plays an important role in the transportation of droplets from their source (nozzles) to the target [30]. Strong airflow can increase on-target deposition by reducing droplet flight time and reducing the effect of meteorological conditions on the spray [29]. Inevitably, downwash airflow can increase the risk of droplets’ off-target losses [26,30], and changes the shape of plants [31,32,33].
Studies of downwash airflow from multirotor UAV sprayers are essential for increasing our understanding of the performance characteristics of UAV sprayers. Researchers used an anemometer to measure downwash airflow in a real application of a UAV sprayer [34,35,36] and carried out a large number of field spray tests [4,5,6,7,8,9,10,11,12,37]. These data not only reflect the final effect of downwash airflow on droplet deposition and drift more realistically, but also provide a reference for the reasonable selection of UAV sprayer types and their application parameters. However, due to uncontrollable environmental conditions (ambient wind speed magnitude and direction, etc.) and limited test costs, test equipment, and test methods, it is not yet possible to obtain the complete spatiotemporal distribution of downwash airflow and local vortex patterns of UAV sprayers through field tests [19]. Numerical simulation technology can effectively solve the above problems and complement field measurement. To this effect, this approach has become a mainstream research tool for the downwash airflow from UAV sprayers.
At present, researchers have simulated the downwash airflow from single-rotor [38,39,40], quadrotor [41,42,43], six-rotor [30,44,45,46,47], and eight-rotor [48] UAV sprayers. These research contents were mainly focused on the spatiotemporal distribution of the downwash airflow and its influence on droplet movement under various application parameters (flight speed, flight altitude, load, etc.) of specific UAV sprayers. However, more importantly, these published studies seldom pay attention to the accuracy of the input values of the simulation parameters in fluid software. On the one hand, it is important to acquire acceptable simulation results; on the other hand, multirotor UAV sprayers are equipped with fixed pitch propellers that are only operated by varying rotor speed. For a specific multirotor UAV sprayer, the rotor speed and pitch angle are different under various application parameters, resulting in different downwash airflows as determined by flight principles [49]. Generally, a stronger downwash airflow can enhance spray penetration in canopies and reduce spray drift from natural wind [26]. However, current studies on the numerical simulation of downwash airflow have not paid enough attention to the above problem. This is not conducive to obtaining reliable simulation results.
To date, simulation parameters (rotor speed and pitch angle) have been obtained through the following paths: (1) calculating them according to the dynamic model; (2) Output data from flight records; (3) direct measurement with the measuring system. Path 1 is mainly used in the theoretical design stage of multirotor UAVs, which may not reflect the data of UAV sprayers in real applications; some parameters involved in the dynamic model are still determined through complex experiments [50,51]. Path 2 remains the most viable path for obtaining simulation parameters, but it is limited by the fact that the flight record of UAV sprayers in the market does not contain data on rotor speed and pitch angle, and the flight controller of commercial UAV sprayers is not open source. Therefore, it is quite difficult to output the pitch angle value from the attitude sensor provided by the UAV sprayer. More importantly, various sensors equipped with UAV sprayers cannot output rotor speed values. However, rotor speed is an important input parameter in the numerical simulation of downwash airflow using fluid software, such as Fluent, XFlow, etc. Considered comprehensively, Path 3 not only obtains the actual data of rotor speed and pitch angle in UAV sprayer applications, but it also does not require complicated flight control and attitude calculation expertise; thus, it is the most feasible choice at present. However, most of the existing measurement equipment comprises platforms in the laboratory to measure the dynamic parameters of one rotor or a mini-aircraft [52,53,54,55]; this is not suitable for monitoring the simulation parameters of the multirotor UAV sprayer in real-time.
Currently, only a few published studies on the numerical simulation of downwash airflow have concerned themselves with changes in rotor speed and pitch angle of multirotor UAV sprayers under varied application parameters. This work aims to monitor the real simulation parameters of multirotor UAV sprayers in an application through a specially designed wireless simulation parameter measurement system (WSPM-System). The system consists of hardware and software designed based on Arduino and LabVIEW, respectively. Wireless communication was realized by nRF24L01. Meanwhile, to evaluate system performance and collect simulation parameter data, a system test experiment and a simulation parameters measurement experiment were carried out. Eventually, the data obtained from WSPM-System were successfully applied in the numerical simulation of downwash airflow according to the lattice Boltzmann method (LBM).

2. Materials and Methods

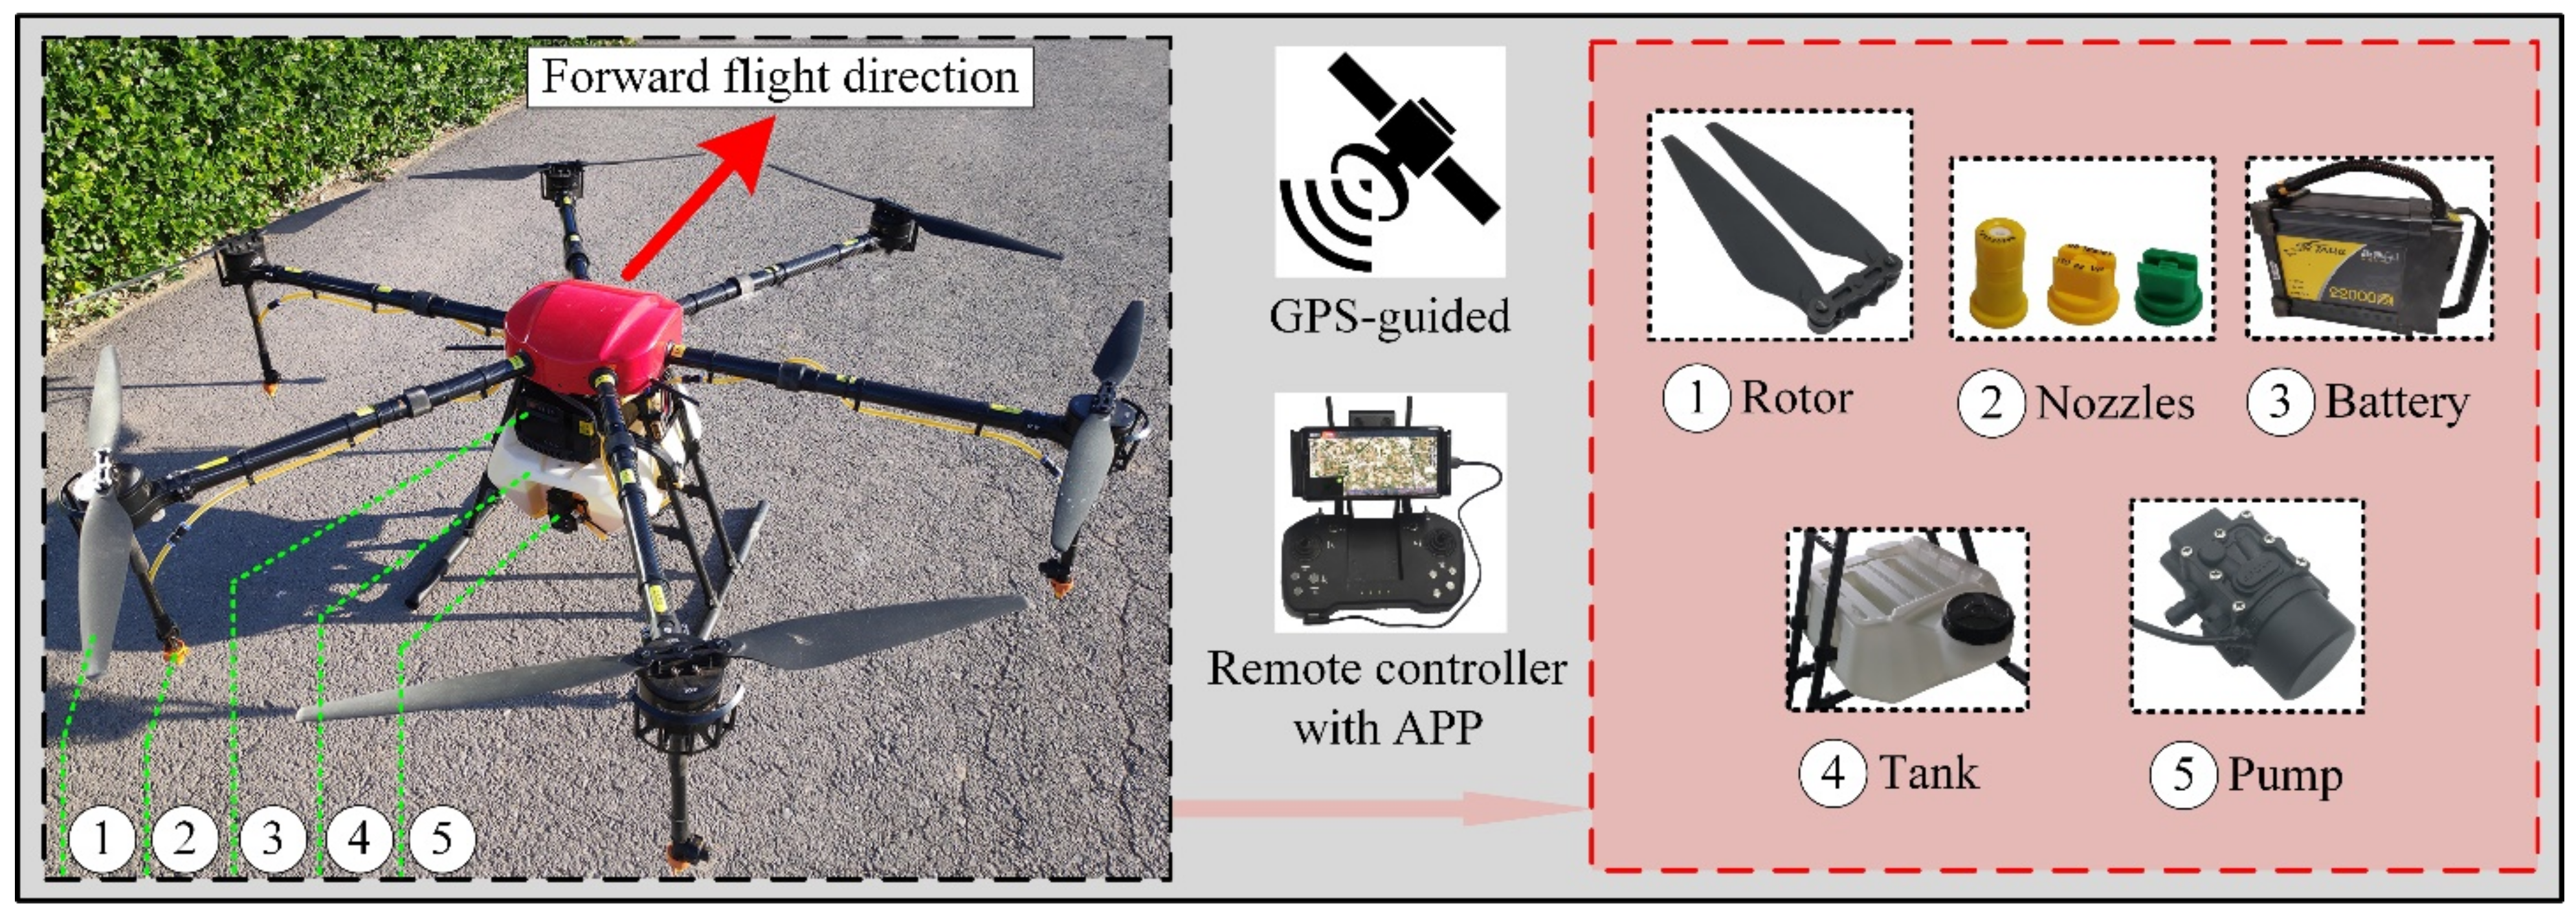
2.1. Multirotor UAV Sprayer

Experimental tests were performed using an electric six-rotor UAV sprayer (DF-16L, Henan Difengde Aviation Technology Co., Ltd., Zhoukou, China), which is commonly used in China (Figure 1). A tank with a 16 L capacity was equipped on the UAV sprayer with four replaceable nozzles. When spraying different crops, the application parameters were different according to the manufacturer’s recommendation. In addition, the system was fitted with a GPS-guided autonomous flight device to remotely control the UAV sprayer in each spray application. The specifications and parameters of the UAV sprayer are listed in Table 1.

2.2. Wireless Measurement System

The hardware and software of the WSPM-System were designed with a keen consideration of real application scenarios. The hardware was for data collection and transmission, whereas the software was for data reception, display, and storage. In this work, the hardware design was according to the Arduino (www.arduino.cc, accessed on 21 December 2020) open-source platform with low cost and a short development cycle, and used sensors and the wireless module compatible with the open-source philosophy. The LabVIEW (www.ni.com, accessed on 1 September 2021) platform was adapted to develop the software. The system framework is as shown in Figure 2.

2.2.1. Hardware Design

Considering the real-time monitoring of rotor speed and pitch angle data of the UAV sprayer in real applications, the hardware needed to be installed on the UAV sprayer. On this note, it was vital for the size and weight of the hardware to be as small as possible in addition to having an anti-interference capability in the dynamic environment. The design had six identical Hall sensors that were for monitoring the rotor speed of the six-rotor UAV sprayer. Each Hall sensor individually monitored the change in one rotor speed. Compared to a photosensitive sensor, the Hall sensor can effectively avoid the impact of dust and light and is more suitable for the application environment of a UAV sprayer. An attitude sensor (JY61, WitMotion Shenzhen Co., Ltd., Shenzhen, China) was selected to monitor the change in pitch angle, which was equipped with the MPU6050. The MPU6050 devices combine a 3-axis gyroscope (±250/500/1000/2000°/s) and a 3-axis accelerometer (±2/4/8/16 g) on the same silicon die. The attitude sensor JY61 integrates an attitude solver, the Kalman filter algorithm, to acquire accuracies of 0.05° and 0.1° under static and dynamic conditions, respectively (www.wit-motion.com, accessed on 19 March 2021).
In addition to sensors for monitoring data, the hardware of the WSPM-System also included a wireless module, an Arduino board, and a lithium battery. The nRF24L01 of a low-power wireless transceiver chip was selected as the wireless module, which worked in the 2.4 GHz universal ISM band. This module contains the transmitter used by the MCU (TTL-nRF24L01) and the receiver used by the computer (USB-nRF24L01). An Arduino Mega 2560 (Rev3) was used as a datalogger due to its memory capacity and the number of IO ports. It is a microcontroller board based on the ATmega2560 and has 54 digital input/output pins, 16 analog inputs, and contains everything needed to support the microcontroller (www.arduino.cc, accessed on 21 December 2020). More importantly, it has six digital pins for interrupt, which was required for simultaneous monitoring of the six rotors in real-time. To connect multiple components on an Arduino Mega 2560 board, an expansion board was selected to expand the number of Vin and GND pins. In addition, a 9 V/11,800 mAh lithium battery was used to directly power the system through the direct current (DC) power jack. The basic parameters and appearance of the hardware can be seen in Table 2.
The code was developed in the open-source Integrated Development Environment (IDE) of Arduino. The function format of external interrupt was ‘attachInterrupt (interrupt, function, mode)’. As shown in Equation (1), it evaluates the rotor speed by calculating the time required to complete one lap. The RISING was selected to trigger when the pin went from low to high. Additionally, it contained the Wire library required for the I2C communication protocol used by the MPU6050; this open-source library can be found in the GitHub repository (www.github.com, accessed on 15 March 2021). Although the roll angle, yaw angle, and pitch angle data can be obtained from the JY61, only the pitch angle data were needed as output data in this study. All the data of rotor speed (1−6) and pitch angle were sent to the serial port where the nRF24L01 was connected according to the preset sampling interval, using the Arduino serial commands
n = 6 × 10 7   /   ( m i c r o s t + 1 m i c r o s t )
where n is the rotor speed, rpm; microst is the trigger moment of the t-th, microsecond; microst+1 is the trigger moment of the (t + 1)-th, microsecond.
The hardware integration and installation effects are shown in Figure 3. The Arduino board was packaged with a 3D printed shell, and the interface of six Hall sensors and one JY61 were reserved. Then, it was mounted on the landing gear of the UAV sprayer together with the lithium battery. According to the rotor numbers in Figure 3f, the Hall sensors were installed in sequence. Since the rotor was fixed on the brushless motor to rotate synchronously, the magnet was fixed on the brushless motor. To ensure measurement accuracy, the horizontal mounting distance of the Hall element to the magnet fixed on the brushless motor was <5.0 mm [30]. In addition, since only the pitch angle data were collected from the attitude sensor, JY61, the installation of the JY61 did not require its coordinate system to coincide with the fuselage coordinate system of the UAV sprayer. However, the XOY plane of the JY61 coordinate system should be parallel to the X’O’Y’ plane of the fuselage coordinate system as much as possible. At the same time, the directions of X and X’, Y and Y’ axes should be consistent, respectively. The total weight of the hardware was about 0.95 kg, accounting for 2.6% and 2.3% of the standard take-off weight and maximum take-off weight, respectively; this did not affect the flight performance of the UAV sprayer. In addition, this total weight was counted in the load of the simulation parameters measurement experiment.

2.2.2. Software Design

The graphical user interface (GUI) of the software was designed based on LabVIEW, and the VISA tool was used to realize serial communication to receive data. VISA is a protocol to provide communication between LabVIEW and any other device. The GUI and program block diagram of the WSPM-System can be seen in Figure 4. The data from the hardware were inputted through the serial wireless module at a 115,200 baud rate. The seven parameters (rotor speed 1–6 and pitch angle) were displayed on the front panel of LabVIEW in the form of a linear graph and table. Meanwhile, the data were written into a file (Excel.CSV) in real-time. The detailed application is divided into three main stages: hardware preparation, connection to GUI, and data collection (Figure 5). In the first stage, the code runs just after powering up the Arduino; after that, the system initialization is completed through establishing a communication between the sensors and the devices. Finally, a time-based sample of the sensors is performed, and then data transmission is completed according to the preset sampling interval in a loop mode. In the second stage, the VISA tool completes initialization after starting the GUI of the software. Then, we selected the correct COM device and baud rate, and then clicked ‘OPEN’ to complete the connection and started receiving data continuously. In the third stage, the data are written into the linear graph, table, and Excel.csv, respectively. We then clicked ‘CLOSE’ to stop the data writing, and then clicked ‘OPEN’ to restart the data writing and generate a new Excel.csv or exit the system. The data recorded in Excel.csv are then ready for data analysis.

2.3. Experiment Scheme

2.3.1. Wireless Simulation Parameter Measurement System Test Experiment

Firstly, the communication performance of the system was tested. Considering the actual application demand of the system, wireless communication was used to transmit data; the variables tested mainly included sampling interval and communication distance. The evaluation index of the test was packet loss rate. Richer monitoring data can be obtained with a higher sampling frequency, and the application of the system within the valid communication distance can ensure that the data are collected in real-time and completely by the software. To this effect, the tests were carried out under communication distances of 80, 100, and 120 m. There were no obvious obstacles at the tests site. Meanwhile, another variable that needed to be controlled was the sampling interval. The study considered intervals of 0.1, 0.5, and 1.0 s.
Secondly, the stability of the data collected by the system was tested under good communication performance. Since six identical Hall sensors were used, only the rotor speed data monitored by one of the Hall sensors were tested. The rotor speed data collected from the WSPM-System were compared with the reference data collected from the RC41 tachometer (±0.5‰ to ±1.5‰ rpm, Jintan Runchen Electric Appliance Factory, Changzhou City, Jiangsu Province, China). Considering that the accuracy of the system may be affected by rotor speed size, the tests were carried out under five gradients. In addition, to verify whether the attitude sensor was accurately positioned, the pitch angle data monitored by the attitude sensor were tested under three gradients. The UAV sprayer was placed on a flat ground, inclined 0°, 5°, and 10°, respectively. A laser rangefinder (±0.3°, MILESEEY®, Shenzhen, China) was used to calibrate these angles.

2.3.2. Simulation Parameters Measurement Experiment

To collect simulation parameters of the UAV sprayer under various application parameters, the simulation parameters measurement experiment was carried out based on the specially designed WSPM-System. The experiments were conducted in Tongzhou Experimental Station of China Agricultural University, Beijing, China (39°42′4.82″ N, 116°41′24.66″ E) in March 2021 (Figure 6a). The experimental area was a wheat field with dimensions of 200 m × 100 m. On average, the plants’ growth height was about 7 cm. During the experiments, meteorological data were monitored in real-time using a Kestrel® 4500 Weather & Environmental Meter (Nielsen-Kellerman Co., Boothwyn, PA, USA). Weather parameters including temperature, relative humidity, ambient wind speed magnitude, and direction were recorded every two seconds. To avoid the impact of downwash airflow from the UAV sprayer, the weather meter was about 40 m from the nearest flight route. The maximum ambient wind speed throughout the day occurred in the afternoon (after 12:00) with a southerly wind (160°–220°), less than 3 m s−1, and there was almost no ambient wind in the morning (7:00–11:00). To minimize the impact of ambient wind on the flight performance of the UAV sprayer, the measurement window with almost no ambient wind was selected for each treatment according to the wind speed displayed by the meteorological meter in real-time. Once the ambient wind speed exceeded 1 m s−1, the experiment was stopped immediately, and the next measurement window waited. As shown in Figure 6b, a laptop with the software of the WSPM-System was placed on the western side of the experimental area 10 m away from the UAV sprayer flight route (from A to B) to collect data. The forward flight distance was maintained at about 150 m. This allowed the system to not only collect rich data but also to collect data that were transmitted stably within the valid communication distance.
Based on the flight principle of multirotor UAV [49], different loads need different rotor speeds to provide lift, which leads to different downwash airflow. In theory, different flight speeds correspond to different pitch angles, and the pitch angle is 0° in the hovering state. Meanwhile, a change in flight altitude can change the spatiotemporal distribution of downwash airflow, and the lift of the rotor may change due to the ground effect [56], which leads to change in rotor speed. Therefore, the simulation parameters measurement experiment was conducted in three steps.
Step 1—The simulation parameters of the UAV sprayer while hovering were measured. Since the downwash airflow had a significant backward tilt when the UAV sprayer was flying forwards [30], the hovering state was more susceptible to ground effects under the same load and flight altitude. Within the tank capacity of the UAV sprayer, four load gradients were selected (LG = 4, 8, 12, and 16 kg). Considering the normal operation height recommended by the manufacturer, three flight altitude gradients were selected (FA = 2, 3, and 4 m) for each load gradient, which resulted in a total of twelve treatments. Considering the proportion of the hardware weight of the WSPM-System, the evaluated weights of water added to the tank were 3.05, 7.05, 11.05, and 15.05 kg. The measurement position was at point A (Figure 6b), and, for each treatment, after the UAV sprayer was hovering steadily, the data were collected continuously, and the time was about one minute.
Step 2—The simulation parameters of the UAV sprayer in forward flight were measured. Based on the tests and analysis obtained in the first step, the flight altitude was fixed at 3 m in this step. Similar to the treatments in the first step, four load gradients of 4, 8, 12, and 16 kg were selected. According to the normal flight speeds recommended by the manufacturer, seven flight speed gradients (FS = 1, 2, 3, 4, 5, 6, and 7 m s−1) were selected for each load gradient, which resulted in a total of twenty-eight treatments. As shown in Figure 6b, for each treatment, after the hovering of the UAV sprayer stabilized at point A, the software of the WSPM-System was opened to collect data and forward flight after about ten seconds. The mean value of the pitch angle collected within the ten seconds was used to correct the pitch angle in the forward flight. After about 150 m forward flight, the software of the WSPM-System was closed at point B.
Step 3—The vertical downward velocity (VVD) of downwash airflow from the UAV sprayer in hovering was measured. Previous studies [30,44] indicate that the VVD is the main body of the airflow velocity in the downwash airflow, which plays a key role in droplets’ delivery to the target during the spraying and can improve the deposition of droplets in the crop canopy. As shown in Figure 6c, airflow velocity was measured using six hot wire anemometers (Testo 405i, Titisee-Neustadt, Germany). The six hot wire probes (#1, #2, #3, #4, #5, and #6) were evenly distributed on circles of a radius of 0.82 m and located directly below rotors 1, 2, 3, 4, 5, and 6. To avoid the effect of the ground spreading airflow, the hot wire probe was 1 m away above the ground [30]. The anemometer recorded data every two seconds and transmitted them via Bluetooth to an application on a smartphone. For each case, after the UAV sprayer was hovering steadily at point A, the Smart Probe APP was opened to collect data and then closed after about one minute. Subsequently, the calculated average velocity was recorded as VVD of the marked point [30]. Finally, the data of VVD were used in a numerical approach for validation.

2.3.3. Numerical Simulation of Downwash Airflow

The simulation parameter data from the WSPM-System were used in the numerical simulation of downwash airflow from the UAV sprayer. A total of six cases considering application parameters (flight altitude and load) in hovering were selected to evaluate the distribution characteristics of downwash airflow. Initial conditions are listed in Table 3.
A full-scale three-dimensional (3D) model of the UAV sprayer was created for numerical simulation. As shown in Figure 7, the fuselage was modeled in Creo Parametric 2.0 (PTC Inc., Boston, MA, USA) software; a 3D optical scanner (Zhanhao Industrial Design Co., Ltd., Shenzhen, China) was used to scan the rotor to generate point cloud data, and then the rotor’s 3D model was reconstructed by Geomagic Studio (Geomagic Inc., Research Triangle Park, NC, USA) software. The computational domain was set up as a virtual wind tunnel forming a cuboid with length × width × height (12 m × 12 m × (FA + 2) m). The lattice Boltzmann method (LBM) was used to simulate the downwash airflow from a mesoscopic point of view. This approach not only avoids the numerical dissipation problem that may be caused by manually dividing the grid but also has a strong dynamic adaptive refinement ability for the prediction of turbulent wakes. More detailed information about the turbulence model, boundary conditions, and spatial discretization used in this study is shown in a previous study [30]. At t = 1.3 s, the airflow in the computational domain fully dispersed in all cases studied, and this study adopted this value as the simulation time.
The simulations were carried out using XFlow 2017x (Dassault Systèmes) software with an Intel(R) Xeon(R) Platinum 8280L CPU @ 2.7GHz Server (28 cores, 2 CPUs, 2.7 GHz, 256 GB RAM), and the computational cost was about 224 days per core.

2.4. Data Analysis Method

2.4.1. Optimized Extraction of Simulation Parameter Data

The simulation parameter data from the WSPM-System needed to be optimized and extracted to reduce accidental errors and ensure reliability. For each treatment, seven parameters with ni (i = 1, 2, 3, 4, 5, 6) and θ were included in the original data set. At first, the data of each parameter was arranged in ascending order; then 10% of the data in both the front and rear sides was deleted. The remaining 80% of the data were used to calculate the mean value of each parameter. The calculating equations are as follows:
n i = j = 1 M 1 X j ( k = 1 M 0.1 X k + l = M 0.9 M 1 X l ) M 0.9 M 0.1 ;   i = 1 ,   2 ,   3 ,   4 ,   5 ,   6
θ = p = 1 N 1 Y p ( q = 1 N 0.1 Y q + s = N 0.9 N 1 Y s ) N 0.9 N 0.1
where ni is the mean value of i-th rotor speed (rpm); θ is the mean value of pitch angle (°); Xj, Xk, and Xl are the original data (j [1, M1]) of rotor speed, the front 10% data (k [1, M0.1]), and the rear 10% data (l [M0.9, M1]) after sorting in ascending order, respectively; Yp, Yq, and Ys are the original data (p [1, N1]) of pitch angle, the front 10% data (q [1, N0.1]), and the rear 10% data (s [N0.9, N1]) after sorting in ascending order, respectively; M1, N1, M0.1, N0.1, M0.9, and N0.9 are the number of data after sorting in ascending order and are the integer (M0.1 < M0.9 < M1; N0.1 < N0.9 < N1).
After data extraction was completed and the mean values (ni and θ) calculated according to Equations (2) and (3), the acquired values were subsequently used for the data analysis and numerical simulation.

2.4.2. Analysis Method of Collected Data Stability

The coefficient of variation (CV) was used as an indicator for the stability of the collected data in this paper. A lower CV value indicates better stability of collected data. For comparing the variability among several data groups without the same unit of measurement or the mean value, the CV was applied more meaningfully and widely than the standard deviation [57]. This is because the CV is the relative variation and a dimensionless measure. The calculating formula is as follows:
C V = S D M × 100 %
where CV is the coefficient of variation (%); M is the value of ni or θ (rpm or °); SD is the standard deviation value of rotor speed or pitch angle (rpm or °).

2.4.3. Regression Analysis

Unary linear regression analysis for each treatment in the simulation parameters measurement experiment was performed to produce the regression equations with FS as an independent variable and ni, and θ as dependent variables, respectively. For the simple linear regression model, it is assumed that the error has constant variance. However, when fitting the experimental data, the instrument error may need to be considered (which reflects the accuracy and precision of a measuring instrument). Therefore, the assumption of constant variance in the error is violated. Thus, it is necessary to assume εm to be normally distributed with nonconstant variance, and the error acts as variance, which can be used as a weight in fitting (www.originlab.com/doc/Origin-Help, accessed on 15 April 2021). The equations are as follows:
y = β 1 x + β 0 + ε
J ( β 1 , β 0 ) = 1 N m = 1 N w m ( y m β 1 x m β 0 ) 2
where β1 is the slope and β0 is the intercept; ε is a random error term; N is the total number of data points; xm and ym are the independent variable and dependent variable of m-th data point, respectively; wm is the weighting factor of m-th data point; wm = 1/ σ m 2 , σ m 2 is the variance.
The regression analysis was performed using the OriginPro 2018C (OriginLab Corporation, Northampton, MA, USA) software package.

2.4.4. Numerical Approach to Validation

The lattice Boltzmann method (LBM) has been successfully used in previous studies [30,38,39,40,41]. Nevertheless, taking into account the difference between the UAV sprayer type and the measurement scenario, Step 3 in the simulation parameters measurement experiment was carried out to verify the reliability of the LBM. Initially, for each case, six sensors were established in the computational domain to monitor and output the simulated values of VVD over time. The position of the sensor corresponded to the hot wire probe in Step 3. After the downwash airflow stabilized (from 1.0 to 1.3 s), the simulated values were extracted and averaged, which were the final simulated values of the marked point. Then, a comparison between the measured and simulated values of the mean VVD was carried out through correlation analysis.

3. Results

3.1. Performance Test of the WSPM-System

As shown in Table 4, data loss was not found within a communication distance of 80 m. When the communication distance was 100 m, the packet loss rate was 1%; when the communication distance was 120 m, the packet loss rate increased, but not above 4%. The test results further showed that the sampling interval had no great effect on data transmission. In addition, the communication performance tests were also carried out at 140 m, but the results are excluded in Table 4. This was because the communication distance may have reached the limit of the nRF24L01, and there was almost no data transmission. Based on the above results and analysis, although this system can be used for data collection at 120 m, the valid communication distance adopted in this study was 100 m to ensure a good transmission effect in a dynamic environment. To obtain the richest data within a limited valid communication distance, a sampling interval of 0.1 s was considered in the simulation parameters measurement experiment.
The results of the stability of the collected data are shown in Table 5. Comparing the results of rotor speed measured under five gradients, there was no significant difference in the mean value (M), the standard deviation (SD), and the coefficient of variation (CV) between WSPM-System and RC41. This indicated that the data collection of the system designed in this study was reliable. Although within the test range the SD value increased to a certain extent with the measured rotor speed, the increase was not more than ±23 rpm. The minimum and maximum values of CV from the WSPM-System and RC41 appear in Text.1 (0.46% and 0.33%, respectively) and Text.2 (1.42% and 1.05%, respectively). Comparing the results of pitch angle measured under three gradients (0°, 5°, and 10°), the M values calculated from the data collected from WSPM-System were 0.36°, 4.97°, and 10.14°, respectively. All SD values were 0.01°; however, they decreased successively to 1.82%, 0.15%, and 0.10%, respectively. Considering that the angle measurement accuracy of the laser range finder used was not high, this implied that the JY61 installation position was relatively correct. Therefore, in the simulation parameters measurement experiment, the pitch angle was also corrected.

3.2. Simulation Parameters in Hovering

For Step 1, as can be seen in Figure 8, the six rotor speeds were basically same for each treatment, with SD values not more than ±27 rpm. Meanwhile, the six rotor speeds had the same distribution pattern under the three flight altitude gradients with the same load. This was translated to mean that the flight altitude had no effect on the rotor speed within the measurement range, i.e., no ground effect was found. Note that, due to limited experimental scenarios, these results apply to similar crop and ground conditions (the average height of wheat about 7 cm) as well as this specific type of UAV sprayer. However, it was observed that the rotor speed changed with the load. When the loads were 4, 8, 12, and 16 kg, the rotor speeds were maintained about at 2097, 2404, 2706, and 3001 rpm, respectively. As the load changed from 16 kg to 4 kg, the rotor speed dropped about 30%. This observation was in agreement with the analysis results based on its flight principle. Therefore, these results suggested that the input value of the rotor speed in the fluid software needed to be determined according to the application parameters of the UAV sprayer.
Figure 9 shows the measured pitch angle values in the hovering UAV sprayer as a box chart. It can be seen that the total mean value of the pitch angle was −1.41°. This means that even if the UAV sprayer were hovering, there may be differences between the measured pitch angle and the theoretical value (0°). Therefore, to obtain a more accurate pitch angle value of the UAV sprayer at various flight speeds, not only does the JY61 attitude sensor need to be installed in the correct position, but the measurement of the pitch angle in hovering is also necessary for its correction in forward flight.

3.3. Simulation Parameters in Forward Flight

For Step 2, the mean values of measured rotor speed in forward flight of the UAV sprayer are presented in Figure 10. All the SD values were not more than ±30 rpm. As can be seen in Figure 10, under four load gradients, six rotor speeds (n1, n6; n3, n4; n2, n5) showed a similar trend with an increase in FS. Specifically, the rotor speeds in the front (n1 and n6) decreased with an increase in FS and the rotor speeds in the rear (n3 and n4) increased with an increase in FS. It was noted that the rotor speeds in the middle (n2 and n5) did not change with an increase in FS. Combining these values with the regression equations analysis, it can be found that R2 values more than 0.95 (maximum, 0.998; minimum, 0.955) indicate a negative linear correlation between the rotor speeds in the front (n1, n6) and FS; there was a positive linear correlation between the rotor speeds in the rear (n3, n4) and FS. On the contrary, R2 values less than 0.12 (maximum, 0.118; minimum, 0.003) indicated that there was no correlation between the rotor speeds in the middle (n2, n5) and FS. More importantly, n1, n6, and n3, n4 decreased or increased at almost the same rate. Based on these data, as the FS increased from 1 m s−1 to 7 m s−1, the rotor speeds in the front and rear changed about 10% (n1 and n6 decreased, n3 and n4 increased).
Figure 11 shows the measured pitch angle values in the forward flight of the UAV sprayer, which had been corrected using the collected data in hovering. It can be seen that, for all load gradients, the pitch angle increased with an increase in FS. Combining the regression equations analysis, it can be found that R2 values greater than 0.94 (maximum, 0.945; minimum, 0.992) indicate a positive linear correlation between the pitch angle and FS. On the whole, the pitch angle increased from 0.79° to 5.80° when the FS was increased from 1 m s−1 to 7 m s−1; these values were calculated based on the mean values of the four load treatments.

3.4. Simulation Results of Downwash Airflow

Figure 12 shows the vorticity distribution diagram of downwash airflow while hovering from the front view. The axial view and the top view are given in Figure A1. The results of Step 1 revealed that the change in flight altitude did not affect rotor speed. However, the impact of flight altitude on the downwash airflow distribution can be observed in Figure 12a–c. Specifically, as the flight altitude increased, the vorticity under the fuselage decreased, which implied that the vortex motion of the downwash airflow with a lower flight altitude was stronger at the same load. In addition, the range of ground spreading airflow also decreased to a certain extent with increased flight altitude (Figure A1a–c). More importantly, the change in flight altitude led directly to the change in downwash airflow velocity. Figure 13 presents the distribution of VVD on the horizontal detection surface; the distance between the detection surface and the ground is 1 m. The negative value of VVD indicates that the velocity direction is vertical upwards. As shown in Figure 13a–c, as the flight altitude increased, the distribution of larger VVD was transferred from the surrounding area to the central area. For FA = 2 m, the direction of VVD in the central area was vertical upwards with a maximum value of 7.9 m s−1 (Figure 13a). This phenomenon did not appear in other cases.
Additionally, the results of Step 1 revealed that the load affected the rotor speed. From Figure 12b,d,e,f, it was observed that, as the load increased, the vorticity under the fuselage increased, meaning that the vortex motion of the downwash airflow with a larger load was stronger at the same flight altitude. In addition, the range of ground spreading airflow also increased to a certain extent with the increase in load (Figure A1b,d,e,f). For different loads, the distribution of VVD on the horizontal detection surface is shown in Figure 13b,d,e,f, respectively. It was observed that VVD increased with the load. It is worth noting that, when the loads were 4, 8, 12, and 16 kg, the maximum VVD values were 13.8, 16.2, 18.3, and 17.9 m s−1, respectively. The maximum value of VVD on the horizontal detection surface dropped about 23% when the load was changed from 16 kg to 4 kg. For LG = 16 kg, although the maximum value of VVD decreased compared with the other three load gradients, the VVD values greater than 15 m s−1 had a larger distribution range. Moreover, as shown in Figure 14, an R2 value of 0.91 indicated a good correlation between the measured and simulated values of the VVD.

4. Discussion

The use of UAV sprayers for spraying pesticides has rapidly developed in China and has been widely used in commercial applications in recent years. According to preliminary statistics from the National Agro-Tech Extension and Service Center, as of mid-November 2020, the number of UAV sprayers in use for agriculture was about 80,000, and the operating area was nearly 53 million hectares [58]. Given its advantages, the environmental risks caused by off-target losses of pesticides due to factors such as downwash airflow should be concerns for farmers, researchers, manufacturers, regulators, and decision makers. However, very few published studies on the numerical simulation of downwash airflow consider the value of rotor speed and pitch angle as inputs in fluid software based on the application parameters of UAV sprayers. The WPSM system designed in this study can contribute to providing accurate input parameters for the future numerical simulation of downwash airflow from UAV sprayers, and it is expected to contribute to in-depth understandings of downwash airflow characteristics in real spray applications.
In experiments, not only was the performance of the WSPM-System tested, but so was the simulation parameter data of the multirotor UAV sprayer when hovering and in forward flight. According to the result obtained from the communication performance test, the valid communication distance of the WSPM-System was 100 m with a packet loss rate of less than 1%, which meets the basic requirements of the simulation parameters measurement experiment set out in this paper. In addition, the test results of the stability of the collected data indicated that data collected using the WSPM-System designed in this study was reliable. For rotor speed, there was no significant difference in the M, SD, and CV values between the WSPM-System and RC41 (Table 5). For each treatment, the pitch angle in hovering was used for pitch angle correction in forward flight. The objective of this step was to ensure that the pitch angle data of the UAV sprayer could be accurately monitored by JY61.
When the UAV sprayer was hovering, the impact of flight altitude on rotor speed was not found (Figure 8). In other words, the ground effect did not affect the rotor lift. On the contrary, load had a significant effect on rotor speed, which dropped about 30% when the load was changed from 16 kg to 4 kg. Since the three flight altitude gradients selected in this study were the conventional application altitudes of the UAV sprayer, the impact of flight altitude on the next measurements of stimulation parameters with a similar scenario (field crops) can be ignored. However, it is worth noting that the application technique of UAV sprayers in field crops has become increasingly mature, more and more manufacturers and service organizations have paid attention to their application in economic crops of higher additional value, especially orchards [26]. On the one hand, there is a huge difference in the crop canopy between field crops and orchards; on the other hand, tree canopies have an important effect on the distribution characteristics of downwash airflow [46,47]. Therefore, when the UAV sprayer is used for spraying in orchards, it is still unclear whether the flight altitude can be ignored in the measurement of simulation parameters.
When the UAV sprayer was in forward flight, an impact of flight speed on the rotor speed and pitch angle was found (Figure 9 and Figure 10). More importantly, the rotor speed in a symmetrical position showed the same law (n1 and n6; n3 and n4; n2 and n5). This means that, in more subsequent simulation parameters measurement experiments, for quadrotor, six-rotor, and eight-rotor UAV sprayers with a symmetrical layout, only half of the rotors need to be monitored. Although the applicability of the WSPM-System to other types of multi-rotor UAV sprayers has been expanded, it is necessary to note that all rotors need to be monitored when an experiment is carried out in a dynamic environment. Under the impact of a crosswind or a complicated flight attitude, the rotor speed may change according to different laws. In addition, the pitch angle showed a positive linear correlation with FS (R2 > 0.94), which increased from 0.79° to 5.80° when the FS increased from 1 m s−1 to 7 m s−1. The flight speed of 1–7 m s−1 corresponded to the pitch angle of 1–7°, which was used by Wen et al. [41] in their simulation of a quadrotor UAV sprayer for pesticide applications. This difference can be attributed to the different types of UAV sprayer.
The data of the rotor speed obtained from the WSPM-System were successfully applied in the numerical simulation of downwash airflow. The numerical simulation results revealed the impact of flight altitude and load on downwash airflow velocity. The correlation analysis of measured and simulated values of the VVD revealed that the numerical simulation of downwash airflow was reliable (R2 = 0.91). The distribution of larger VVD transferred from the surrounding area to the central area as the flight altitude increased. Only FA = 2 m, the vertical upward of VVD, appeared in the central area, and the maximum value was 7.9 m s−1. This observation can be explained by the evolution of the downwash airflow based on a previous study [30]. The evolution of the downwash airflow from the top to the ground produced a spiral wake vortex, a turbulent wake, a spreading airflow, and a vortex ring. Induced by the wingtip vortex, a spiral wake vortex appeared below the fuselage. As the airflow developed downward, the six spiral wake vortices approached each other so that serious interference occurred. This destroyed the spiral wake vortex structure, causing it to lose its coherence and diffuse into a turbulent wake. When FA = 2 m, the horizontal detection surface was located in the area where the six spiral wake vortices approached each other and caused interference, while the horizontal detection surface in other cases was located in the turbulent wake area. This also revealed that the spiral wake vortex was only distributed in a fixed area below the rotor, and was not affected by flight altitude.
The rotor speed dropped by about 30% as the load changed from 16 to 4 kg, which resulted in the maximum value of VVD on the horizontal detection surface dropping by about 23%. This means that, in a single spray application process of the UAV sprayer, the downwash airflow velocity gradually decreased as the liquid in the tank was released continuously; however, it was not clear whether the droplet deposition could be changed, making this phenomenon worthy of further exploration. For LG = 16 kg, the maximum value of VVD was smaller than for LG = 12 kg, which may be caused by the turbulence characteristics of downwash airflow. Moreover, the range of ground spreading airflow decreased or increased to a certain extent with the increase in flight altitude or load, respectively. This was caused by the difference in the lateral velocity of the ground spreading airflow. Simultaneously, this difference was also the reason for the different canopy-airflow vortex structures caused by the downwash airflow in the rice canopy [31].
For future developments, we identified the limitations of the WSPM-System that should be improved or supplemented. For instance, although the valid communication distance of 100 m was suitable for the simulation parameters experiment in this paper, the demand for a longer valid communication distance can be realized by replacing the wireless communication accessories. Secondly, the WSPM-System’s lithium battery (0.53 kg) accounts for 55.79% of the total hardware weight (0.95 kg). To expand the applicability of the WSPM-System, further work can be performed to highlight ways to reduce the weight of the lithium battery as much as possible under the premise of satisfying system performance through power consumption tests. In addition, we identified works that were worthy of being carried out based on the WSPM-System. The real data from WSPM-System will be used in the numerical simulation of downwash airflow from unmanned aerial vehicle (UAV) sprayers in an orchard to further explore the interaction effects between the downwash airflow and tree canopies.

5. Conclusions

In this work, to provide real data of simulation parameters (rotor speed and pitch angle) for the numerical simulation of downwash airflow, a WSPM-System was designed; the performance test results show that the system met the study requirements. The data of simulation parameters obtained from the WSPM-System revealed the effect of the UAV sprayer’ application parameters on rotor speed and pitch angle. On the one hand, the rotor speed dropped by about 30% when the load was changed from 16 kg to 4 kg while hovering. On the other hand, when the flight speed was increased from 1 m to 7 m s−1, the rotor speeds in the front and rear changed by about 10% (n1 and n6 decreased, n3 and n4 increased), and the pitch angle increased from 0.79° to 5.80°. Eventually, the data of the rotor speed obtained from the WSPM-System were successfully applied in the numerical simulation of downwash airflow. Additionally, the validated numerical simulation results show that, as the load changed from 16 kg to 4 kg, the maximum value of VVD on the horizontal detection surface dropped by about 23% due to the rotor speed dropping. This result means that the input value of the rotor speed in the fluid software needs to be determined according to the application parameters of the UAV sprayer. Based on the results in this study, the WSPM-System can be used to provide real data of simulation parameters for numerical simulations of the UAV sprayer’s downwash airflow and pesticide applications. This study has contributed to improving the reliability of this system’s numerical simulation results.

Author Contributions

Conceptualization, H.Z.; methodology, H.Z. and J.W.; software, H.Z.; validation, H.Z., J.W. and Z.L.; formal analysis, L.Q.; investigation, H.Z. and J.Z.; resources, L.Q.; data curation, J.Z.; writing—original draft preparation, H.Z.; writing—review and editing, L.Q., E.M.M. and P.W.; visualization, H.Z.; supervision, L.Q.; project administration, L.Q.; funding acquisition, L.Q. All authors have read and agreed to the published version of the manuscript.

Funding

This research was funded by the National Key Research and Development Plan of China (Grant No. 2017YFD0701400 and 2016YFD0200700), the National Natural Science Foundation of China (Grant No. 32001425), and the National Natural Science Foundation of Chongqing, China (Grant No. cstc2020jcyj-msxmX0414 and cstc2020jcyj-msxmX0459).

Institutional Review Board Statement

Not applicable.

Informed Consent Statement

Not applicable.

Data Availability Statement

Not applicable.

Acknowledgments

The authors would like to thank the financial support provided by the National Key Research and Development Plan of China, and Yunkai Li and Yanping Su (College of Water Resources & Civil Engineering, China Agricultural University) for providing the experimental site for this work.

Conflicts of Interest

The authors declare no conflict of interest.

Appendix A

Figure A1. Vorticity distribution diagram of downwash airflow in hovering with axis view and top view (t = 1.3 s). (a) FA = 2 m, LG = 16 kg; (b) FA = 3 m, LG = 16 kg; (c) FA = 4 m, LG = 16 kg; (d) FA = 3 m, LG = 4 kg; (e) FA = 3 m, LG = 8 kg; (f) FA = 3 m, LG = 12 kg.
Agriculture 11 01038 g0a1

References

  1. Ahmad, F.; Qiu, B.; Dong, X.; Ma, J.; Huang, X.; Ahmed, S.; Chandio, F.A. Effect of operational parameters of UAV sprayer on spray deposition pattern in target and off-target zones during outer field weed control application. Comput. Electron. Agric. 2020, 172, 105350. [Google Scholar] [CrossRef]
  2. Soheilifard, F.; Marzban, A.; Raini, M.G.; Taki, M.; Zelm, R. Chemical footprint of pesticides used in citrus orchards based on canopy deposition and off-target losses. Sci. Total. Environ. 2020, 732, 139118. [Google Scholar] [CrossRef] [PubMed]
  3. He, X.; Bonds, J.; Herbst, A.; Langenakens, J. Recent development of unmanned aerial vehicle for plant protection in east Asia. Int. J. Agric. Biol. Eng. 2017, 10, 18–30. [Google Scholar] [CrossRef]
  4. Xue, X.; Tu, K.; Qin, W.; Lan, Y.; Zhang, H. Drift and deposition of ultra-low altitude and low volume application in paddy field. Int. J. Agric. Biol. Eng. 2014, 7, 23–28. [Google Scholar] [CrossRef]
  5. Zheng, Y.; Yang, S.; Zhao, C.; Chen, L.; Lan, Y.; Tan, Y. Modelling operation parameters of UAV on spray effects at different growth stages of corns. Int. J. Agric. Biol. Eng. 2017, 10, 57–66. [Google Scholar] [CrossRef]
  6. Wang, G.; Lan, Y.; Qi, H.; Chen, P.; Hewitt, A.; Han, Y. Field evaluation of an unmanned aerial vehicle (UAV) sprayer: Effect of spray volume on deposition and the control of pests and disease in wheat. Pest. Manag. Sci. 2019, 75, 1546–1555. [Google Scholar] [CrossRef] [PubMed]
  7. Chen, P.; Ouyang, F.; Wang, G.; Qi, H.; Xu, W.; Yang, W.; Zhang, Y.; Lan, Y. Droplet distributions in cotton harvest aid applications vary with the interactions among the unmanned aerial vehicle spraying parameters. Ind. Crop. Prod. 2021, 163, 113324. [Google Scholar] [CrossRef]
  8. Tang, Y.; Hou, C.J.; Luo, S.M.; Lin, J.T.; Yang, Z.; Huang, W.F. Effects of operation height and tree shape on droplet deposition in citrus trees using an unmanned aerial vehicle. Comput. Electron. Agric. 2018, 148, 1–7. [Google Scholar] [CrossRef]
  9. Hou, C.; Tang, Y.; Luo, S.; Lin, J.; He, Y.; Zhuang, J.; Huang, W. Optimization of control parameters of droplet density in citrus trees using UAVs and the Taguchi method. Int. J. Agric. Biol. Eng. 2019, 12, 1–9. [Google Scholar] [CrossRef]
  10. Jorge, M.; Pablo, A.; Juan, A.; Manuel, P. Spray and economics assessment of a UAV-based ultra-low-volume application in olive and citrus orchards. Precis. Agric. 2019, 21, 226–243. [Google Scholar] [CrossRef]
  11. Meng, Y.; Su, J.; Song, J.; Chen, W.H.; Lan, Y. Experimental evaluation of UAV spraying for peach trees of different shapes: Effects of operational parameters on droplet distribution. Comput. Electron. Agric. 2020, 170, 105282. [Google Scholar] [CrossRef]
  12. Xuan, L.; Giles, D.K.; Niederholzer, F.J.; Andaloro, J.T.; Lang, E.B.; Watson, L.J. Evaluation of an unmanned aerial vehicle as a new method of pesticide application for almond crop protection. Pest Manag. Sci. 2021, 77, 527–537. [Google Scholar] [CrossRef]
  13. Yang, S.; Yang, X.; Mo, J. The application of unmanned aircraft systems to plant protection in China. Precis. Agric. 2018, 19, 278–292. [Google Scholar] [CrossRef]
  14. Wang, G.; Han, Y.; Li, X.; Andaloro, J.; Chen, P.; Hoffmann, W.C.; Han, X.; Chen, S.; Lan, Y. Field evaluation of spray drift and environmental impact using an agricultural unmanned aerial vehicle (UAV) sprayer. Sci. Total. Environ. 2020, 737, 139793. [Google Scholar] [CrossRef]
  15. Kharim, M.N.A.; Wayayok, A.; Shariff, A.R.M.; Abdullah, A.F.; Husin, E.M. Droplet deposition density of organic liquid fertilizer at low altitude UAV aerial spraying in rice cultivation. Comput. Electron. Agric. 2019, 167, 105045. [Google Scholar] [CrossRef]
  16. Teske, A.L.; Chen, G.; Nansen, C.; Kong, Z. Optimised dispensing of predatory mites by multirotor UAVs in wind: A distribution pattern modelling approach for precision pest management. Biosyst. Eng. 2019, 187, 226–238. [Google Scholar] [CrossRef]
  17. Wu, Z.; Li, M.; Lei, X.; Wu, Z.; Jiang, C.; Zhou, L.; Ma, R.; Chen, Y. Simulation and parameter optimisation of a centrifugal rice seeding spreader for a UAV. Biosyst. Eng. 2020, 192, 275–293. [Google Scholar] [CrossRef]
  18. Albert, S.; Amarilla, A.A.; Trollope, B.; Sng, J.D.J.; Setoh, Y.X.; Deering, N.; Modhiran, N.; Weng, S.H.; Melo, M.C.; Hutley, N.; et al. Assessing the potential of unmanned aerial vehicle spraying of aqueous ozone as an outdoor disinfectant for SARS-CoV-2. Environ. Res. 2021, 196, 110944. [Google Scholar] [CrossRef]
  19. Zhang, H.; Lan, Y.; Wen, S.; Xu, T.; Yu, F. Research progress in rotor airflow model of plant protection UAV and droplet motion mechanism. Trans. Chin. Soc. Agric. Eng. 2020, 36, 1–12. [Google Scholar] [CrossRef]
  20. Nienstedt, K.M.; Brock, T.C.M.; Wensem Joke Montforts, M.; Hart, A.; Aagaard, A.; Alix, A.; Boesten, J.; Bopp, S.K.; Brown Colin Capri, E.; Forbes, V.; et al. Development of a framework based on an ecosystem services approach for deriving specific protection goals for environmental risk assessment of pesticides. Sci. Total. Environ. 2012, 415, 31–38. [Google Scholar] [CrossRef] [Green Version]
  21. Pullan, S.P.; Whelan, M.J.; Rettino, J.; Filby, K.; Eyre, S.; Holman, I.P. Development and application of a catchment scale pesticide fate and transport model for use in drinking water risk assessment. Sci. Total. Environ. 2016, 563–564, 434–447. [Google Scholar] [CrossRef] [PubMed] [Green Version]
  22. Sybertz, A.; Ottermanns, R.; Schäffer, A.; Scholz-Starke, B.; Daniels, B.; Frische, T.; Bär, S.; Ullrich, C.; Roß-Nickoll, M. Simulating spray series of pesticides in agricultural practice reveals evidence for accumulation of environmental risk in soil. Sci. Total. Environ. 2020, 710, 135004. [Google Scholar] [CrossRef]
  23. Ellis, M.C.B.; van de Zande, J.C.; van den Berg, F.; Kennedy, M.C.; O’Sullivan, C.M.; Jacobs, C.M.; Fragkoulis, G.; Spanoghe, P.; Gerritsen-Ebben, R.; Frewer, L.J.; et al. The BROWSE model for predicting exposures of residents and bystanders to agricultural use of plant protection products: An overview. Biosyst. Eng. 2017, 154, 92–104. [Google Scholar] [CrossRef] [Green Version]
  24. European Union. Regulation (EC) No 1107/2009 of the European parliament and of the council of 21 October 2009 concerning the placing of plant protection products on the market and repealing council directives 79/117/EEC and 91/414/EEC. Off. J. Eur. Union. 2009, 309, 1–50. [Google Scholar]
  25. European Union. Directive 2009/128/EC of the European Parliament and of the Council of 21 October 2009 establishing a framework for Community action to achieve the sustainable use of pesticides. Off. J. Eur. Union. 2009, 309, 71–86. [Google Scholar]
  26. Wang, C.; Herbst, A.; Zeng, A.; Wongsuk, S.; Qiao, B.; Qi, P.; Bonds, J.; Overbeck, V.; Yang, Y.; Gao, W.; et al. Assessment of spray deposition, drift and mass balance from unmanned aerial vehicle sprayer using an artificial vineyard. Sci. Total. Environ. 2021, 777, 146181. [Google Scholar] [CrossRef] [PubMed]
  27. Qi, L.; Fu, Z. The droplet distribution on apple trees atomized by an air-assisted sprayer. Trans. Chin. Soc. Agric. Eng. 1998, 14, 135–139. [Google Scholar]
  28. Gu, J.; Zhu, H.; Ding, W. Unimpeded air velocity profiles of an air-assisted five port sprayer. Trans. ASABE 2012, 55, 1659–1666. [Google Scholar] [CrossRef]
  29. Hong, S.; Zhao, L.; Zhu, H. CFD simulation of airflow inside tree canopies discharged from air-assisted sprayers. Comput. Electron. Agric. 2018, 149, 121–132. [Google Scholar] [CrossRef]
  30. Hao, Z.; Lijun, Q.; Yalei, W.; Musiu, E.M.; Zhenzhen, C.; Pei, W. Numerical simulation of airflow field from a six–rotor plant protection drone using lattice Boltzmann method. Biosyst. Eng. 2020, 197, 336–351. [Google Scholar] [CrossRef]
  31. Li, J.; Shi, Y.; Lan, Y.; Guo, S. Vertical distribution and vortex structure of rotor wind field under the influence of rice canopy. Comput. Electron. Agric. 2019, 159, 140–146. [Google Scholar] [CrossRef]
  32. Shi, Q.; Liu, D.; Mao, H.; Shen, B.; Li, M. Wind-induced response of rice under the action of the downwash flow field of a multi-rotor UAV. Biosyst. Eng. 2021, 203, 60–69. [Google Scholar] [CrossRef]
  33. Tian, Z.; Xue, X.; Xu, Y.; Yang, F.; Sun, Z. Effect of plant protection UAVs downwash on crop canopy. Trans. Chin. Soc. Agric. Mach. 2021, 52, 40–48. [Google Scholar]
  34. Hu, L.; Zhou, Z.; Luo, X.; Wang, P.; Yan, Y.; Li, J. Development and experiment of a wireless wind speed sensor network measurement system for unmanned helicopter. Trans. Chin. Soc. Agric. Mach. 2014, 45, 221–226. [Google Scholar]
  35. Chen, S.; Lan, Y.; Bradley, K.F.; Li, J.; Liu, A.; Mao, Y. Effect of wind field below rotor on distribution of aerial spraying droplet deposition by using multi-rotor UAV. Trans. Chin. Soc. Agric. Mach. 2017, 48, 105–113. [Google Scholar] [CrossRef]
  36. Tang, Q.; Zhang, R.; Ding, C.; Chen, L.; Xu, M.; Xu, G.; Yi, T.; Wen, Y.; Li, L.; Deng, W. Application of ultrasonic anemometer array to field measurements of the downwash flow of an agricultural unmanned helicopter. Trans. ASABE 2019, 62, 1219–1230. [Google Scholar] [CrossRef]
  37. Richardson, B.; Rolando, C.A.; Kimberley, M.O.; Strand, T.M. Spray application efficiency from a multi-rotor unmanned aerial vehicle configured for aerial pesticide application. Trans. ASABE 2019, 62, 1447–1453. [Google Scholar] [CrossRef]
  38. Wen, S.; Han, J.; Lan, Y.; Yin, X.; Lu, Y. Influence of wing tip vortex on drift of single rotor plant protection unmanned aerial vehicle. Trans. Chin. Soc. Agric. Mach. 2018, 49, 127–160. [Google Scholar] [CrossRef]
  39. Tang, Q.; Zhang, R.; Chen, L.; Deng, W.; Xu, M.; Xu, G.; Li, L.; Hewitt, A. Numerical simulation of the downwash flow field and droplet movement from an unmanned helicopter for crop spraying. Comput. Electron. Agric. 2020, 174, 105468. [Google Scholar] [CrossRef]
  40. Tang, Q.; Chen, L.; Zhang, R.; Deng, W.; Xu, M.; Xu, G.; Li, L.; Hewitt, A. Effects of application height and crosswind on the crop spraying performance of unmanned helicopters. Comput. Electron. Agric. 2021, 181, 105961. [Google Scholar] [CrossRef]
  41. Wen, S.; Han, J.; Ning, Z.; Lan, Y.; Yin, X.; Zhang, J.; Ge, Y. Numerical analysis and validation of spray distributions disturbed by quad-rotor drone wake at different flight speeds. Comput. Electron. Agric. 2019, 166, 105036. [Google Scholar] [CrossRef]
  42. Qiang, S.; Yulei, P.; Beibei, H.; Huaiqun, Z.; Da, L.; Baoguo, S.; Hanping, M. The airflow field characteristics of UAV flight in a greenhouse. Agriculture 2021, 11, 634. [Google Scholar] [CrossRef]
  43. Guo, Q.; Zhu, Y.; Tang, Y.; Hou, C.; He, Y.; Zhuang, J.; Zheng, Y.; Luo, S. CFD simulation and experimental verification of the spatial and temporal distributions of the downwash airflow of a quad-rotor agricultural UAV in hover. Comput. Electron. Agric. 2020, 172, 105343. [Google Scholar] [CrossRef]
  44. Fengbo, Y.; Xinyu, X.; Ling, Z.; Zhu, S. Numerical simulation and experimental verification on downwash air flow of six-rotor agricultural unmanned aerial vehicle in hover. Int. J. Agric. Biol. Eng. 2017, 10, 41–53. [Google Scholar] [CrossRef] [Green Version]
  45. Fengbo, Y.; Xinyu, X.; Chen, C.; Qingqing, Z. Effect of down wash airflow in hover on droplet motion law for multi–rotor unmanned plant protection machine. Trans. Chin. Soc. Agric. Eng. 2018, 34, 64–73. [Google Scholar] [CrossRef]
  46. Hao, Z.; Lijun, Q.; Yalei, W.; Wanwan, L.; Zhenzhen, C.; Musiu, E.M. Spatio–temporal distribution of down–wash airflow for multi–rotor plant protection UAV based on porous model. Trans. Chin. Soc. Agric. Mach. 2019, 50, 112–122. [Google Scholar]
  47. Hao, Z.; Lijun, Q.; Yalei, W.; Zhenzhen, C.; Wanwan, L.; Musiu, E.M.; Yu, X.; Zepeng, Y. Distribution characteristics of rotor downwash airflow field under spraying on orchard using unmanned aerial vehicle. Trans. Chin. Soc. Agric. Eng. 2019, 35, 44–54. [Google Scholar]
  48. Shenghui, Y.; Xingxing, L.; Bingtai, C.; Shixiong, L.; Yongjun, Z. CFD models and verification of the downwash airflow of an eight-rotor UAV. In Proceedings of the 2019 ASABE Annual International Meeting Sponsored by ASABE, Boston, MA, USA, 7–10 July 2019. [Google Scholar] [CrossRef]
  49. Quan, Q. Modeling and evaluation of propulsion system. In Introduction to Multicopter Design and Control; Springer: Singapore, 2017. [Google Scholar] [CrossRef]
  50. Bangura, M.; Lim, H.; Kim, H.J.; Mahony, R. Aerodynamic power control for multirotor aerial vehicles. In Proceedings of the 2014 IEEE International Conference on Robotics and Automation (ICRA), Hong Kong, China, 31 May–7 June 2014. [Google Scholar] [CrossRef]
  51. Shi, D.; Dai, X.; Zhang, X.; Quan, Q. A practical performance evaluation method for electric multicopters. IEEE/ASME Trans. Mechatron. 2017, 22, 1337–1348. [Google Scholar] [CrossRef]
  52. Vitzilaios, N.I.; Tsourveloudis, N.C. An experimental test bed for small unmanned helicopters. J. Intell. Robot. Syst. 2009, 54, 769–794. [Google Scholar] [CrossRef]
  53. Hoffmann, F.; Goddemeier, N.; Bertram, T. Attitude estimation and control of a quadrocopter. In Proceedings of the 2010 IEEE/RSJ international, Conference on Intelligent Robots and Systems, Taipei, Taiwan, 18–22 October 2010; pp. 1072–1077. [Google Scholar] [CrossRef]
  54. Zang, Y.; He, X.; Zhou, Z.; Ming, R.; Zang, Y.; Luo, X.; Lan, Y. Comprehensive evaluation method for lifting characteristics of electric multi-rotor UAV for plant protection. Trans. Chin. Soc. Agric. Eng. 2018, 34, 69–77. [Google Scholar] [CrossRef]
  55. Dai, X.; Quan, Q.; Ren, J.; Cai, K. Efficiency optimization and component selection for propulsion systems of electric multicopters. IEEE Trans. Ind. Electron. 2019, 66, 7800–7809. [Google Scholar] [CrossRef]
  56. Matus-Vargas, A.; Rodriguez-Gomez, G.; Martinez-Carranza, J. Ground effect on rotorcraft unmanned aerial vehicles: A review. Intel. Serv. Robot. 2021, 14, 99–118. [Google Scholar] [CrossRef]
  57. Chen, R.; Jin, L.; Li, Z.; Zhang, J. A progressive approach for the detection of the coefficient of variation. Qual. Reliab. Eng. Int. 2021. [Google Scholar] [CrossRef]
  58. Zhang, Y.; Huang, X.; Wang, L.; Deng, J.; Zeng, W.; Lan, Y.; Muhammad, N.T. Progress in foreign agricultural aviation electrostatic spray technologies and references for China. Trans. Chin. Soc. Agric. Eng. 2021, 37, 50–59. [Google Scholar] [CrossRef]
Figure 1. Multirotor UAV sprayer used in this work.
Agriculture 11 01038 g001
Figure 2. The framework of WSPM-System.
Agriculture 11 01038 g002
Figure 3. The hardware of WSPM-System. (a) Hardware integration; (b) installation effect of the Arduino board; (c) the laptop with the software of WSPM-System; (d) installation effect of the Hall sensor; (e) installation effect of the JY61; (f) the fuselage coordinate system and rotor number. (1) Hall sensor interface; (2) JY61 interface; (3) TTL-nRF24L01; (4) Arduino board with a 3D printed shell; (5) power cable; (6) lithium battery; (7) USB-nRF24L01; (8) laptop; (9) Hall sensor with a 3D printed shell; (10) magnet; (11) brushless motor; (12) rotor; (13) JY61 with a plastic shell.
Agriculture 11 01038 g003
Figure 4. The GUI and program block diagram of the WSPM-System. (a) Linear graph on the front panel; (b) table on the front panel; (c) program block diagram on the rear panel.
Agriculture 11 01038 g004
Figure 5. The application block diagram of WSPM-System.
Agriculture 11 01038 g005
Figure 6. The simulation parameters measurement experiments. (a) Experimental location; (b) schematic diagram of the experimental area; (c) layout of Testo 405i when collecting data under hovering of the UAV sprayer.
Agriculture 11 01038 g006
Figure 7. The numerical simulation of downwash airflow. (a) The process of creating a three-dimensional model of the UAV sprayer; (b) schematic diagram of the computational domain.
Agriculture 11 01038 g007
Figure 8. Mean values of measured rotor speed in hovering of the UAV sprayer. The mean ± standard deviation of the rotor speed is presented at each treatment with different loads (LG = 4, 8, 12, and 16 kg) and flight altitudes (FA = 2, 3, and 4 m).
Agriculture 11 01038 g008
Figure 9. Box chart of measured pitch angle values in hovering of the UAV sprayer. The total mean value of the pitch angle is presented based on the mean value of all the treatments with different loads (LG = 4, 8, 12, and 16 kg) and flight altitudes (FA = 2, 3, and 4 m).
Agriculture 11 01038 g009
Figure 10. Mean values of measured rotor speed in forward flight of the UAV sprayer (FA = 3 m). (a) LG = 4 kg; (b) LG = 8 kg; (c) LG = 12 kg; (d) LG = 16 kg. The mean ± standard deviation of the rotor speed and the results of linear regression are presented at each treatment with different loads (LG = 4, 8, 12, and 16 kg) and flight speeds (FS = 1−7 m s−1).
Agriculture 11 01038 g010
Figure 11. Mean values of measured pitch angle in forwarding flight of the UAV sprayer (FA = 3 m). The mean ± standard deviation of the pitch angle and the results of linear regression are presented at each treatment with different loads (LG = 4, 8, 12, and 16 kg) and flight speeds (FS = 1−7 m s−1).
Agriculture 11 01038 g011
Figure 12. Vorticity distribution diagram of downwash airflow in hovering with front view (t = 1.3 s). (a) FA = 2 m, LG = 16 kg; (b) FA = 3 m, LG = 16 kg; (c) FA = 4 m, LG = 16 kg; (d) FA = 3 m, LG = 4 kg; (e) FA = 3 m, LG = 8 kg; (f) FA = 3 m, LG = 12 kg. The plane of the front view is profile A-A, as shown in Figure A1a.
Agriculture 11 01038 g012
Figure 13. The distribution of VVD on the horizontal detection surface (t = 1.3 s). (a) FA = 2 m, LG = 16 kg; (b) FA = 3 m, LG = 16 kg; (c) FA = 4 m, LG = 16 kg; (d) FA = 3 m, LG = 4 kg; (e) FA = 3 m, LG = 8 kg; (f) FA = 3 m, LG = 12 kg. The distance between the detection surface and the ground was 1 m and the negative value of VVD indicates that the velocity direction is vertical upward.
Agriculture 11 01038 g013
Figure 14. Comparison between the measured and simulated values of VVD in marked points.
Agriculture 11 01038 g014
Table 1. Specifications and parameters of the UAV sprayer.
Specifications and ParametersDF-16L
Length × Width × Height (mm)1156 × 1780 × 628
No-load mass (kg)15.4
Standard take-off mass (kg)37
Maximum take-off mass (kg)42
Tank capacity (L)16
Wheelbase (mm)1640
Rotor diameter (mm)/Number762/6
Brushless motor (KV value)100
Nozzles number a4
Battery type/CapacityLithium—12S/22,000 mAh
Standard application time (min)≥17
Full-load hover time (min)≥11
Flight speed b (m s−1)1–7
Operation height c (m)1–3
Spray swath (m)4–6
a Nozzle type can be changed according to the spray application requirements. b Follow the manufacturer’s recommendation. c Relative height between the top of the canopy and the UAV sprayer. Follow the manufacturer’s recommendation.
Table 2. The basic parameters and appearance of the hardware.
ItemsSensorsWireless ModuleArduino BoardLithium Battery
HallJY61USB-nRF24L01TTL-nRF24L01Mega 2560Exp-Board
Size (mm)39 × 1015 × 1560 × 1850 × 15101 × 54101 × 54135 × 80 × 40
Working voltage (V)5555559
Component3144MPU6050nRF24L01+ATmega2560
Data detected anθ
Input (Output) voltage (V) 7–12 (5 or 3.3)(5, 9, or 12) 11,800 mAh
Appearance Agriculture 11 01038 i001 Agriculture 11 01038 i002 Agriculture 11 01038 i003 Agriculture 11 01038 i004 Agriculture 11 01038 i005 Agriculture 11 01038 i006 Agriculture 11 01038 i007
a n (rotor speed, rpm); θ (pitch angle, °). The range of pitch angle is (−90°, +90°), and the value is positive in the forward flight of the UAV sprayer.
Table 3. Application parameters of the UAV sprayer in hovering and size of the computational domain.
CaseApplication ParametersComputational Domain (m)
FA (m)LG (kg)LengthWidthHeight
121612124
231612125
341612126
43412125
53812125
631212125
Table 4. The packet loss rate of the communication performance test.
Sampling Interval (s)Communication Distance (m)
80100120
0.1-<0.01<0.04
0.5-<0.01<0.03
1.0-<0.01<0.03
Table 5. The results of the data collection stability test.
ItemsRotor Speed (rpm)Pitch Angle (°)
Text.1Text.2Text.3Text.4Text.50510
M ± SD862 ± 4
862 ± 3 *
1619 ± 23
1608 ± 17 *
2543 ± 22
2534 ± 20 *
3436 ± 20
3435 ± 18 *
4580 ± 23
4574 ± 27 *
0.36 ± 0.014.97 ± 0.0110.14 ± 0.01
CV0.46% 0.33% *1.42% 1.05% *0.87% 0.80% *0.58% 0.51% *0.51% 0.58% *1.82%0.15%0.10%
Note: M (Mean value); SD (Standard deviation); CV (Coefficient of variation); ‘*’ means the reference data from RC41.
Publisher’s Note: MDPI stays neutral with regard to jurisdictional claims in published maps and institutional affiliations.

