Article

A Comparative Study of Semantic Segmentation Models for Identification of Grape with Different Varieties

1
Key Laboratory of Modern Agricultural Equipment and Technology, Ministry of Education, Jiangsu University, Zhenjiang 212013, China
2
School of Electronic Engineering, Changzhou College of Information Technology, Changzhou 213164, China
*
Author to whom correspondence should be addressed.
Agriculture 2021, 11(10), 997; https://doi.org/10.3390/agriculture11100997
Submission received: 15 September 2021 / Revised: 8 October 2021 / Accepted: 10 October 2021 / Published: 13 October 2021
(This article belongs to the Section Digital Agriculture)

Abstract

:
Accurate fruit segmentation in images is the prerequisite and key step for precision agriculture. In this article, aiming at the segmentation of grape cluster with different varieties, 3 state-of-the-art semantic segmentation networks, i.e., Fully Convolutional Network (FCN), U-Net, and DeepLabv3+ applied on six different datasets were studied. We investigated: (1) the segmentation performance difference of the 3 studied networks; (2) The impact of different input representations on segmentation performance; (3) The effect of image enhancement method to improve the poor illumination of images and further improve the segmentation performance; (4) The impact of the distance between grape clusters and camera on segmentation performance. The experiment results show that compared with FCN and U-Net the DeepLabv3+ combined with transfer learning is more suitable for the task with an intersection over union (IoU) of 84.26%. Five different input representations, namely RGB, HSV, L*a*b, HHH, and YCrCb obtained different IoU, ranging from 81.5% to 88.44%. Among them, the L*a*b got the highest IoU. Besides, the adopted Histogram Equalization (HE) image enhancement method could improve the model’s robustness against poor illumination conditions. Through the HE preprocessing, the IoU of the enhanced dataset increased by 3.88%, from 84.26% to 88.14%. The distance between the target and camera also affects the segmentation performance, no matter in which dataset, the closer the distance, the better the segmentation performance was. In a word, the conclusion of this research provides some meaningful suggestions for the study of grape or other fruit segmentation.

1. Introduction

Grapes are one of the most favorite fruits in the world. The grape industry of China has the characteristics of a wide planting area, high yield, and large demand for freshness. Statistics show that China’s table grape production has steadily ranked the first in the world since 2011. By 2016, the area of viticulture has also become the world’s first, with a total table grape production of 9 million tons, accounting for 50% of the world’s production [1].
Usually, the harvested grapes are used for winemaking or fresh food. For grapes used for winemaking, there is no need to consider the shedding of grape berries and the damage to the clusters during the picking process, which is more suitable for non-selective mechanized picking methods. Among them, the most mature application is to use the principle of vibration to transmit vibration to the grape berries through the vines, so that the berries can undergo multiple instantaneous changes in direction and overcome the connection with the fruit stem to achieve separation [2,3]. For the picking of table grapes, it is necessary to consider that there may be fruit loss and berries damaged during the picking process while completing the harvest of all mature grapes in the vineyard. Therefore, the large-scale non-selective mechanical picking method is not suitable for the harvest of table grapes. Usually, the harvesting of table grapes is often done manually, which is a labor-intensive and time-consuming work [4]. However, the shortage of labor, the aging of the population, and the declining birthrate are not only the bottleneck encountered in the development of agriculture but also one of the difficulties faced by the development of all labor-intensive industries in the world. With the development of robot technology, the best strategy to solve this problem is to use robots instead of farmers to harvest table grapes manually.
For harvesting robots, fast accurate identification and positioning of the target fruit is the prerequisite and key technical step for successfully picking the fruit. Machine vision is one of the most effective methods and has been investigated extensively for fruit detection. In recent decades, many scholars from all over the world have proposed a large number of detection algorithms for different types of fruits, such as citrus [5,6], apples [7,8], and kiwifruit [9,10], and achieved remarkable results.
At present, the research on grape recognition mainly focuses on two aspects: (1) to classify and identify the grape varieties; (2) to segment and locate the grape in the image. EI-Mashharawi et al. [11] carried out the research on grape variety recognition, and a machine learning-based method was proposed by them. A total of 6 varieties (each variety has different colors: black, crimson, yellow, dark blue, green, and pink), 4565 images (70% of the image for training and 30% for validation) were used for the AlexNet network. In order to reduce the degree of overfitting, image preprocessing technology and data enlargement technology were used. Finally, the trained model could achieve 100% accuracy for the classification of grape varieties. Bogdan Franczyk et al. [12] developed a model which is a combination of deep learning ResNet classifier model with multi-layer perceptron for grape varieties identification. A well-known benchmark dataset named WGISD which provided the instances from five different grape varieties taken from the field was used for training and testing on the developed model. The test results showed that the classification accuracy of the model for different grape varieties can reach 99%. M. Türkoğlu et al. [13] proposed a multi-class support vector machine classifier based on 9 different characteristics of grape leaves with a classification accuracy of 90.7% to classify grape tree species. In order to improve the classification performance, the preprocessing stage involves gray tone dial, median filtering, threshold holding, and morphological logical processes.
Compared with the identification of grape varieties, the accurate segmentation of grape clusters has also attracted the attention of many scholars and has been widely studied. Zernike moments and color information were applied by Chamelat et al. [14] to develop an SVM classifier for detecting red grapes successfully but got a disappointing result for white grapes with less than 50% of correct classification. Reis et al. [15] proposed a system for detecting bunches of grapes in color images, which could achieve 97% and 91% correct classifications for red and white grapes, respectively. The system mainly includes the following three steps to realize the detecting and locating of grape: color mapping, morphological dilation, black areas, and stem detection. In [16] a detector named DeepGrapes was proposed to detect white grapes for low-resolution color photos. In order to greatly reduce the final number of weights of the detector, weave layers were used to replace the generally used combined layers in the classifier. The detector could reach an accuracy of 96.53% on the dataset created by the author. Liu et al. [17] proposed an algorithm that utilized color and texture information as the feature to train an SVM classifier. The algorithm mainly includes three steps: image preprocessing, SVM classifier training, and image segmentation in the test set. Image preprocessing includes Otsu threshold segmentation, denoising, shape filtering, and further methods, which are not only used for the training set but also applied to the test set images. Experiments results demonstrate that the classifier could reach an accuracy of 88% and recall of 91.6% on two red grape datasets (Shiraz and Cabernet Sauvignon). In 2015, a Fuzzy C-Means Clustering method with an accuracy of 90.33% was proposed by [18]. The H-channel of the HSV image is clustered by the Fuzzy C-Means Clustering algorithm to segment grape objects. The initial clustering center of the Fuzzy C-Means Clustering was optimized by the artificial bee colony algorithm to accelerate clustering speed and reduce iteration steps. In the next year, another paper by the same research team applied the AdaBoost framework to construct four weaker classifiers into a strong classifier to significantly improve the detection performance. In the test stage, after the test image was processed by the classifier, the region threshold method and morphology filtering were used to eliminate noise, and the final average detection accuracy was 96.56%.
As mentioned above, significant progress has been made in the research related to the identification of grape varieties and the segmentation of the grape cluster. However, for a grape picking robot, its work scenario is often as: the farmer places it in a vineyard, and then the robot picks the grapes in the area by itself. Generally, grape varieties in a single region are often the same, and varieties in different regions may be different. Therefore, if the vision system of the robot could work like human eyes, then it could segment grape clusters easily no matter what varieties (with different colors or shapes) it is. Consequently, the robot operator does not need to switch different recognition algorithms for different varieties of grapes, which will greatly enhance the robot’s intelligence and simplify its use. However, it is a pity that there is no relevant research on the above-mentioned issues has been found.
Faced with such a thorny problem that an algorithm could segment the cluster region of different varieties of grapes. Generally, two methods are mainly considered, i.e., conventional methods and deep learning-related methods. Conventional procedures for machine vision usually include image pre-processing, segmentation, feature extraction, and classification. The selection of handcrafted features has a crucial impact on the performance of conventional methods. However, handcrafted features are usually extracted from color, shape, spectrum, and texture which may be influenced by varying lighting conditions, occlusion or overlapping, and different growth stages of plants. The unstable handcrafted features may lead to poor robustness and low generalization capabilities of conventional methods. To be more important, there are hundreds of different varieties of grapes and usually have different colors, shapes, and textures. It is almost impossible to extract ideal handcrafted features based on color, shape, and texture to segment cluster accurately with different grapes varieties. Besides, the extraction of handcrafted features for so many different varieties of grapes is time-consuming work. Therefore, it seems that the conventional methods are not suited for the segmentation of grapes with different varieties.
Compared with conventional machine learning methods, deep learning can automatically learn the hierarchical features expressed hidden deep into the images, avoiding the tedious procedures to extract and optimize handcrafted features [19,20]. Deep learning has been investigated extensively for image processing and applied in agriculture. Networks such as AlexNet and Inception (GoogLeNet) are often used for classification applications such as plant diseases and fruit varieties. Networks such as Mask R-CNN and YOLO are mainly used for target detection and have achieved good effect in the detection applications of mango [21,22], strawberry [23], and apple [24]. Compared with classification and target detection, semantic segmentation can achieve pixel-level segmentation of targets, which is more suitable for our research goals. Commonly used semantic segmentation networks include the DeepLab series, U-Net, FCN, etc.
Given that the deep learning networks could extract and make use of hierarchical features. Moreover, some mature deep learning models could achieve pixel-level segmentation. Therefore, in this article, we will study the effect of pixel-level segmentation of different grape varieties by using 3 state-of-the-art semantic segmentation models and the factors that affect the performance. Specifically, (1) According to the constructed dataset (with different grape varieties), the segmentation performance was compared and analyzed with 3 art-of-the-state semantic segment models, i.e., FCN, U-Net, and DeepLabv3+; (2) Different input representations including different color space transformations and a constructed input representation, were compared to analyze the effect of input representations on the performance of the adopted network; (3) Model robustness with respect to lighting conditions was improved by image enhancement; (4) The influence of the distance between grapes clusters and camera on segmentation performance was also analyzed and discussed.
The remainder of this article is structured as follows. We start with a description of the materials and methods of the experiments in Section 2. In Section 3, experiment results with a detailed discussion about the experiment are given. Finally, the conclusions and future work are presented in Section 4.

2. Materials and Methods

2.1. Image Dataset

For the purpose of this research, a dataset of 300 images with different varieties of grapes was collected and established. All the images were captured by a Nikon (Tokyo, Japan) Coolpix S 4200 digital camera with the resolution of 4608 × 3456 pixels in 2019. The distribution of grape characteristics in the dataset is shown in Table 1. In terms of color, there are red, green, purple, and black. Additionally, their shapes are also different both spherical grapes and non-spherical grapes are included. In addition, some of the images were captured in good lighting conditions while another part was captured in poor lighting conditions, resulting in poor brightness and contrast of the images. All the captured images were adjusted to the size of 224 × 224, then Photoshop CS6 was used to label the grape clusters in the image, which is exhaustive and time-consuming work. In the experiment, the dataset was split into 70:30 for training and testing. The detailed number of each kind of grapes used for training and testing was also listed in Table 1.

2.2. Image Preprocessing

The generalization ability of the model could be improved by aligning the data distribution of datasets (training set and test set) and improving image quality [19]. Therefore, two kinds of image preprocessing technology were adopted to the datasets: image enhancement and input image representation transformation. The illumination condition has a great influence on the robustness of the classification model. In practical application, there is a big difference in the light intensity of different grape clusters on the same column vine even at the same time due to the occlusion of branches, leaves, and other obstacles. Therefore, this study will investigate the effect of the image enhancement method to improve image contrast on the model segmentation effect. For the input of the deep network, in [25] 14 different input representations were deployed to improve the performance of the classification model. Additionally, in [26], different input representations were adopted to reduce the amounts of images for training. Table 2 lists the preprocessed datasets which would be evaluated in this paper.

2.2.1. Image Enhancement

Some images in the datasets have low contrast and brightness. To study the impact of this situation on the robustness of the model classification effect, one image enhancement method-Histogram Equalization (HE) was applied to the images. The principle and implementation steps of the histogram equalization (HE) method are to be found in [27]. It is an effective method to adjust image intensity to enhance contrast. For the gray image, the gray value histogram of the new image is similar to the uniform histogram by rearranging the gray value. However, for multi-channel color images, if the same technology is used in each channel, the unequal offset will be produced on each channel, which will eventually lead to the change of pixel hue. In this paper, in order to solve the problem, firstly, the RGB image is converted into the HSI image, then, histogram equalization was used only in I channel, and then the balanced HSI image was transferred back to the RGB image.

2.2.2. Input Representations Transformation

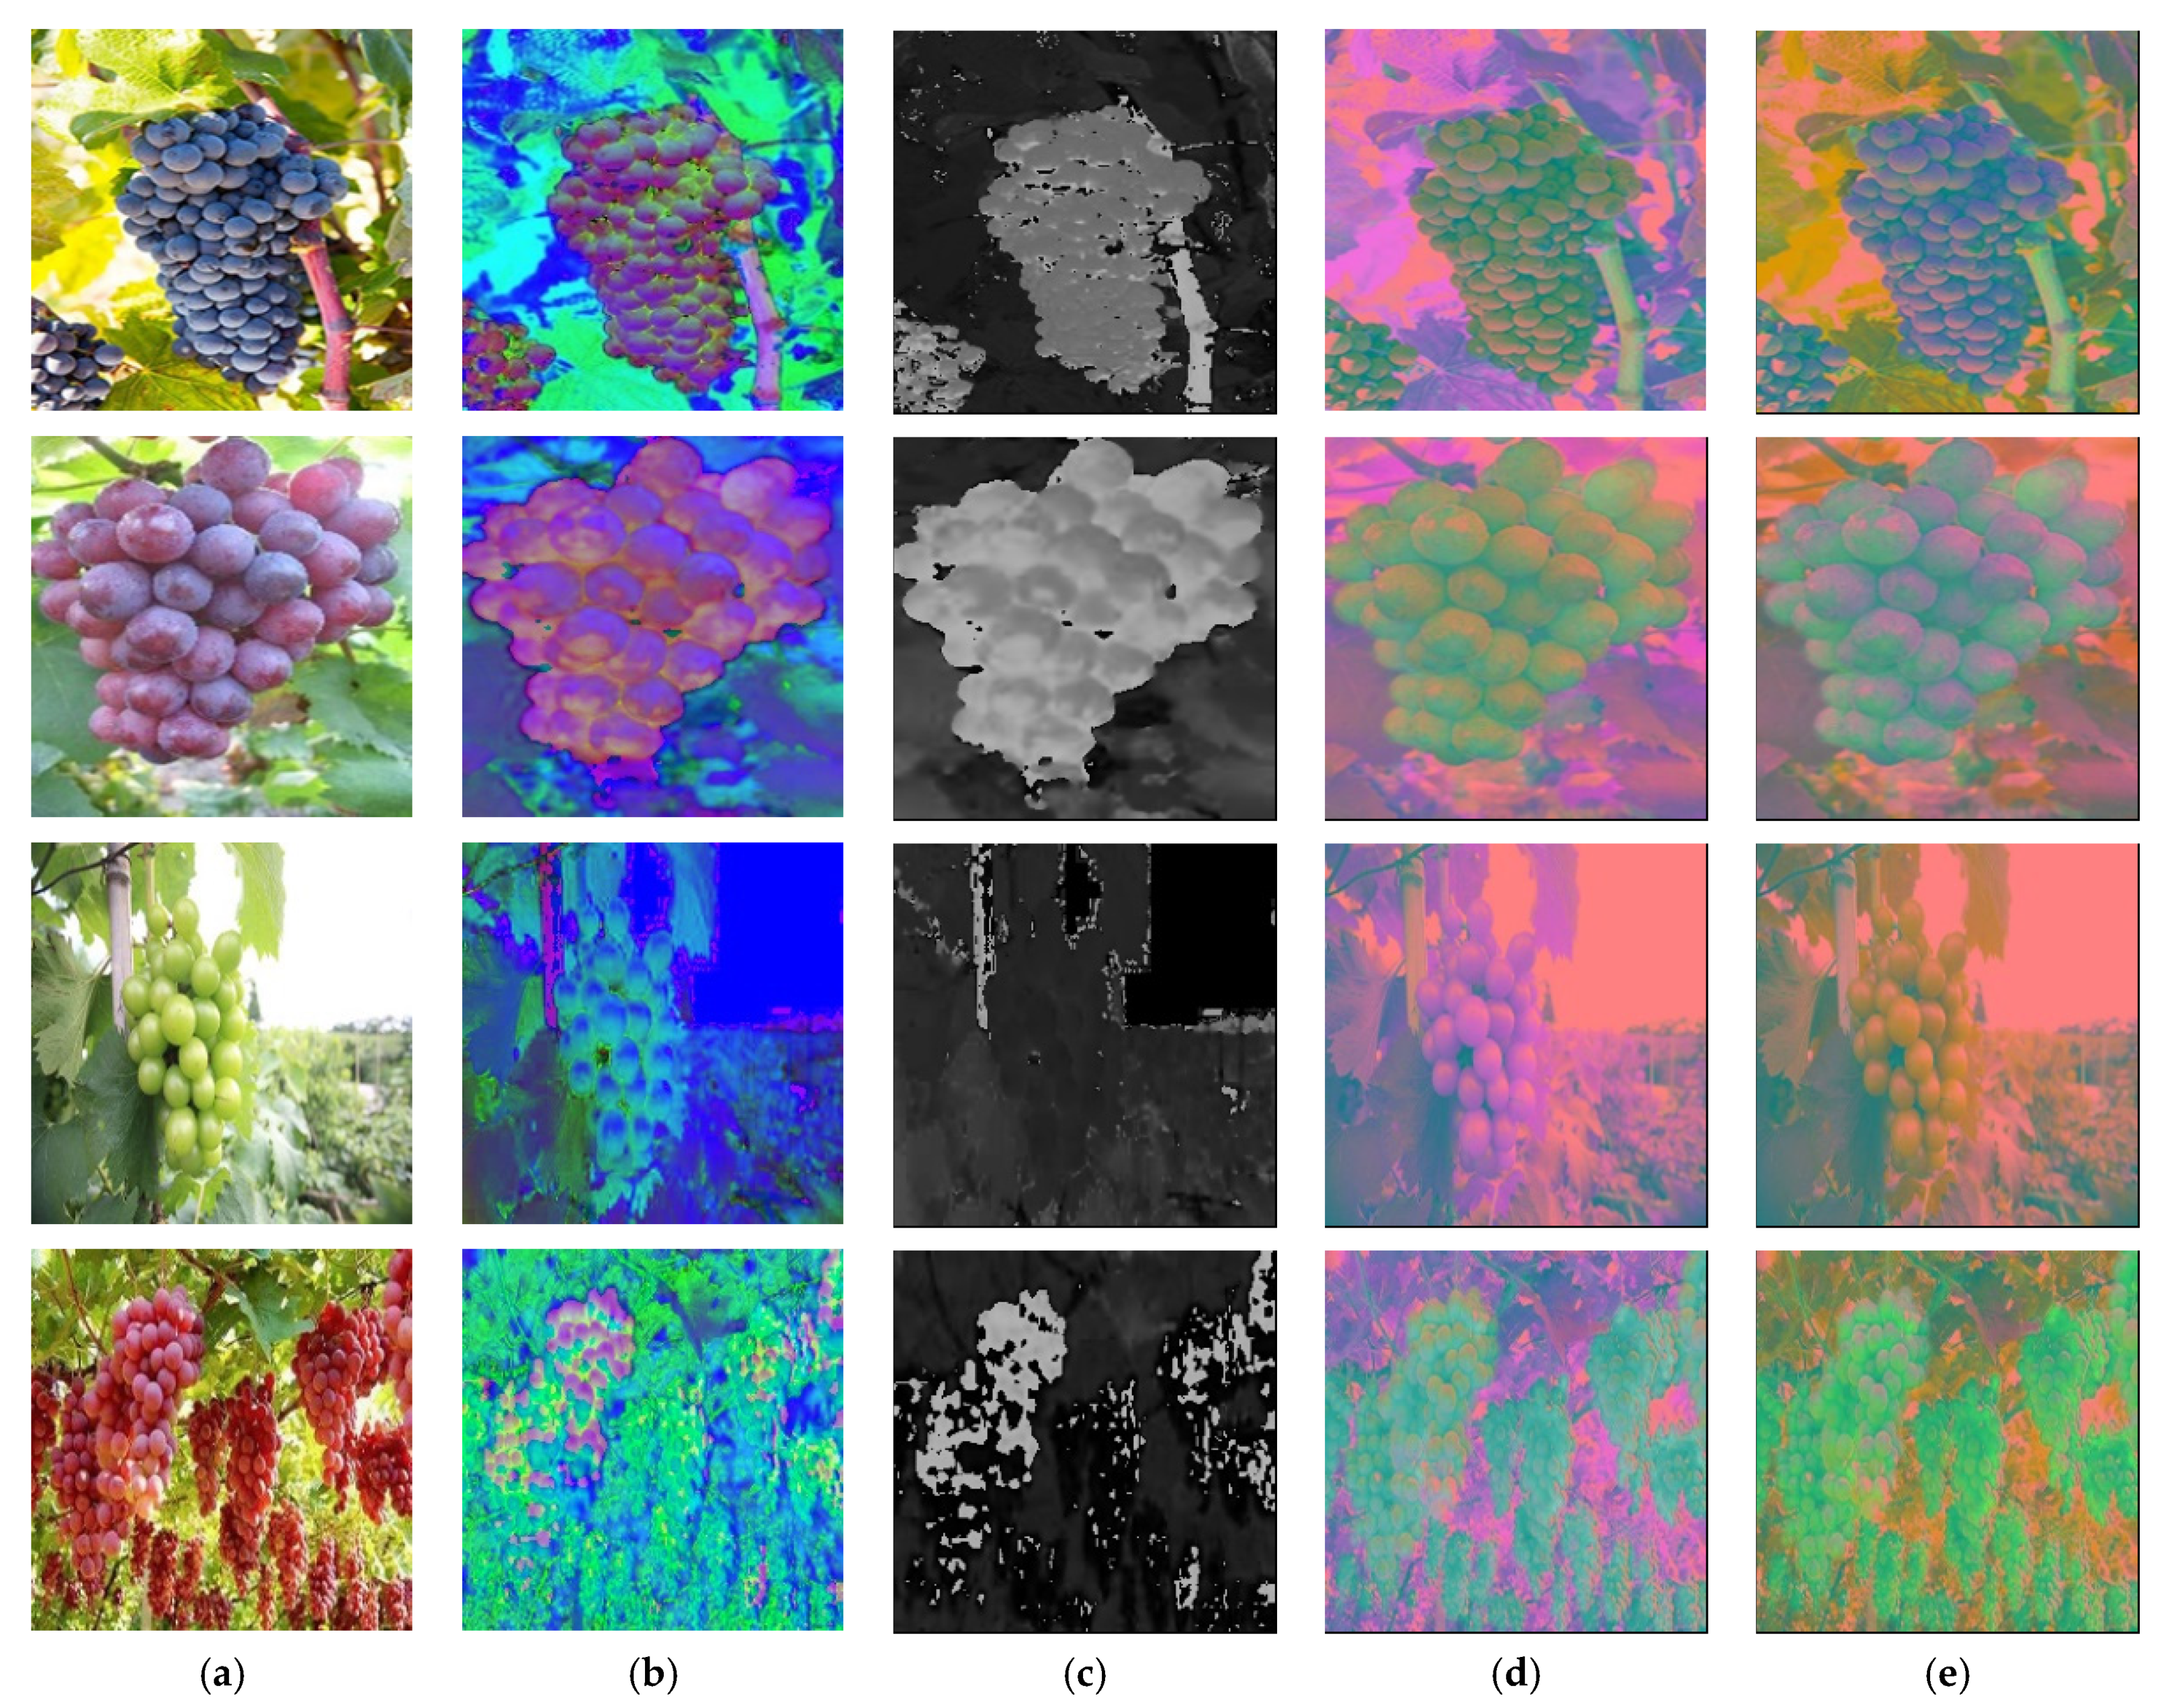
To evaluate the effect of different input representations on the segmentation performance, several common image representation models (RGB, L*a*b*, HSV, HHH, YCrCb) and a constructed representation (HHH) model were examined. RGB is the most common color model, and the image source collected by a camera is usually represented by the RGB model. L*a*b* can provide a wider range of colors as compared to RGB, and YCrCb is a common representation in video compression and digital image processing, which is commonly used in face detection. In the research of [17,28], the image is first converted to the HSV space and then the identification operations are processed on the HSV image. This is because the difference between the background and the grape cluster is significantly obvious in this color space. The HHH model was formed by the superposition and combination of H-channel in HSV. This is due to the fact that only H-channel is used to process and detect grape clusters in [18], and a good segmentation effect is achieved. Therefore, we hope to study the effect of images containing only Hue component on the model’s segmentation performance.

2.3. Semantic Segmentation Network

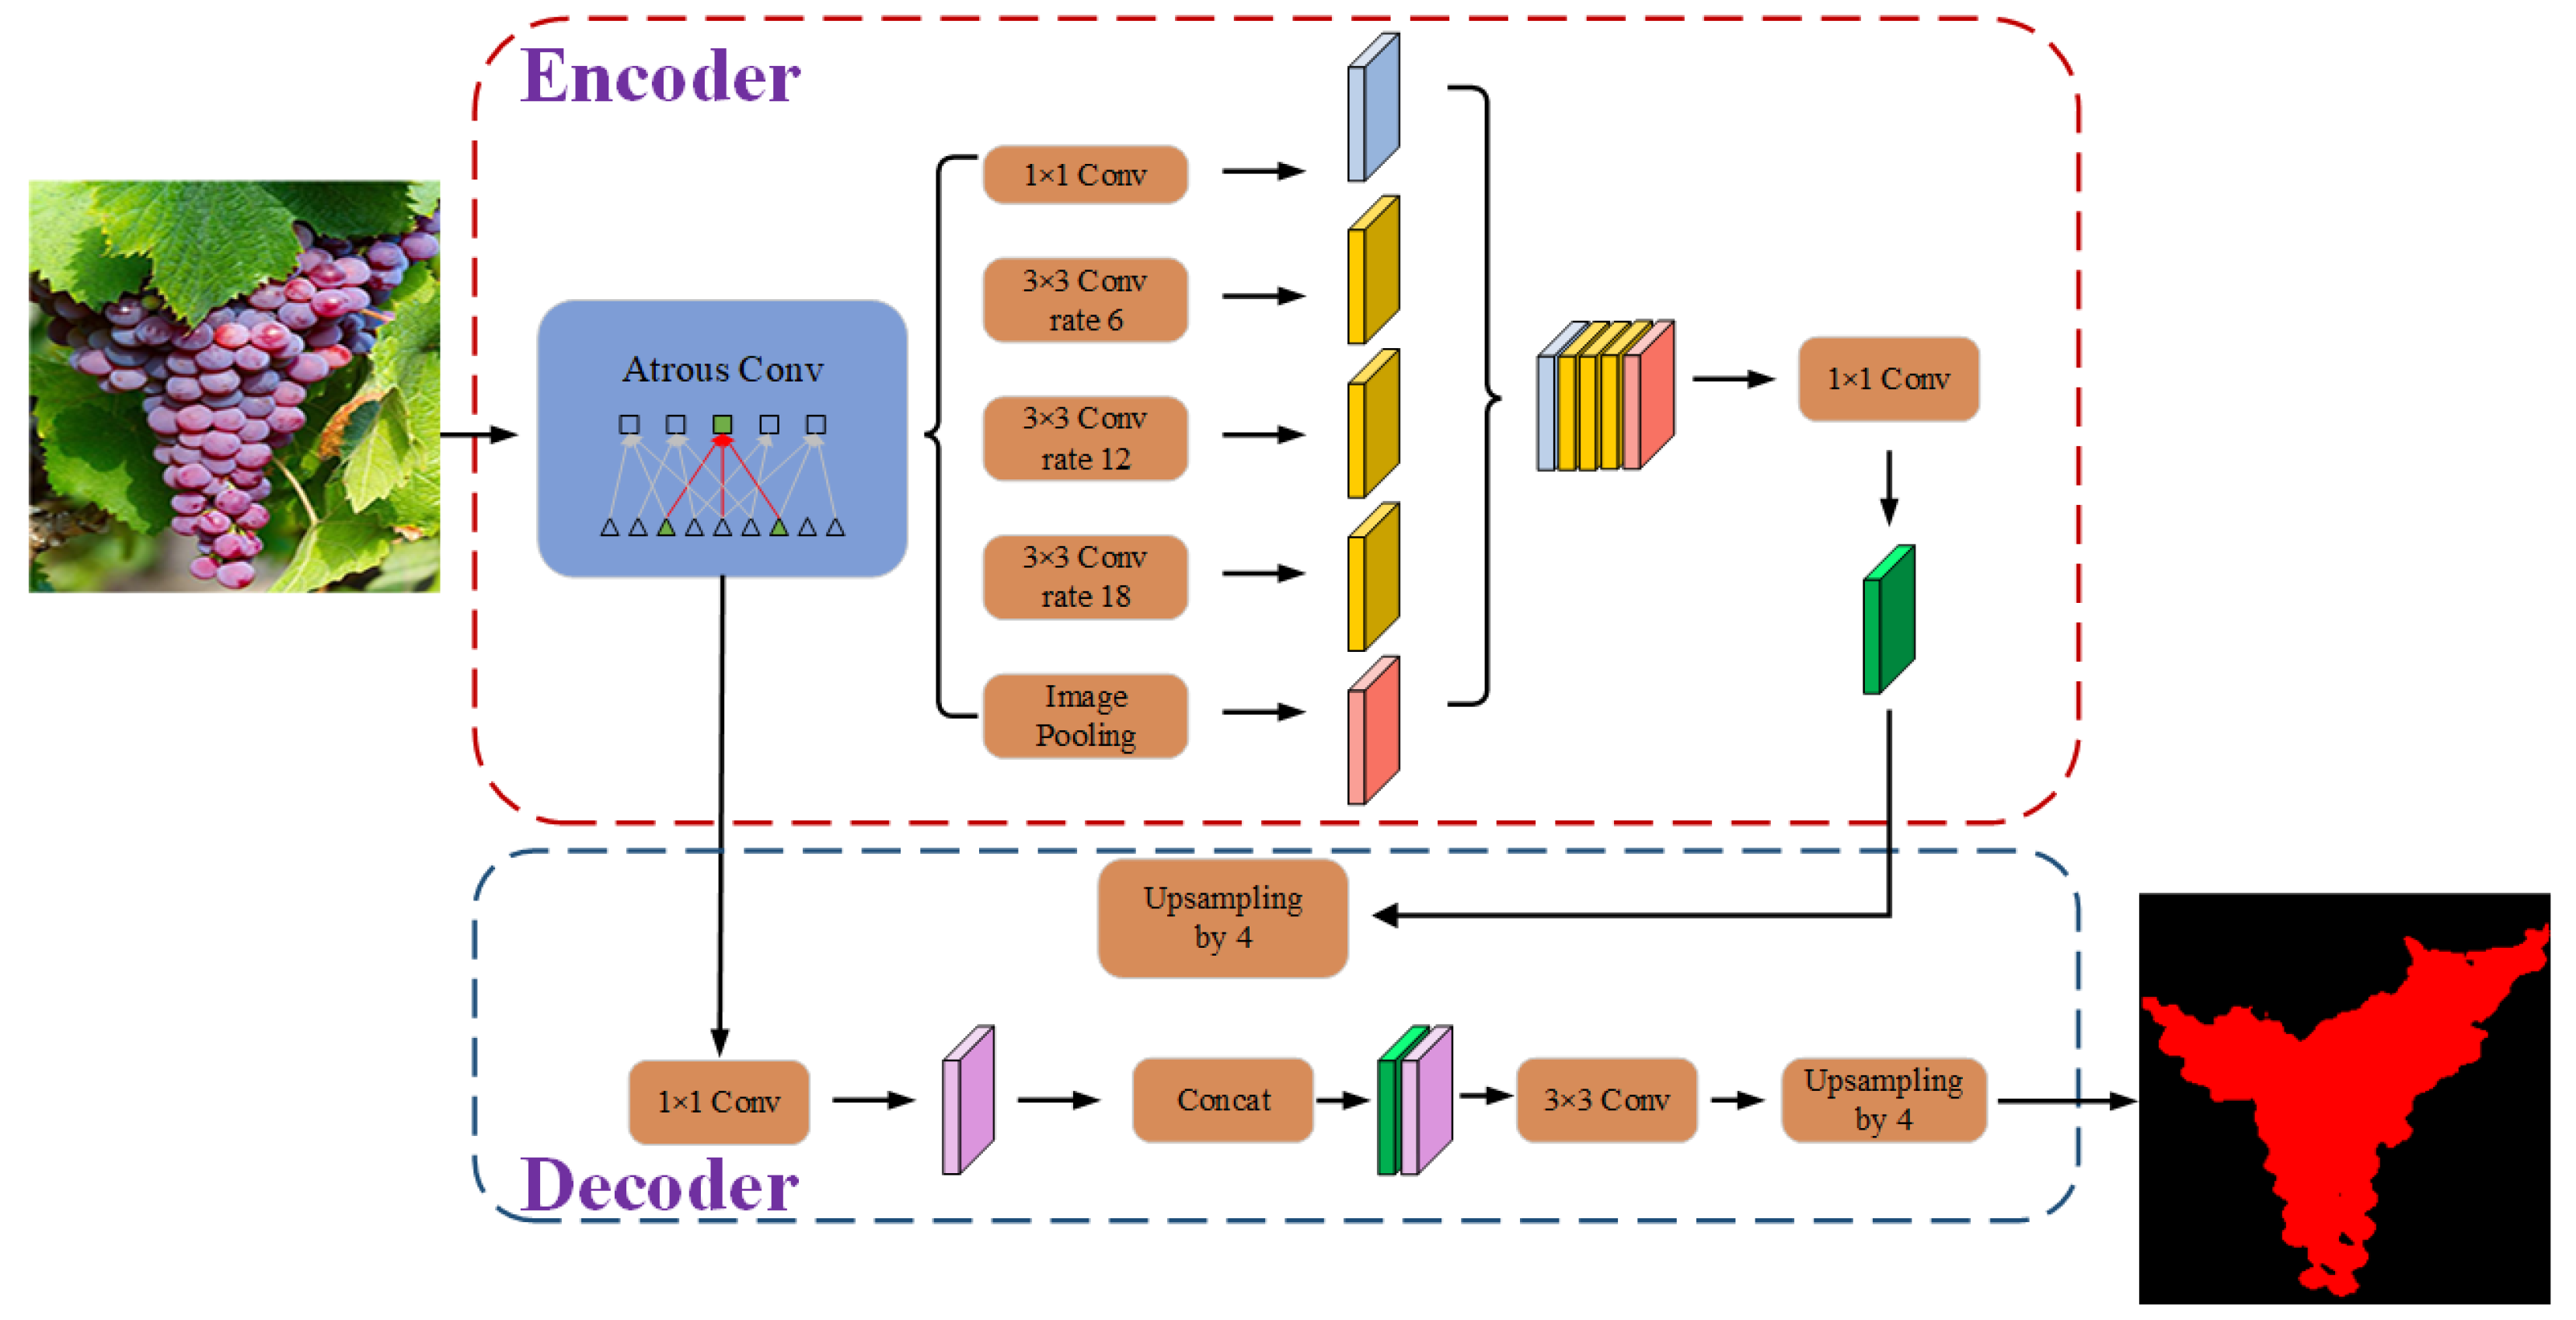
In this study, 3 state-of-the-art semantic segmentation networks, i.e., DeepLabv3+, FCN, and U-Net were investigated. DeepLab is a series of networks, in which DeepLabv3+ was developed based on DeepLabv1. Compared to the DeepLabv1, DeepLabv2, and DeepLabv3, DeepLabv3+ [29] has a better segmentation performance (the architecture of DeepLabv3+ as shown in Figure 1). The effectiveness of this network has been tested on the benchmarks of Pascal VOC 2012 and Cityscapes datasets with an accuracy of 89.0% and 82.1% respectively without any pre-processing and post-processing. DeepLabv3+ is consists of two parts, i.e., encoder module and decoder module. For the encoder module, the input image first passes through the atrous convolution which is a powerful tool that allows extracting the features computed by deep convolutional neural networks at an arbitrary resolution. Also, the atrous convolution greatly reduces the complexity and obtain similar (or better) performance. A simple yet effective decoder concatenated the low-level features from the network backbone with the upsample encoder features, then several 3 × 3 convolutions and upsampling by a factor of 4 were applied to refine the segmentation results along object boundaries.
The Fully Convolutional Networks (FCN) [30], as shown in Figure 2, was proposed by Long et al. The main innovation of FCN is replacing Fully Connected layers of the CNN model with the Convolution layers to achieve image semantic segmentation (pixel-level classification). The commonly used CNN networks such as VGG, ResNet, and AlexNet could be used as the “basis network” to construct a FCN model. Literature [31] shows that based on VGG16, replace the Fully Connected layers with 1 × 1 Convolution layers, and the FCN-8s structure was adopted in Deconvolution stage, which could obtain a relative better segmentation performance. Then, in this study, the VGG16-based FCN network was adopted.
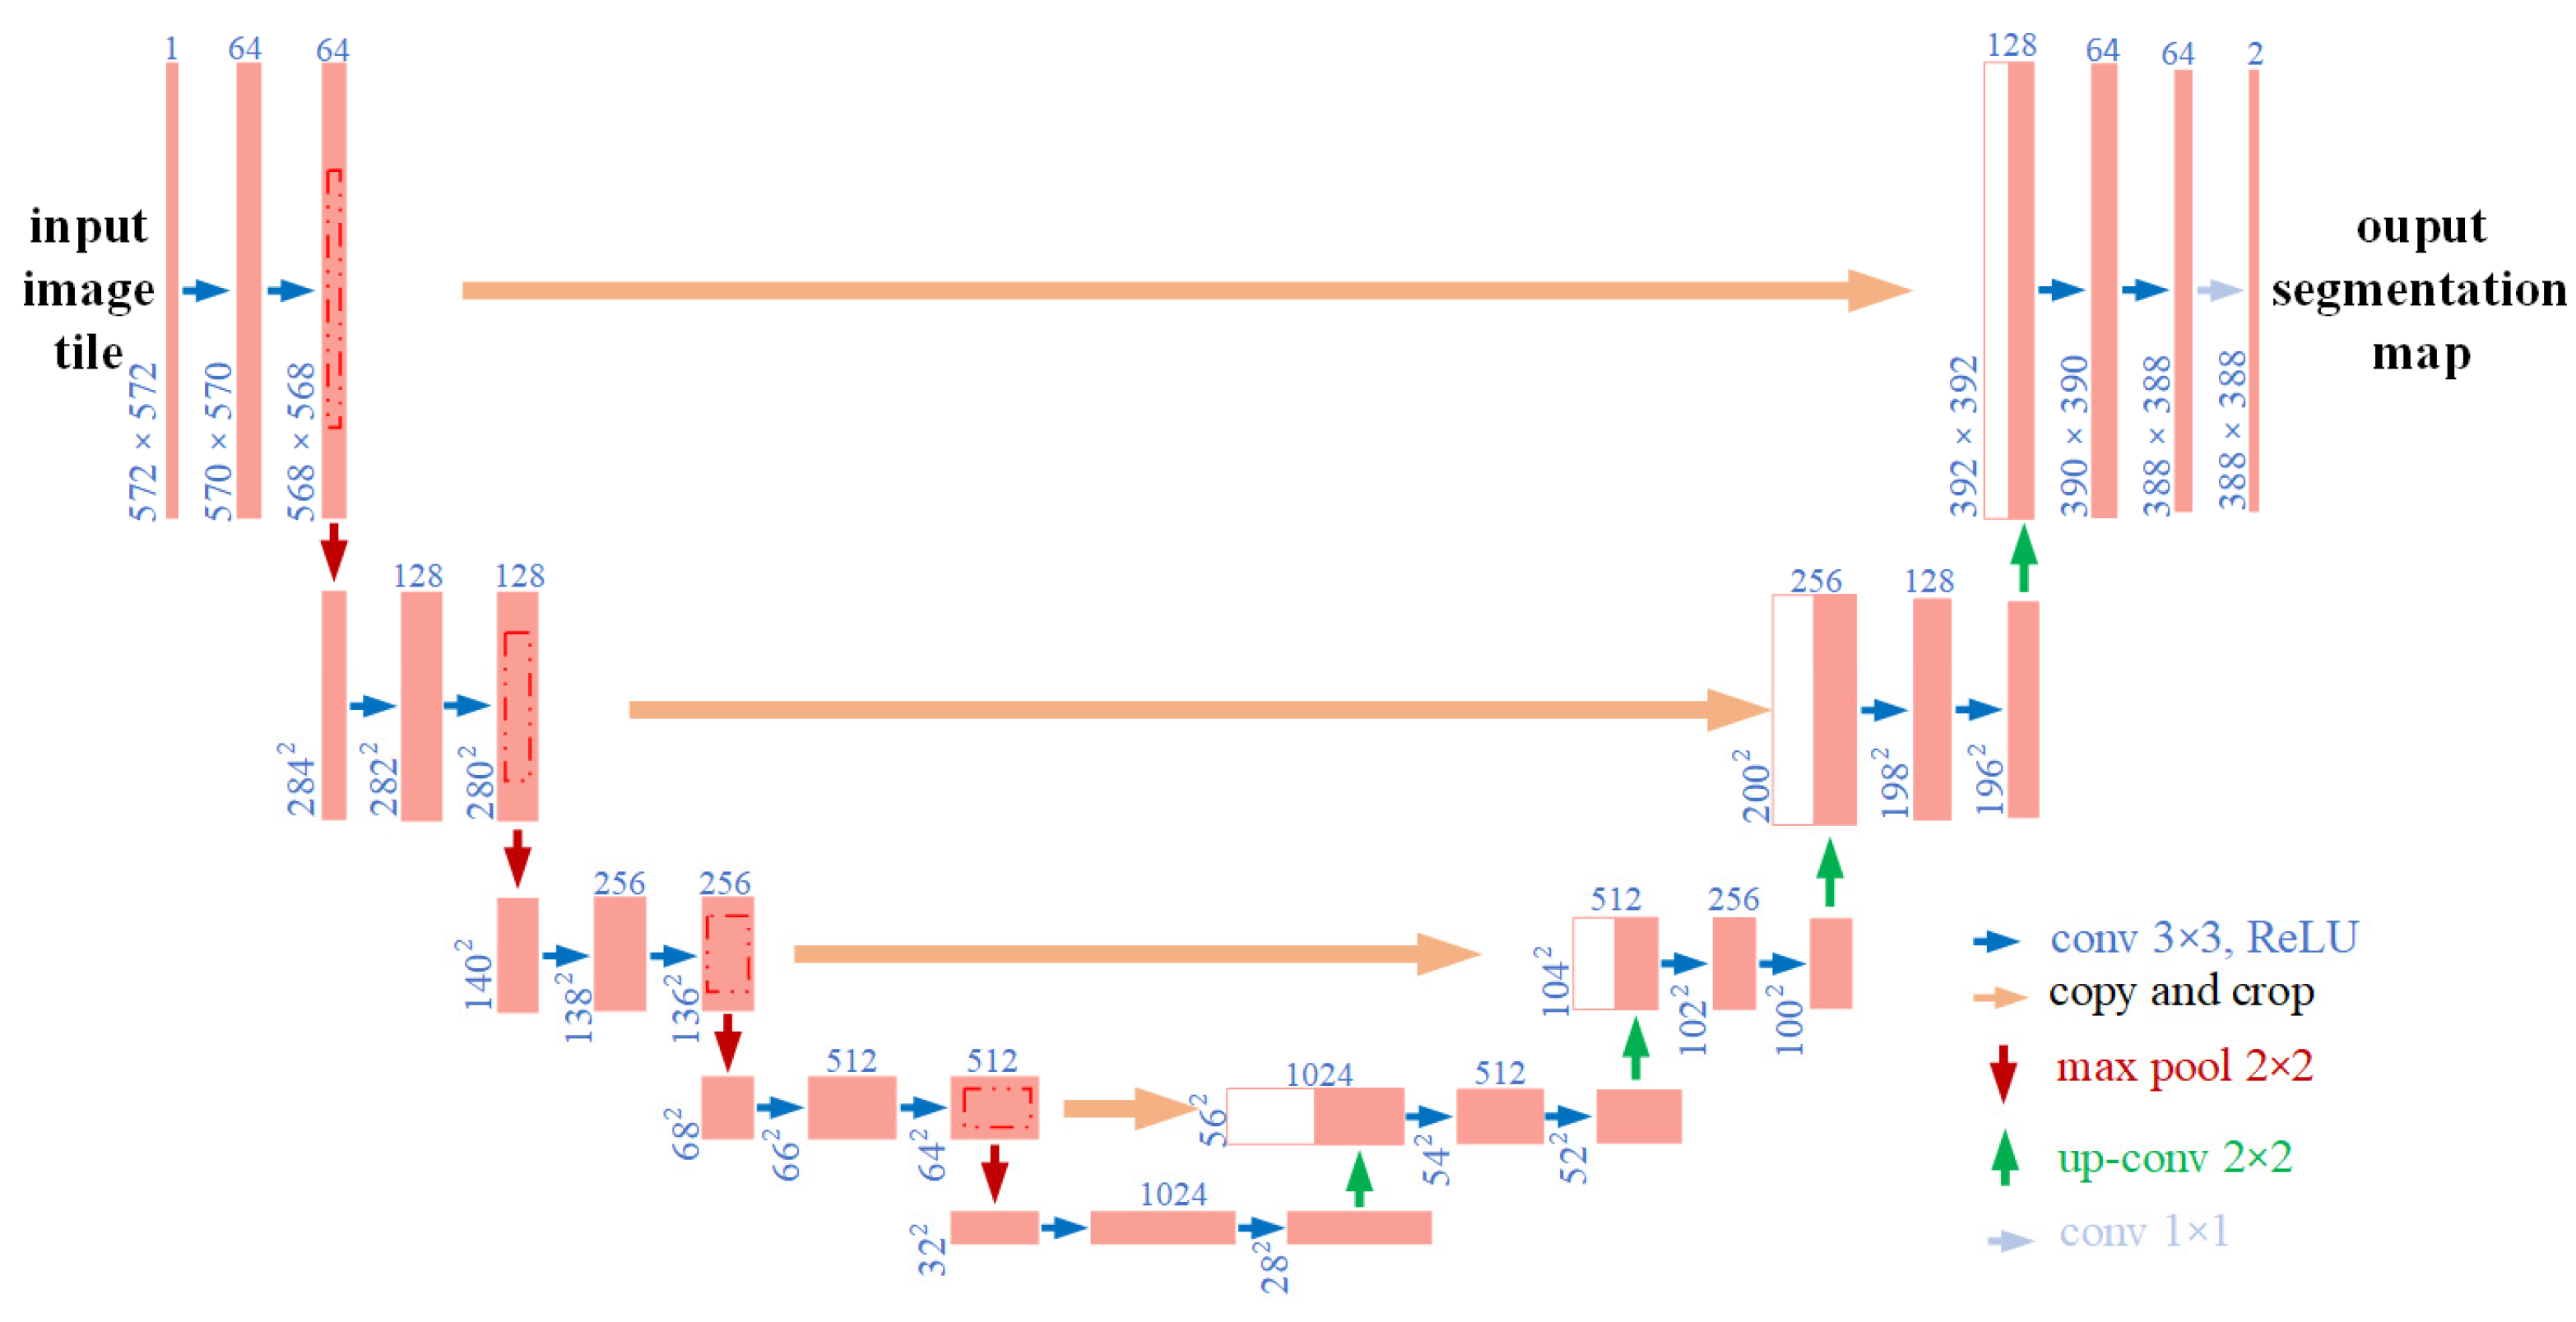
U-Net [32] is an end-to-end semantic segmentation network initially proposed for the segmentation of neuronal structures. The architecture of U-Net is as shown in Figure 3, which like the alphabet of “U”. The U-Net consists of two paths, i.e., contracting path and expansive path. The contracting path lead a downsampling to the input image while the expansive path makes upsampling operation. Compared with other networks, by applying the overlap-tile strategy, U-Net could achieve seamless segmentation of arbitrarily larger images of with small dataset (<30 images).

2.4. Distance Calculation of Grapes Clusters

Generally, for the same object, the closer the distance is, the more pixels are occupied in the image, and vice versa. Ignoring the difference brought by grapes varieties, namely, some varieties have larger fruit berries, while others have smaller ones. In each image, a grape without occlusion is selected for each bunch of grapes. After manual labeling, the number of pixels was calculated by MATLAB, and the distance of the bunch of grapes is judged based on this. There are totally three levels of each bunch of grapes: far, medium, and near. If the grape berry size is more than 200 pixels, the cluster distance is considered as “near”, if less than 30, it is judged as “far”, or between 30 and 200, as “medium”. Since some pictures contain multiple clusters of grapes, all images are divided into four levels: far, medium, near, far-near. Far means that all the clusters in the image are far away, which is the same for “medium” and “near”. In addition, “far-near” means the grape clusters in the image, some of which are in the “far” distance, and some of which are in the “medium” or “near” distance. The distance distribution of the dataset is shown in Table 3.

2.5. Training the Deep Network with Transfer Learning

To train a deep learning model from scratch often requires a lot of labeled images and is computationally expensive. In the field of deep learning, there are several well-known public datasets, among them, MS COCO contains about 330,000 images, Pascal VOC 2012 contains about 11,530 images, while ImageNet has more than 14 million images. Therefore, in this work, it is almost impossible to train the model from scratch and obtain good performance only through hundreds of images. To solve the above issue, the strategy of transfer learning was adopted [30].
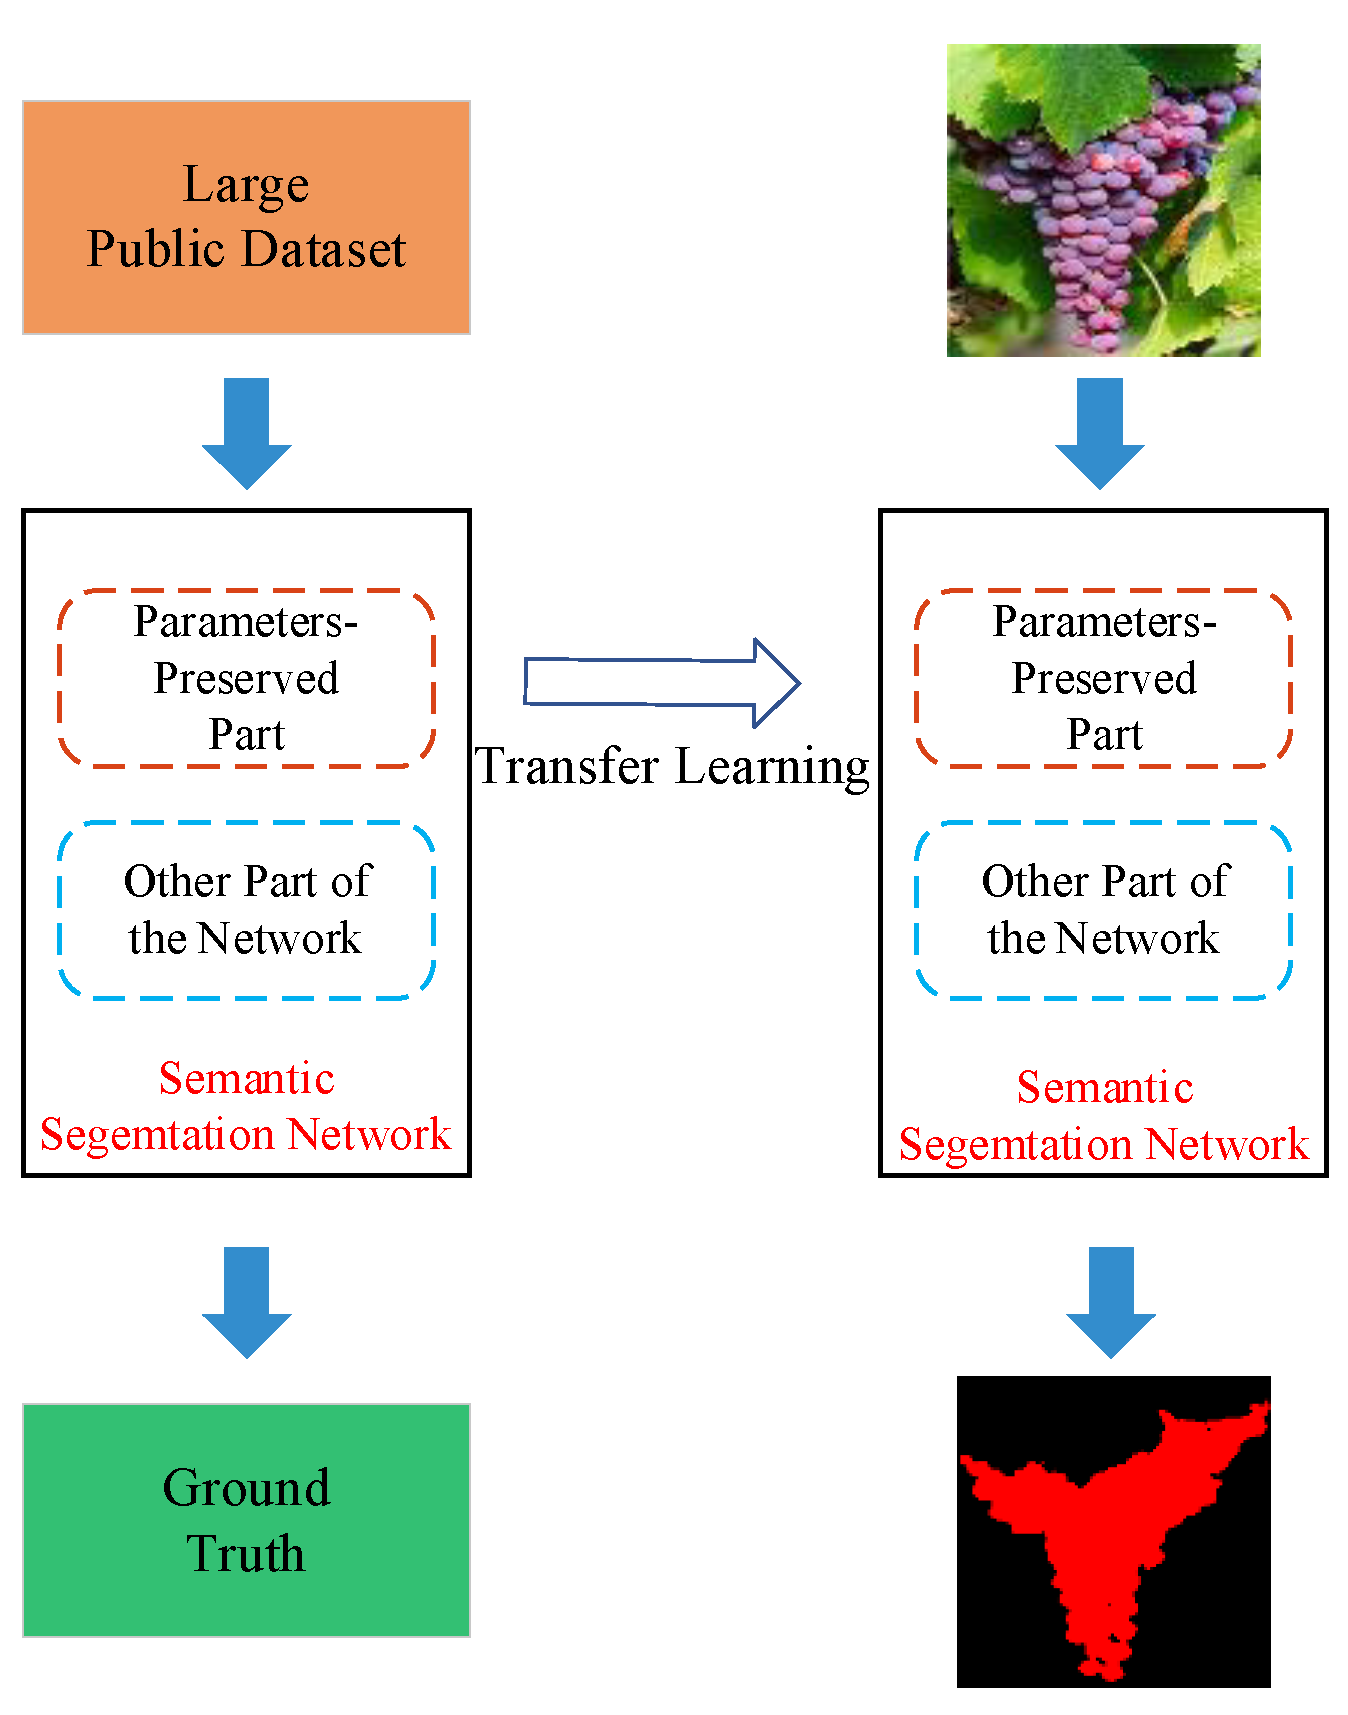
Figure 4 shows the idea for implementing transfer learning. The so-called transfer learning is to use the knowledge gained in other fields to solve new problems. Then, we can obtain a better segmentation accuracy with only a small dataset. In order to realize the transfer learning of the DeepLabv3+, the network was trained on the basis of a pre-trained model on Pascal VOC 2012. Furthermore, the parameters of encoder module were frozen, and our own datasets was applied to adjust the remaining parameters.
In addition, since the contracting path of the U-Net is mainly response for low-level features-learning, which could use the transfer learning strategy to obtain the parameters. Hence, we pre-trained the network with ImageNet, and the parameters of contracting path were preserved, and then trained the network of our dataset to train the parameters of expansive path. Also, due to the VGG16 was adopted as the “basis network” of the FCN, then the parameters of the “basis network” were obtained by trained with ImageNet, and the remaining parameters were fine-tuned by our dataset.

2.6. Experiment Platform and Evaluation Metrics

All the datasets were processed on a computer with Intel i7 CPU, NVIDIA 1060 graphics card (6G), and 8G memory. Photoshop CS6 software (San Jose, CA, USA) was used for ground-truth labeling, and MATLAB (version: r2016a, Netik, MA, USA) for image enhancement, distance calculation of grapes clusters, and transformation between different representations. The training and testing of the datasets were completed by using an Intel i7 CPU (256 GB RAM) and NVIDIA gtx1080ti GPU (88 GB GPU memory) workstation.
In this work, the pixels were classified into grapes cluster and background. In order to evaluate the performance of the model, intersection over union (IoU), precision and recall, which are important and widely used index has been applied to evaluate the performance of model. The equations are as follows:
I o U = T P F P + T P + F N ,
P r e c i s o n = T P T P + F P ,
R e c a l l = T P T P + F N ,
where TP is true positive, FP is false positive, and FN is false negative.

3. Results and Discussion

3.1. Image Preprocessing

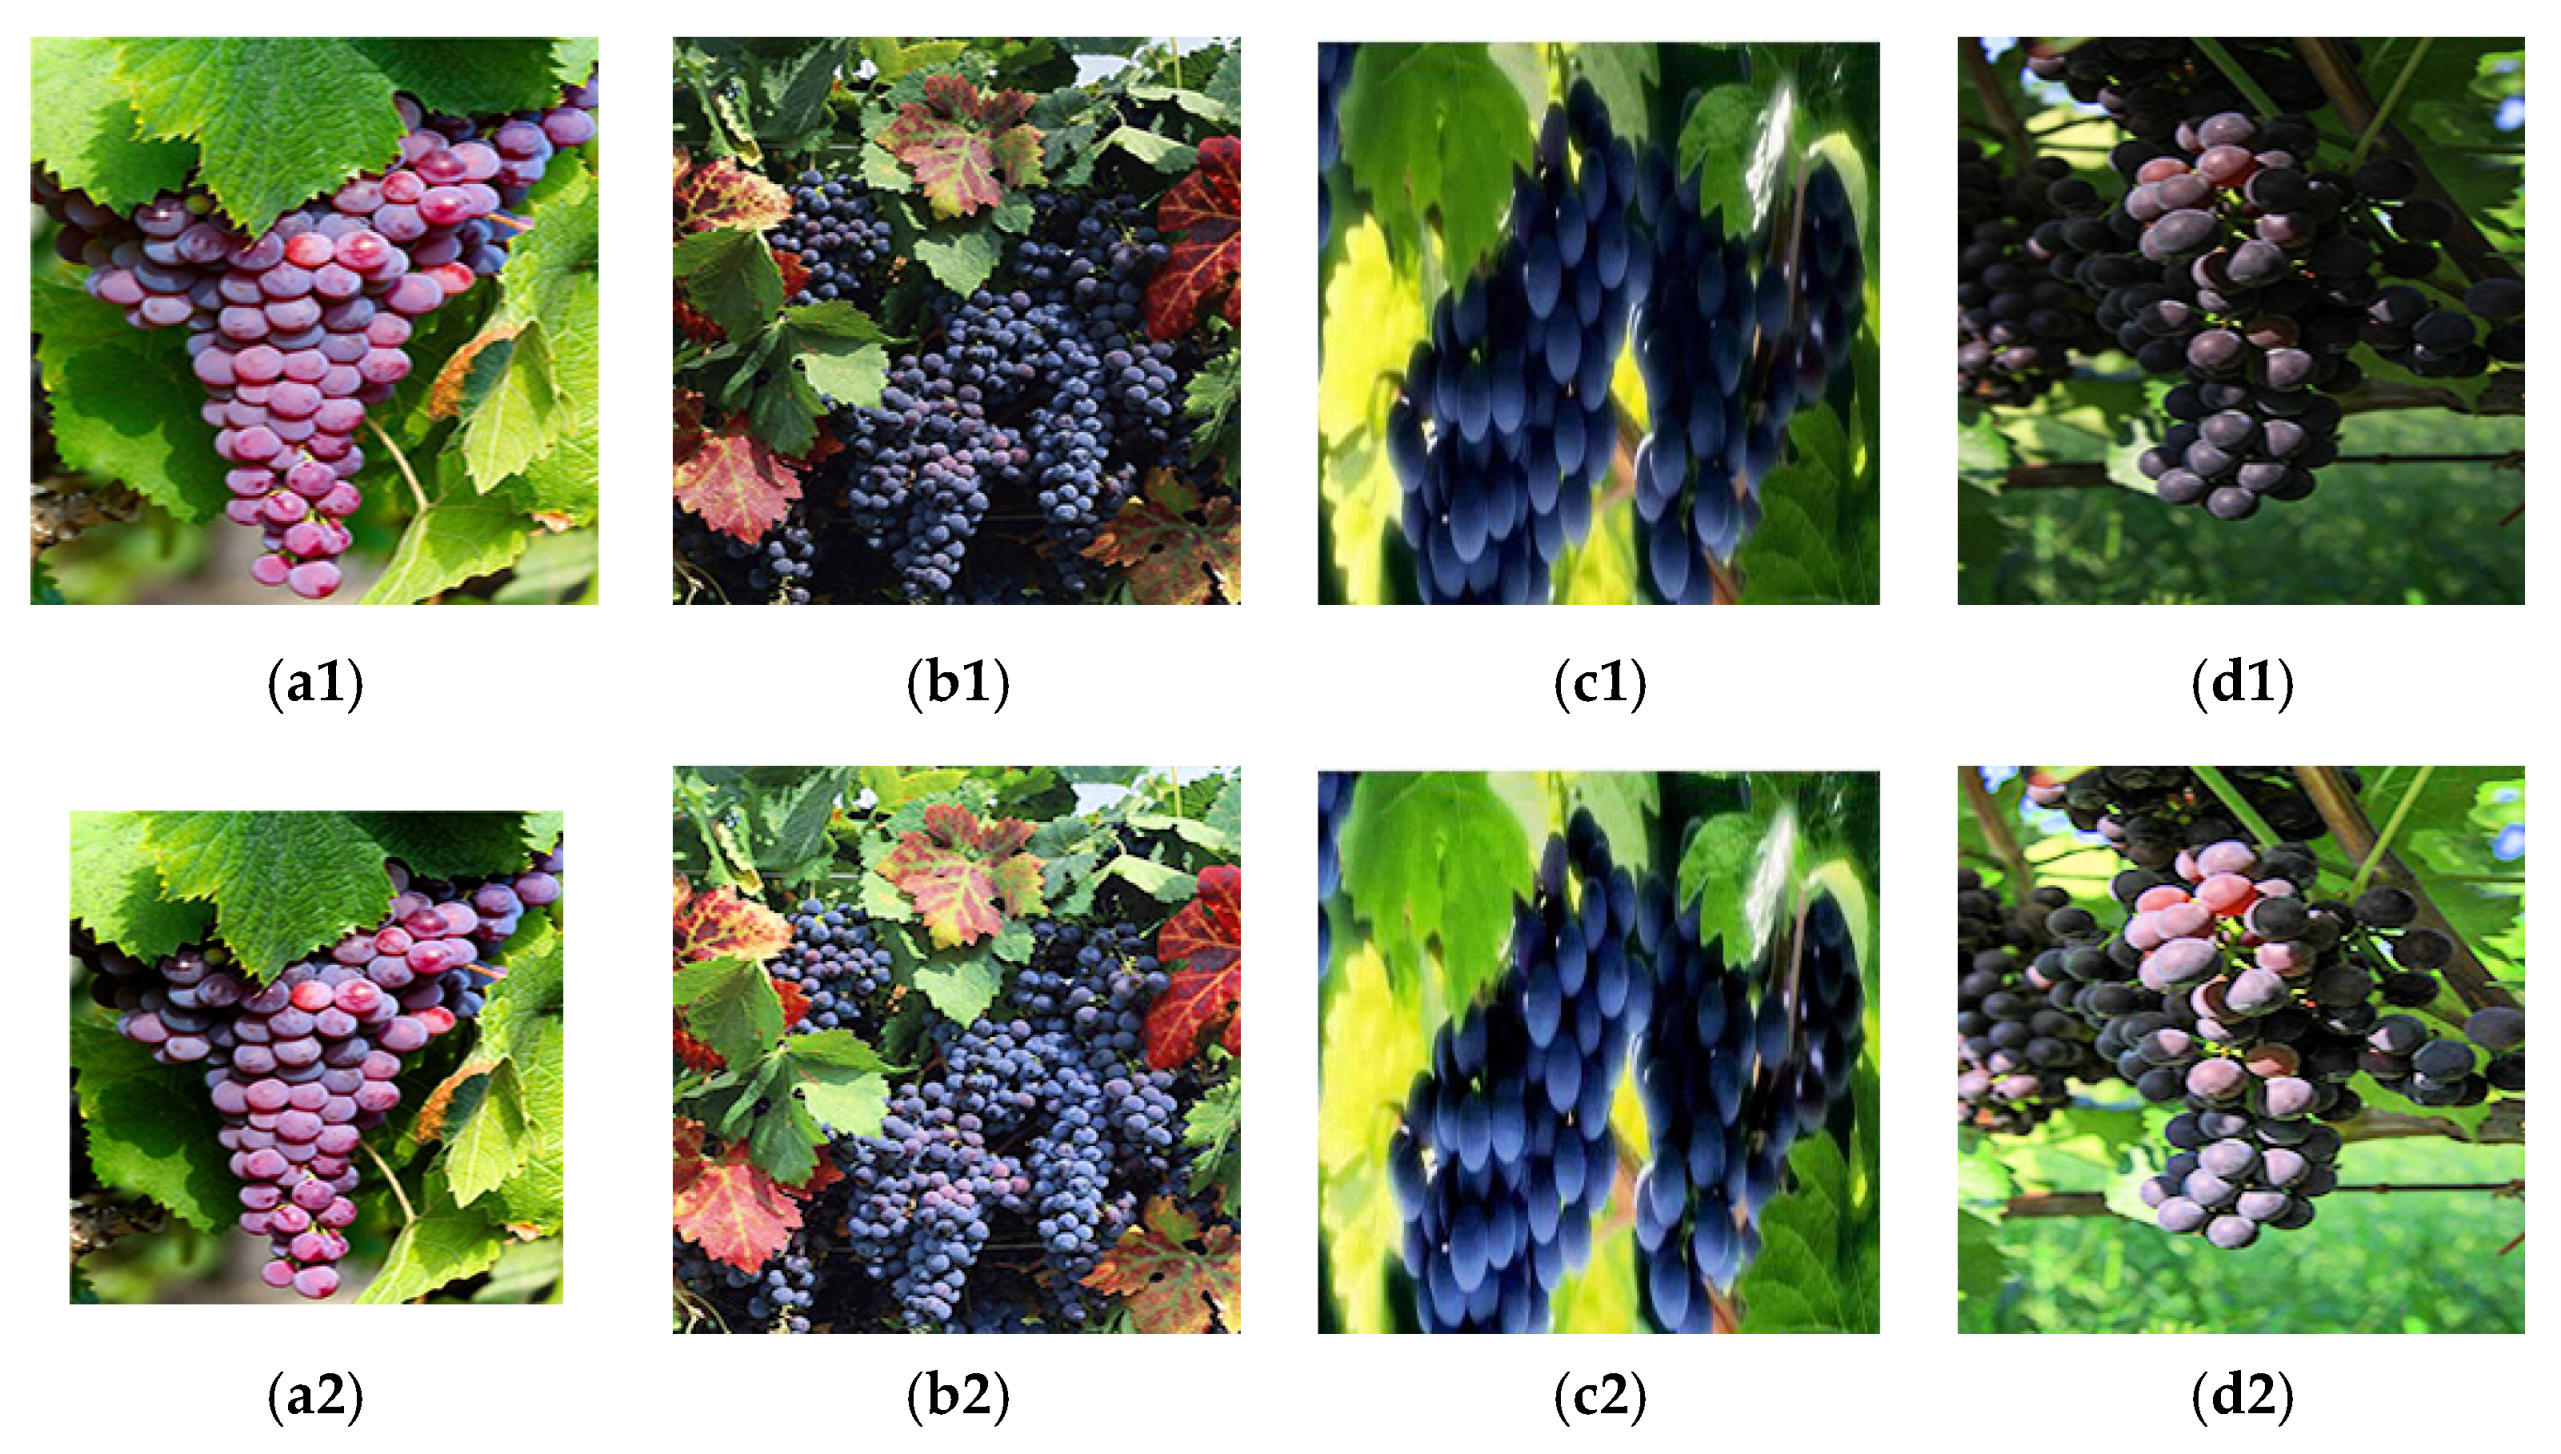
Figure 5 shows the visual effect of images in datasets of different grapes varieties represented as RGB, HSV, HHH, L*a*b*, and YCrCb. Additionally, Figure 6 shows the visual effect of some images in the datasets enhanced by the HE method. The upper parts of Figure 6 are the raw RGB images and the lower parts are the enhanced images. Some of the raw images themselves have strong brightness and contrast, as shown in Figure 6a1,a2. Therefore, the brightness and contrast of the images do not change significantly. Whiling the brightness and contrast of (c1) and (d1) are insufficient, and significantly improved by HE enhancement as shown in Figure 6. However, the color of the images looks distorted and unnatural. This may be due to the irreducible singularity of the transformation between RGB and HSI space, and the fact that in this work HE was only implemented on the intensity channel.

3.2. The Segmentation Performance of Different Networks

Table 4 shows the results obtained by the evaluated networks with the RGB dataset. The IoU of U-Net, FCN, and DeepLabv3+ were 77.53%, 75.61, and 84.26%, respectively. The DeepLabv3+ obtained the best performance compared with U-Net, and FCN, with an IoU higher with 6.73% and 8.65%, respectively. In addition, the precision and recall show the same rule, that is DeepLabv3+ > U-Net > FCN. It could observe that the precision and recall of each model are larger than IoU, this is because the numerator for calculating these metrics is the same, but the denominator for calculating IoU requires an extra F P of F N . Although none of the IoU exceeded 85%, which does not seem to be an ideal result. However, there are significant differences in the grapes varieties contained in our dataset. As shown in Table 1, from the color perspective, there are purple, green, red, etc., also the shapes are different, such as spherical and non-spherical shapes, and the background also varies greatly. If conventional methods are used for, whether it is clustering-, threshold segmentation-, and even machine learning-related methods, it is almost impossible to implement an algorithm that can obtain such an IoU. This is because no matter which conventional method is used, the selection of manual features such as colors, textures, or shapes is inevitable. However, there are obvious differences of these features between different varieties of grapes in the dataset. The performance obtained in our experiment indicate the deep learning related method shows huge potential for grape cluster segmentation especially for grapes with different varieties.
In addition, the results indicate that for the segmentation of grape clusters of different varieties DeepLabv3+ seems more suitable, due to the fact that the DeepLabv3+ could obtain the best segmentation result in our experiment. Moreover, [33,34] also obtained the best performance in the their respective applications by DeepLabv3+. Hence, in the following sections, only the Deeplabv3+ would be considered to evaluation the effect of image enhancement, different representations, and target distance on the segmentation performance.

3.3. The Effect of Different Input Representations

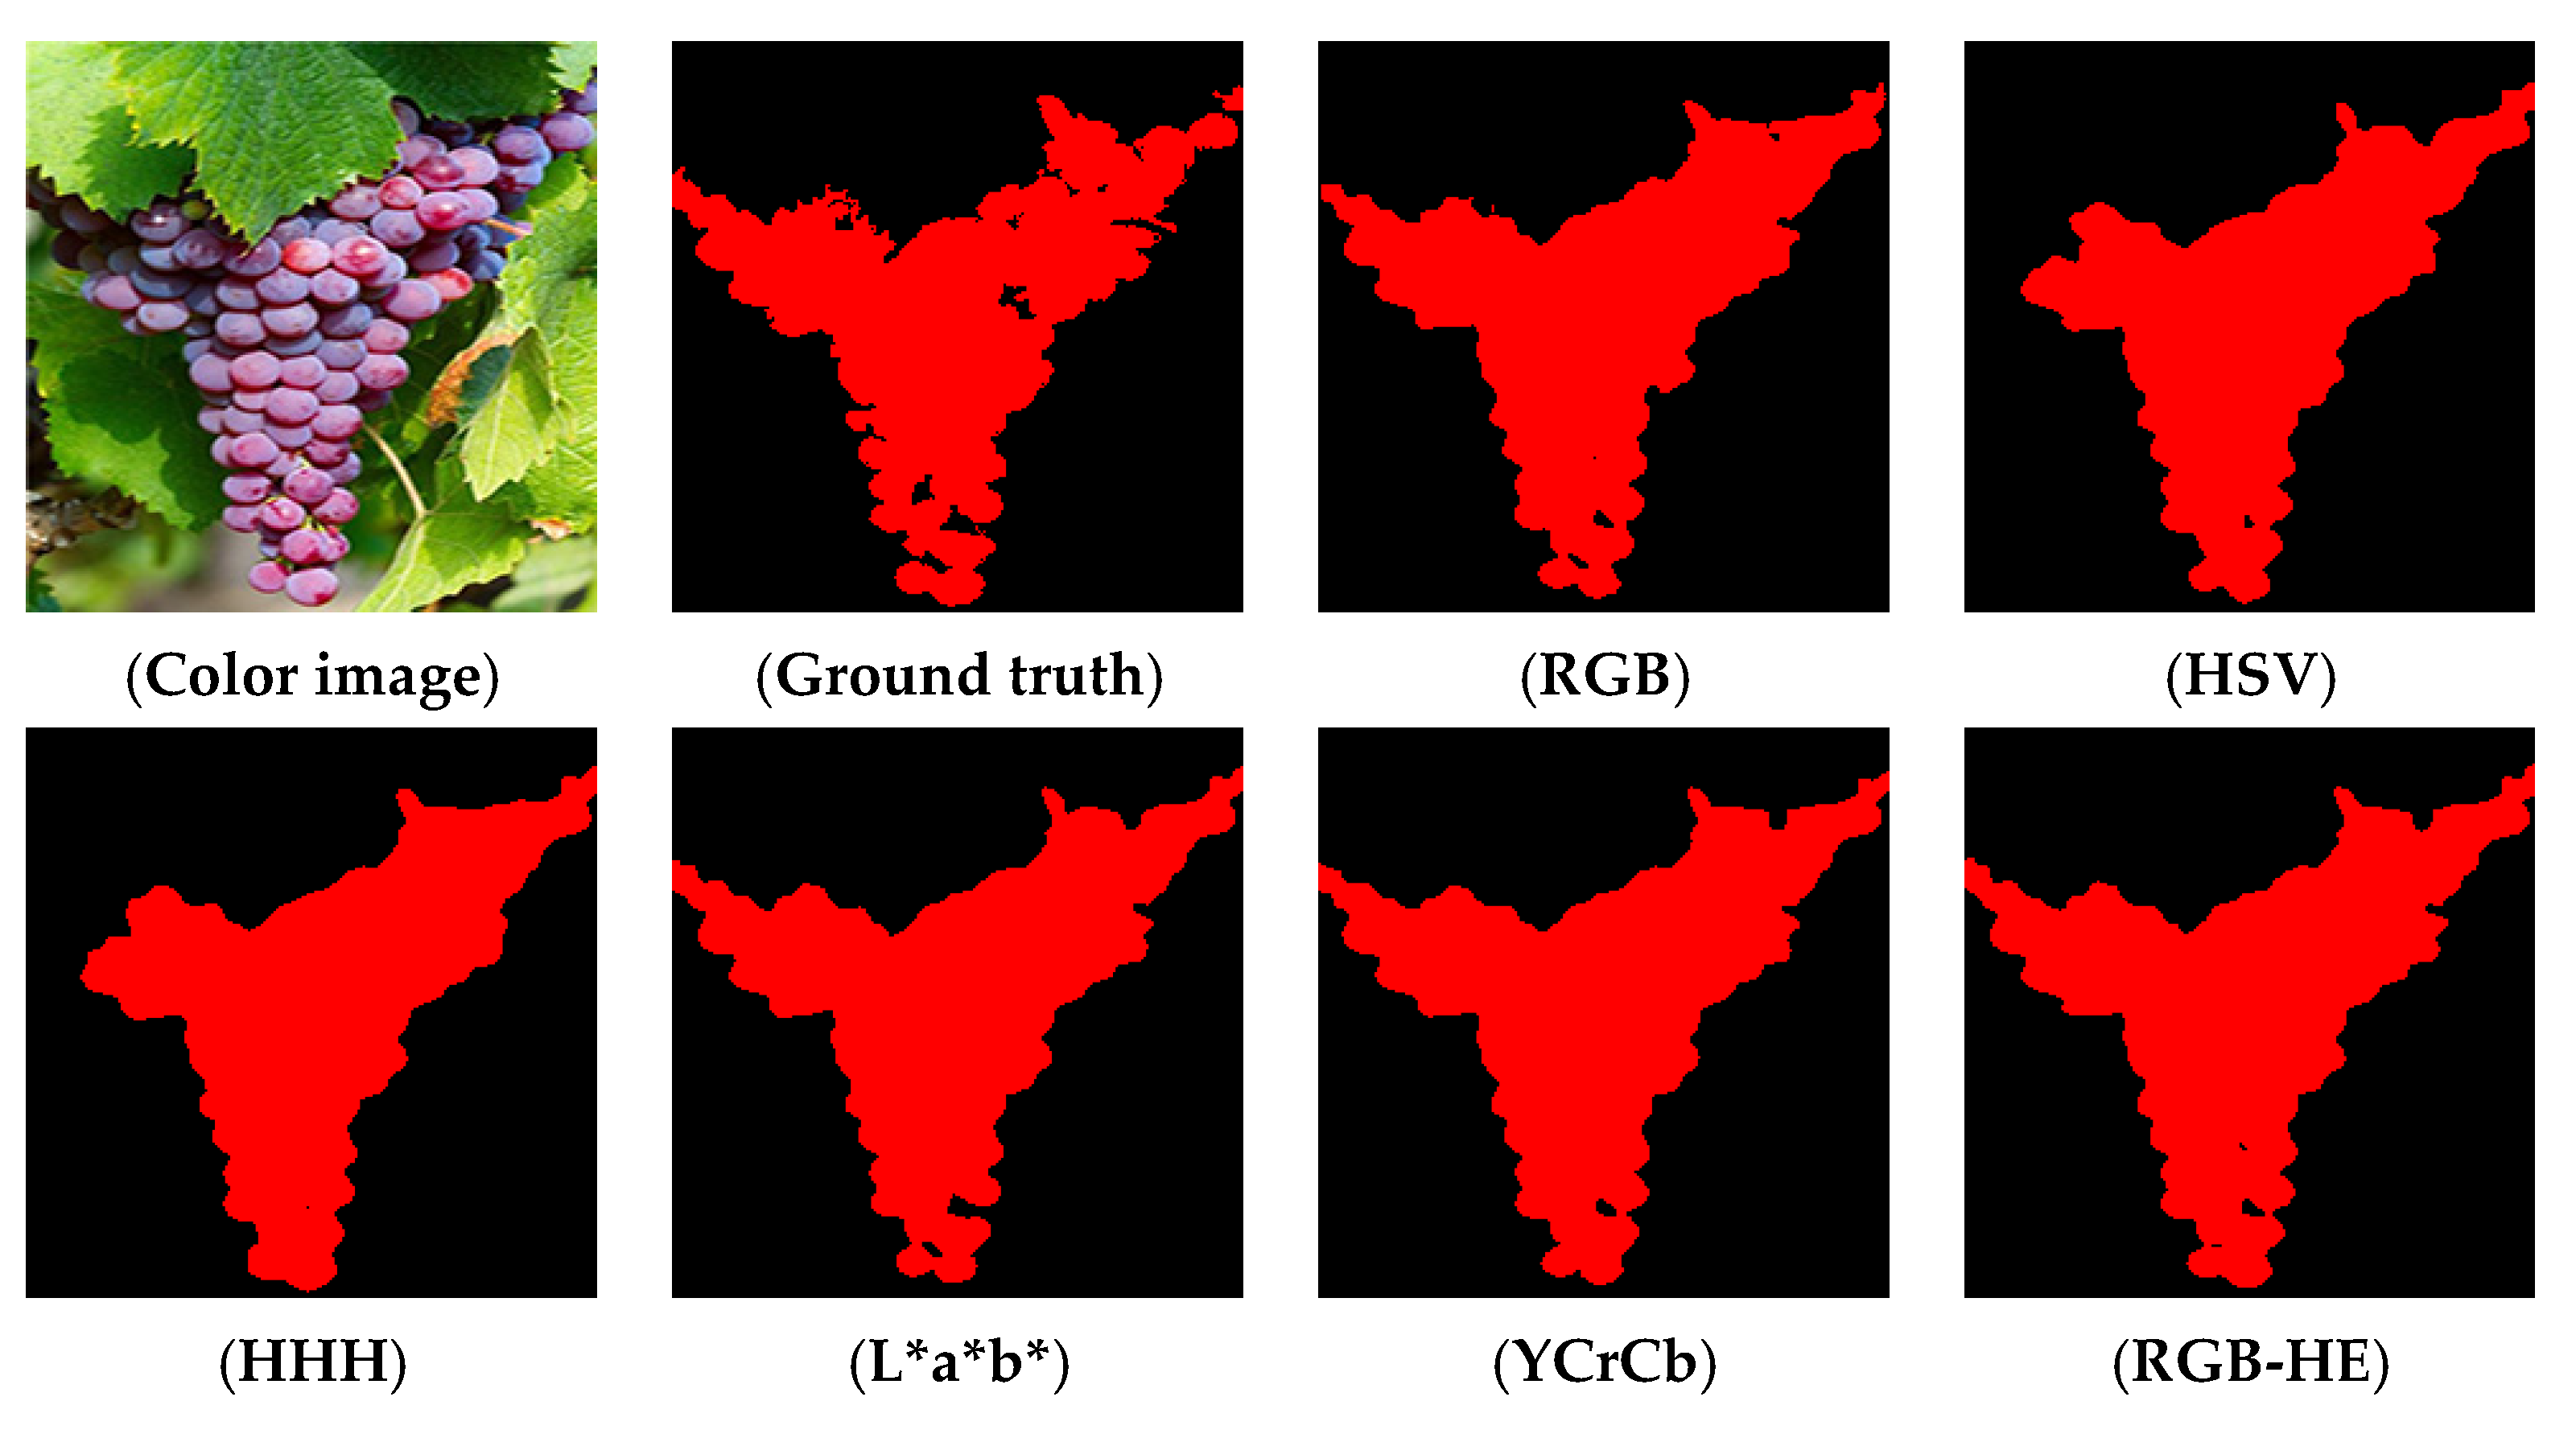
Table 5 shows the segmentation IoU, precision, and recall of DeepLabev3+ model with different representations. Additionally, the visualization of pixel-wise segmentation results of different datasets could be observed in Figure 7. The IoU of different datasets varied from 81.50% to 88.44%. The L*a*b obtained the best performance (88.44%), while the HHH got the worst (81.50%) IoU. Furthermore, from the view of precision and recall, the L*a*b also could achieve outperform performance, which indicate that compared with the representations of RGB, HSV, and YCrCb that the representation of L*a*b is more suitable for the segmentation of grapes. Although RGB is the most commonly used image representations style, it is not always the best choice for image segmentation. In specific applications, we can also improve the segmentation performance by exploring and selecting the best input representation, rather than blindly modifying the architecture of the network.
In addition, both works of literature [17] and [28] adopt HSV images to realize the segmentation of grapes cluster. The test results show that the model trained with the HSV input representation has a IoU of 86.31% on the corresponding test set, which is 2.05% higher than the IoU obtained by using the RGB input representation. Further analysis found that the model trained with the HSV input representation on the corresponding 88 test sets, compared with the RGB input representation, the performance of 72 images has been improved, accounting for 81.8%, of which the performance of 28 images is obtained significant improvement (IoU improved by more than 5%), accounting for 31.8%, Which indicate that the HSV color model does indeed has a positive effect to improve the segmentation performance.
Furthermore, since [35] only adopt the characteristics of the large difference between the cluster and background in the H channel to obtain the grapes cluster area. For this reason, the experiment tried to construct a new input representation-HHH for model training and testing. Although the precision dropped slightly, the IoU and recall dropped from 86.31% and 91.05 of HSV input representation to 81.50% and 87.00% by a large margin. This seems to show that for grape segmentation, although the separate processing of H component is more suitable for conventional image processing methods. When using deep learning, the absence of S and V components makes the model lose more opportunities for feature learning which lead a degradation of the network performance.
Therefore, in practical applications, it is not recommended to use the HHH model as an input representation method for the segmentation of grape clusters. Also, it does not recommend that training various types of deep models using this strategy that uses the same channel to construct a multi-channel input representation. We should try to train the network with richer information and features rather than reducing the amount of input information. The information other than color, such as NIR, depth, or spectrum, could be adopted to further improve the performance of the model [10,36].

3.4. The Effect of Image Enhancement

Table 6 shows the segmentation performance of DeepLabev3+ model with RGB and HE-RGB. Also, the visualization of pixel-wise segmentation results could also be observed in Figure 7. All the three metrics of the enhanced dataset have been improved, the IoU, precision, and recall are improved by 3.88%, 1.38%, and 3.03%, respectively.
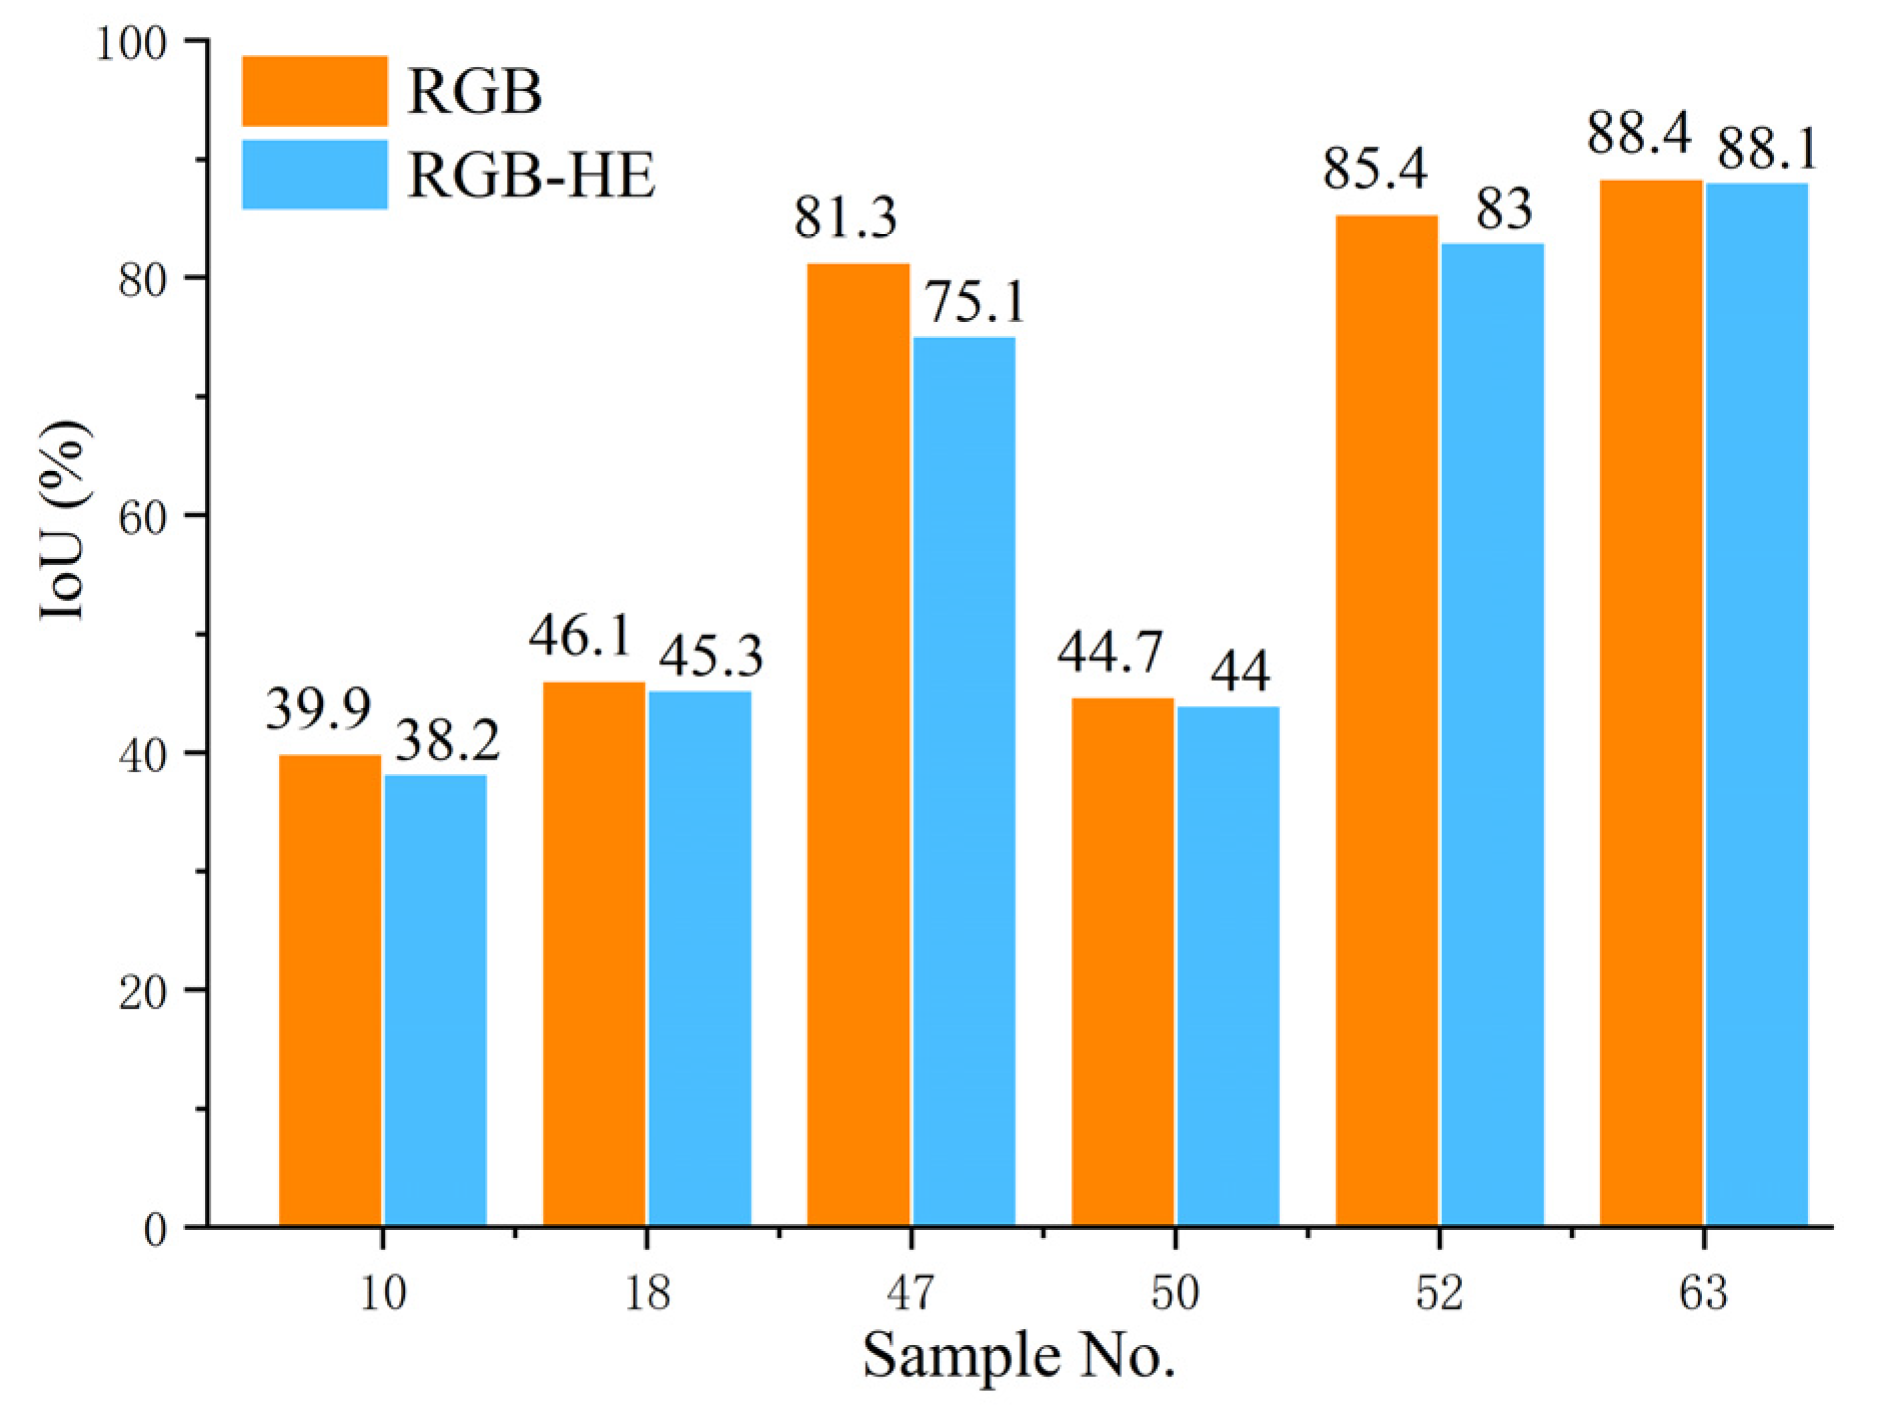
Specifically, the IoU of 82 images (total 88) processed with HE enhancement was higher than that without HE enhancement, the ratio was about 93.2%. For those samples whose contrast were not significant due to poor lighting conditions, after the HE enhancement, IoU has been significantly improved (IoU increased by 5%). Although the IoU of 6 images has decreased after HE enhancement, the decrease is small. It can be seen from Figure 8, that the maximum decrease is 6.2% (No.47 sample in test datasets), and the others are within 2.5%. The results indicate that the HE image enhancement method could effectively improve the segmentation ability of the model. In addition, in [25], the image enhancement method was used for two datasets (one with better lighting conditions and the other with worse lighting conditions). The results showed that the segmentation performance of the dataset with poor lighting conditions was significantly improved. Moreover, although the segmentation performance of the dataset with better lighting conditions has not been significantly improved, there is no negative effect.
To sum up, we suggest that when using deep learning related methods for image segmentation, the image enhancement preprocessing should be considered, although this does not guarantee that the performance can be improved, there will be no negative effect. What we need to pay attention to is in addition to HE, image enhancement methods commonly used include deep photo encoder, Laplacian-based methods, and logarithmic Log transform methods. These required to carry out further research to ascertain its actual effect.

3.5. The Effect of Different Distance

The performance of samples at different distances in each dataset were as shown in Table 7. It can be observed that there is a certain relationship between the grapes cluster distance in the image and the segmentation performance of the model, that is, the closer the distance, the better the segmentation performance. This is in line with our intuition. After all, the closer the distance, the clearer the target and easier for feature extraction. On the contrary, the farther the distance, the smaller the target. The more fuzzy the features were, the more difficult the extraction and recognition were. Especially for grapes in trellis cultivation mode, if the camera places in the horizontal direction to capture the image, then a large number of distant grapes will inevitably appear in the camera’s field of view. These grapes are often outside the working range of the robot end effector. The existence of such grapes clusters not only affects the model segmentation performance but also has no practical application value even if it can be accurately detected and segmented. Therefore, if such distant and small grapes can be removed, not only the segmentation ability of the model can be improved, but also improve the processing speed of the network by reducing the number of pixels to be processed. Nowadays, the commercial RGBD cameras, such as Intel’s RealSense and Asus’s Kinect have the ability to obtain target distances with high precision and widely used in many studies [34,35]. It is believed that with distance threshold segmentation of the collected images, those objects that are far, small, and not in the working range of the robot arm are removed, and then fed into the model for recognition. Through such preprocessing, the segmentation performance of the model can be improved.

3.6. Identification Performance of Different Grape Varieties

As the dataset contains different varieties of grapes, the segmentation performance of different varieties of grapes under different conditions is also worthy of attention. Table 8 shows the performance of different varieties of grapes on each dataset. As the differences of grapes in the datasets are mainly reflected in the color differences, then in this section, only the performance differences of different colors of grapes are discussed.
It could be observed that the black grapes always achieve the best performance on any dataset, while the green grapes always obtain the worst performance. For the black grapes, the best performance was obtained on the L*a*b dataset with IoU, precision, and recall of 90.1%, 96.7%, and 93.0%, respectively. From Table 1, we can see that the training dataset contains the most black grapes and the least green grapes, which is the reason for their performance difference. Therefore, we believe that in practical application, the performance could be improved by enlarge the dataset, and this is the most direct and effective method.

3.7. Runtime

Based on the pre-trained model, the training time for every dataset for 40,000 iterations was about 3 h on the workstation mentioned in 2.6. When the trained model was used for pixel-wise segmentation of grapes image, the processing time of each image is shown in Table 9. The processing time for every classifier was different, varied from 29 ms to 68 ms. The most time-consuming classifier is HE plus DeepLabv3+, which cost 68 ms to process a 224 × 224 image. Of course, the higher the image pixel, the more processing time it takes. In actual production, the resolution of images captured by the vision sensor of the harvesting robot is often much greater than 224 × 224, which will consume more time. When the system is strict with the segmentation time, the captured images could be downsampling and then input into the classifier.

4. Conclusions

In this research, for the semantic segmentation of different varieties of grapes, 3 state-of-the-art semantic segmentation networks, i.e., Fully Convolutional Networks (FCN), U-Net, and DeepLabv3+ applied to six different datasets were studied. The effect of different semantic networks, different input representations, image enhancement, and the distance between grape clusters and camera on the segmentation performance were evaluated.
The experiment results show that the invested semantic segmentation models combined with transfer learning could identification grapes with different varieties and compared with U-Net and FCN, the DeepLabv3+ is more suitable. In addition, different input representations also affect the segmentation performance of the model, and the L*a*b dataset could obtain a more satisfactory performance. However, in actual applications, it is necessary to conduct in-depth research and select appropriate input representations for different fruits. Furthermore, the application of image enhancement methods can improve the influence of illumination, strengthen the contrast of the image, and have a positive effect on the segmentation performance of the studied model. Last but not least, the target distance also affects the performance of the studied model. Therefore, when collecting images, the camera should be as close to the target as possible to improve the segmentation performance.
In the future, we will deploy the model to a grape harvesting robot developed by our team to realize grapes robotic harvesting in real agricultural environment. Besides, the research on the performance improvement will continue, such as network architecture modification or dataset enhancement, i.e., collect more images from different vineyards with various condition, to further improve the identification performance.
Author Contributions

Conceptualization, Y.P. and J.L.; methodology, Y.P. and A.W.; software, Y.P. and A.W.; writing—original draft preparation, Y.P.; writing—review and editing, Y.P. and M.F.; supervision, J.L.; funding acquisition, J.L. All authors have read and agreed to the published version of the manuscript.

Funding

The research was funded by grants from the National Science Foundation of China (Grant No. 31971795), A Project Funded by the Priority Academic Program Development of Jiangsu Higher Education Institutions (No.PAPD-2018-87) and Project of Faculty of Agricultural Equipment of Jiangsu University (4111680002).

Institutional Review Board Statement

Not applicable.

Informed Consent Statement

Not applicable.

Data Availability Statement

Not applicable.

Conflicts of Interest

The authors declare no conflict of interest.

References

  1. Tian, Y.; Chen, G.; Li, J.; Xiang, X.; Liu, Y.; Li, H.Y. Present development of grape industry in the world. Chin. J. Trop. Agric. 2018, 38, 96–105. [Google Scholar]
  2. Pellenc, R.; Gialis, J.-M. Shaker with Adjustable Stiffness for Harvesting Machines and Harvesting Machines Using Such Shakers. U.S. Patent 7,841,160, 31 January 2011. [Google Scholar]
  3. Wu, Q. NEW HOLLAND company VN 2080 high ground clearance grape harvester. Trans. Chin. Soc. Agric. Eng. (Trans. CSAE) 2013, 105. [Google Scholar] [CrossRef]
  4. Luo, L.; Tang, Y.; Zou, X.; Ye, M.; Feng, W.; Li, G. Vision-based extraction of spatial information in grape clusters for harvesting robots. Biosyst. Eng. 2016, 151, 90–104. [Google Scholar] [CrossRef]
  5. Gong, A.; Yu, J.; He, Y.; Qiu, Z. Citrus yield estimation based on images processed by an Android mobile phone. Biosyst. Eng. 2013, 115, 162–170. [Google Scholar] [CrossRef]
  6. Qiang, L.; Cai, J.; Liu, B.; Deng, L.; Zhang, Y. Identification of fruit and branch in natural scenes for citrus harvesting robot using machine vision and support vector machine. Int. J. Agric. Biol. Eng. 2014, 7, 115–121. [Google Scholar]
  7. Ji, W.; Zhao, D.; Cheng, F.; Xu, B.; Zhang, Y.; Wang, J. Automatic recognition vision system guided for apple harvesting robot. Comput. Electr. Eng. 2012, 38, 1186–1195. [Google Scholar] [CrossRef]
  8. Feng, J.; Zeng, L.; Liu, G.; Si, Y. Fruit recognition algorithm based on multi-source images fusion. Nongye Jixie Xuebao/Trans. Chin. Soc. Agric. Mach. 2014, 45, 73–80. [Google Scholar]
  9. Longsheng, F.; Bin, W.; Yongjie, C.; Shuai, S.; Gejima, Y.; Kobayashi, T. Kiwifruit recognition at nighttime using artificial lighting based on machine vision. Int. J. Agric. Biol. Eng. 2015, 8, 52–59. [Google Scholar]
  10. Liu, Z.; Wu, J.; Fu, L.; Majeed, Y.; Feng, Y.; Li, R.; Cui, Y. Improved kiwifruit detection using pre-trained VGG16 with RGB and NIR information fusion. IEEE Access 2019, 8, 2327–2336. [Google Scholar] [CrossRef]
  11. El-Mashharawi, H.Q.; Abu-Naser, S.S.; Alshawwa, I.A.; Elkahlout, M. Grape type classification using deep learning. Int. J. Acad. Eng. Res. 2020, 3, 41–45. [Google Scholar]
  12. Franczyk, B.; Hernes, M.; Kozierkiewicz, A.; Kozina, A.; Pietranik, M.; Roemer, I.; Schieck, M. Deep learning for grape variety recognition. Procedia Comput. Sci. 2020, 176, 1211–1220. [Google Scholar] [CrossRef]
  13. Türkoğlu, M.; Hanbay, D. Classification of the grape varieties based on leaf recognition by using SVM classifier. In Proceedings of the 2015 23nd Signal Processing and Communications Applications Conference (SIU), Malatya, Turkey, 16–19 May 2015; pp. 2674–2677. [Google Scholar]
  14. Chamelat, R.; Rosso, E.; Choksuriwong, A.; Rosenberger, C.; Laurent, H.; Bro, P. Grape detection by image processing. In Proceedings of the IECON 2006-32nd Annual Conference on IEEE Industrial Electronics, Paris, France, 6–10 November 2006; pp. 3697–3702. [Google Scholar]
  15. Reis, M.J.; Morais, R.; Peres, E.; Pereira, C.; Contente, O.; Soares, S.; Valente, A.; Baptista, J.; Ferreira, P.J.S.; Cruz, J.B. Automatic detection of bunches of grapes in natural environment from color images. J. Appl. Log. 2012, 10, 285–290. [Google Scholar] [CrossRef] [Green Version]
  16. Śkrabánek, P. DeepGrapes: Precise Detection of Grapes in Low-resolution Images. IFAC-Pap. 2018, 51, 185–189. [Google Scholar] [CrossRef]
  17. Liu, S.; Whitty, M. Automatic grape bunch detection in vineyards with an SVM classifier. J. Appl. Log. 2015, 13, 643–653. [Google Scholar] [CrossRef]
  18. Luo, L.; Zou, X.; Yang, Z.; Li, G.; Song, X.; Zhang, C. Grape image fast segmentation based on improved artificial bee colony and fuzzy clustering. Trans. CSAM 2015, 46, 23–28. [Google Scholar]
  19. Lottes, P.; Behley, J.; Milioto, A.; Stachniss, C. Fully convolutional networks with sequential information for robust crop and weed detection in precision farming. IEEE Robot. Autom. Lett. 2018, 3, 2870–2877. [Google Scholar] [CrossRef] [Green Version]
  20. Tang, J.; Wang, D.; Zhang, Z.; He, L.; Xin, J.; Xu, Y. Weed identification based on K-means feature learning combined with convolutional neural network. Comput. Electron. Agric. 2017, 135, 63–70. [Google Scholar] [CrossRef]
  21. Koirala, A.; Walsh, K.; Wang, Z.; McCarthy, C. Deep learning for real-time fruit detection and orchard fruit load estimation: Benchmarking of ‘MangoYOLO’. Precis. Agric. 2019, 20, 1107–1135. [Google Scholar] [CrossRef]
  22. Xu, Z.-F.; Jia, R.-S.; Sun, H.-M.; Liu, Q.-M.; Cui, Z. Light-YOLOv3: Fast method for detecting green mangoes in complex scenes using picking robots. Appl. Intell. 2020, 50, 4670–4687. [Google Scholar] [CrossRef]
  23. Yu, Y.; Zhang, K.; Liu, H.; Yang, L.; Zhang, D. Real-time visual localization of the picking points for a ridge-planting strawberry harvesting robot. IEEE Access 2020, 8, 116556–116568. [Google Scholar] [CrossRef]
  24. Kuznetsova, A.; Maleva, T.; Soloviev, V. Using YOLOv3 algorithm with pre-and post-processing for apple detection in fruit-harvesting robot. Agronomy 2020, 10, 1016. [Google Scholar] [CrossRef]
  25. Wang, A.; Xu, Y.; Wei, X.; Cui, B. Semantic segmentation of crop and weed using an encoder-decoder network and image enhancement method under uncontrolled outdoor illumination. IEEE Access 2020, 8, 81724–81734. [Google Scholar] [CrossRef]
  26. Milioto, A.; Lottes, P.; Stachniss, C. Real-time semantic segmentation of crop and weed for precision agriculture robots leveraging background knowledge in CNNs. In Proceedings of the 2018 IEEE International Conference on Robotics and Automation (ICRA), Brisbane, Australia, 21–25 May 2018; pp. 2229–2235. [Google Scholar]
  27. Rafael, C.; Gonzalez, R. Digital Image Processing, 3rd ed.; Prentice-Hall, Inc.: Hoboken, NJ, USA, 2007. [Google Scholar]
  28. Font, D.; Tresanchez, M.; Martínez, D.; Moreno, J.; Clotet, E.; Palacín, J. Vineyard yield estimation based on the analysis of high resolution images obtained with artificial illumination at night. Sensors 2015, 15, 8284–8301. [Google Scholar] [CrossRef] [PubMed] [Green Version]
  29. Chen, L.-C.; Zhu, Y.; Papandreou, G.; Schroff, F.; Adam, H. Encoder-decoder with atrous separable convolution for semantic image segmentation. In Proceedings of the European Conference on Computer Vision (ECCV), Munich, Germany, 8–14 September 2018; pp. 801–818. [Google Scholar]
  30. Long, J.; Shelhamer, E.; Darrell, T. Fully convolutional networks for semantic segmentation. In Proceedings of the IEEE Conference on Computer Vision and Pattern Recognition, Boston, MA, USA, 7–12 June 2015; pp. 3431–3440. [Google Scholar]
  31. Zhao, J.; Lan, Y.; Pan, F.; Wen, Y.; Yang, D.; Lu, L. Extraction of maize field ridge centerline based on FCN with UAV remote sensing images. Trans. Chin. Soc. Agric. Eng. (Trans. CSAE) 2021, 37, 72–80. [Google Scholar]
  32. Puybareau, É.; Zhao, Z.; Khoudli, Y.; Carlinet, E.; Xu, Y.; Lacotte, J.; Géraud, T. Left atrial segmentation in a few seconds using fully convolutional network and transfer learning. In International Workshop on Statistical Atlases and Computational Models of the Heart; Springer: Cham, Switzerland, 2018; pp. 339–347. [Google Scholar]
  33. He, H.; Yang, K.; Cai, Y.; Jiang, Z.; Yu, Q.; Zhao, K.; Wang, J.; Fatholahi, S.N.; Liu, Y.; Petrosians, H.A. A comparative study of deep learning methods for building footprints detection using high spatial resolution aerial images. arXiv 2021, arXiv:2103.09300. [Google Scholar]
  34. Khan, Z.; Yahya, N.; Alsaih, K.; Ali, S.S.A.; Meriaudeau, F. Evaluation of deep neural networks for semantic segmentation of prostate in T2W MRI. Sensors 2020, 20, 3183. [Google Scholar] [CrossRef] [PubMed]
  35. Liu, P.; Zhang, T.; Hou, J. Algorithm for recognition and image segmentation of overlapping grape cluster in natural environment. Trans. Chin. Soc. Agric. Eng. (Trans. CSAE) 2020, 36, 161–169. [Google Scholar]
  36. Gené-Mola, J.; Vilaplana, V.; Rosell-Polo, J.R.; Morros, J.-R.; Ruiz-Hidalgo, J.; Gregorio, E. Multi-modal deep learning for Fuji apple detection using RGB-D cameras and their radiometric capabilities. Comput. Electron. Agric. 2019, 162, 689–698. [Google Scholar] [CrossRef]
Figure 1. The Encoder module and Decoder module of DeepLabv3+.
Agriculture 11 00997 g001
Figure 2. The difference between CNN and FCN.
Agriculture 11 00997 g002
Figure 3. The architecture of U-Net.
Agriculture 11 00997 g003
Figure 4. Network training with transfer learning strategy.
Agriculture 11 00997 g004
Figure 5. Grapes of different varieties with different input representations, column (ae) are RGB, HSV, HHH, L*a*b*, and YCrCb, respectively.
Agriculture 11 00997 g005
Figure 6. Raw and enhanced images ((a1d1) are the raw images and (a2d2) are the enhanced images).
Agriculture 11 00997 g006
Figure 7. Visualization of pixel-wise segmentation results of different datasets.
Agriculture 11 00997 g007
Figure 8. Samples with droped IoU after HE enhancement.
Agriculture 11 00997 g008
Table 1. Distribution of grape characteristics in dataset.
CharacteristicsAttribute ValueNumber of ImagesNumber of Images for TrainingNumber of Images for Testing
ColorRed22166
Green29209
Purple543816
Black19513659
ShapeSpherical29020387
Non-spherical1073
Table 2. Different dataset types generated by image preprocessing.
Preprocessing MethodDatasetNumber of Images
Image EnhancementHE-RGB300
Input representations transformationL*a*b300
HSV300
YCrCb300
HHH300
Table 3. Distance distribution of the dataset.
DistanceNumber of Images
far39
medium76
near108
far-near77
Table 4. The segmentation performance of different networks.
NetworkDataset TypeIoU (%)Precision (%)Recall (%)
U-NetRGB77.5387.7386.94
FCN75.6183.5481.12
DeepLabv3+84.2693.7889.25
Table 5. Performance of different input representations.
No.RepresentationsIoU (%)Precision (%)Recall (%)
1RGB84.2693.7889.25
2HSV86.3194.3191.05
3L*a*b*88.4495.6192.46
4HHH81.5093.1487.00
5YCrCb87.9595.5291.72
Table 6. The effect of image enhancement.
No.EnhancementRepresentationIoU (%)Precision (%)Recall (%)
1-RGB84.2693.7889.25
2HERGB88.1495.1692.28
Table 7. The performance of samples at different distances in each testing dataset.
DatasetDistanceIoU (%)Precision (%)Recall (%)
RGBfar64.084.272.6
medium80.589.988.5
near88.396.091.71
far-near83.293.288.5
HSVfar62.483.571.1
medium84.191.791.0
near90.296.093.7
far-near85.694.290.3
L*a*b*far70.086.278.8
medium85.792.192.5
near92.296.895.0
far-near87.095.690.68
YCrCbfar66.987.174.3
medium85.992.892.0
near91.696.194.3
far-near86.995.590.6
RGB-HEfar69.185.977.9
medium84.692.291.1
near91.796.894.5
far-near87.695.191.6
Table 8. The performance of different grape varieties on different datasets.
Grape
Varieties
MetricsRGBHSVL*a*bYCrCbRGB-HEHHH
BlackIoU (%)85.987.790.189.590.085.2
Precision (%)95.295.896.796.696.695.0
Recall (%)89.891.293.092.492.189.1
PurpleIoU (%)83.686.687.186.788.081.9
Precision (%)92.593.193.793.993.390.3
Recall (%)89.792.592.591.893.889.7
GreenIoU (%)79.579.584.984.783.866.1
Precision (%)91.290.393.694.693.993.5
Recall (%)86.186.990.188.988.669.3
RedIoU (%)8386.188.387.788.081.2
Precision (%)93.596.295.896.195.792.6
Recall (%)88.089.191.790.991.686.8
Table 9. Run time of the classifiers.
PreprocessingNetworkTotal
---DeepLabv3+60 ms60
HE8 ms68
---U-Net38 ms38
HE8 ms46
---FCN29 ms29
HE8 ms37
Publisher’s Note: MDPI stays neutral with regard to jurisdictional claims in published maps and institutional affiliations.