
Rice Mapping Using a BiLSTM-Attention Model from Multitemporal Sentinel-1 Data


Abstract
:1. Introduction
2. Materials and Methods
2.1. Study Area and Material
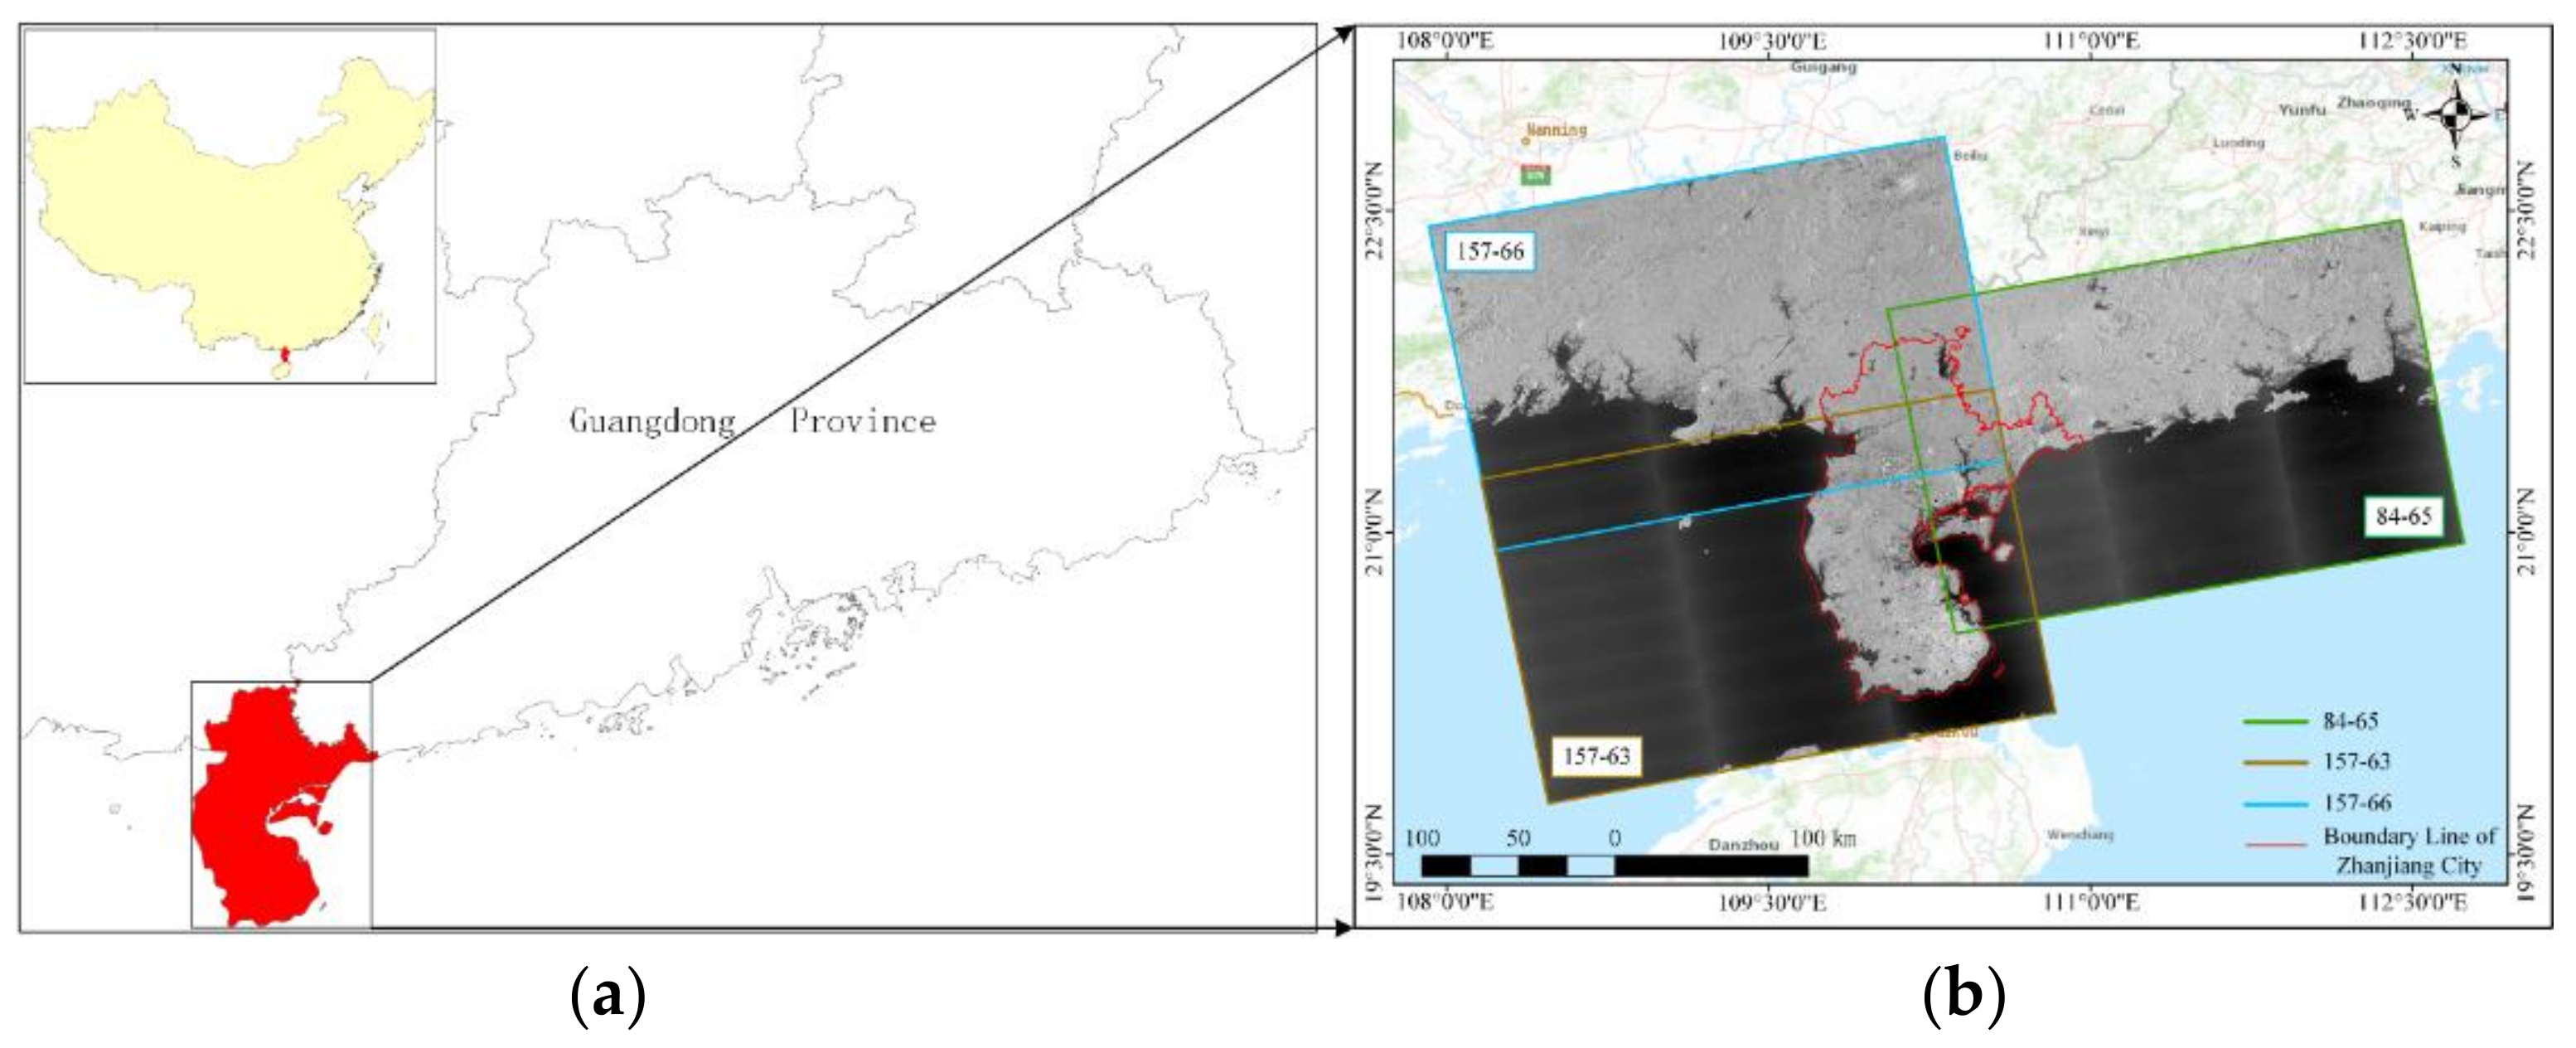
2.1.1. Study Area
2.1.2. SAR Data
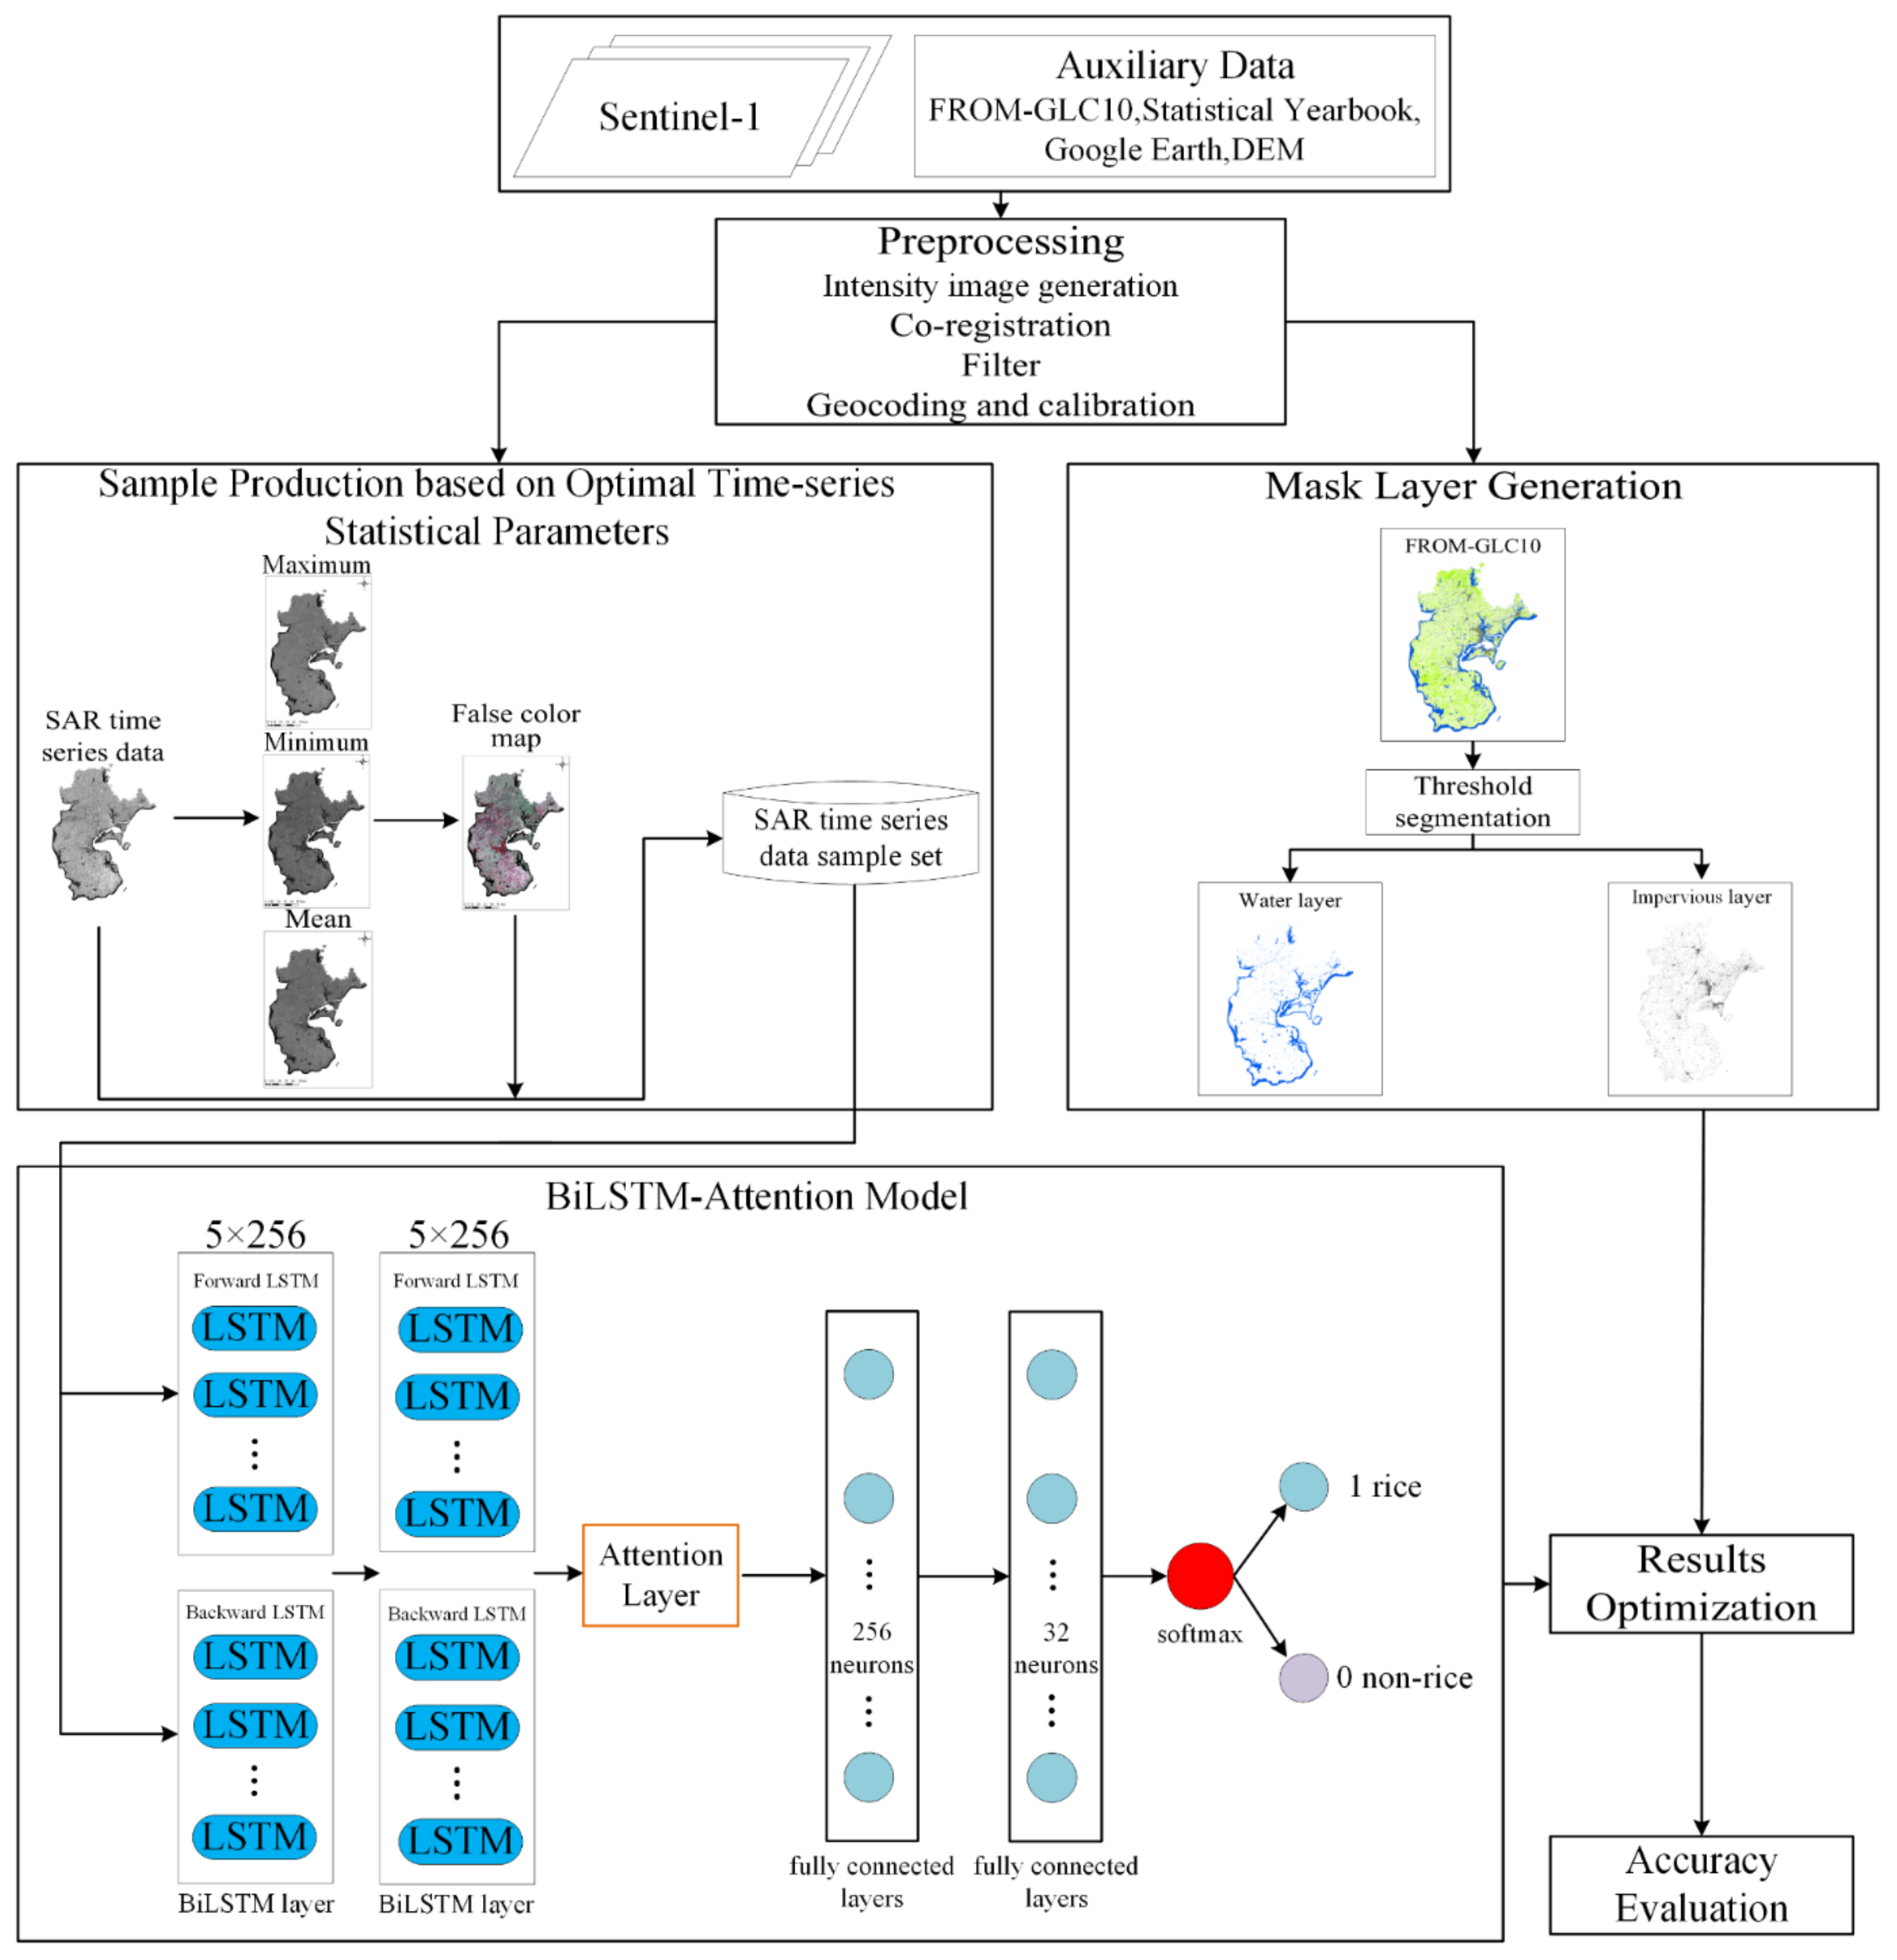
2.2. Methodology
2.2.1. Preprocessing
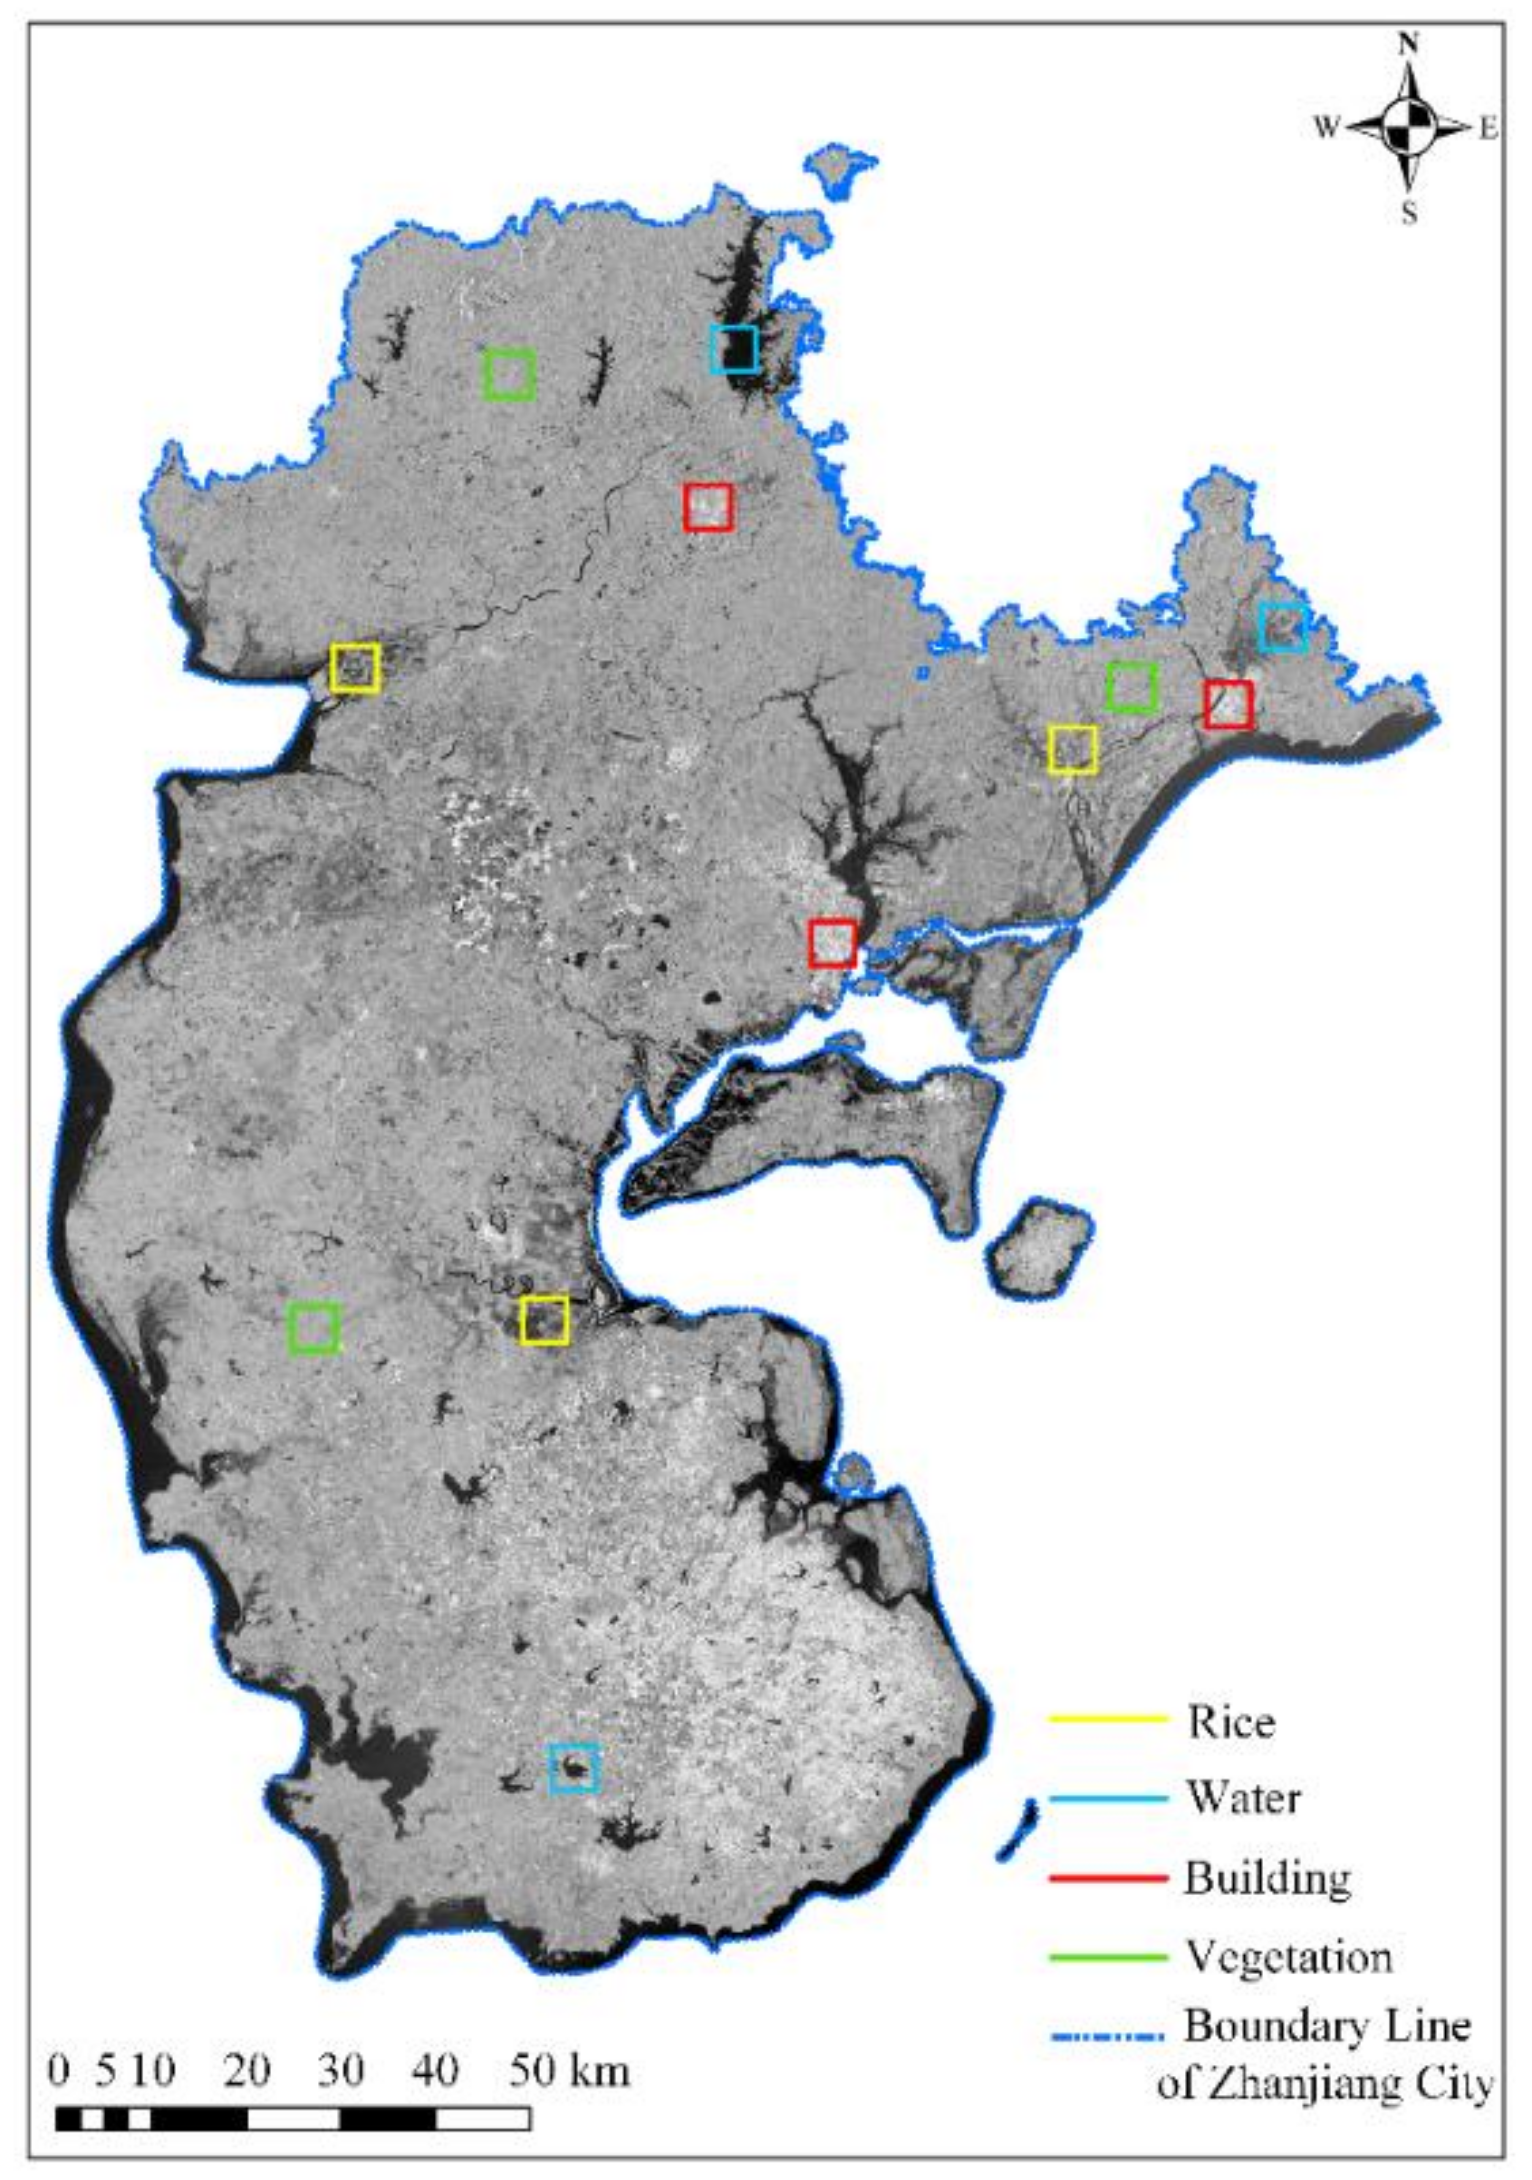
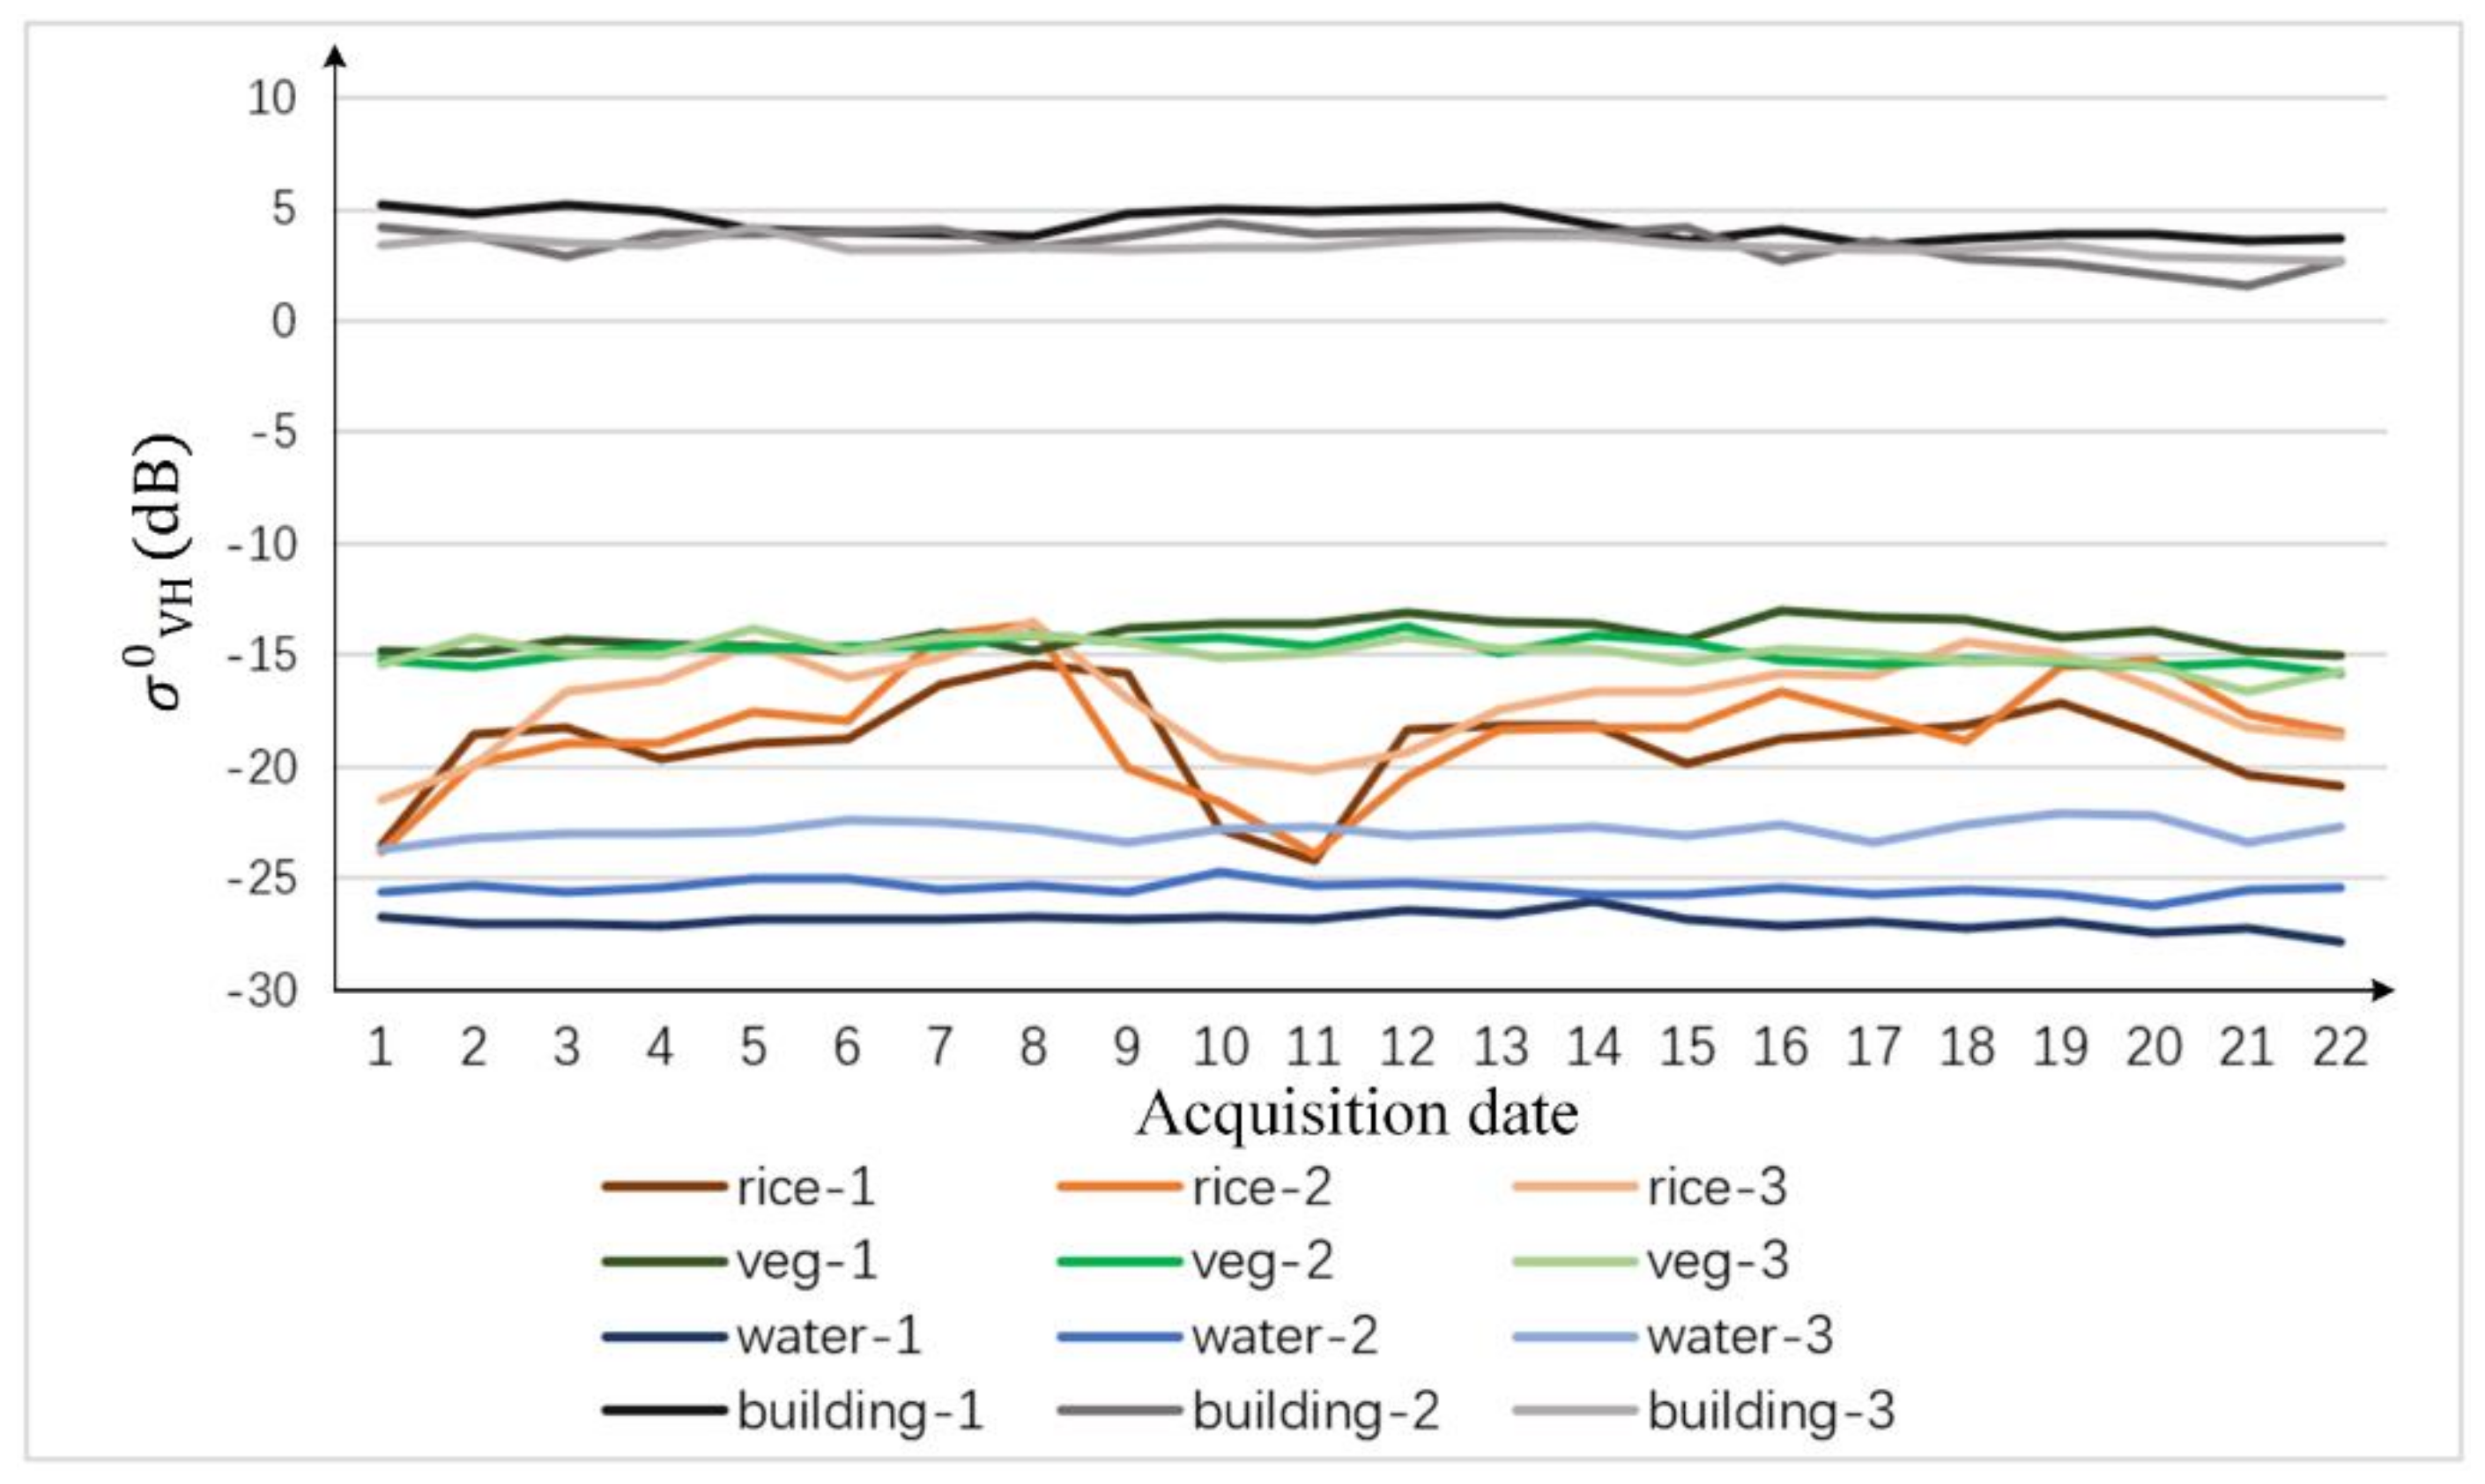
2.2.2. Time Series Curves of Different Landcovers
2.2.3. Rice Sample Production Based on Optimal Time Series Statistical Parameters
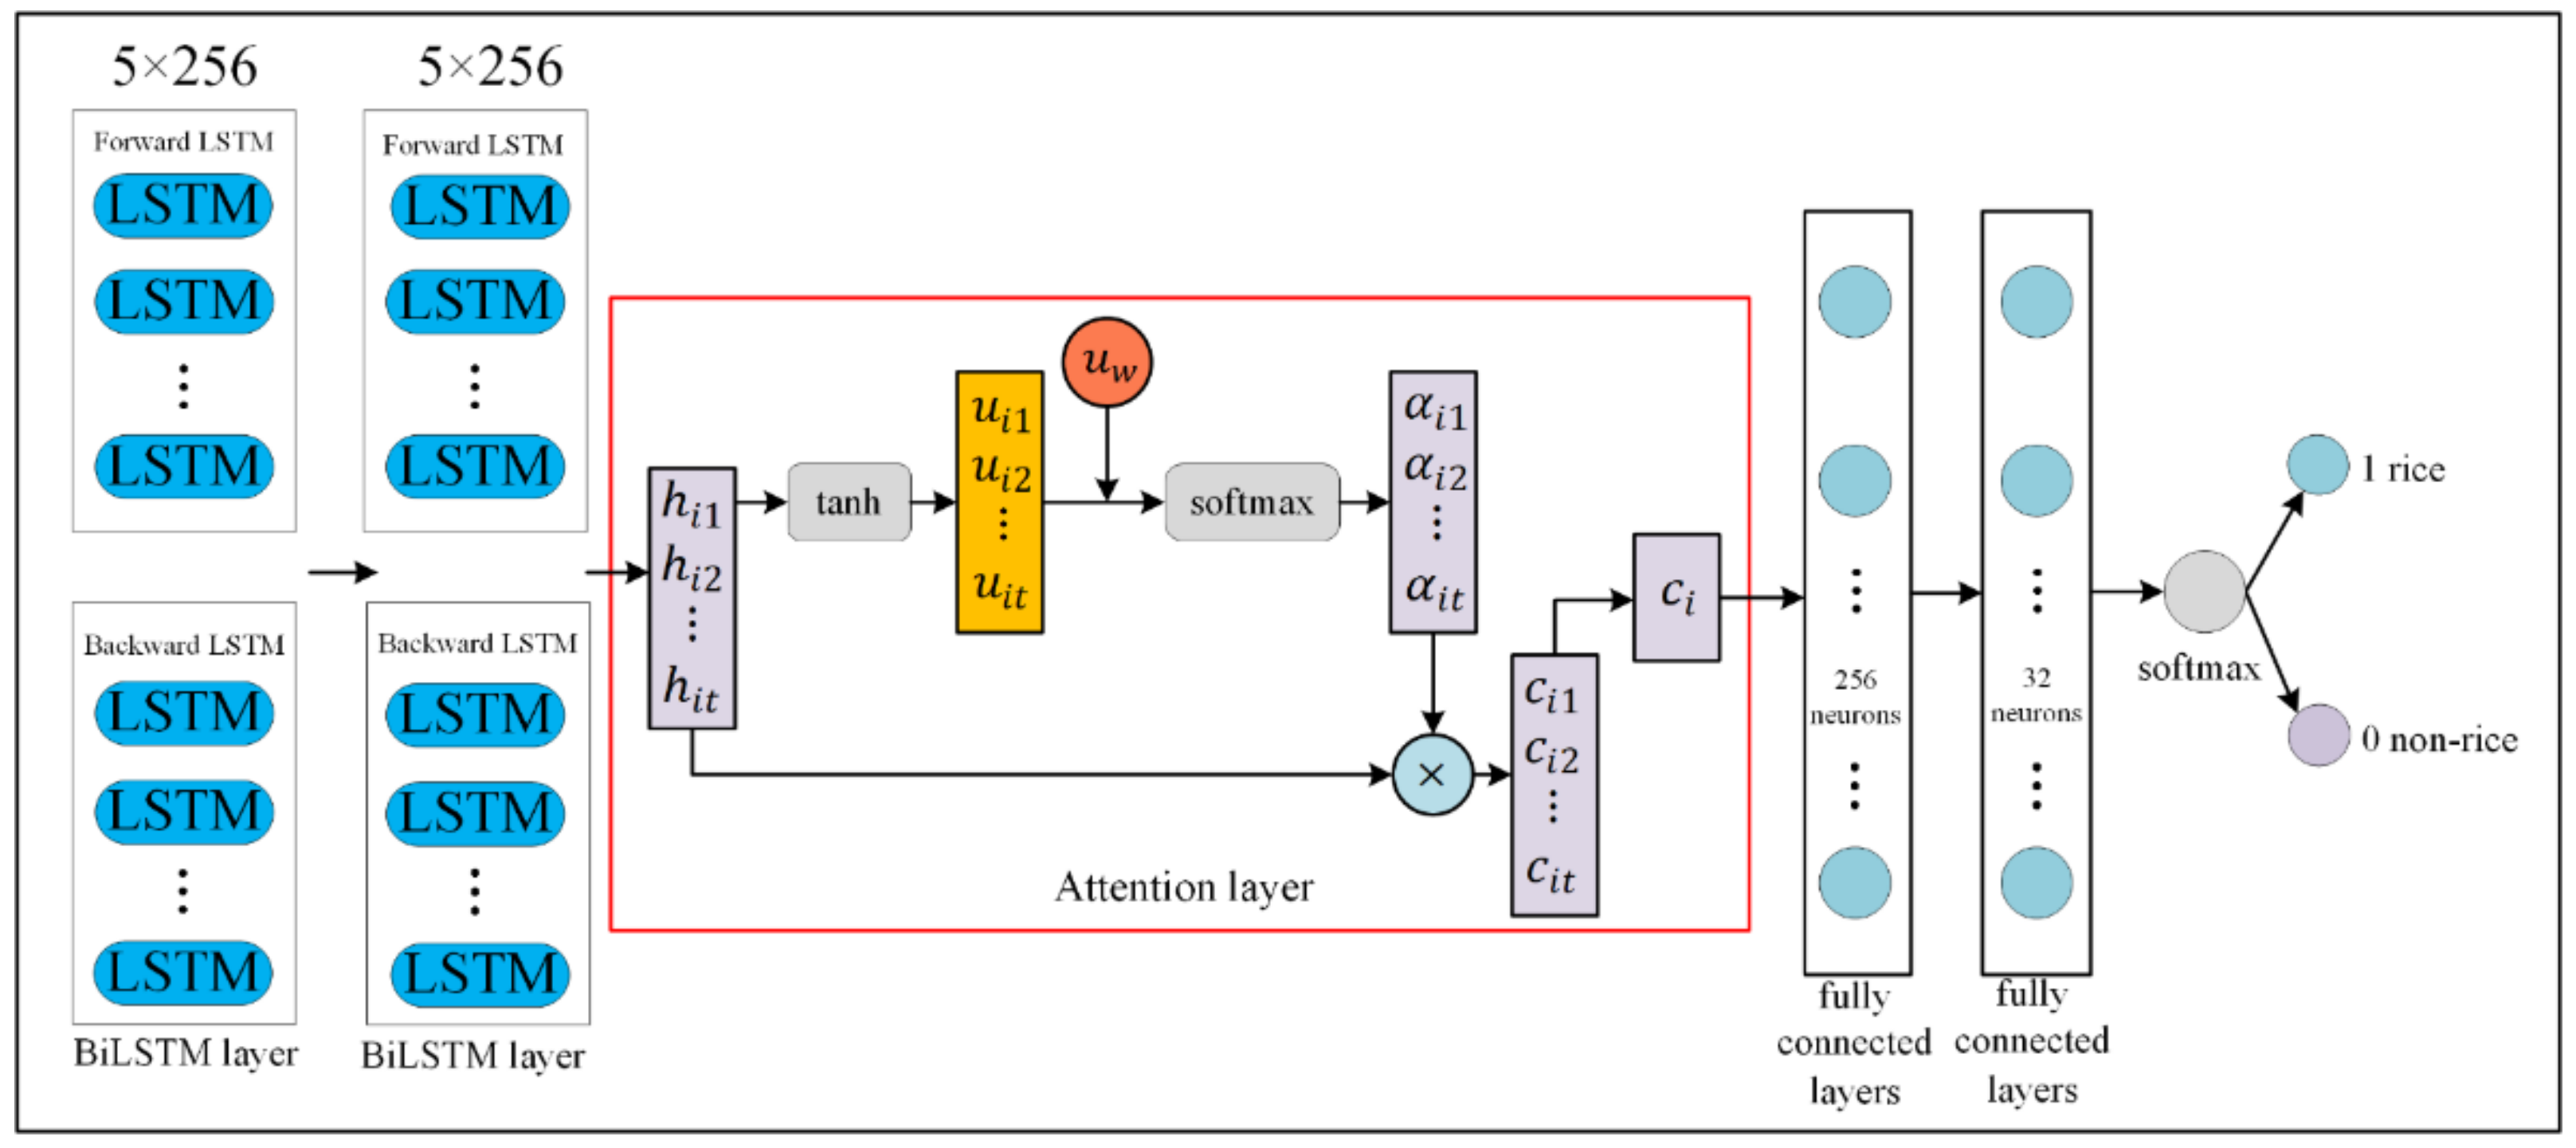
2.2.4. BiLSTM-Attention Model
2.2.5. Optimization of Classification Results Based on FROM-GLC10
2.2.6. Accuracy Evaluation
2.2.7. Parameter Settings
3. Results
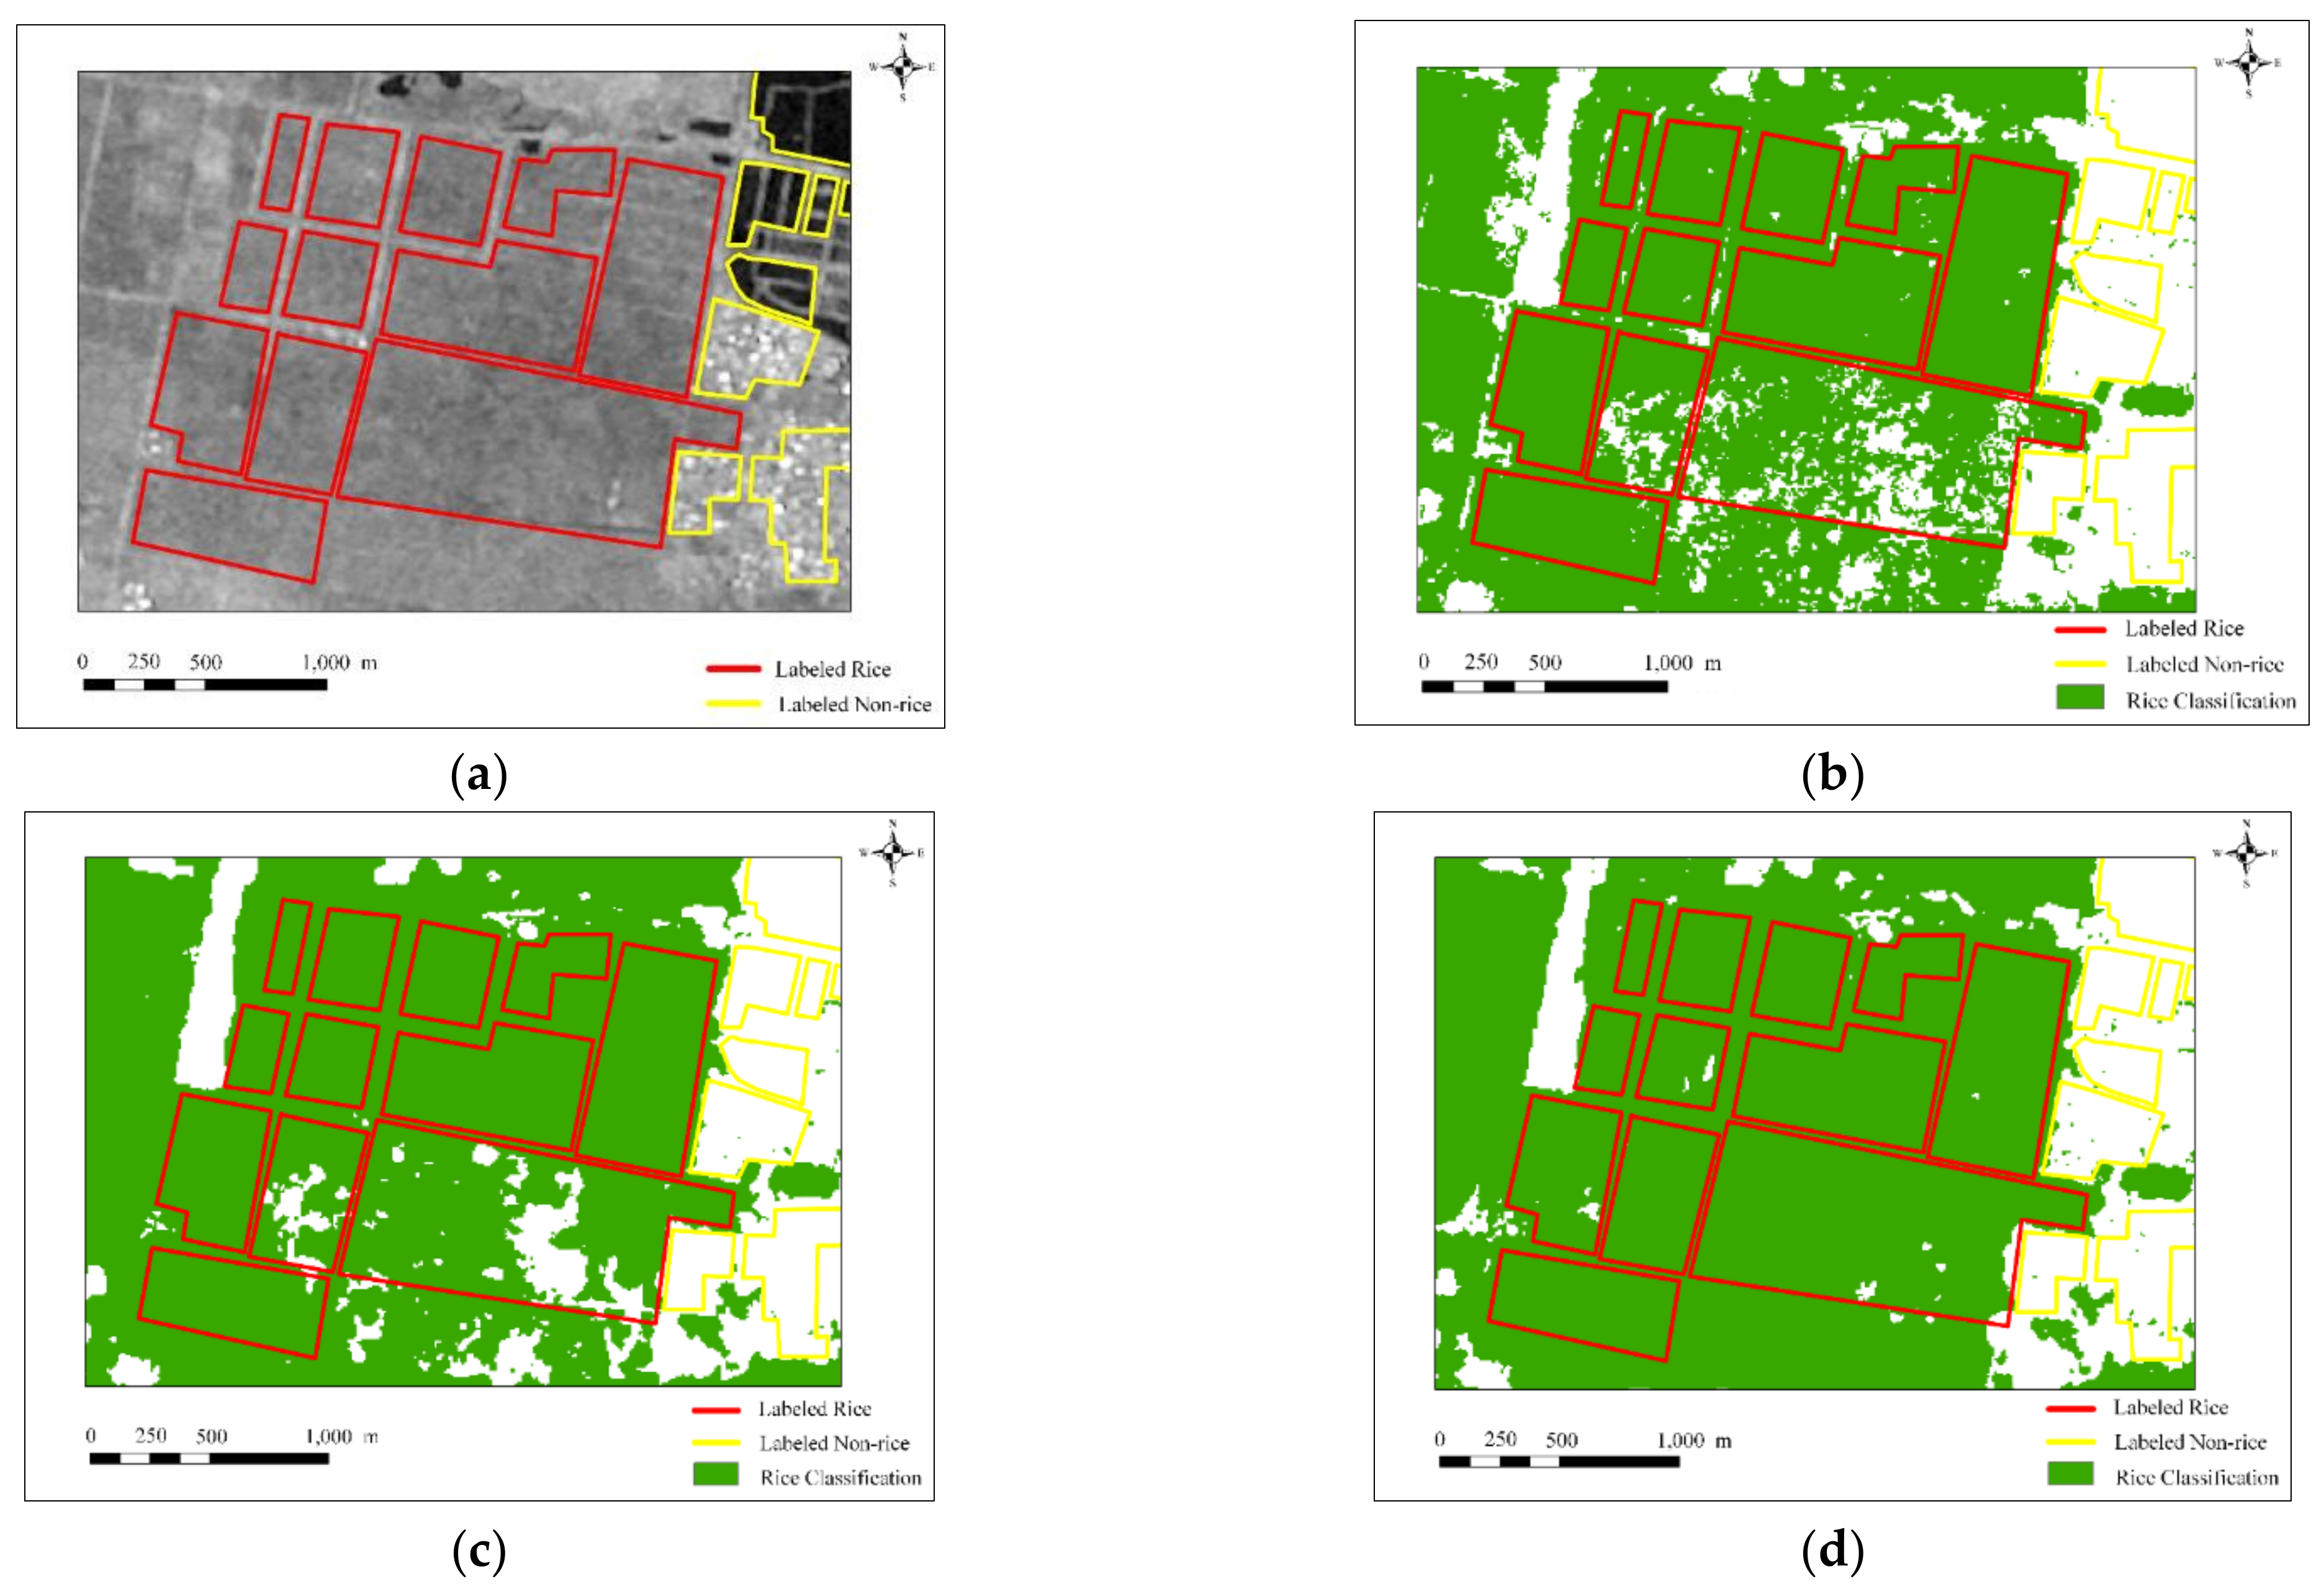
3.1. Comparison of Rice Classification Methods
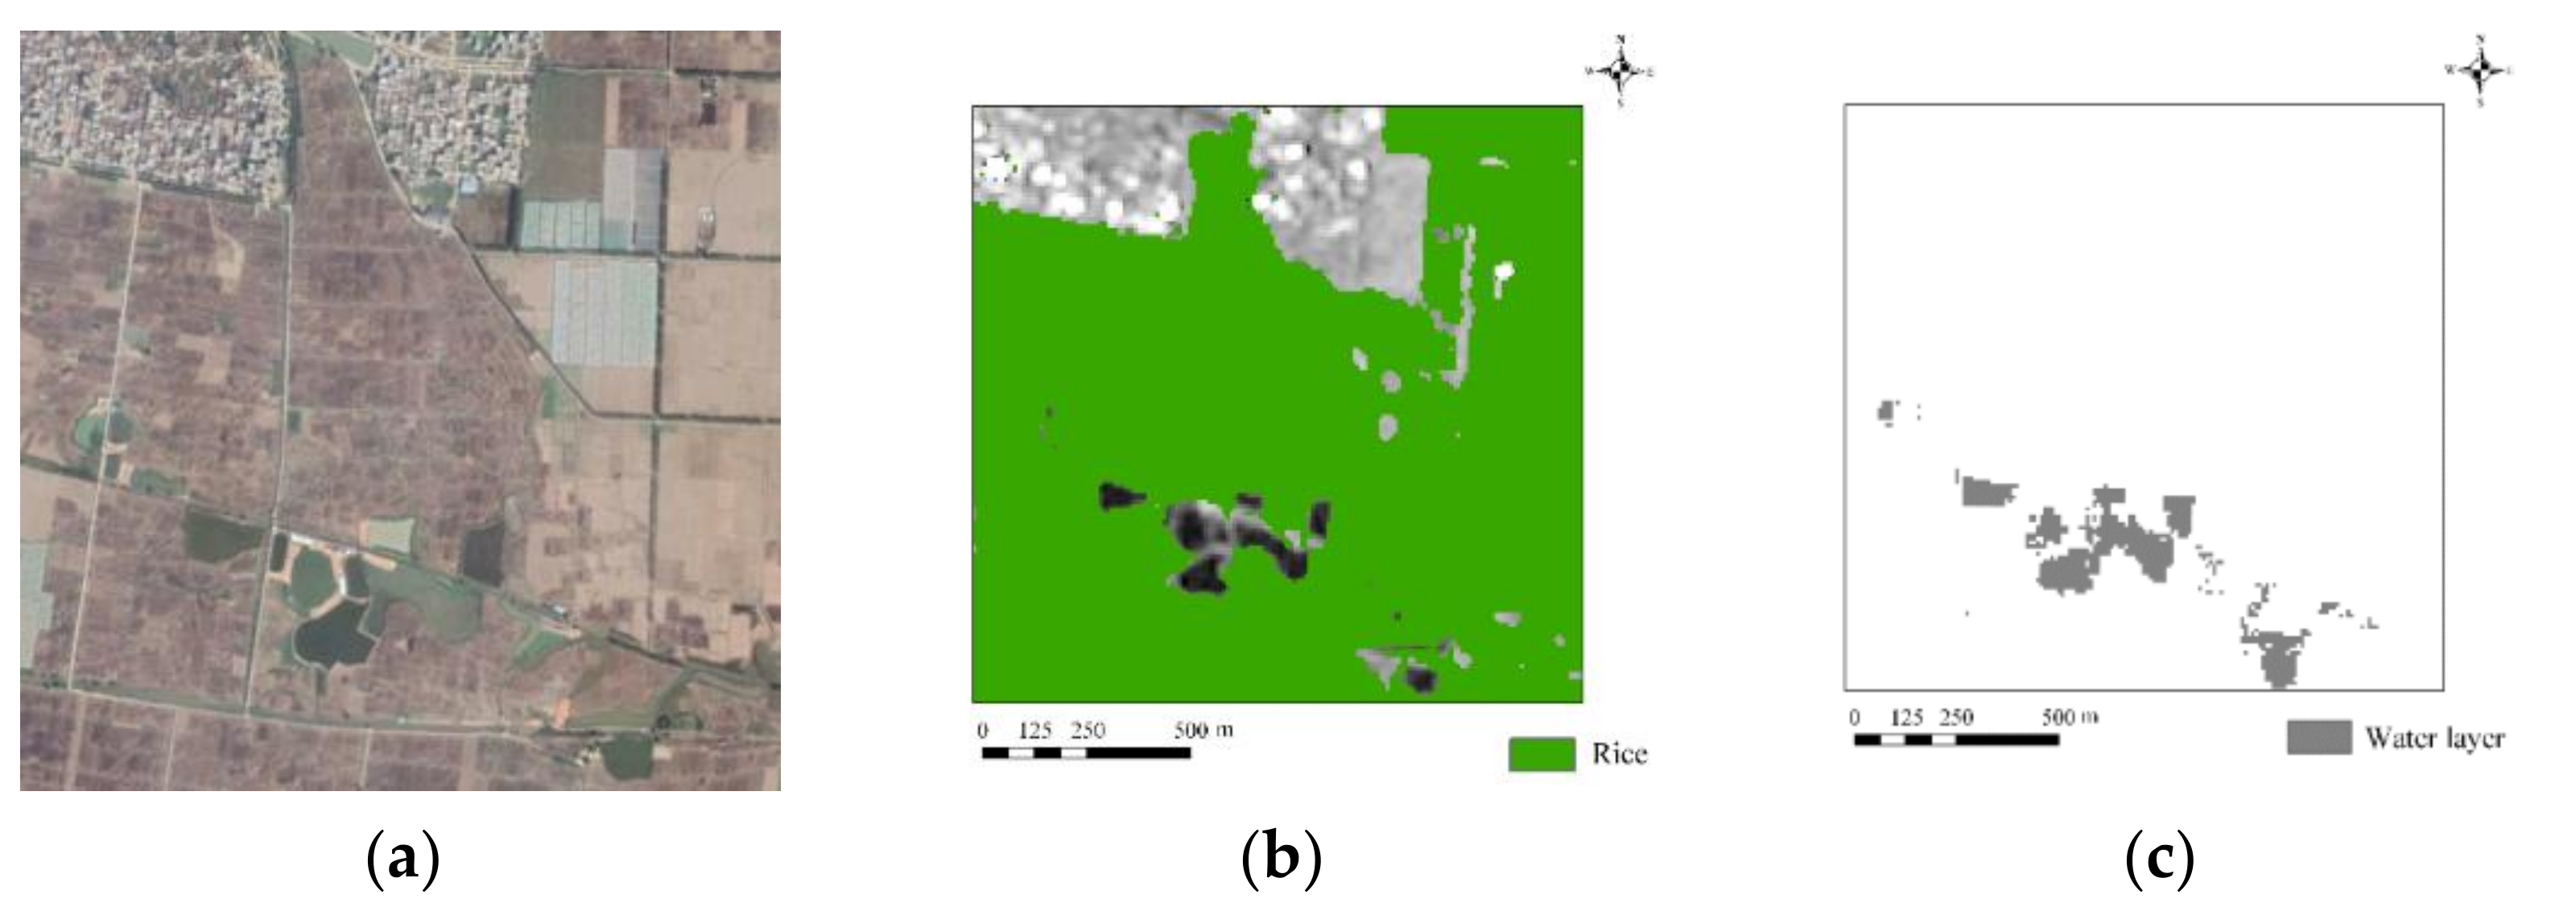
3.2. Optimization of Classification Results Based on FROM-GLC10 Data
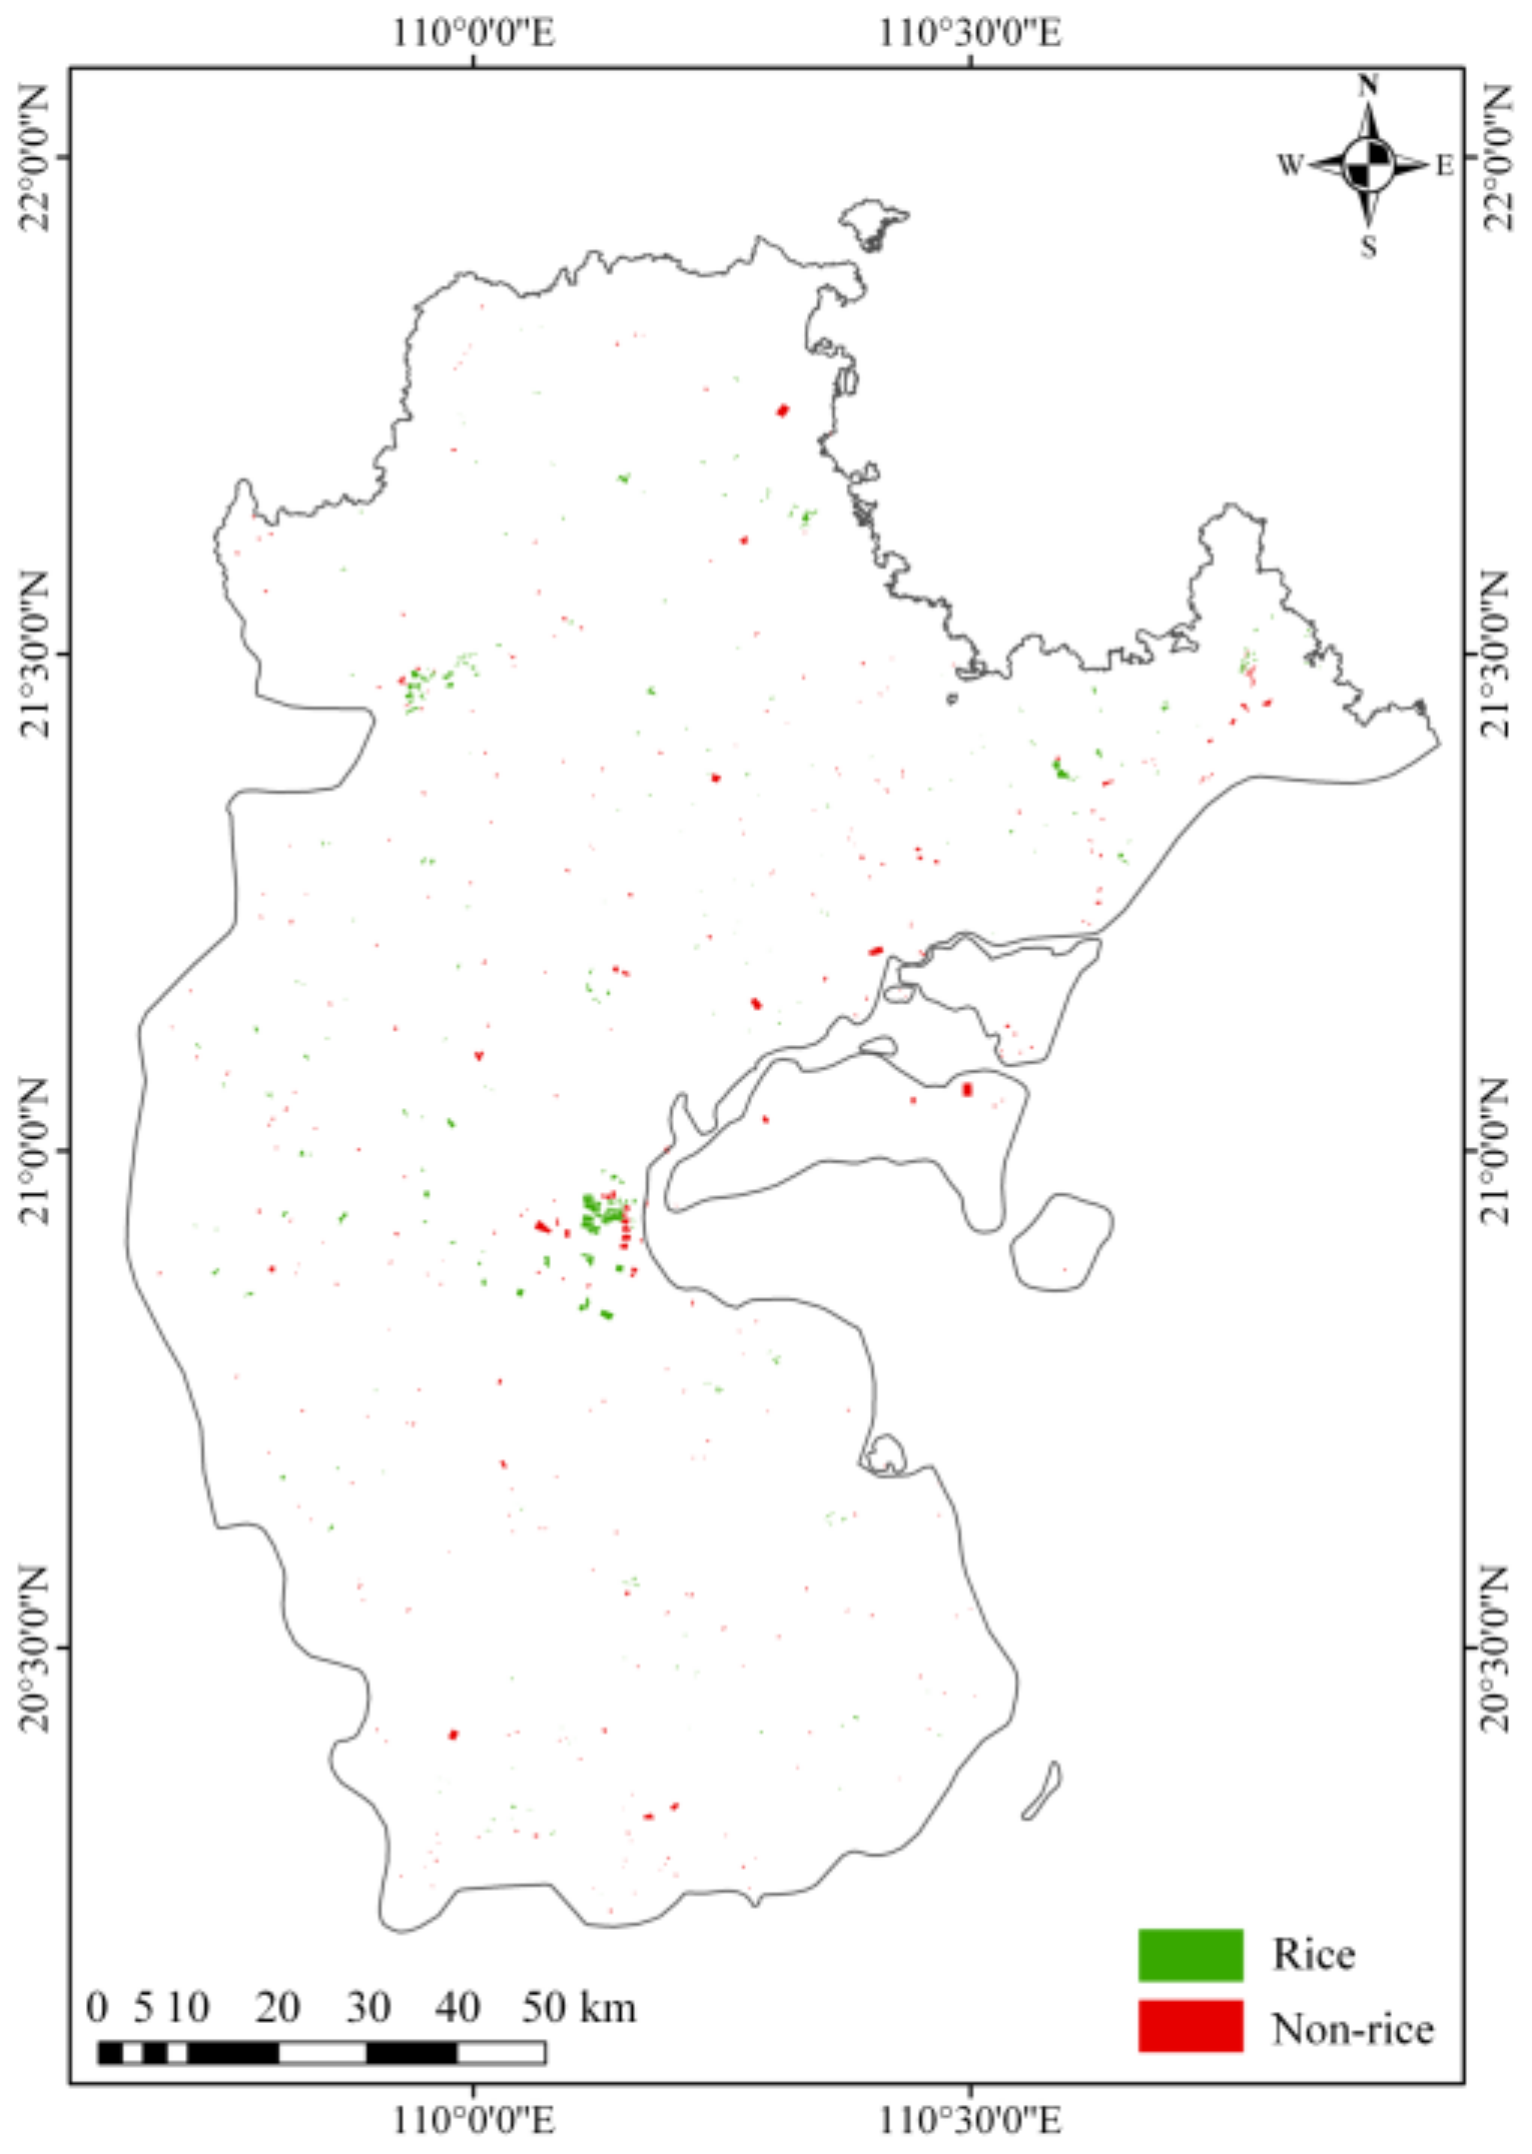
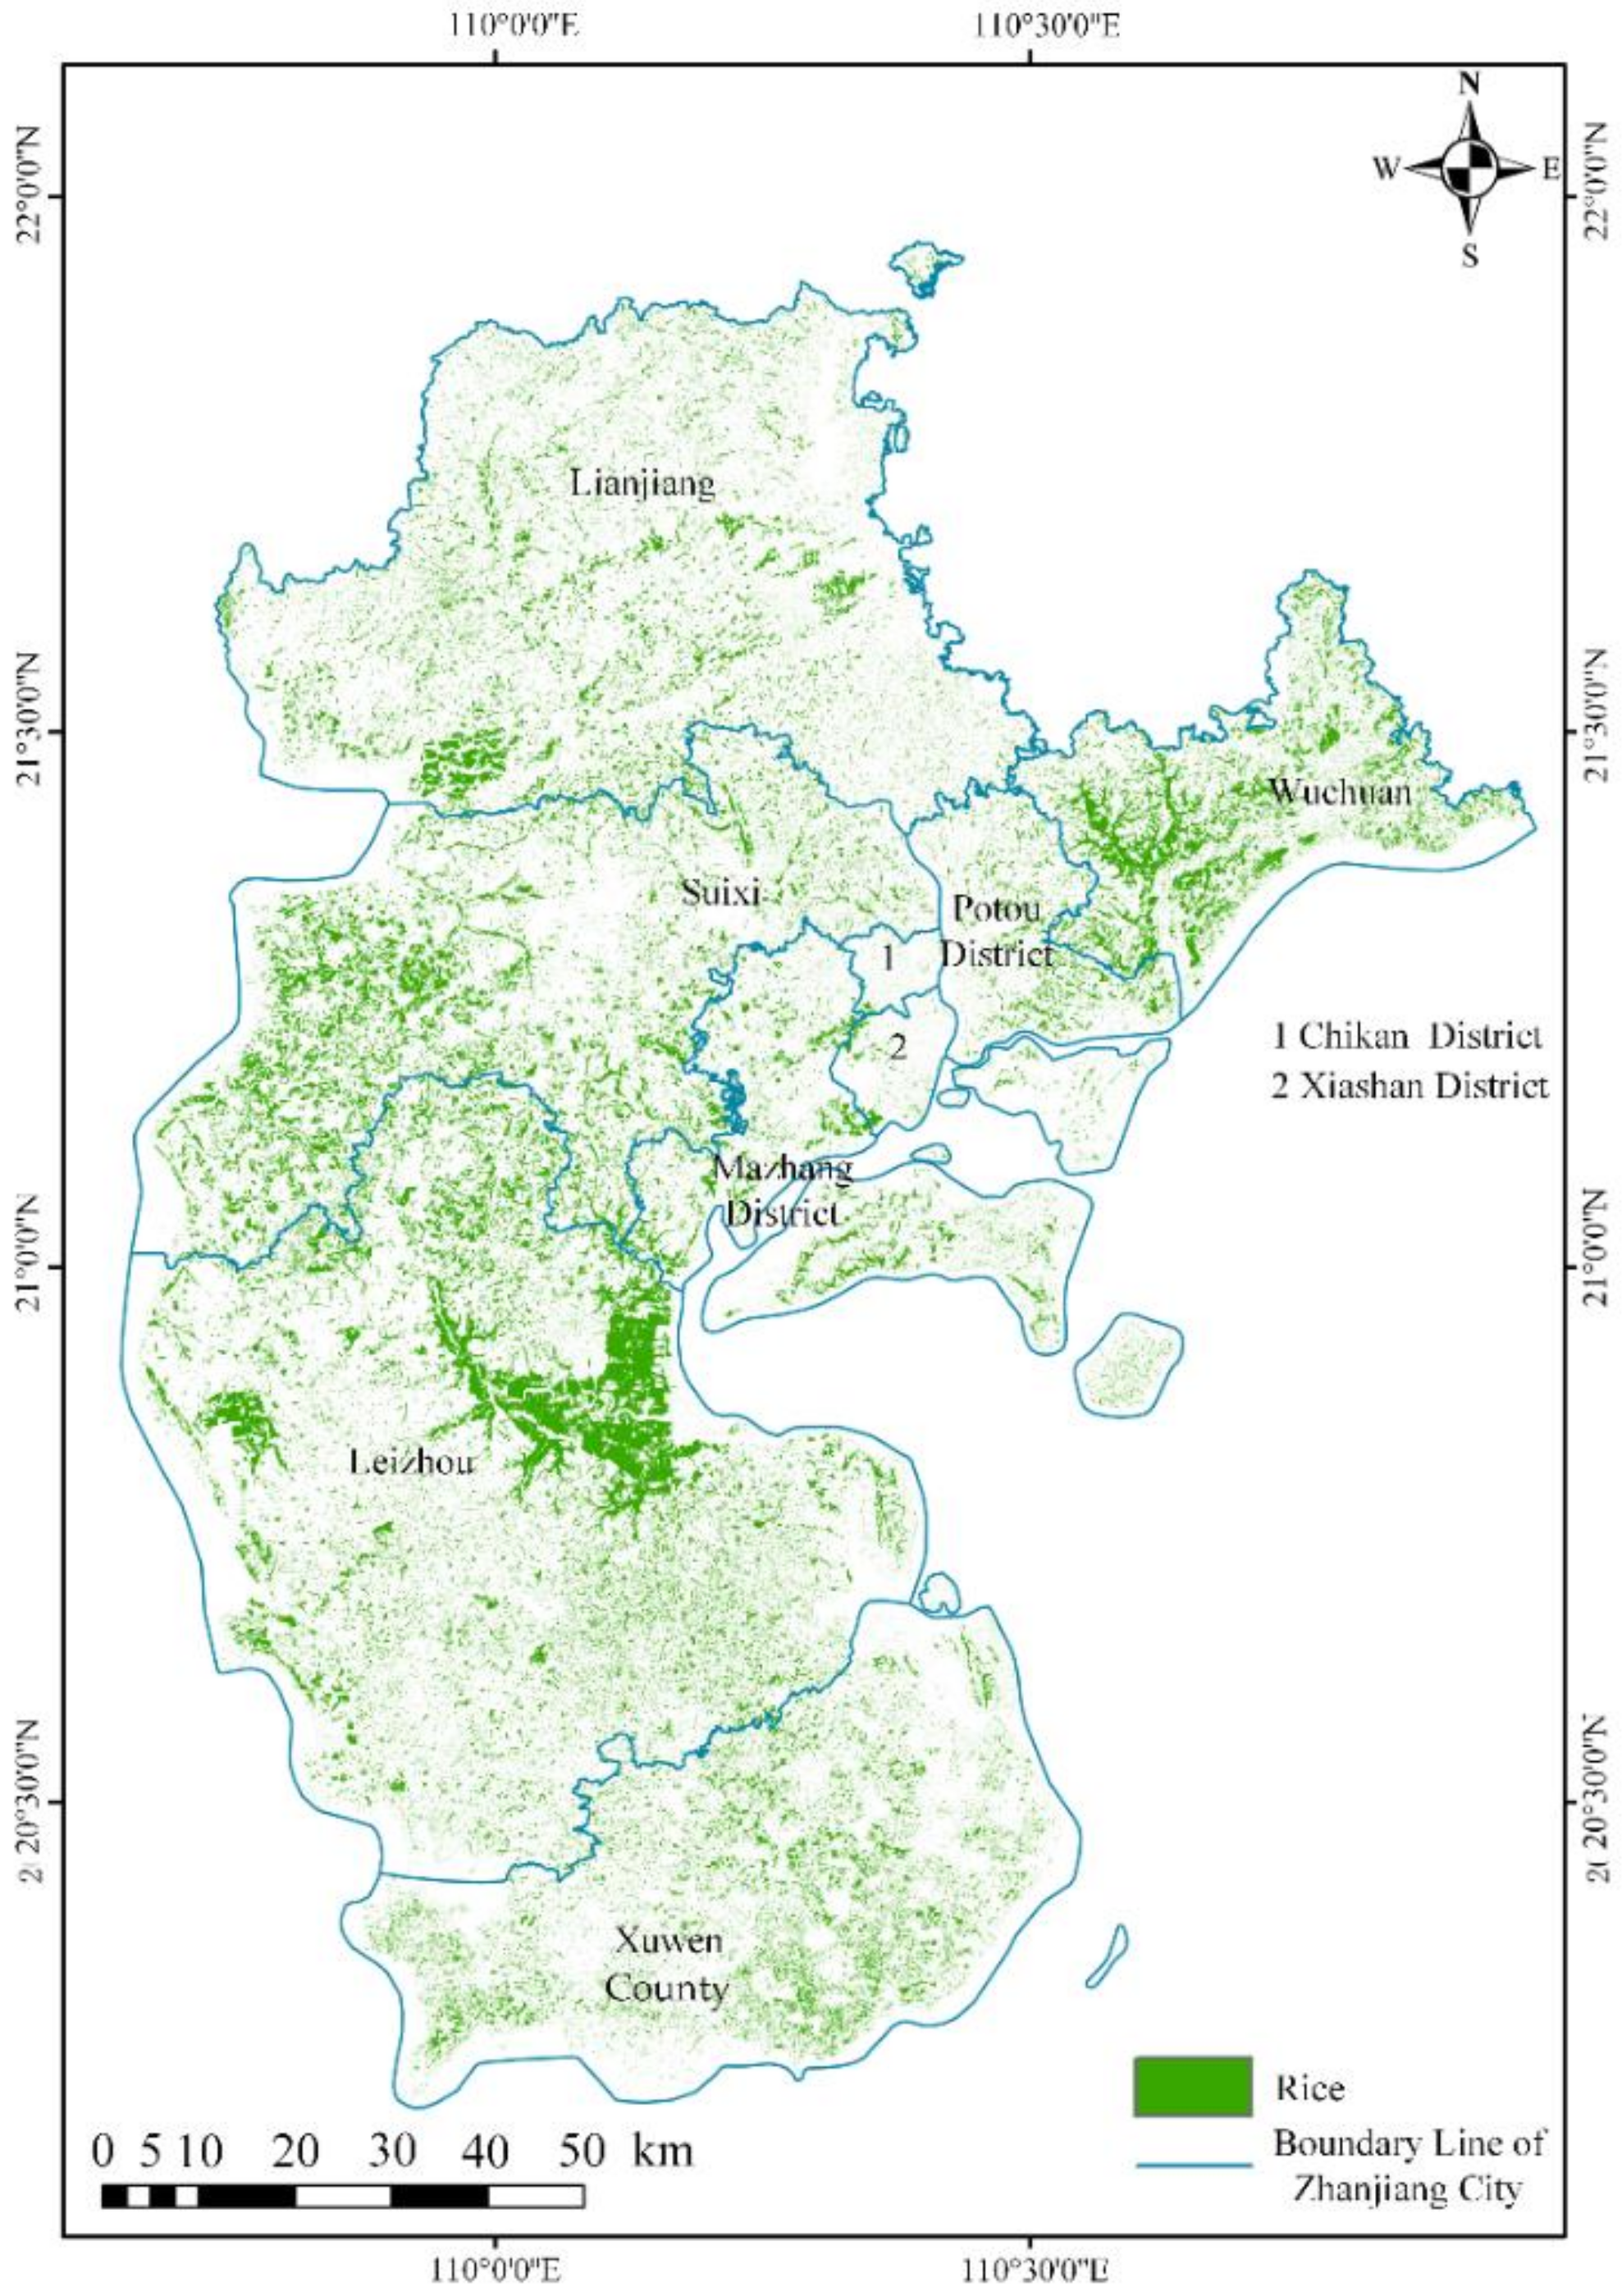
3.3. Rice Distribution Map
4. Discussion
5. Conclusions
Author Contributions
Funding
Institutional Review Board Statement
Informed Consent Statement
Data Availability Statement
Acknowledgments
Conflicts of Interest
References
- Kuenzer, C.; Knauer, K. Remote sensing of rice crop areas. Int. J. Remote Sens. 2012, 34, 2101–2139. [Google Scholar] [CrossRef]
- Godfray, H.C.; Beddington, J.R.; Crute, I.R.; Haddad, L.; Lawrence, D.; Muir, J.F.; Pretty, J.; Robinson, S.; Thomas, S.M.; Toulmin, C. Food security: The challenge of feeding 9 billion people. Science 2010, 327, 812–818. [Google Scholar] [CrossRef] [PubMed] [Green Version]
- Maclean, J.; Hardy, B.; Hettel, G. Rice Almanac: Source Book for One of the Most Important Economic Activities on Earth; IRRI: Los Baños, Philippines, 2013. [Google Scholar]
- Jin, X.; Kumar, L.; Li, Z.; Feng, H.; Xu, X.; Yang, G.; Wang, J. A review of data assimilation of remote sensing and crop models. Eur. J. Agron. 2018, 92, 141–152. [Google Scholar] [CrossRef]
- Laborte, A.G.; Gutierrez, M.A.; Balanza, J.G.; Saito, K.; Zwart, S.J.; Boschetti, M.; Murty, M.V.R.; Villano, L.; Aunario, J.K.; Reinke, R.; et al. RiceAtlas, a spatial database of global rice calendars and production. Sci. Data 2017, 4, 170074. [Google Scholar] [CrossRef] [PubMed]
- de Leeuw, J.; Vrieling, A.; Shee, A.; Atzberger, C.; Hadgu, K.; Biradar, C.; Keah, H.; Turvey, C. The Potential and Uptake of Remote Sensing in Insurance: A Review. Remote Sens. 2014, 6, 10888–10912. [Google Scholar] [CrossRef] [Green Version]
- Orynbaikyzy, A.; Gessner, U.; Conrad, C. Crop type classification using a combination of optical and radar remote sensing data: A review. Int. J. Remote Sens. 2019, 40, 6553–6595. [Google Scholar] [CrossRef]
- Wei, Y.; Tong, X.; Chen, G.; Liu, D.; Han, Z. Remote Detection of Large-Area Crop Types: The Role of Plant Phenology and Topography. Agriculture 2019, 9, 150. [Google Scholar] [CrossRef] [Green Version]
- Mosleh, M.K.; Hassan, Q.K.; Chowdhury, E.H. Application of remote sensors in mapping rice area and forecasting its production: A review. Sensors 2015, 15, 769–791. [Google Scholar] [CrossRef] [Green Version]
- Liu, C.-A.; Chen, Z.-X.; Shao, Y.; Chen, J.-S.; Hasi, T.; Pan, H.-Z. Research advances of SAR remote sensing for agriculture applications: A review. J. Integr. Agric. 2019, 18, 506–525. [Google Scholar] [CrossRef] [Green Version]
- Zhao, R.; Li, Y.; Ma, M. Mapping Paddy Rice with Satellite Remote Sensing: A Review. Sustainability 2021, 13, 503. [Google Scholar] [CrossRef]
- Koppe, W.; Gnyp, M.L.; Hütt, C.; Yao, Y.; Miao, Y.; Chen, X.; Bareth, G. Rice monitoring with multi-temporal and dual-polarimetric TerraSAR-X data. Int. J. Appl. Earth Obs. Geoinf. 2013, 21, 568–576. [Google Scholar] [CrossRef]
- Lopez-Sanchez, J.M.; Ballester-Berman, J.D.; Hajnsek, I. First Results of Rice Monitoring Practices in Spain by Means of Time Series of TerraSAR-X Dual-Pol Images. IEEE J. Sel. Top. Appl. Earth Obs. Remote Sens. 2011, 4, 412–422. [Google Scholar] [CrossRef]
- Mansaray, L.R.; Zhang, D.; Zhou, Z.; Huang, J. Evaluating the potential of temporal Sentinel-1A data for paddy rice discrimination at local scales. Remote Sens. Lett. 2017, 8, 967–976. [Google Scholar] [CrossRef]
- Chen, C.F.; Son, N.T.; Chen, C.R.; Chang, L.Y.; Chiang, S.H. Rice Crop Mapping Using Sentinel-1a Phenological Metrics. ISPRS Int. Arch. Photogramm. Remote Sens. Spat. Inf. Sci. 2016, 41, 863–865. [Google Scholar] [CrossRef] [Green Version]
- Hoang-Phi, P.; Lam-Dao, N.; Pham-Van, C.; Chau-Nguyen-Xuan, Q.; Nguyen-Van-Anh, V.; Gummadi, S.; Le-Van, T. Sentinel-1 SAR Time Series-Based Assessment of the Impact of Severe Salinity Intrusion Events on Spatiotemporal Changes in Distribution of Rice Planting Areas in Coastal Provinces of the Mekong Delta, Vietnam. Remote Sens. 2020, 12, 3196. [Google Scholar] [CrossRef]
- Nguyen, D.B.; Wagner, W. European Rice Cropland Mapping with Sentinel-1 Data: The Mediterranean Region Case Study. Water 2017, 9, 392. [Google Scholar] [CrossRef]
- Wu, F.; Wang, C.; Zhang, H.; Zhang, B.; Tang, Y. Rice Crop Monitoring in South China With RADARSAT-2 Quad-Polarization SAR Data. IEEE Geosci. Remote Sens. Lett. 2011, 8, 196–200. [Google Scholar] [CrossRef]
- Yonezawa, C.; Negishi, M.; Azuma, K.; Watanabe, M.; Ishitsuka, N.; Ogawa, S.; Saito, G. Growth monitoring and classification of rice fields using multitemporal RADARSAT-2 full-polarimetric data. Int. J. Remote Sens. 2012, 33, 5696–5711. [Google Scholar] [CrossRef]
- Nelson, A.; Setiyono, T.; Rala, A.; Quicho, E.; Raviz, J.; Abonete, P.; Maunahan, A.; Garcia, C.; Bhatti, H.; Villano, L.; et al. Towards an Operational SAR-Based Rice Monitoring System in Asia: Examples from 13 Demonstration Sites across Asia in the RIICE Project. Remote Sens. 2014, 6, 10773–10812. [Google Scholar] [CrossRef] [Green Version]
- Phan, H.; Le Toan, T.; Bouvet, A.; Nguyen, L.D.; Pham Duy, T.; Zribi, M. Mapping of Rice Varieties and Sowing Date Using X-Band SAR Data. Sensors 2018, 18, 316. [Google Scholar] [CrossRef] [Green Version]
- Tian, H.; Wu, M.; Wang, L.; Niu, Z. Mapping Early, Middle and Late Rice Extent Using Sentinel-1A and Landsat-8 Data in the Poyang Lake Plain, China. Sensors 2018, 18, 185. [Google Scholar] [CrossRef] [Green Version]
- Mandal, D.; Kumar, V.; Bhattacharya, A.; Rao, Y.S.; Siqueira, P.; Bera, S. Sen4Rice: A Processing Chain for Differentiating Early and Late Transplanted Rice Using Time-Series Sentinel-1 SAR Data with Google Earth Engine. IEEE Geosci. Remote Sens. Lett. 2018, 15, 1947–1951. [Google Scholar] [CrossRef]
- Chang, L.; Chen, Y.-T.; Wang, J.-H.; Chang, Y.-L. Rice-Field Mapping with Sentinel-1A SAR Time-Series Data. Remote Sens. 2020, 13, 103. [Google Scholar] [CrossRef]
- Nguyen, D.; Clauss, K.; Cao, S.; Naeimi, V.; Kuenzer, C.; Wagner, W. Mapping Rice Seasonality in the Mekong Delta with Multi-Year Envisat ASAR WSM Data. Remote Sens. 2015, 7, 15868–15893. [Google Scholar] [CrossRef] [Green Version]
- Inoue, S.; Ito, A.; Yonezawa, C. Mapping Paddy fields in Japan by using a Sentinel-1 SAR time series supplemented by Sentinel-2 images on Google Earth Engine. Remote Sens. 2020, 12, 1622. [Google Scholar] [CrossRef]
- Hoang, H.K.; Bernier, M.; Duchesne, S.; Tran, Y.M. Rice Mapping Using RADARSAT-2 Dual- and Quad-Pol Data in a Complex Land-Use Watershed: Cau River Basin (Vietnam). IEEE J. Sel. Top. Appl. Earth Obs. Remote Sens. 2016, 9, 3082–3096. [Google Scholar] [CrossRef] [Green Version]
- Mountrakis, G.; Im, J.; Ogole, C. Support vector machines in remote sensing: A review. ISPRS J. Photogramm. Remote Sens. 2011, 66, 247–259. [Google Scholar] [CrossRef]
- Zhang, Y.; Wang, C.; Wu, J.; Qi, J.; Salas, W.A. Mapping paddy rice with multitemporal ALOS/PALSAR imagery in southeast China. Int. J. Remote Sens. 2009, 30, 6301–6315. [Google Scholar] [CrossRef]
- Son, N.-T.; Chen, C.-F.; Chen, C.-R.; Minh, V.-Q. Assessment of Sentinel-1A data for rice crop classification using random forests and support vector machines. Geocarto Int. 2017, 33, 587–601. [Google Scholar] [CrossRef]
- Belgiu, M.; Drăguţ, L. Random forest in remote sensing: A review of applications and future directions. ISPRS J. Photogramm. Remote Sens. 2016, 114, 24–31. [Google Scholar] [CrossRef]
- Bazzi, H.; Baghdadi, N.; El Hajj, M.; Zribi, M.; Minh, D.H.T.; Ndikumana, E.; Courault, D.; Belhouchette, H. Mapping Paddy Rice Using Sentinel-1 SAR Time Series in Camargue, France. Remote Sens. 2019, 11, 887. [Google Scholar] [CrossRef] [Green Version]
- Onojeghuo, A.O.; Blackburn, G.A.; Wang, Q.; Atkinson, P.M.; Kindred, D.; Miao, Y. Mapping paddy rice fields by applying machine learning algorithms to multi-temporal Sentinel-1A and Landsat data. Int. J. Remote Sens. 2017, 39, 1042–1067. [Google Scholar] [CrossRef] [Green Version]
- Singha, M.; Dong, J.; Zhang, G.; Xiao, X. High resolution paddy rice maps in cloud-prone Bangladesh and Northeast India using Sentinel-1 data. Sci. Data 2019, 6, 26. [Google Scholar] [CrossRef]
- Long, J.; Shelhamer, E.; Darrell, T. Fully convolutional networks for semantic segmentation. In Proceedings of the IEEE Conference on Computer Vision and Pattern Recognition, Boston, MA, USA, 7–12 June 2015; pp. 3431–3440. [Google Scholar]
- Cué La Rosa, L.E.; Queiroz Feitosa, R.; Nigri Happ, P.; Del’Arco Sanches, I.; Ostwald Pedro da Costa, G.A. Combining Deep Learning and Prior Knowledge for Crop Mapping in Tropical Regions from Multitemporal SAR Image Sequences. Remote Sens. 2019, 11, 2029. [Google Scholar] [CrossRef] [Green Version]
- Wei, S.; Zhang, H.; Wang, C.; Wang, Y.; Xu, L. Multi-Temporal SAR Data Large-Scale Crop Mapping Based on U-Net Model. Remote Sens. 2019, 11, 68. [Google Scholar] [CrossRef] [Green Version]
- Zhang, L.; Zhang, L.; Du, B. Deep Learning for Remote Sensing Data: A Technical Tutorial on the State of the Art. IEEE Geosci. Remote Sens. Mag. 2016, 4, 22–40. [Google Scholar] [CrossRef]
- Crisóstomo de Castro Filho, H.; Abílio de Carvalho Júnior, O.; Ferreira de Carvalho, O.L.; Pozzobon de Bem, P.; dos Santos de Moura, R.; Olino de Albuquerque, A.; Rosa Silva, C.; Guimarães Ferreira, P.H.; Fontes Guimarães, R.; Trancoso Gomes, R.A. Rice Crop Detection Using LSTM, Bi-LSTM, and Machine Learning Models from Sentinel-1 Time Series. Remote Sens. 2020, 12, 2655. [Google Scholar] [CrossRef]
- Rußwurm, M.; Korner, M. Temporal Vegetation Modelling Using Long Short-Term Memory Networks for Crop Identification from Medium-Resolution Multi-spectral Satellite Images. In Proceedings of the IEEE Conference on Computer Vision and Pattern Recognition (CVPR) Workshops, Honolulu, HI, USA, 21–26 July 2017; pp. 11–19. [Google Scholar]
- Ndikumana, E.; Ho Tong Minh, D.; Baghdadi, N.; Courault, D.; Hossard, L. Deep Recurrent Neural Network for Agricultural Classification using multitemporal SAR Sentinel-1 for Camargue, France. Remote Sens. 2018, 10, 1217. [Google Scholar] [CrossRef] [Green Version]
- Teimouri, N.; Dyrmann, M.; Jørgensen, R.N. A Novel Spatio-Temporal FCN-LSTM Network for Recognizing Various Crop Types Using Multi-Temporal Radar Images. Remote Sens. 2019, 11, 990. [Google Scholar] [CrossRef] [Green Version]
- Zhao, H.; Chen, Z.; Jiang, H.; Jing, W.; Sun, L.; Feng, M. Evaluation of Three Deep Learning Models for Early Crop Classification Using Sentinel-1A Imagery Time Series—A Case Study in Zhanjiang, China. Remote Sens. 2019, 11, 2673. [Google Scholar] [CrossRef] [Green Version]
- Ma, X.; Hovy, E. End-to-end sequence labeling via bi-directional lstm-cnns-crf. arXiv 2016, arXiv:1603.01354. [Google Scholar]
- Hochreiter, S.; Schmidhuber, J. Long short-term memory. Neural Comput. 1997, 9, 1735–1780. [Google Scholar] [CrossRef]
- Hameed, Z.; Garcia-Zapirain, B.; Ruiz, I.O. A computationally efficient BiLSTM based approach for the binary sentiment classification. In Proceedings of the 2019 IEEE International Symposium on Signal Processing and Information Technology (ISSPIT), Ajman, United Arab Emirates, 10–12 December 2019; pp. 1–4. [Google Scholar]
- Wei, P.; Chai, D.; Lin, T.; Tang, C.; Du, M.; Huang, J. Large-scale rice mapping under different years based on time-series Sentinel-1 images using deep semantic segmentation model. ISPRS J. Photogramm. Remote Sens. 2021, 174, 198–214. [Google Scholar] [CrossRef]
- Jo, H.-W.; Lee, S.; Park, E.; Lim, C.-H.; Song, C.; Lee, H.; Ko, Y.; Cha, S.; Yoon, H.; Lee, W.-K. Deep Learning Applications on Multitemporal SAR (Sentinel-1) Image Classification Using Confined Labeled Data: The Case of Detecting Rice Paddy in South Korea. IEEE Trans. Geosci. Remote Sens. 2020, 58, 7589–7601. [Google Scholar] [CrossRef]
- Yang, Z.; Yang, D.; Dyer, C.; He, X.; Smola, A.; Hovy, E. Hierarchical attention networks for document classification. In Proceedings of the 2016 Conference of the North American Chapter of the Association for Computational Linguistics: Human Language Technologies, San Diego, CA, USA, 12–17 June 2016; pp. 1480–1489. [Google Scholar]
- Gong, P.; Liu, H.; Zhang, M.; Li, C.; Wang, J.; Huang, H.; Clinton, N.; Ji, L.; Li, W.; Bai, Y.; et al. Stable classification with limited sample: Transferring a 30-m resolution sample set collected in 2015 to mapping 10-m resolution global land cover in 2017. Chin. Sci. Bull. 2019, 64, 370–373. [Google Scholar] [CrossRef] [Green Version]
- Potin, P.; Rosich, B.; Miranda, N.; Grimont, P. Sentinel-1 Mission Status. Procedia Comput. Sci. 2016, 100, 1297–1304. [Google Scholar] [CrossRef] [Green Version]
- Nguyen, D.B.; Gruber, A.; Wagner, W. Mapping rice extent and cropping scheme in the Mekong Delta using Sentinel-1A data. Remote Sens. Lett. 2016, 7, 1209–1218. [Google Scholar] [CrossRef]
- Stendardi, L.; Karlsen, S.; Niedrist, G.; Gerdol, R.; Zebisch, M.; Rossi, M.; Notarnicola, C. Exploiting Time Series of Sentinel-1 and Sentinel-2 Imagery to Detect Meadow Phenology in Mountain Regions. Remote Sens. 2019, 11, 542. [Google Scholar] [CrossRef] [Green Version]
- Vapnik, V.N. An overview of statistical learning theory. IEEE Trans. Neural Netw. 1999, 10, 988–999. [Google Scholar] [CrossRef] [PubMed] [Green Version]
- Congalton, R.G. A review of assessing the accuracy of classifications of remotely sensed data. Remote Sens. Environ. 1991, 37, 35–46. [Google Scholar] [CrossRef]
- McHugh, M.L. Interrater reliability: The kappa statistic. Biochem. Med. 2012, 22, 276–282. [Google Scholar] [CrossRef]
- Zaremba, W.; Sutskever, I.; Vinyals, O. Recurrent Neural Network Regularization. arXiv 2014, arXiv:1409.2329. [Google Scholar]
- Biau, G.; Scornet, E. A random forest guided tour. Test 2016, 25, 197–227. [Google Scholar] [CrossRef] [Green Version]
- Zhan, P.; Zhu, W.; Li, N. An automated rice mapping method based on flooding signals in synthetic aperture radar time series. Remote Sens. Environ. 2021, 252. [Google Scholar] [CrossRef]
- Wang, M.; Wang, J.; Chen, L. Mapping Paddy Rice Using Weakly Supervised Long Short-Term Memory Network with Time Series Sentinel Optical and SAR Images. Agriculture 2020, 10, 483. [Google Scholar] [CrossRef]
- Chamorro Martinez, J.A.; Cué La Rosa, L.E.; Feitosa, R.Q.; Sanches, I.D.A.; Happ, P.N. Fully convolutional recurrent networks for multidate crop recognition from multitemporal image sequences. ISPRS J. Photogramm. Remote Sens. 2021, 171, 188–201. [Google Scholar] [CrossRef]
- Ajadi, O.A.; Barr, J.; Liang, S.-Z.; Ferreira, R.; Kumpatla, S.P.; Patel, R.; Swatantran, A. Large-scale crop type and crop area mapping across Brazil using synthetic aperture radar and optical imagery. Int. J. Appl. Earth Obs. Geoinf. 2021, 97, 102294. [Google Scholar] [CrossRef]
- Lavreniuk, M.; Kussul, N.; Shelestov, A.; Dubovyk, O.; Löw, F. Object-based postprocessing method for crop classification maps. In Proceedings of the IGARSS 2018—2018 IEEE International Geoscience and Remote Sensing Symposium, Valencia, Spain, 22–27 July 2018; pp. 7058–7061. [Google Scholar]


| Orbit Number—Frame Number: 157-63 | |||||||
|---|---|---|---|---|---|---|---|
| No. | Acquisition Time | No. | Acquisition Time | No. | Acquisition Time | No. | Acquisition Time |
| 1 | 2019/4/5 | 7 | 2019/6/28 | 13 | 2019/9/8 | 19 | 2019/11/19 |
| 2 | 2019/4/17 | 8 | 2019/7/10 | 14 | 2019/9/20 | 20 | 2019/12/1 |
| 3 | 2019/5/11 | 9 | 2019/7/22 | 15 | 2019/10/2 | 21 | 2019/12/13 |
| 4 | 2019/5/12 | 10 | 2019/8/3 | 16 | 2019/10/14 | 22 | 2019/12/25 |
| 5 | 2019/6/4 | 11 | 2019/8/4 | 17 | 2019/10/26 | ||
| 6 | 2019/6/16 | 12 | 2019/8/27 | 18 | 2019/11/7 | ||
| Orbit Number—Frame Number: 157-66 | |||||||
| No. | Acquisition Time | No. | Acquisition Time | No. | Acquisition Time | No. | Acquisition Time |
| 1 | 2019/3/30 | 7 | 2019/6/22 | 13 | 2019/9/2 | 19 | 2019/11/13 |
| 2 | 2019/4/11 | 8 | 2019/7/04 | 14 | 2019/9/14 | 20 | 2019/11/25 |
| 3 | 2019/5/5 | 9 | 2019/7/16 | 15 | 2019/9/26 | 21 | 2019/12/19 |
| 4 | 2019/5/17 | 10 | 2019/7/28 | 16 | 2019/10/8 | 22 | 2019/12/31 |
| 5 | 2019/5/29 | 11 | 2019/8/9 | 17 | 2019/10/20 | ||
| 6 | 2019/6/10 | 12 | 2019/8/21 | 18 | 2019/11/1 | ||
| Orbit Number—Frame Number: 84-65 | |||||||
| No. | Acquisition Time | No. | Acquisition Time | No. | Acquisition Time | No. | Acquisition Time |
| 1 | 2019/3/31 | 7 | 2019/6/23 | 13 | 2019/9/3 | 19 | 2019/11/14 |
| 2 | 2019/4/12 | 8 | 2019/7/5 | 14 | 2019/9/15 | 20 | 2019/11/26 |
| 3 | 2019/5/6 | 9 | 2019/7/17 | 15 | 2019/9/27 | 21 | 2019/12/8 |
| 4 | 2019/5/18 | 10 | 2019/7/29 | 16 | 2019/10/9 | 22 | 2019/12/20 |
| 5 | 2019/5/30 | 11 | 2019/8/10 | 17 | 2019/10/21 | ||
| 6 | 2019/6/11 | 12 | 2019/8/22 | 18 | 2019/11/2 | ||
| Accuracy | Precision | Recall | F1 | Kappa | |
|---|---|---|---|---|---|
| BiLSTM-Attention | 0.9351 | 0.9191 | 0.9495 | 0.9341 | 0.8703 |
| BiLSTM | 0.9012 | 0.8970 | 0.9065 | 0.9017 | 0.8024 |
| RF | 0.8809 | 0.8910 | 0.8680 | 0.8794 | 0.7619 |
| No. | Administrative Region | Statistical Area (ha) | Classified Area (ha) |
|---|---|---|---|
| 1 | Chikan District | 260.00 | 155.41 |
| 2 | Leizhou City | 55,666.67 | 63,589.69 |
| 3 | Lianjiang City | 52,766.67 | 32,327.90 |
| 4 | Mazhang District | 11,500.00 | 10,210.96 |
| 5 | Potou District | 7986.67 | 5608.17 |
| 6 | Suixi County | 24,826.67 | 31,360.29 |
| 7 | Wuchuan City | 22,160.00 | 19,717.17 |
| 8 | Xiashan District | 946.67 | 601.21 |
| 9 | Xuwen County | 14,166.67 | 16,441.59 |
| 10 | total | 190,280.02 | 180,012.39 |
Publisher’s Note: MDPI stays neutral with regard to jurisdictional claims in published maps and institutional affiliations. |
© 2021 by the authors. Licensee MDPI, Basel, Switzerland. This article is an open access article distributed under the terms and conditions of the Creative Commons Attribution (CC BY) license (https://creativecommons.org/licenses/by/4.0/).
Share and Cite
Sun, C.; Zhang, H.; Xu, L.; Wang, C.; Li, L. Rice Mapping Using a BiLSTM-Attention Model from Multitemporal Sentinel-1 Data. Agriculture 2021, 11, 977. https://doi.org/10.3390/agriculture11100977
Sun C, Zhang H, Xu L, Wang C, Li L. Rice Mapping Using a BiLSTM-Attention Model from Multitemporal Sentinel-1 Data. Agriculture. 2021; 11(10):977. https://doi.org/10.3390/agriculture11100977
Chicago/Turabian StyleSun, Chunling, Hong Zhang, Lu Xu, Chao Wang, and Liutong Li. 2021. "Rice Mapping Using a BiLSTM-Attention Model from Multitemporal Sentinel-1 Data" Agriculture 11, no. 10: 977. https://doi.org/10.3390/agriculture11100977
APA StyleSun, C., Zhang, H., Xu, L., Wang, C., & Li, L. (2021). Rice Mapping Using a BiLSTM-Attention Model from Multitemporal Sentinel-1 Data. Agriculture, 11(10), 977. https://doi.org/10.3390/agriculture11100977