
Critical Temperature-Humidity Index Thresholds Based on Surface Temperature for Lactating Dairy Cows in a Temperate Climate


Abstract
:1. Introduction
2. Materials and Methods
2.1. Experimental Site, Cows and Housing
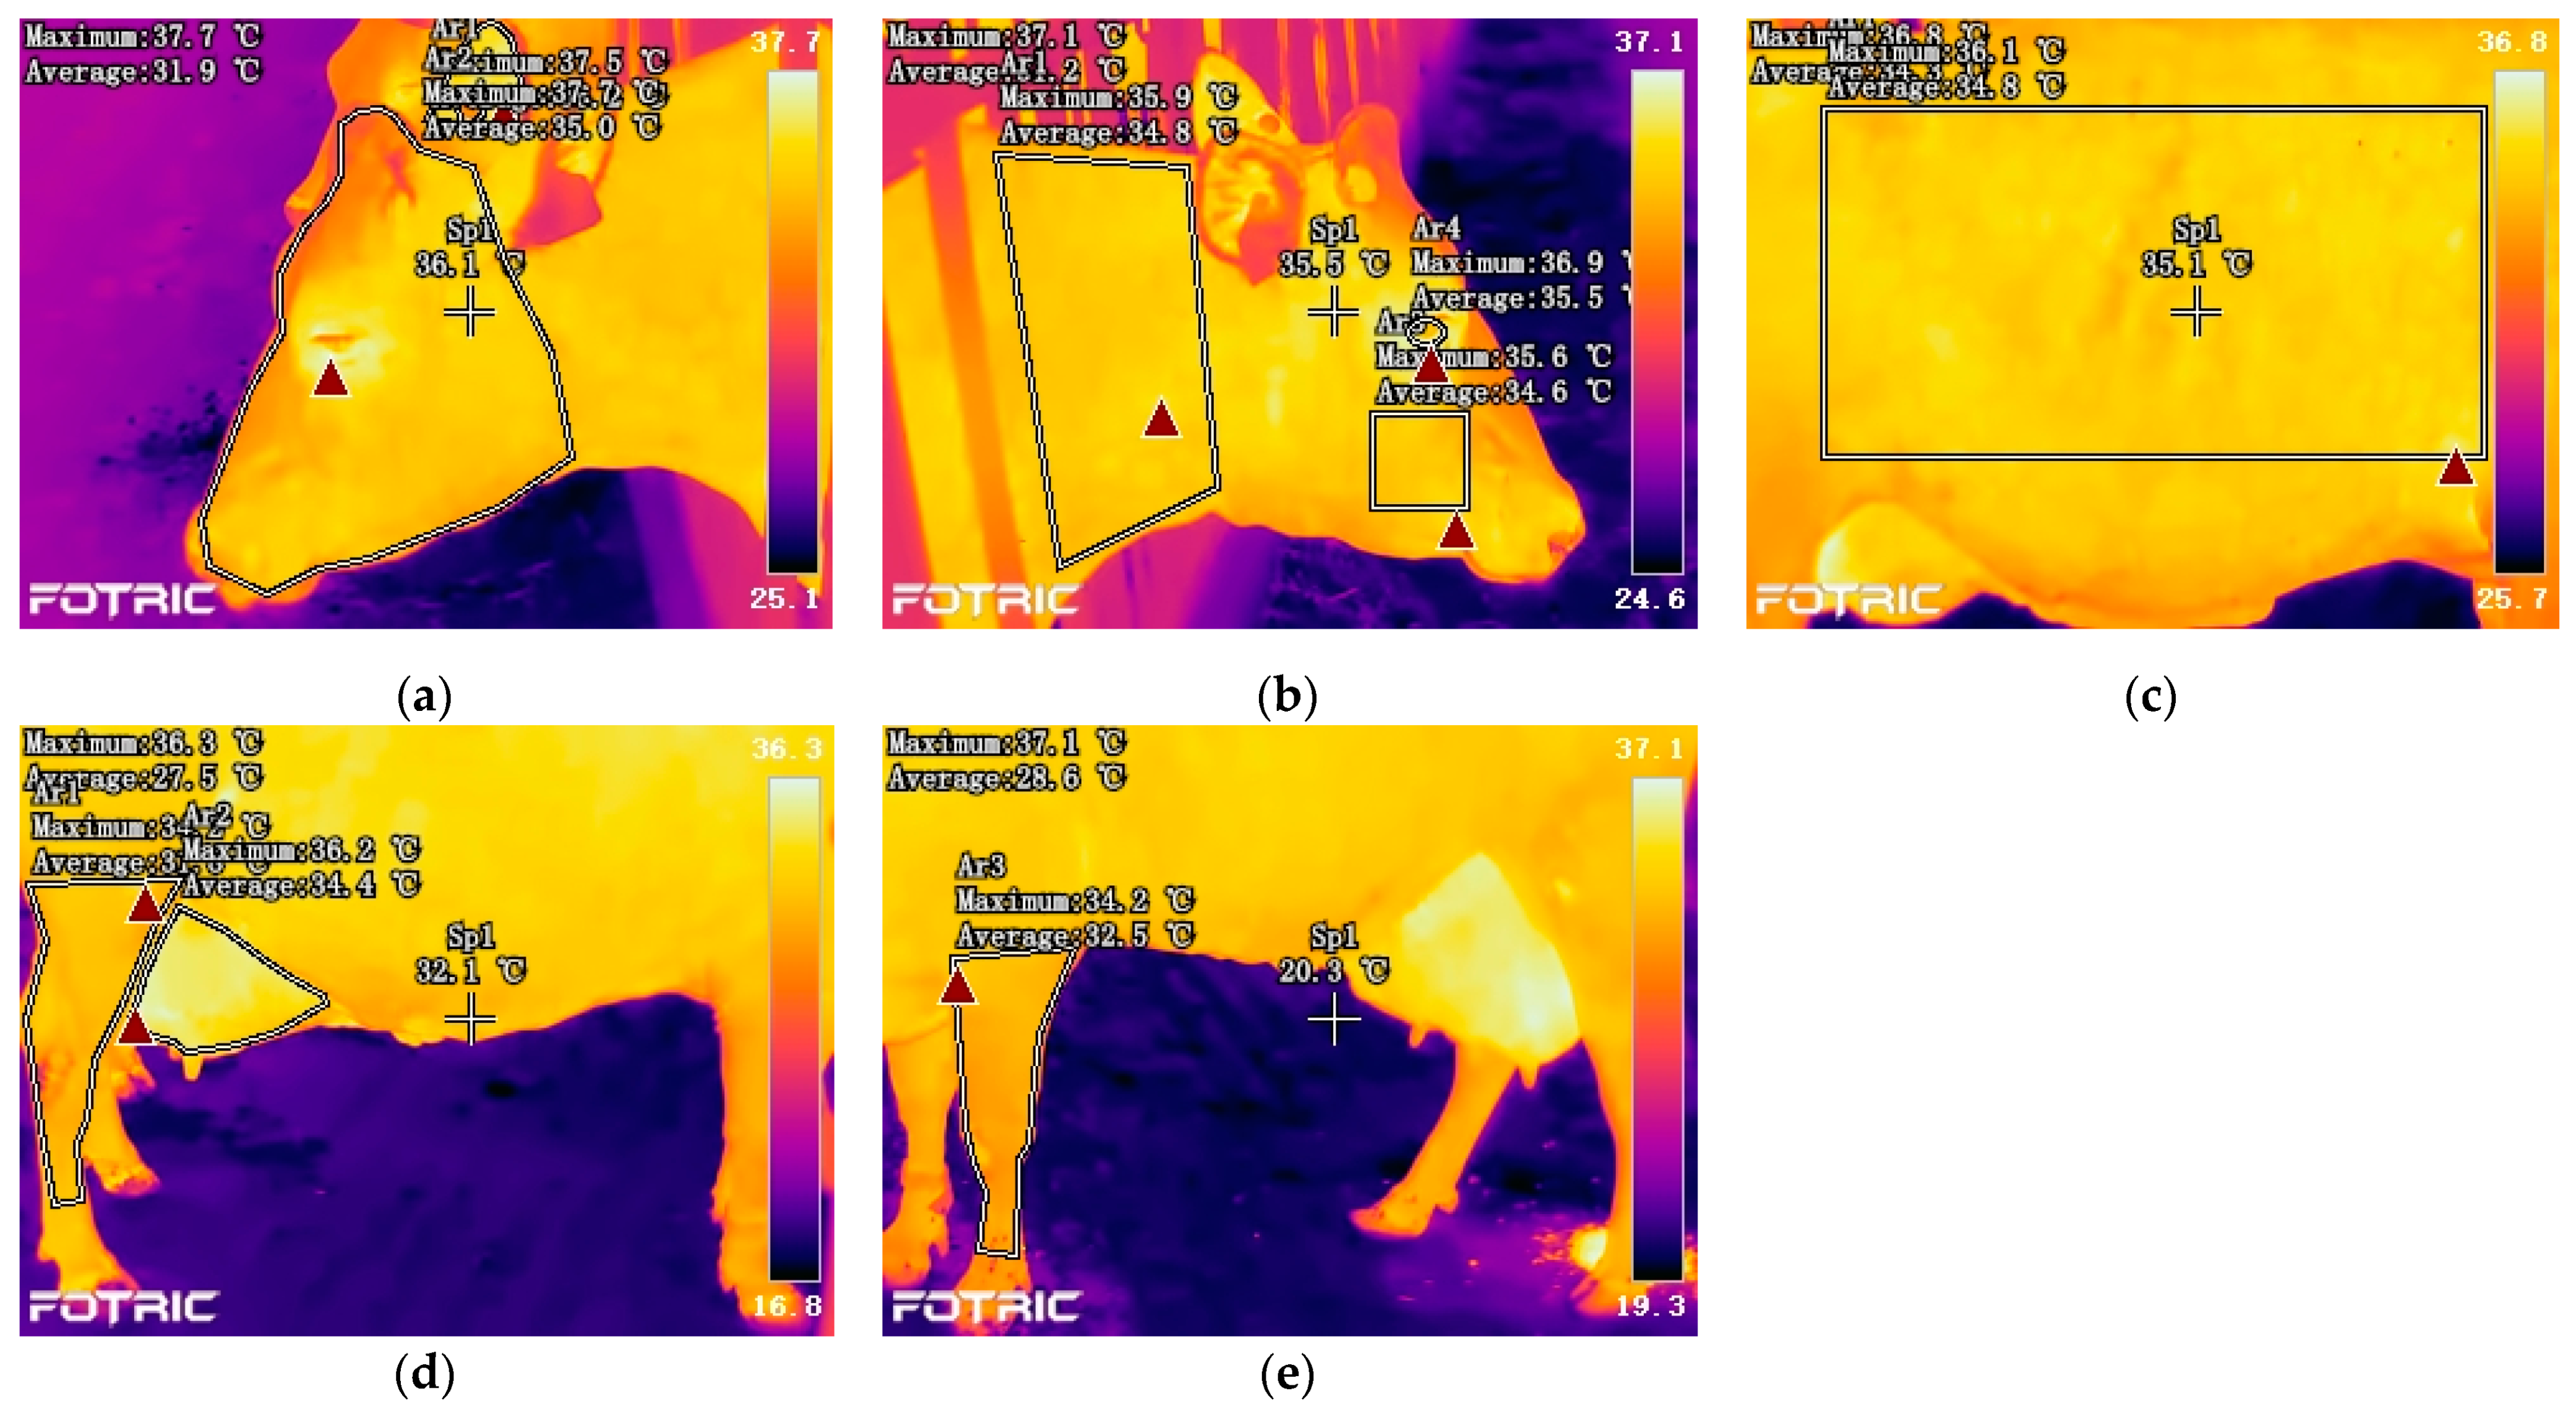
2.2. Environmental and Animal Measures
2.3. Statistical Analysis
3. Results
3.1. Association between Rectal Temperature and Surface Temperature
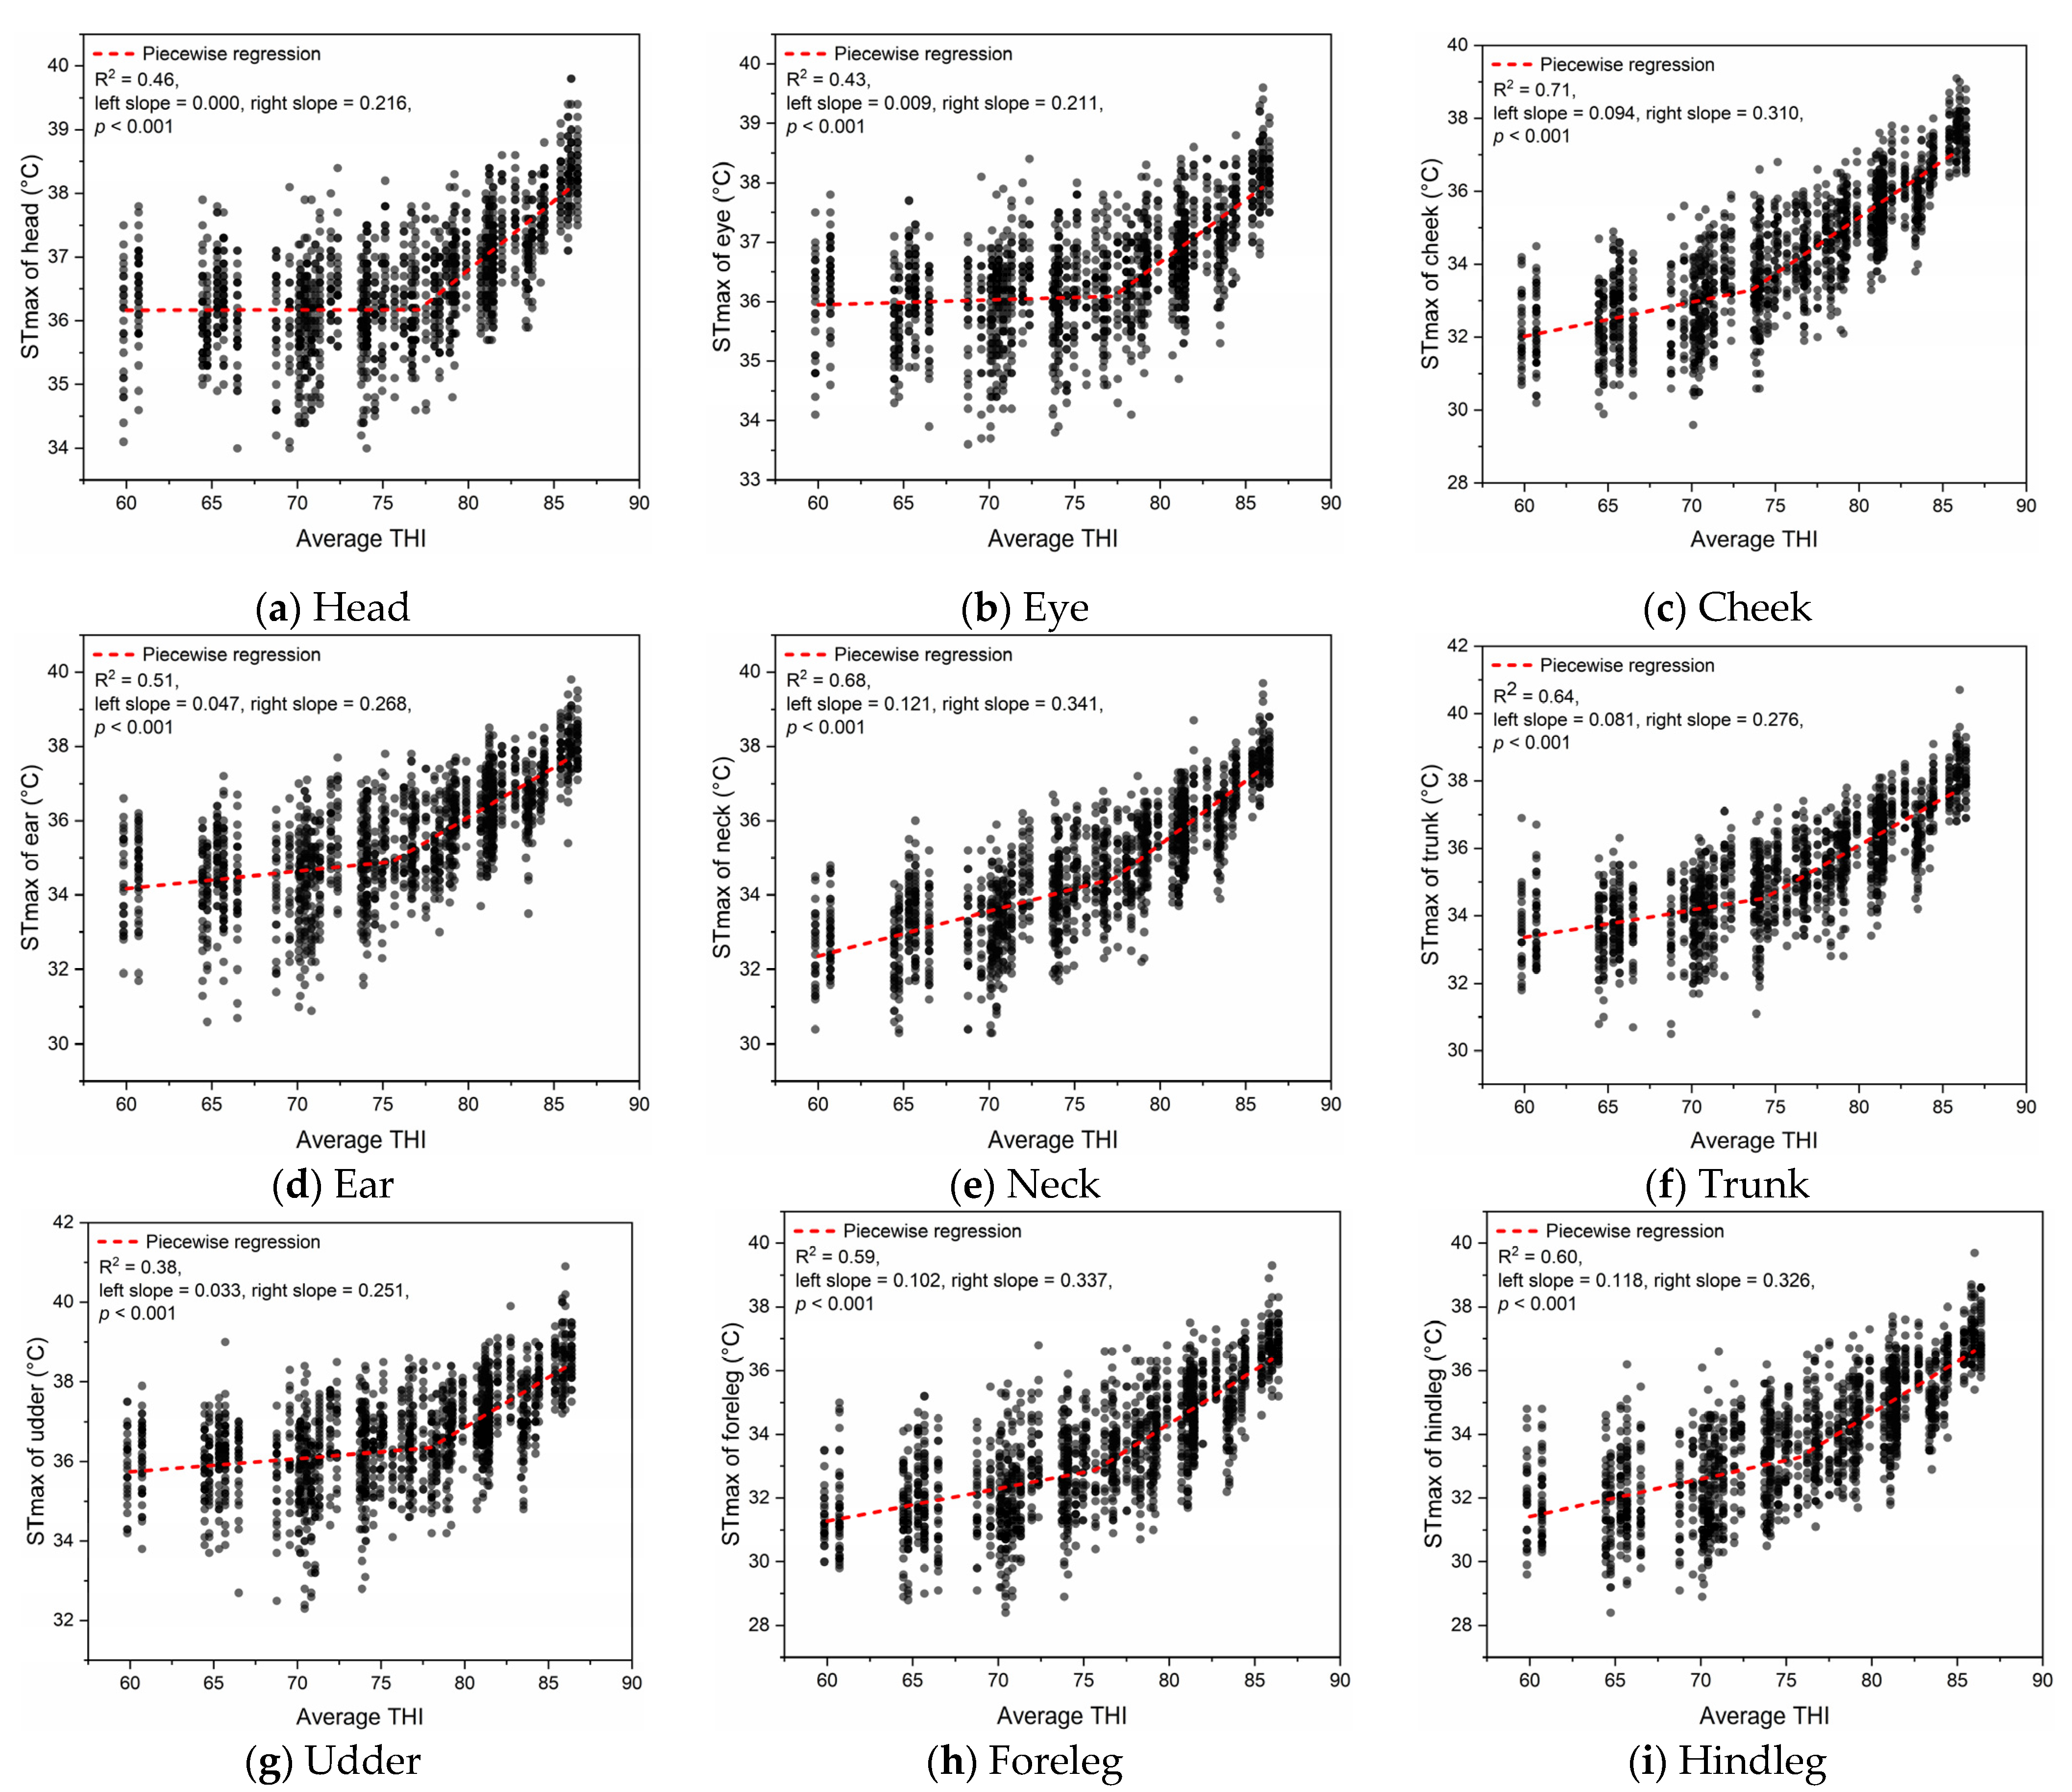
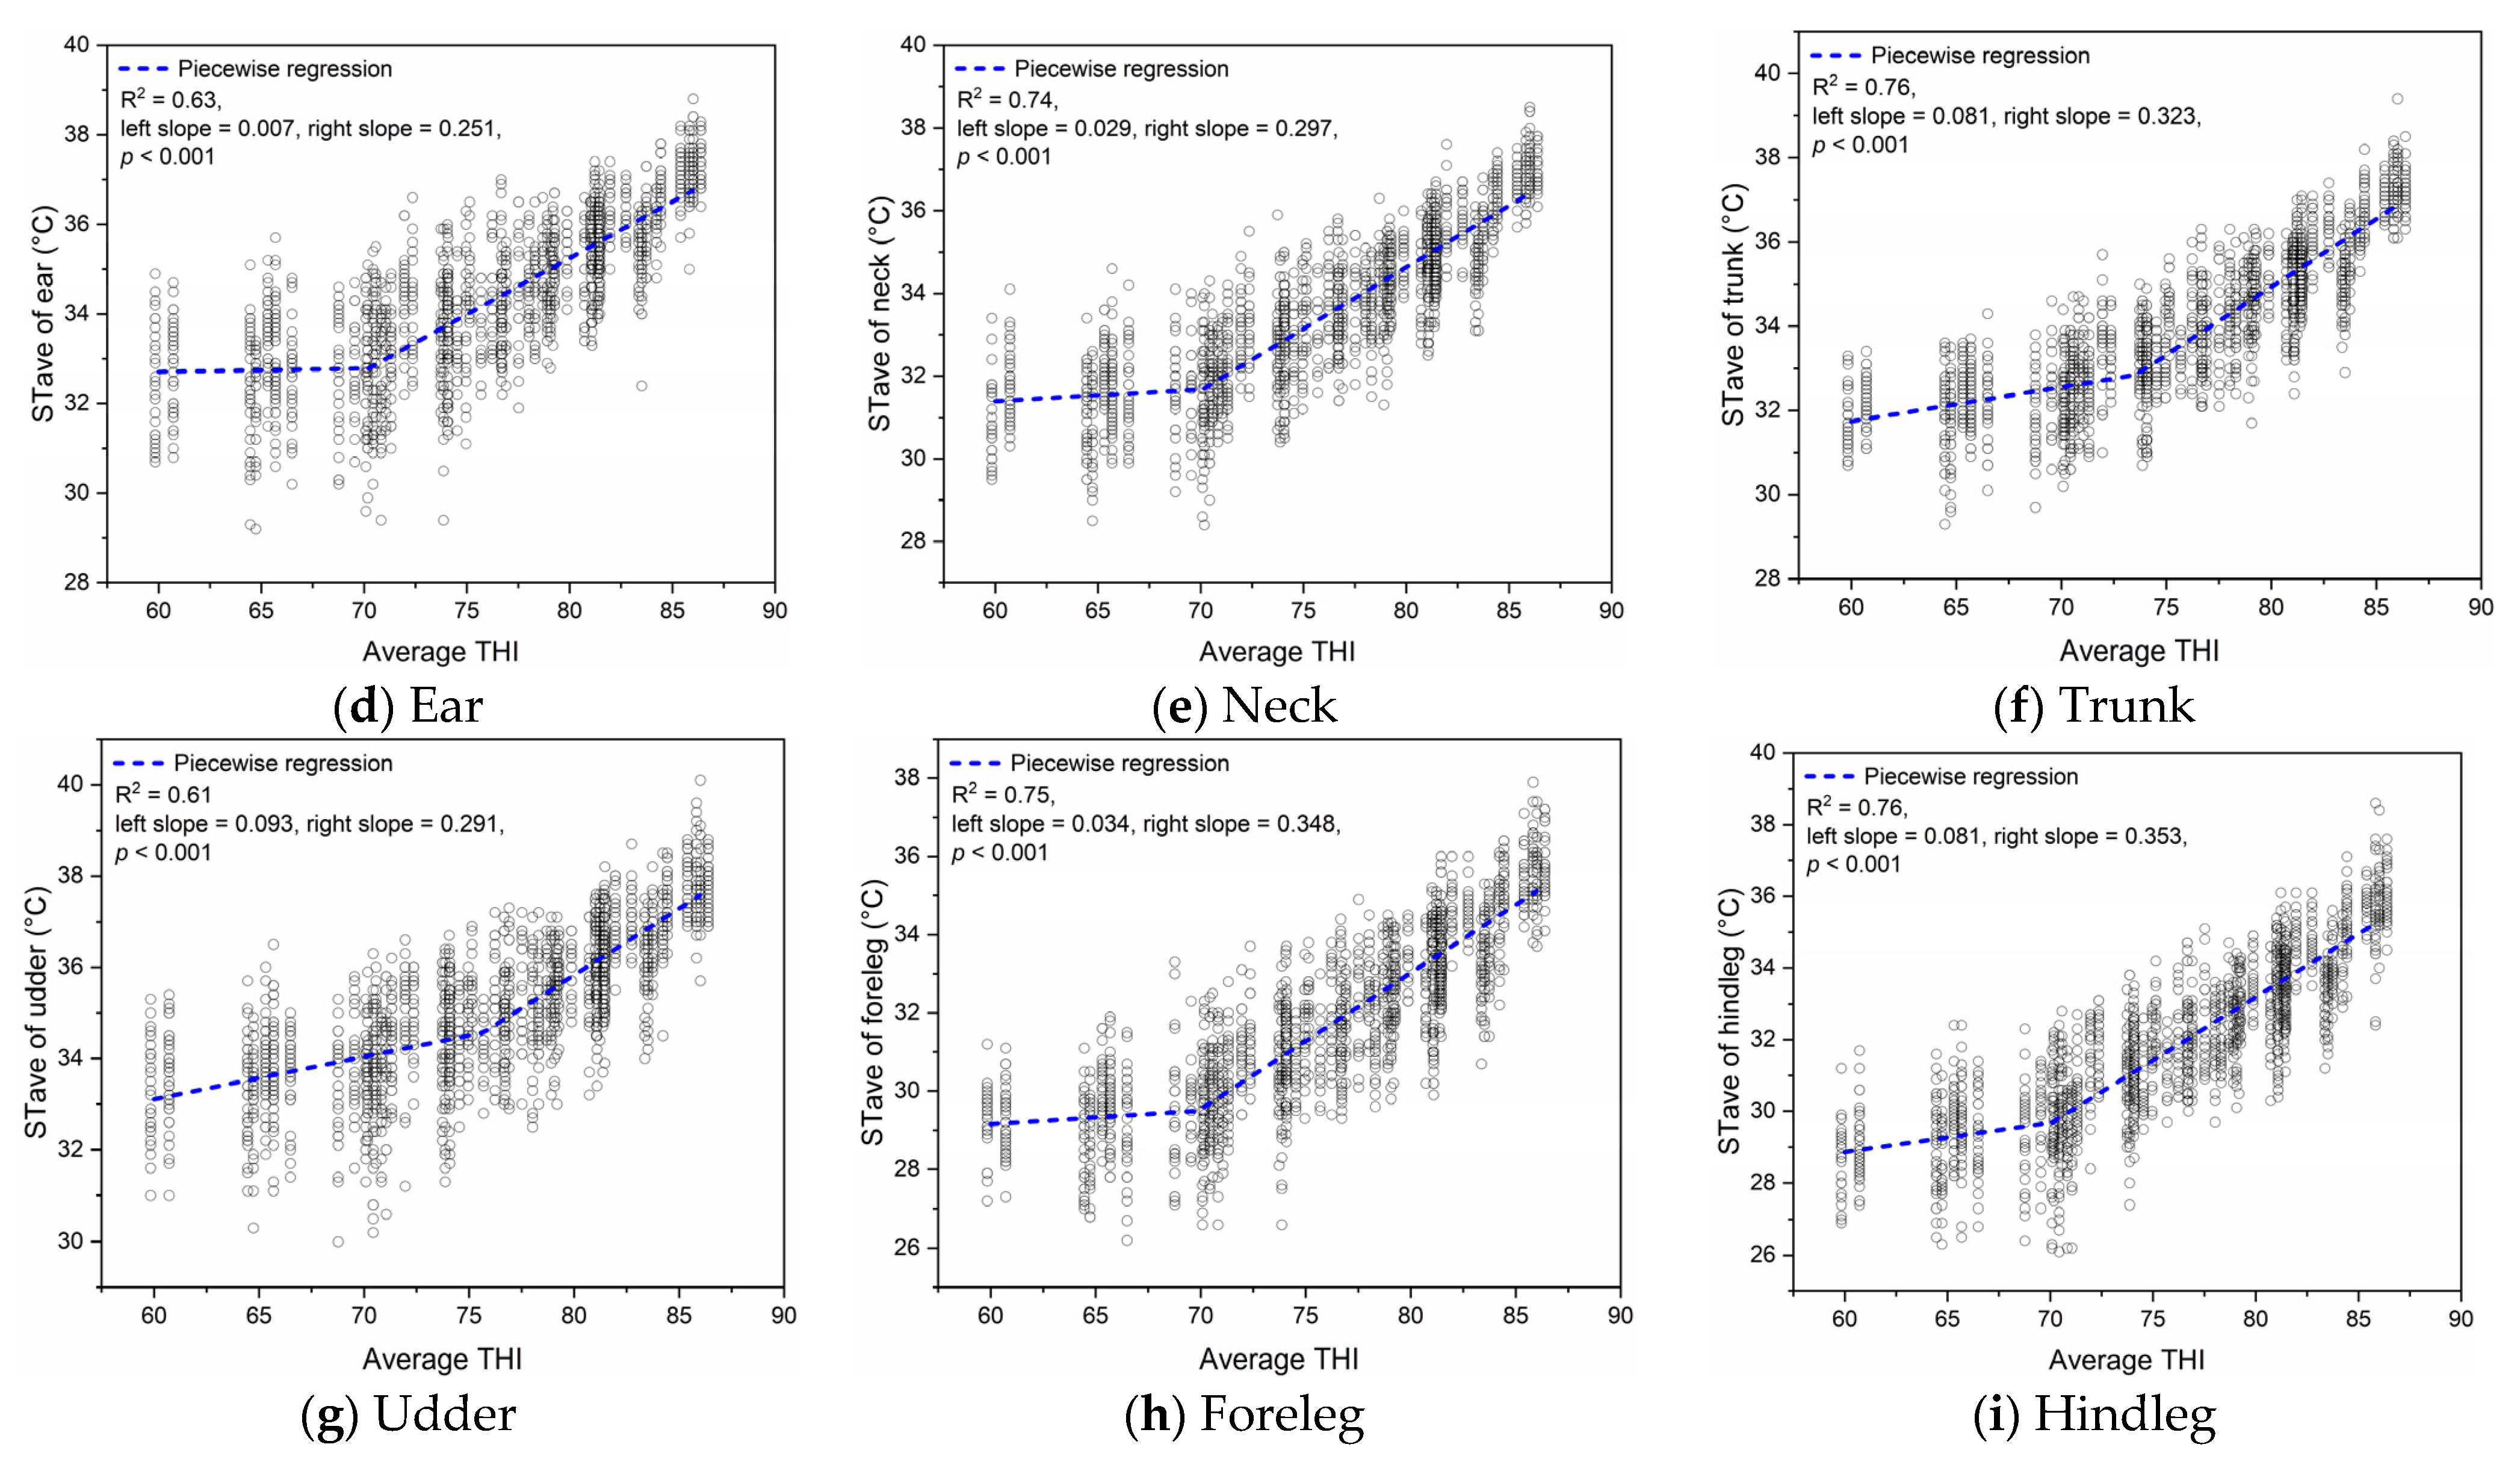
3.2. THI Thresholds for Maximum and Average Surface Temperature
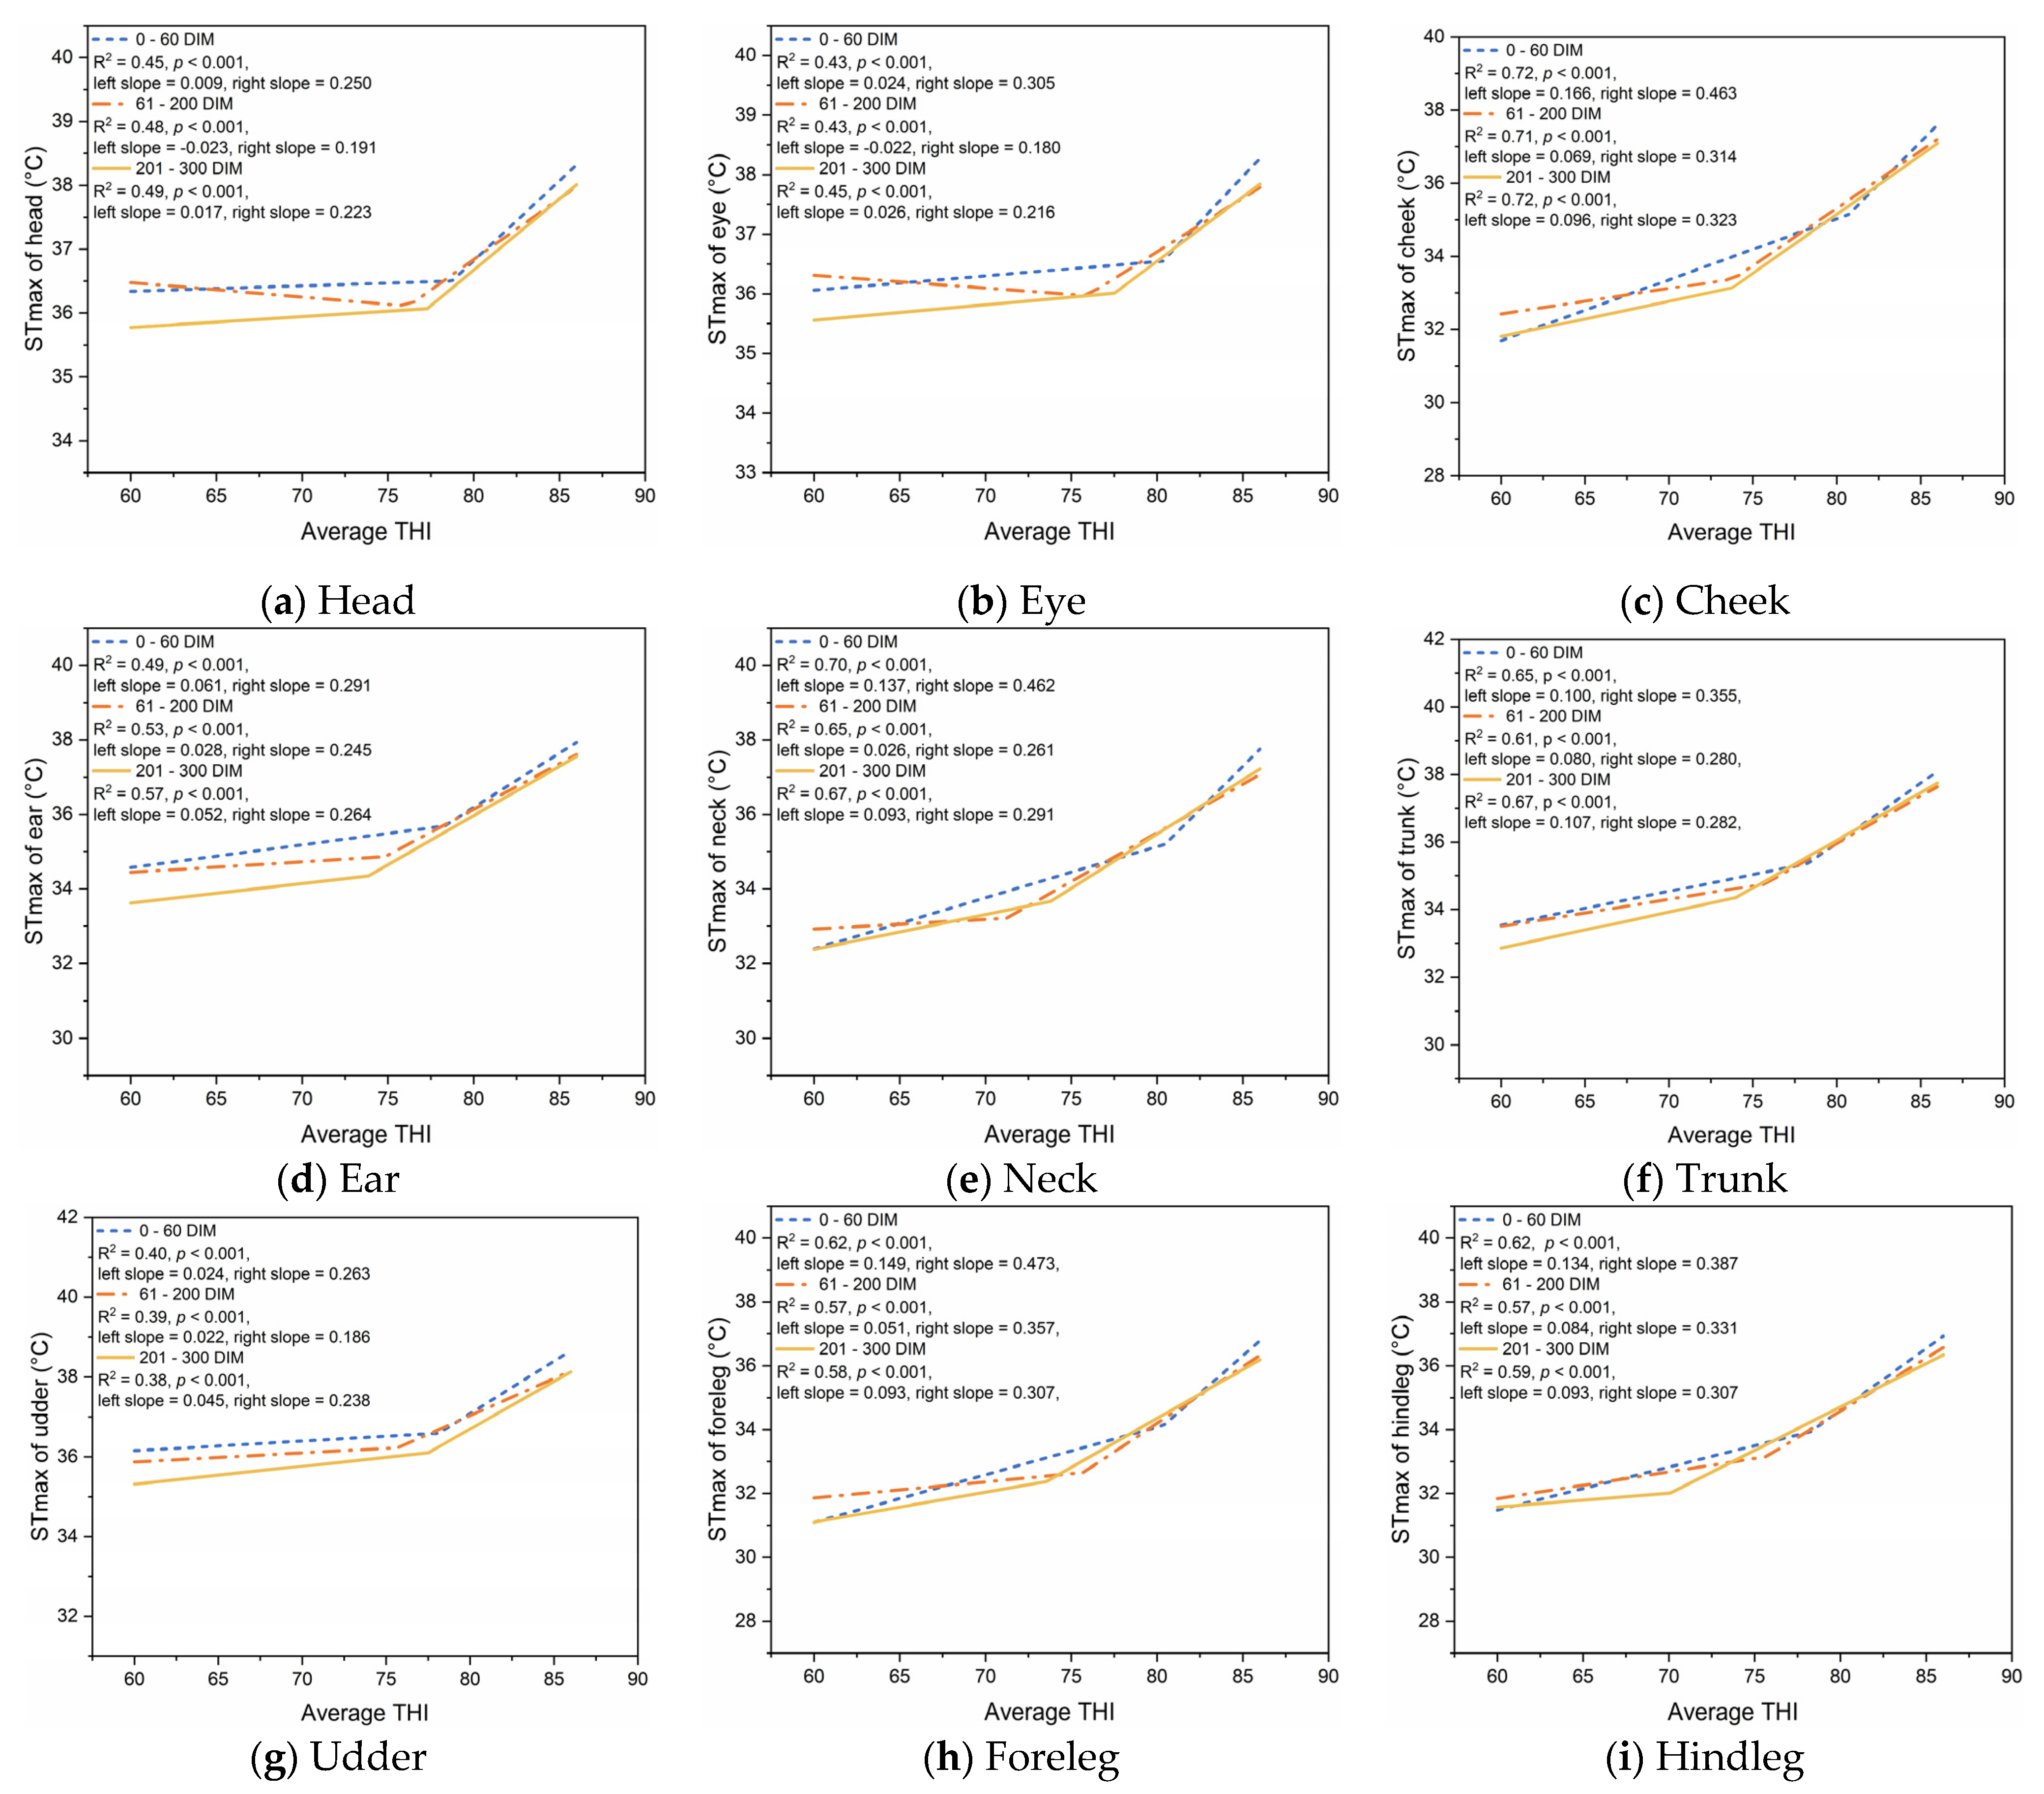
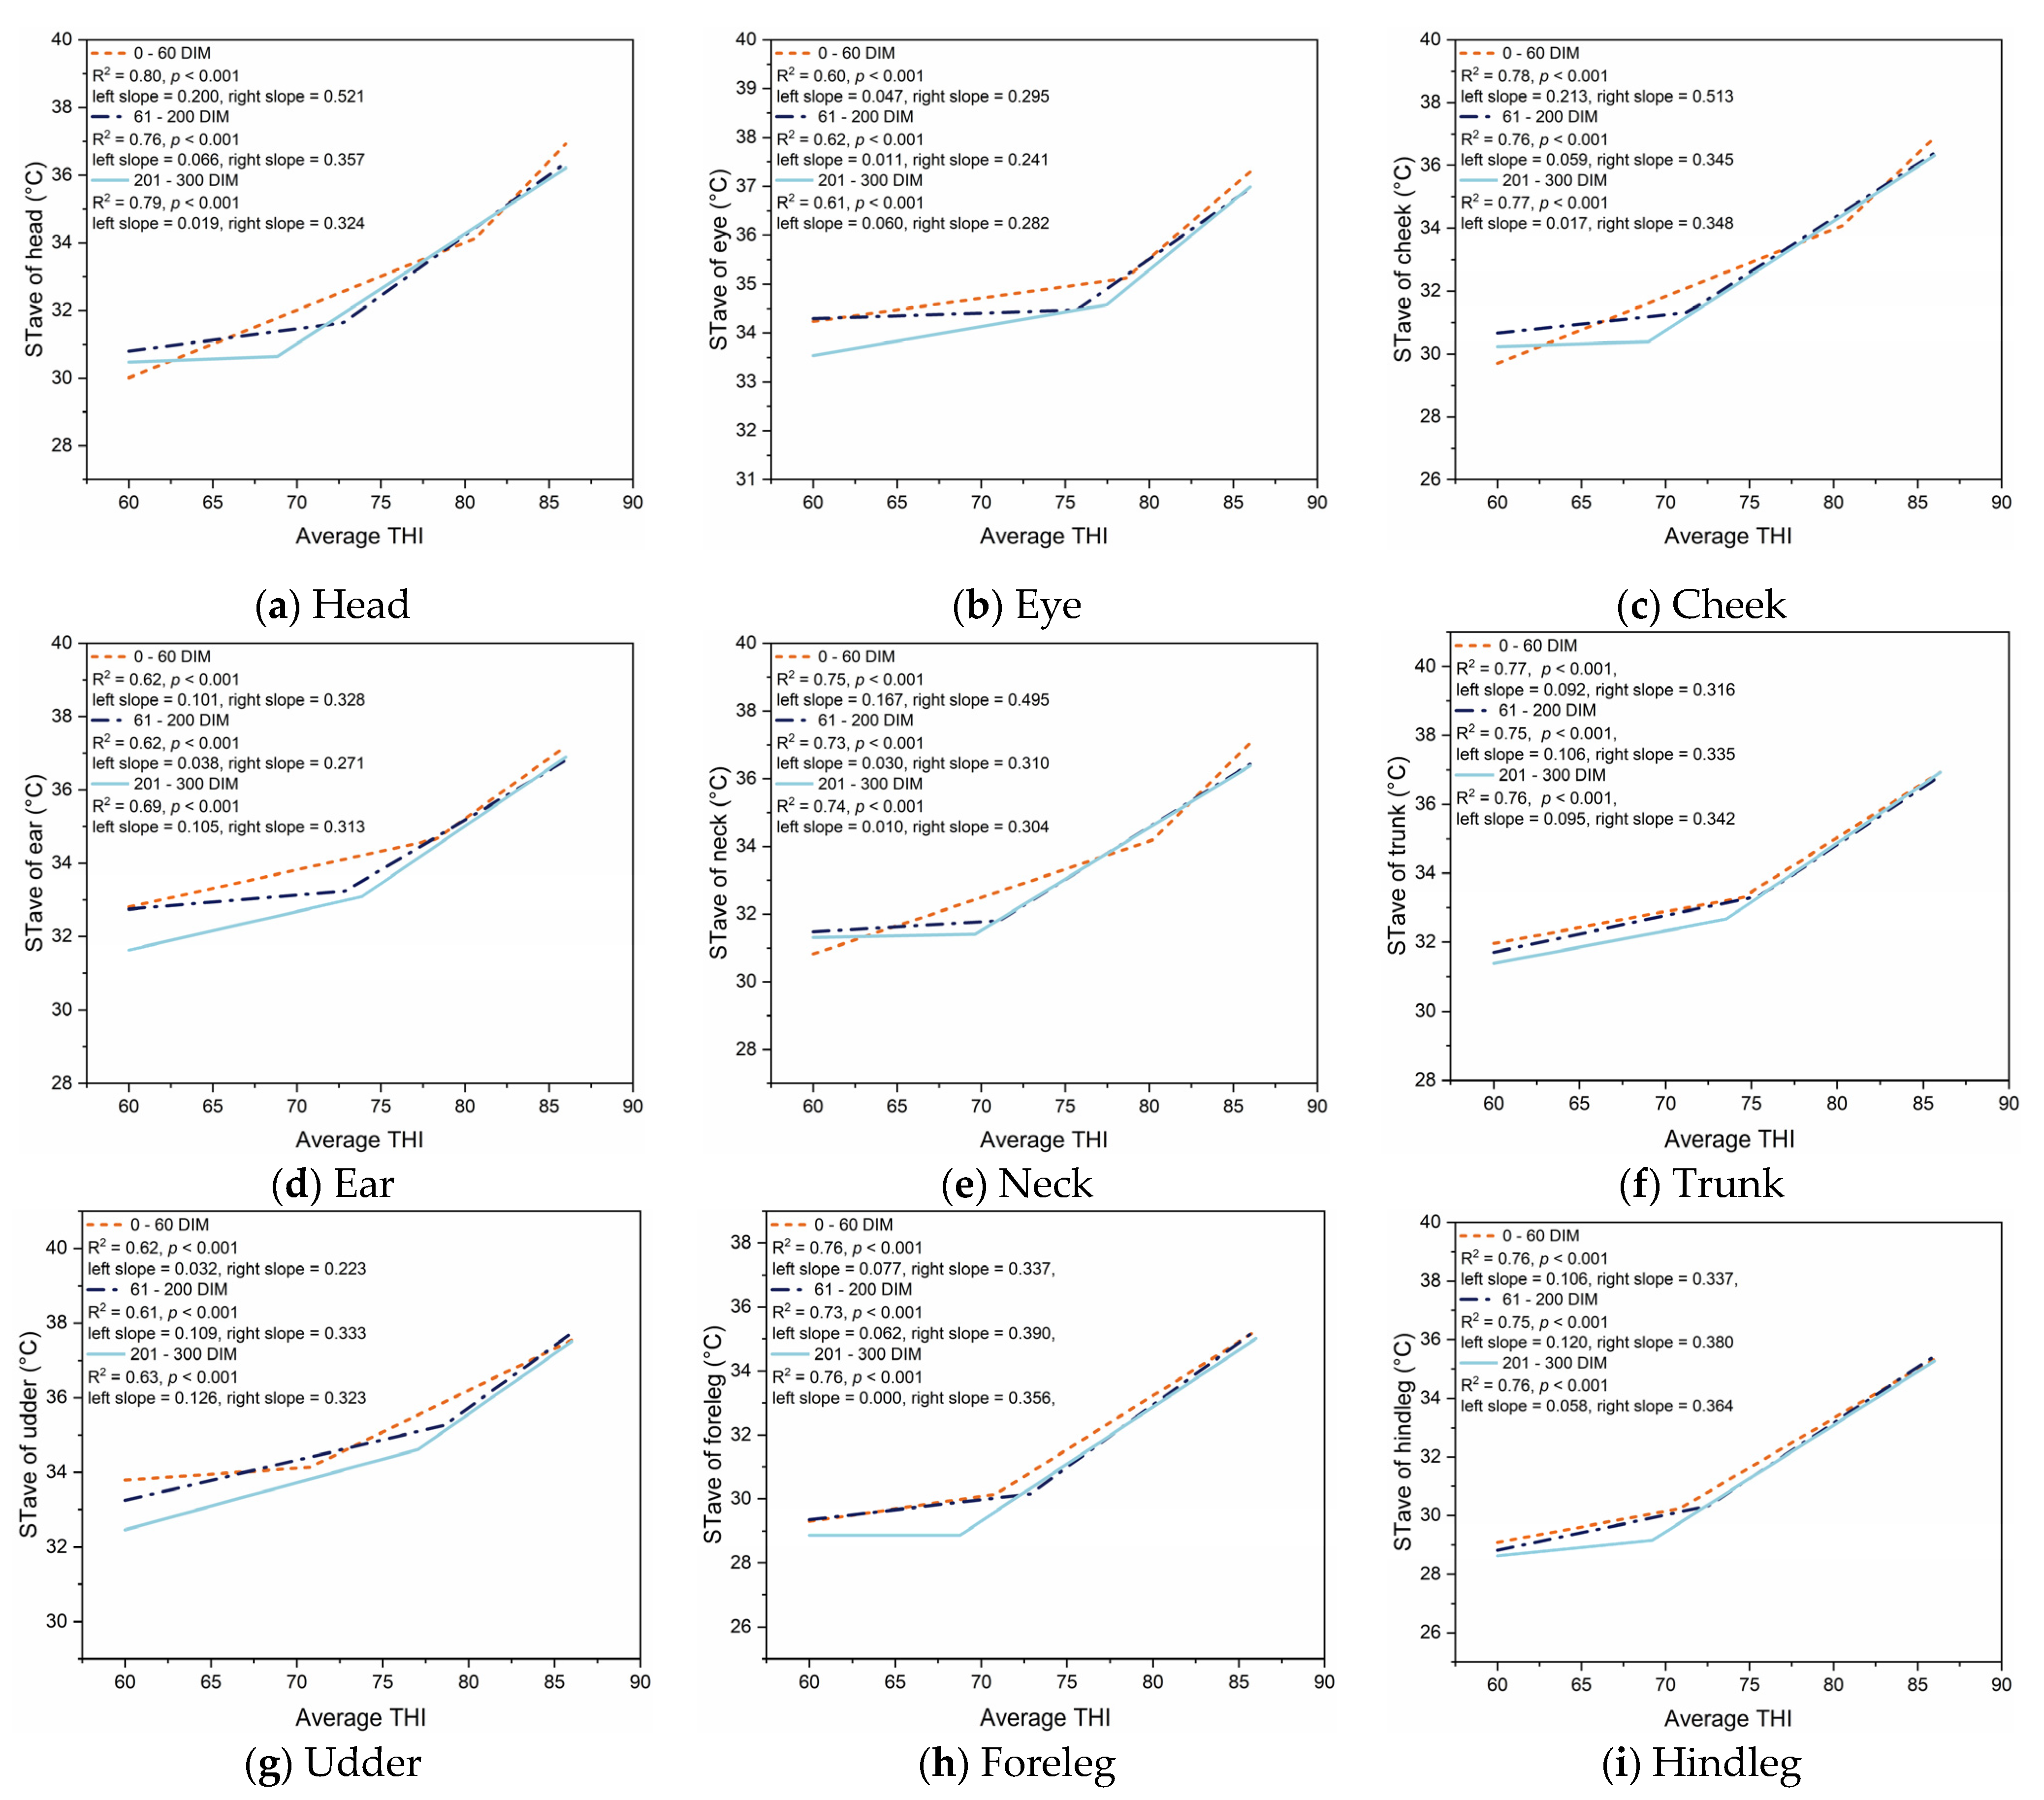
3.3. Effect of Lactation Stage on THI Thresholds for Maximum and Average Surface Temperature
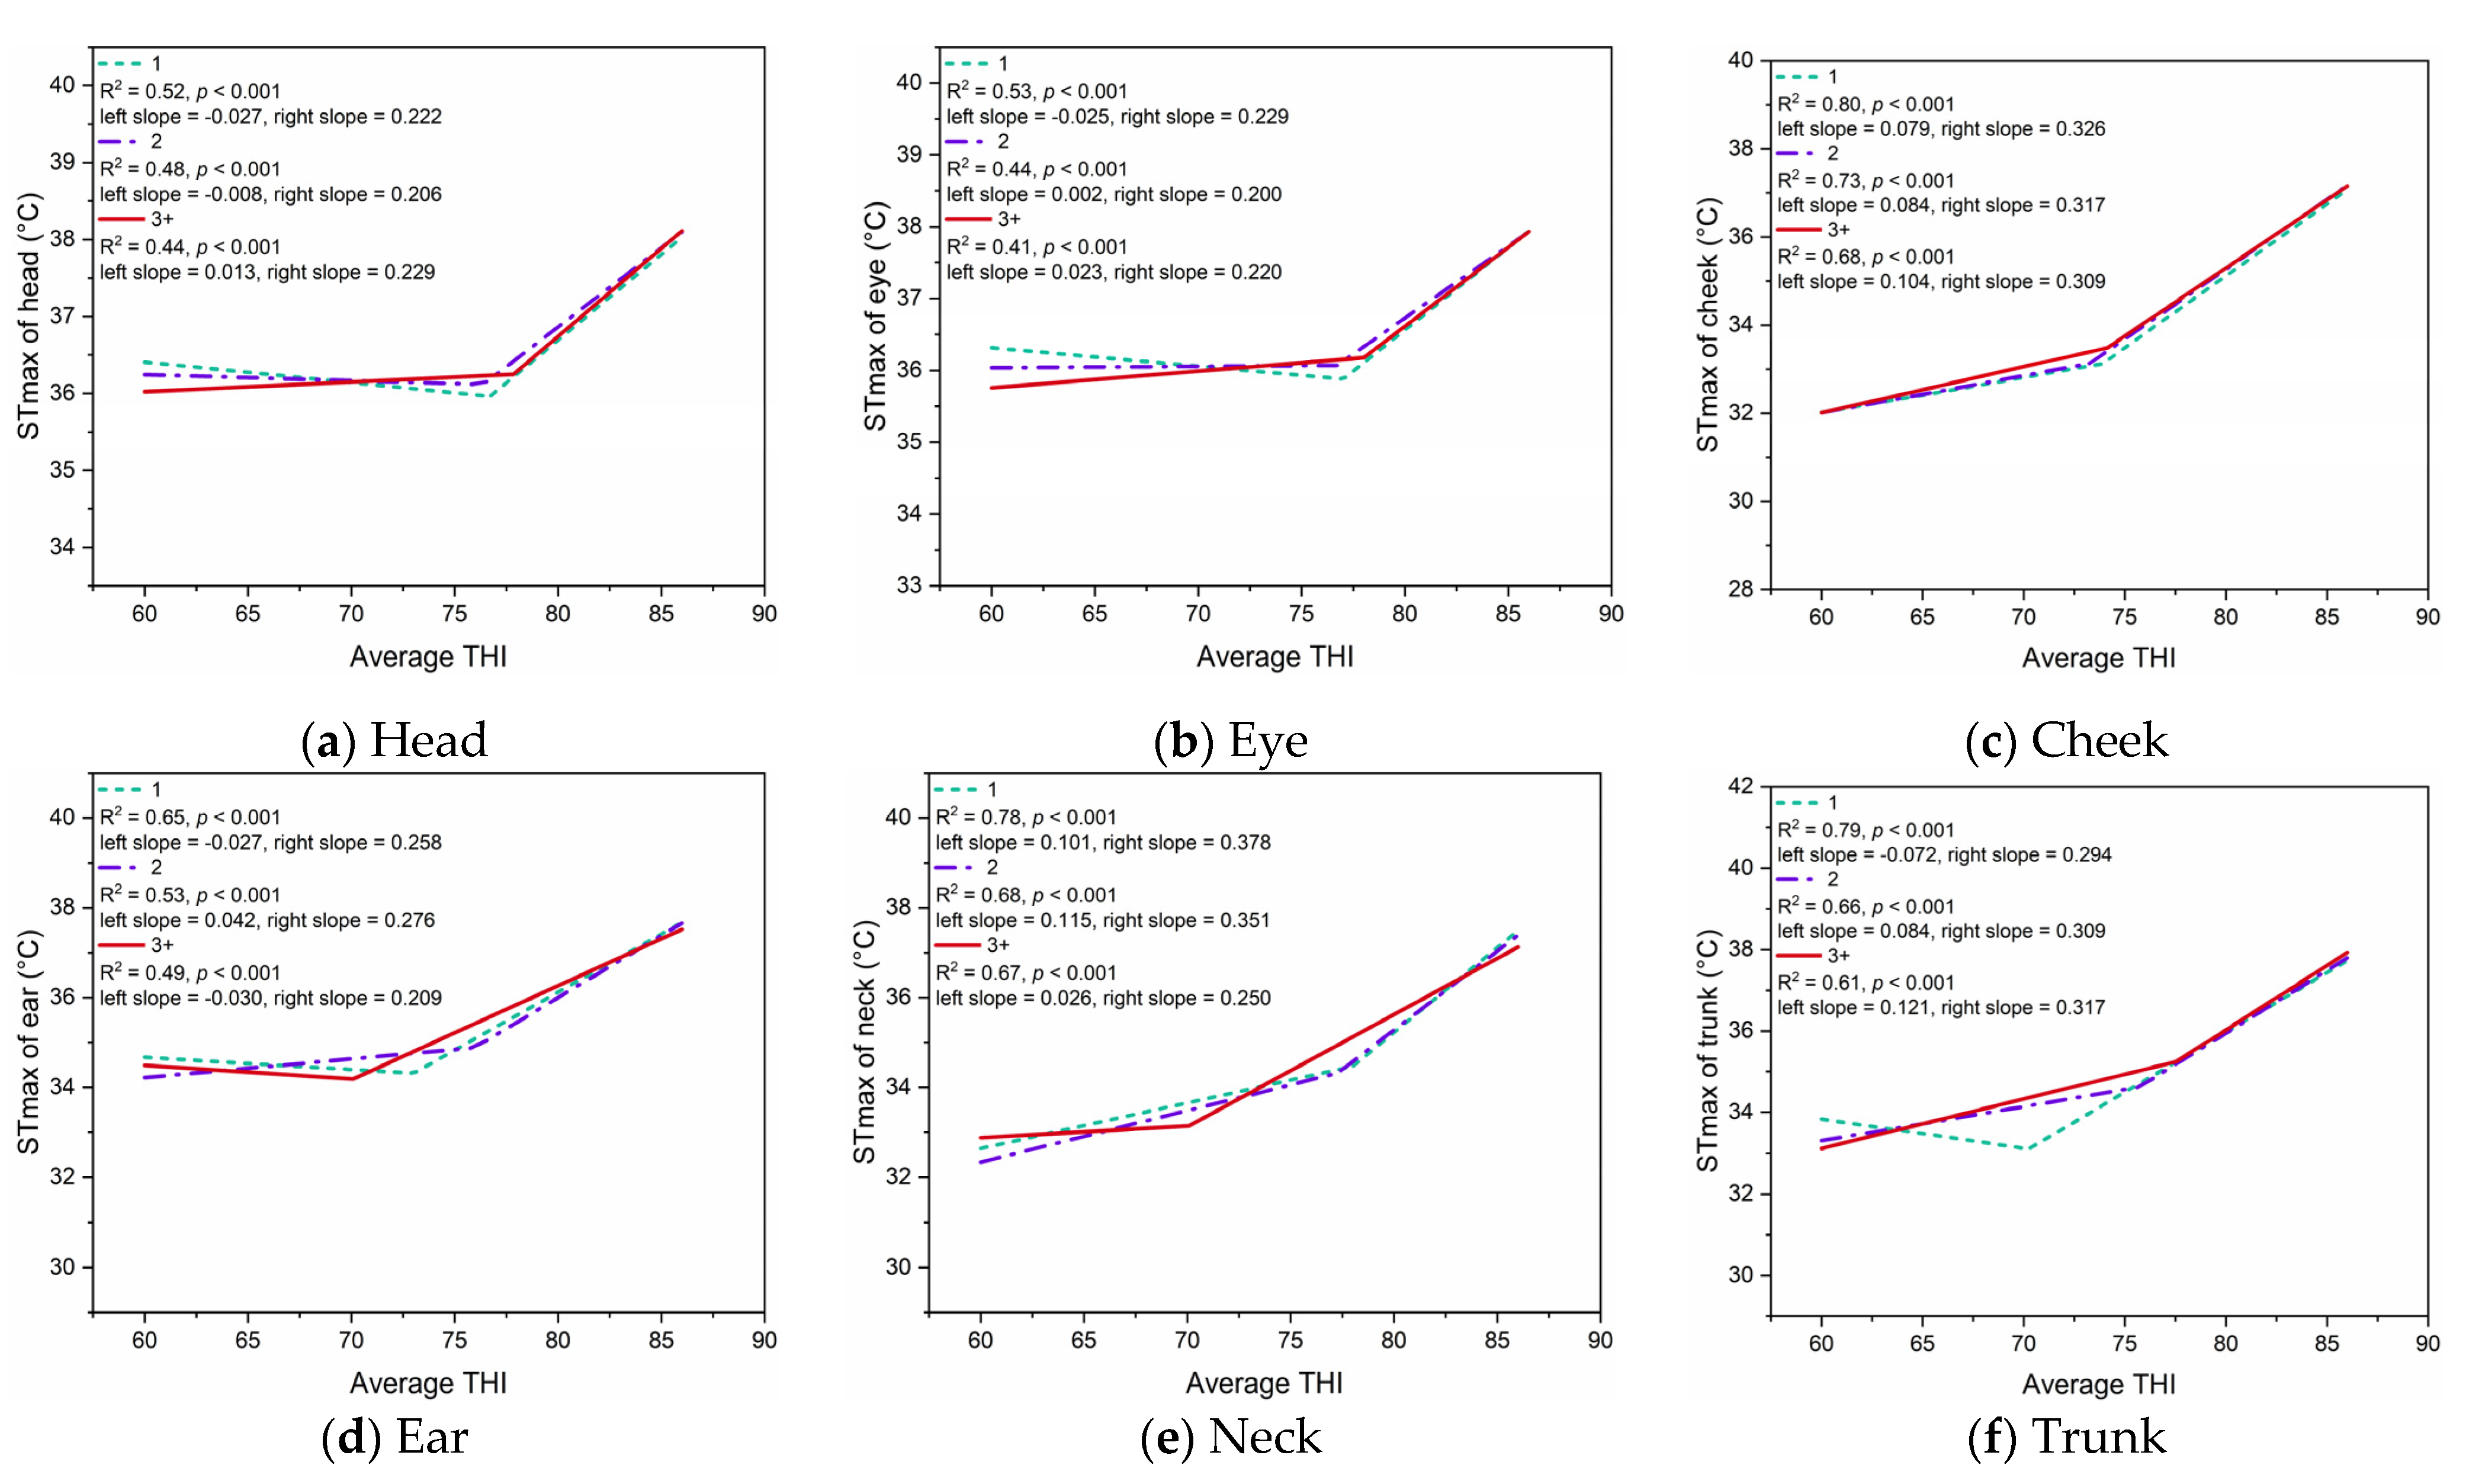
3.4. Effect of Lactation Number on THI Thresholds for Maximum and Average Surface Temperature
4. Discussion
5. Conclusions
Author Contributions
Funding
Institutional Review Board Statement
Informed Consent Statement
Data Availability Statement
Conflicts of Interest
References
- Dikmen, S.; Hansen, P.J. Is the temperature-humidity index the best indicator of heat stress in lactating dairy cows in a subtropical environment? J. Dairy Sci. 2009, 92, 109–116. [Google Scholar] [CrossRef] [Green Version]
- Hoffmann, G.; Herbut, P.; Pinto, S.; Heinicke, J.; Kuhla, B.; Amon, T. Animal-related, non-invasive indicators for determining heat stress in dairy cows. Biosyst. Eng. 2020, 199, 83–96. [Google Scholar] [CrossRef]
- Polsky, L.; von Keyserlingk, M.A.G. Effects of heat stress on dairy cattle welfare. J. Dairy Sci. 2017, 100, 8645–8657. [Google Scholar] [CrossRef] [Green Version]
- Godyń, D.; Herbut, P.; Angrecka, S. Measurements of peripheral and deep body temperature in cattle—A review. J. Therm. Biol. 2019, 79, 42–49. [Google Scholar] [CrossRef]
- Eigenberg, R.A.; Brown-Brandl, T.M.; Nienaber, J.A.; Hahn, G.L. Dynamic response indicators of heat stress in shaded and non-shaded feedlot cattle, part 2: Predictive relationships. Biosyst. Eng. 2005, 91, 111–118. [Google Scholar] [CrossRef] [Green Version]
- Kovács, L.; Kézér, F.L.; Ruff, F.; Jurkovich, V.; Szenci, O. Heart rate, cardiac vagal tone, respiratory rate, and rectal temperature in dairy calves exposed to heat stress in a continental region. Int. J. Biometeorol. 2018, 62, 1791–1797. [Google Scholar] [CrossRef]
- Wang, X.; Gao, H.; Gebremedhin, K.G.; Bjerg, B.S.; van Os, J.; Tucker, C.B.; Zhang, G. A predictive model of Equivalent Temperature Index for dairy Cattle (ETIC). J. Therm. Biol. 2018, 76, 165–170. [Google Scholar] [CrossRef]
- Kovács, L.; Kézér, F.L.; Póti, P.; Boros, N.; Nagy, K. Short communication: Upper critical temperature-humidity index for dairy calves based on physiological stress variables. J. Dairy Sci. 2020, 103, 2707–2710. [Google Scholar] [CrossRef] [PubMed]
- Dado-Senn, B.; Ouellet, V.; Dahl, G.E.; Laporta, J. Methods for assessing heat stress in preweaned dairy calves exposed to chronic heat stress or continuous cooling. J. Dairy Sci. 2020, 103, 8587–8600. [Google Scholar] [CrossRef]
- Ouellet, V.; Toledo, I.M.; Dado-Senn, B.; Dahl, G.E.; Laporta, J. Critical temperature-humidity index thresholds for dry cows in a subtropical climate. Front. Anim. Sci. 2021, 2, 28. [Google Scholar] [CrossRef]
- Pinto, S.; Hoffmann, G.; Ammon, C.; Amon, T. Critical THI thresholds based on the physiological parameters of lactating dairy cows. J. Therm. Biol. 2020, 88, 102523. [Google Scholar] [CrossRef]
- Herbut, P.; Angrecka, S.; Walczak, J. Environmental parameters to assessing of heat stress in dairy cattle—A review. Int. J. Biometeorol. 2018, 62, 2089–2097. [Google Scholar] [CrossRef] [Green Version]
- Salles, M.S.V.; da Silva, S.C.; Salles, F.A.; Roma, L.C.; El Faro, L.; Bustos Mac Lean, P.A.; Lins de Oliveira, C.E.; Martello, L.S. Mapping the body surface temperature of cattle by infrared thermography. J. Therm. Biol. 2016, 62, 63–69. [Google Scholar] [CrossRef] [PubMed]
- Peng, D.; Chen, S.; Li, G.; Chen, J.; Wang, J.; Gu, X. Infrared thermography measured body surface temperature and its relationship with rectal temperature in dairy cows under different temperature-humidity indexes. Int. J. Biometeorol. 2019, 63, 327–336. [Google Scholar] [CrossRef]
- Uddin, J.; Phillips, C.J.C.; Auboeuf, M.; McNeill, D.M. Relationships between body temperatures and behaviours in lactating dairy cows. Appl. Anim. Behav. Sci. 2021, 241, 105359. [Google Scholar] [CrossRef]
- Uddin, J.; McNeill, D.M.; Lisle, A.T.; Phillips, C.J.C. A sampling strategy for the determination of infrared temperature of relevant external body surfaces of dairy cows. Int. J. Biometeorol. 2020, 64, 1583–1592. [Google Scholar] [CrossRef]
- Daltro, D.D.S.; Fischer, V.; Alfonzo, E.P.M.; Dalcin, V.C.; Stumpf, M.T.; Kolling, G.J.; da Silva, M.V.G.B.; McManus, C. Infrared thermography as a method for evaluating the heat tolerance in dairy cows Infrared thermography as a method for evaluating the heat tolerance in dairy cows. R. Bras. Zootec. 2017, 46, 374–383. [Google Scholar] [CrossRef] [Green Version]
- Romanovsky, A.A. Skin temperature: Its role in thermoregulation. Acta. Physiol. 2014, 210, 498–507. [Google Scholar] [CrossRef] [PubMed]
- Sakoi, T.; Tsuzuki, K.; Kato, S.; Ooka, R.; Song, D.; Zhu, S. Thermal comfort, skin temperature distribution, and sensible heat loss distribution in the sitting posture in various asymmetric radiant fields. Build. Environ. 2007, 42, 3984–3999. [Google Scholar] [CrossRef]
- Djongyang, N.; Tchinda, R.; Njomo, D. Thermal comfort: A review paper. Renew. Sustain. Energy Rev. 2010, 14, 2626–2640. [Google Scholar] [CrossRef]
- McManus, C.; Tanure, C.B.; Peripolli, V.; Seixas, L.; Fischer, V.; Gabbi, A.M.; Menegassi, S.R.O.; Stumpf, M.T.; Kolling, G.J.; Dias, E.; et al. Infrared thermography in animal production: An overview. Comput. Electron. Agric. 2016, 123, 10–16. [Google Scholar] [CrossRef]
- Li, S.; Gebremedhin, K.G.; Lee, C.; Collier, R. Evaluation of thermal stress indices for cattle. In Proceedings of the 2009 ASABE Annual International Meeting, St. Joseph, MI, USA, 21–24 June 2009. [Google Scholar]
- Tao, S.; Orellana Rivas, R.M.; Marins, T.N.; Chen, Y.-C.; Gao, J.; Bernard, J.K. Impact of heat stress on lactational performance of dairy cows. Theriogenology 2020, 150, 437–444. [Google Scholar] [CrossRef]
- Müschner-Siemens, T.; Hoffmann, G.; Ammon, C.; Amon, T. Daily rumination time of lactating dairy cows under heat stress conditions. J. Therm. Biol. 2020, 88, 102484. [Google Scholar] [CrossRef] [PubMed]
- NRC. A Guide to Environmental Research on Animals; National Academy of Sciences: Washington, DC, USA, 1971. [Google Scholar]
- Montanholi, Y.R.; Lim, M.; Macdonald, A.; Smith, B.A.; Goldhawk, C.; Schwartzkopf-Genswein, K.; Miller, S.P. Technological, environmental and biological factors: Referent variance values for infrared imaging of the bovine. J. Anim. Sci. Biotechnol. 2015, 6, 1–16. [Google Scholar] [CrossRef]
- Isola, J.V.V.; Menegazzi, G.; Busanello, M.; dos Santos, S.B.; Agner, H.S.S.; Sarubbi, J. Differences in body temperature between black-and-white and red-and-white Holstein cows reared on a hot climate using infrared thermography. J. Therm. Biol. 2020, 94, 102775. [Google Scholar] [CrossRef] [PubMed]
- Macmillan, K.; Colazo, M.G.; Cook, N.J. Evaluation of infrared thermography compared to rectal temperature to identify illness in early postpartum dairy cows. Res. Vet. Sci. 2019, 125, 315–322. [Google Scholar] [CrossRef] [PubMed]
- Yan, G.; Li, H.; Zhao, W.; Shi, Z. Evaluation of thermal indices based on their relationships with some physiological responses of housed lactating cows under heat stress. Int. J. Biometeorol. 2020, 64, 2077–2091. [Google Scholar] [CrossRef]
- Heinicke, J.; Hoffmann, G.; Ammon, C.; Amon, B.; Amon, T. Effects of the daily heat load duration exceeding determined heat load thresholds on activity traits of lactating dairy cows. J. Therm. Biol. 2018, 77, 67–74. [Google Scholar] [CrossRef]
- Muggeo, V. Segmented: An R package to fit regression models with broken-line relationships. R News 2008, 8, 20–25. [Google Scholar]
- Armstrong, D.V. Heat stress interaction with shade and cooling. J. Dairy Sci. 1994, 77, 2044–2050. [Google Scholar] [CrossRef]
- Zimbelman, R.B.; Rhoads, R.; Rhoads, M.; Duff, G.; Baumgard, L.; Collier, R. A re-evaluation of the impact of Temperature Humidity Index (THI) and Black Globe Humidity Index (BGHI) on milk production in high producing dairy cows. In Proceedings of the Southwest Nutrition & Management Conference, Tempe, AZ, USA, 26–27 February 2009; pp. 158–169. [Google Scholar]
- Collier, R.; Hall, L.; Rungruang, S.; Zimbelman, R. Quantifying heat stress and its impact on metabolism and performance. In Proceedings of the 23rd Annual Ruminant Nutrition Symposium, Gainesville, FL, USA, 31 January–1 February 2012; pp. 74–84. [Google Scholar]
- Montanholi, Y.R.; Swanson, K.C.; Palme, R.; Schenkel, F.S.; Mcbride, B.W.; Lu, D.; Miller, S.P. Assessing feed efficiency in beef steers through feeding behavior, infrared thermography and glucocorticoids*. Animal 2010, 4, 692–701. [Google Scholar] [CrossRef] [PubMed]
- Yan, G.; Liu, K.; Hao, Z.; Shi, Z.; Li, H. The effects of cow-related factors on rectal temperature, respiration rate, and temperature-humidity index thresholds for lactating cows exposed to heat stress. J. Therm. Biol. 2021, 100, 103041. [Google Scholar] [CrossRef]
- Osei-Amponsah, R.; Dunshea, F.R.; Leury, B.J.; Cheng, L.; Cullen, B.; Joy, A.; Abhijith, A.; Zhang, M.H.; Chauhan, S.S. Heat stress impacts on lactating cows grazing Australian summer pastures on an automatic Robotic Dairy. Animals 2020, 10, 869. [Google Scholar] [CrossRef]
- Perera, K.S.; Gwazdauskas, F.C.; Pearson, R.E.; Brumback, T.B. Effect of season and stage of lactation on performance of Holsteins. J. Dairy Sci. 1986, 69, 228–236. [Google Scholar] [CrossRef]
- Maust, L.E.; Mcdowell, R.E.; Hooven, N.W. Effect of summer weather on performance of Holstein cows in three stages of lactation. J. Dairy Sci. 1972, 55, 1133–1139. [Google Scholar] [CrossRef]
- Adriaens, I.; van den Brulle, I.; D’Anvers, L.; Statham, J.M.E.; Geerinckx, K.; de Vliegher, S.; Piepers, S.; Aernouts, B. Milk losses and dynamics during perturbations in dairy cows differ with parity and lactation stage. J. Dairy Sci. 2021, 104, 405–418. [Google Scholar] [CrossRef] [PubMed]
- CIGR. Heat and moisture production at animal and house levels. In Fourth Report of CIGR Working Group on Climatization of Animal Houses; Pedersen, S., Sällvik, K., Eds.; Research Centre Bygholm, Danish Institute of Agricultural Sciences: Horsens, Denmark, 2002. [Google Scholar]


| Parameter | Mean | Standard Deviation | Minimum | Maximum |
|---|---|---|---|---|
| Lactation number | 2.5 | 0.6 | 1 | 5 |
| Days in milk | 151.8 | 103.3 | 9 | 300 |
| Daily milk yield, kg | 37.0 | 12.3 | 1.7 | 66.6 |
| Body Region | Relationship between STmax and RT | Relationship between STave and RT | ||||
|---|---|---|---|---|---|---|
| Relation | R2 | Pearson r | Relation | R2 | Pearson r | |
| Head (N = 1565) | STmax = 1.09 RT − 5.87 | 0.33 | 0.579 | STave = 2.77 RT − 74.67 | 0.46 | 0.677 |
| Eye (N = 1565) | STmax = 1.09 RT − 5.82 | 0.32 | 0.566 | STave = 1.53 RT − 24.54 | 0.41 | 0.644 |
| Cheek (N = 1565) | STmax = 2.42 RT − 59.92 | 0.48 | 0.694 | STave = 2.92 RT − 80.92 | 0.51 | 0.711 |
| Ear (N = 1565) | STmax = 2.01 RT − 42.89 | 0.45 | 0.670 | STave = 2.38 RT − 58.56 | 0.48 | 0.696 |
| Neck (N = 1565) | STmax = 2.21 RT − 51.64 | 0.43 | 0.655 | STave = 2.55 RT − 65.81 | 0.45 | 0.668 |
| Trunk (N = 1565) | STmax = 2.18 RT − 49.82 | 0.45 | 0.671 | STave = 2.45 RT − 61.68 | 0.47 | 0.686 |
| Udder (N = 1565) | STmax = 1.59 RT − 25.33 | 0.42 | 0.648 | STave = 2.31 RT − 54.79 | 0.49 | 0.702 |
| Foreleg (N = 1565) | STmax = 2.42 RT − 60.99 | 0.41 | 0.639 | STave = 3.02 RT − 86.12 | 0.46 | 0.675 |
| Hindleg (N = 1565) | STmax = 2.47 RT − 62.48 | 0.41 | 0.649 | STave = 3.15 RT − 90.73 | 0.46 | 0.681 |
| Body Region | THI Breakpoint for STmax | THI Breakpoint for STave |
|---|---|---|
| Head | 77.1 ± 0.3 | 77.2 ± 0.4 |
| Eye | 77.3 ± 0.3 | 77.2 ± 0.3 |
| Cheek | 73.6 ± 0.5 | 69.1 ± 0.5 |
| Ear | 75.6 ± 0.5 | 70.2 ± 0.5 |
| Neck | 77.3 ± 0.4 | 70.1 ± 0.5 |
| Trunk | 74.3 ± 0.5 | 73.5 ± 0.4 |
| Udder | 77.9 ± 0.4 | 75.7 ± 0.5 |
| Foreleg | 75.7 ± 0.5 | 69.9 ± 0.5 |
| Hindleg | 75.7 ± 0.6 | 70.1 ± 0.6 |
| THI Breakpoint | Body Region | Early-Lactation 1 | Mid-Lactation 1 | Late-Lactation 1 |
|---|---|---|---|---|
| Head | 78.7 ± 0.5 | 76.2 ± 0.6 | 77.3 ± 0.5 | |
| Eye | 80.3 ± 0.4 | 75.9 ± 0.7 | 77.5 ± 0.5 | |
| Cheek | 80.7 ± 0.5 | 73.9 ± 0.9 | 73.7 ± 0.6 | |
| Ear | 78.3 ± 0.7 | 74.8 ± 1.0 | 73.9 ± 0.7 | |
| STmax | Neck | 80.5 ± 0.5 | 71.2 ± 1.1 | 73.8 ± 0.7 |
| Trunk | 78.3 ± 0.7 | 75.7 ± 1.0 | 74.0 ± 0.8 | |
| Udder | 78.1 ± 0.7 | 75.7 ± 1.2 | 77.5 ± 0.7 | |
| Foreleg | 80.4 ± 0.6 | 75.7 ± 0.9 | 73.5 ± 0.9 | |
| Hindleg | 78.3 ± 0.8 | 75.7 ± 1.1 | 70.1 ± 1.1 | |
| Head | 80.7 ± 0.5 | 72.8 ± 0.9 | 68.8 ± 0.6 | |
| Eye | 78.6 ± 0.5 | 75.7 ± 0.7 | 77.5 ± 0.5 | |
| Cheek | 70.5 ± 0.6 | 71.3 ± 0.9 | 69.0 ± 0.6 | |
| Ear | 78.3 ± 0.7 | 72.9 ± 1.1 | 73.9 ± 0.7 | |
| STave | Neck | 80.2 ± 0.5 | 71.1 ± 0.9 | 69.6 ± 0.6 |
| Trunk | 74.5 ± 0.6 | 75.6 ± 0.8 | 73.5 ± 0.5 | |
| Udder | 70.7 ± 0.8 | 78.6 ± 0.8 | 77.1 ± 0.8 | |
| Foreleg | 70.8 ± 0.7 | 72.8 ± 0.9 | 68.8 ± 0.6 | |
| Hindleg | 70.8 ± 0.8 | 72.5 ± 1.1 | 69.2 ± 0.8 |
| THI Breakpoint | Body Region | 1st-Lactation 1 | 2nd-Lactation 1 | 3rd+-Lactation 1 |
|---|---|---|---|---|
| Head | 76.7 ± 1.2 | 76.4 ± 0.5 | 77.8 ± 0.4 | |
| Eye | 77.0 ± 1.1 | 76.7 ± 0.6 | 78.0 ± 0.5 | |
| Cheek | 73.9 ± 1.7 | 73.2 ± 0.7 | 74.1 ± 0.6 | |
| Ear | 73.0 ± 1.4 | 76.0 ± 0.7 | 70.1 ± 0.8 | |
| STmax | Neck | 78.0 ± 1.3 | 77.3 ± 0.6 | 70.1 ± 0.7 |
| Trunk | 70.2 ± 1.1 | 75.7 ± 0.7 | 77.5 ± 0.7 | |
| Udder | 72.8 ± 1.4 | 78.0 ± 0.6 | 73.9 ± 0.6 | |
| Foreleg | 72.7 ± 1.6 | 75.8 ± 0.7 | 70.4 ± 0.7 | |
| Hindleg | 69.1 ± 1.2 | 80.5 ± 0.6 | 68.8 ± 0.7 | |
| Head | 70.4 ± 1.3 | 77.0 ± 0.6 | 77.4 ± 0.6 | |
| Eye | 77.1 ± 0.9 | 76.1 ± 0.5 | 77.8 ± 0.5 | |
| Cheek | 69.7 ± 1.3 | 70.1 ± 0.8 | 69.3 ± 0.7 | |
| Ear | 72.9 ± 1.3 | 75.6 ± 0.7 | 69.9 ± 0.8 | |
| STave | Neck | 73.2 ± 1.3 | 70.1 ± 0.7 | 69.8 ± 0.6 |
| Trunk | 71.8 ± 0.8 | 74.6 ± 0.5 | 69.9 ± 0.6 | |
| Udder | 72.0 ± 1.4 | 78.0 ± 0.7 | 69.6 ± 0.7 | |
| Foreleg | 70.2 ± 1.1 | 70.1 ± 0.8 | 69.6 ± 0.6 | |
| Hindleg | 71.5 ± 1.0 | 70.1 ± 0.8 | 69.7 ± 0.7 |
Publisher’s Note: MDPI stays neutral with regard to jurisdictional claims in published maps and institutional affiliations. |
© 2021 by the authors. Licensee MDPI, Basel, Switzerland. This article is an open access article distributed under the terms and conditions of the Creative Commons Attribution (CC BY) license (https://creativecommons.org/licenses/by/4.0/).
Share and Cite
Yan, G.; Shi, Z.; Li, H. Critical Temperature-Humidity Index Thresholds Based on Surface Temperature for Lactating Dairy Cows in a Temperate Climate. Agriculture 2021, 11, 970. https://doi.org/10.3390/agriculture11100970
Yan G, Shi Z, Li H. Critical Temperature-Humidity Index Thresholds Based on Surface Temperature for Lactating Dairy Cows in a Temperate Climate. Agriculture. 2021; 11(10):970. https://doi.org/10.3390/agriculture11100970
Chicago/Turabian StyleYan, Geqi, Zhengxiang Shi, and Hao Li. 2021. "Critical Temperature-Humidity Index Thresholds Based on Surface Temperature for Lactating Dairy Cows in a Temperate Climate" Agriculture 11, no. 10: 970. https://doi.org/10.3390/agriculture11100970
APA StyleYan, G., Shi, Z., & Li, H. (2021). Critical Temperature-Humidity Index Thresholds Based on Surface Temperature for Lactating Dairy Cows in a Temperate Climate. Agriculture, 11(10), 970. https://doi.org/10.3390/agriculture11100970