1. Introduction
Consumers in the EU are increasingly paying attention to their food choices in light of sustainability [
1], showing increasing preference for organic food over conventionally grown food [
2,
3,
4]. The largest organic market is the one in the USA (42%), followed by Germany (11%) and France (9%) [
5]. In the first decade of the 20th century, the organic market in the Czech Republic was of minor importance [
6], whereas, currently (2019), its value reaches CZK 3.33 billion (approx. EUR 140 mil.) [
7]. Several authors [
8,
9,
10,
11] have suggested that there are two general underlying levels of organic produce shopping: egoistic and altruistic. The driving force behind the egoistic motivation to buy organic food is the perception of its higher quality; it also lies in the belief that it may be healthier, with better nutritional level, and it is overall more beneficial than conventionally grown food products [
12,
13]. The altruistic motivation is driven by the perception of environmental issues, animal welfare consideration and consciousness of the impact of agriculture on rural areas [
14]. Similarly, Lu and Chi [
15] explored the respondents’ perceived hedonic and utilitarian value of organic food purchase. Pétursson [
16] focused on the impact of emotions and the sense of community and intimacy on organic produce purchases and Kim, Lusk and Brorsen [
17] looked into another aspect of organic food purchases—the effect of social pressure, i.e., the need to demonstrate a certain social status to others. Nguyen et al. [
18], on the other hand, proposed a unique model of buying behaviour incorporating environmental concern and guilt, after investigating the key determinants of consumer choice to buy organic meat in an emerging market.
Consumers are naturally inclined to pursue prestige or social status under different consumer behaviour situations when buying food [
19]. The most commonly used theoretical models about social status draw on the Veblen effect [
20]; it assumes that the “social status” itself provides utility to the consumers from showcasing their wealth to others. Pawlewicz [
21] studied the changing trend in price premiums for organic food and suggested that price premium leads to decreasing the affordability of such products. Having executed a choice experiment to test US consumers‘ willingness to pay a price premium for organic chicken breast, Van Loo et al. [
22] suggested that price premiums decrease gradually as supply increases and organic food is more present in the supermarkets.
Jensen et al. [
23] discovered that the perception of various benefits (taste, safety, animal welfare and environmentally friendly production) of local organic produce does not differ much. The research study conducted by Živělová and Crhová [
24] suggests that the key factor in determining the consumer demand for organic produce in the Czech Republic is price. A comparison among prices in several chain stores showed that organic products were much more expensive than conventional products, apart from milk and dairy products, where the difference was not so marked. Nevertheless, the research study also revealed the respondents’ awareness of the qualities of organic food and stronger willingness to pay the premium price. This was confirmed by the research study by Zámková, Prokop and Stolín [
25] who analysed factors influencing consumers who bought organic food and concluded that the price was no longer the single most important factor. In addition, the Slovak market is signalling the same shift, according to Kádeková et al. [
26], whose research paper suggested that the key factor for organic food purchase is its quality and the information that the food is pesticide-free; the price was found to be the next most important thing. In addition, Hidalgo-Baz, Martos-Partal and González-Benito [
27] consider the product quality to be the key factor on the Spanish market, while, in Serbia [
28], a choice oriented toward organic food is determined by its price and quality (also related to the socio-economic characteristics of consumers), concluding that the producers’ marketing should predominantly target consumers who are already “more environmentally and health-conscious”.
The importance of food price on the German market was discussed by Aschemann-Witzel and Zielke [
29], who concluded that consumers who buy organic food regularly have lower price sensitivity than occasional “green” shoppers. In addition, as suggested by Rödiger, Plaßmann and Hamm [
30], it is relevant to consider the fact that respondents usually struggle to estimate a product’s real price range. They were usually willing to pay about 50% above the store prices. In two thirds of the cases, respondents bought a product even though the store price was higher than the price they originally stated they were willing to pay. Overall, this research study proved that consumers were quite willing to spend more money on organic food. Kim, Lusk and Brorsen [
17], in their study, showed that a respondent was much more willing to pay the higher price for organic produce, if he/she had the chance to tell someone else about the purchase. Apparently, social pressure is a major influencing factor.
Janssen and Hamm [
6] focused their research study on the effect of the EU organic food logo and the results suggest that, while the logo was generally well perceived, the confidence in strict production standards and an efficient control system remained low. Von Meyer-Höfer, Nitzko and Spiller [
31] came to the conclusion that, despite 20-odd years of strict regulations, consumers still do not seem to know what to expect from labelled organic food. Zámková and Prokop [
32] addressed the issue of organic labelling recognition among consumers in the Czech Republic and came to similar conclusions; the authors’ later research study [
25], focused on the Czech and Slovak markets, also revealed rather strong scepticism about the benefits of organic food. Golob, Kos Koklic, Podnar and Zabkar [
33] addressed the issue and, by using structural equation modelling, they tested the relationships between environmentally conscious purchase behaviour and green scepticism in organic food consumption. Other authors [
34,
35,
36] have focused their research on the impact of the retailers’ offering of organic food on consumers’ behaviour. When exploring the Slovak market, Predanocyová, Šedík, Kubicová and Horská [
37] found that organic products were offered by most local retailers, with milk and dairy products, and baked goods being the most popular. The assortment of organic food in stores today is in line with the customer demand and their favourite products. When looking for organic food, people usually go to specialized stores, supermarkets and malls. Once they arrive there, their decision-making is based mainly on the perceived food quality and the food origin. In the Czech Republic, customers apparently prefer big stores (malls, supermarkets) as opposed to small ones [
32]. Slovak consumers prefer to buy organic food in specialized shops or directly from the producer. Large chain stores (supermarkets, malls) are the second favourite shopping option, followed by farmers’ markets [
26].
Organic farming represents an alternative to the classic intensive production and it is becoming more popular among the consumers as the environmental issues are more highlighted. However, it can be an alternative also for the producers, especially under the changing climate conditions [
38,
39]. This can be important for countries relying on agricultural production, where organic production can offer higher added value [
40]. Gebeltova et al. [
41] found the classic crop mix to be problematic in terms of soil quality in the Czech Republic. The growing market with organic products can offer an alternative to ensure farmers’ competitiveness [
42].
Food producers, farmers and marketers need to study the ever-changing determinants of the consumers’ attitudes towards organic food purchases to be able to adapt their marketing strategies [
43]. The aim of this article is to identify the shifts in opinions and attitudes of Czech consumers associated with organic food and their shopping behaviour, by analysing the difference between data obtained by research conducted in the years 2016 and 2019. The insights from this study may suggest useful marketing implications for organic agriculture producers, provide data for better understanding of their customers and therefore play a role in improving the consumption of organic agricultural products and food in the Czech Republic. We also believe that our findings could potentially apply to other countries with a similar socio-economic level.
2. Materials and Methods
More than 2500 respondents were subject to a marketing research investigation; the majority consisted of young Czech citizens. The survey took place two times—first in 2016, then in 2019. The results from both years were compared using the contingency tables analysis, correspondence analysis and logistic regression. The 2016 and 2019 samples of respondents are comparable since the same population groups were addressed.
The survey participants were 67% women and 33% men. It is of common knowledge that organic products are chiefly bought by women [
44,
45]. Four age categories were selected: respondents under 30 years (68%), respondents of 31–45 years (14%), respondents of 46–60 years (10%) and respondents above 61 years of age (8%). We mainly focused on young people, as they will represent the main customer segment in the future (see [
46,
47,
48]). At the same time, all settlement sizes were evenly covered. What was also recorded was the respondents’ household monthly income, divided, again, into four categories: below CZK 20,000 (18%), CZK 20–40 thousand (20%), CZK 40–60 thousand (25%) and CZK 60,001 and above (37%). Furthermore, the representativeness of the sample is guaranteed by the size of the sample involving respondents in all the categories followed—gender, age and household income.
In the questionnaire survey analysis, we usually obtain categorical data and the easy way to illustrate data relations are contingency tables. With respect to the character of the data, we used suitable tests of independence. According to Řezanková [
49], in the case of the contingency table of the type
r ×
c (
r is the number of rows and
c is the number of columns), we usually use statistics:
Alternatively,
where
eij is an expected frequency and
nij real frequency. We used the statistic
in the Pearson chi-square test and
in the likelihood-ratio test. These two statistics have asymptotically
distribution with the presumption of independence [
50].
The aforementioned tests can be used in the case of high expected frequencies in the contingency table (more than 5 for each field) (see Hendl [
51]). In some studies, this rule is not so strict, as it is enough to have at most 20% of frequencies less than 5, but all of them more than 1 (see Agresti [
52]). According to Anděl [
53], if the frequencies are too small, we can use Fisher´s exact test or we can calculate the simulated
p-value of the
statistic.
A correspondence analysis was used to evaluate the survey of employees of two organisations in Slovakia and two organisations in the Czech Republic. Using a graphical technique, this method allows us to analyse the relationship between the categories of one or more variables in the contingency tables. In a correspondence analysis, we study the relationships between different categories of two categorial variables. The outcome of the analysis is a correspondence map representing the axes of a reduced coordinate system graphically depicting the different categories of both variables. The tools of this method can be used to describe the associations of nominal and ordinal variables and to obtain a graphic representation of the correlations in a multi-dimensional space. The aim of this analysis is to reduce the multi-dimensional space of the vectors of row and column profiles whilst retaining maximum information contained in the original data [
54]. Each row and column of the correspondence table can be displayed in a
c-dimensional or
r-dimensional space, respectively, with coordinates corresponding to the values of the respective profiles. The distance between the individual points is defined as chi-square distance. The distance between the
i-th and
i’-th row is expressed by the following formula:
where
rij are elements of the matrix of row profiles R, with weights
cj corresponding to the elements of the vector of column masses c
T, which, at the same time, is equal to the average column profile, i.e., the centroid or the centre of the column profiles in multi-dimensional space. An analogous definition applies to the distance between the columns
j and
j’, where the weights correspond to the elements of the vector of row masses r; we then add up all the rows.
In a binary logistic regression, the explained variable Y is dichotomous, with two values, 1 and 0, representing A occurring or not occurring, respectively. The probability of A occurring is
p =
P(
Y = 1). The probability of A occurring under the specific conditions
X is
p(
X) =
P(
Y = 1|
X), which is equivalent to the mean value
E(
Y|
X), at the same time. The odds are defined as the probability ratio of A occurring or not occurring, i.e., odds =
p/(1 −
p). The logarithm of the odds (logit), defined as logit = ln(
p/(1 −
p)), is a linear function of conditions given by
X, with the searched parameters being marked as
b. The probability of A occurring, the odds and logit are defined as follows:
The regression model parameters are estimated using maximum likelihood. The Wald test is used to test the significance of the regression coefficients. The model quality is assessed using, e.g., the chi-square goodness-of-fit test (see [
55]).
3. Results
In the opening question of our survey, we asked the respondents about the decisive factors that play the key role in their decision-making process when shopping for organic food. Suggested factors included quality, price, visual aspect, accessibility and place of origin. See the results (for 2016) in
Table 1 and the correspondence map in
Figure 1 (left). The respondents most frequently opted for definitely yes, or rather yes, when contemplating the importance of the quality and price of organic produce in 2016, meaning that quality and price of organic food was high on their list of priorities. This also applied to the visual aspect and availability of organic food. On the other hand, brands and places of origin seemed to be of lesser importance (
p-value is less than 0.001, chi-square = 2082.67, degrees of freedom = 20).
Table 1 and
Figure 1 (right) reflect the situation as recorded in 2019. They both confirm the fact that, in 2019, the quality of purchased organic goods was the most important decisive factor, followed by price, visual aspect and availability of organic food. The respondents claim (in 2019, as well as in 2016) that brands and places of origin were not that important (
p-value is less than 0.001, chi-square = 1801.21, degrees of freedom = 20.)
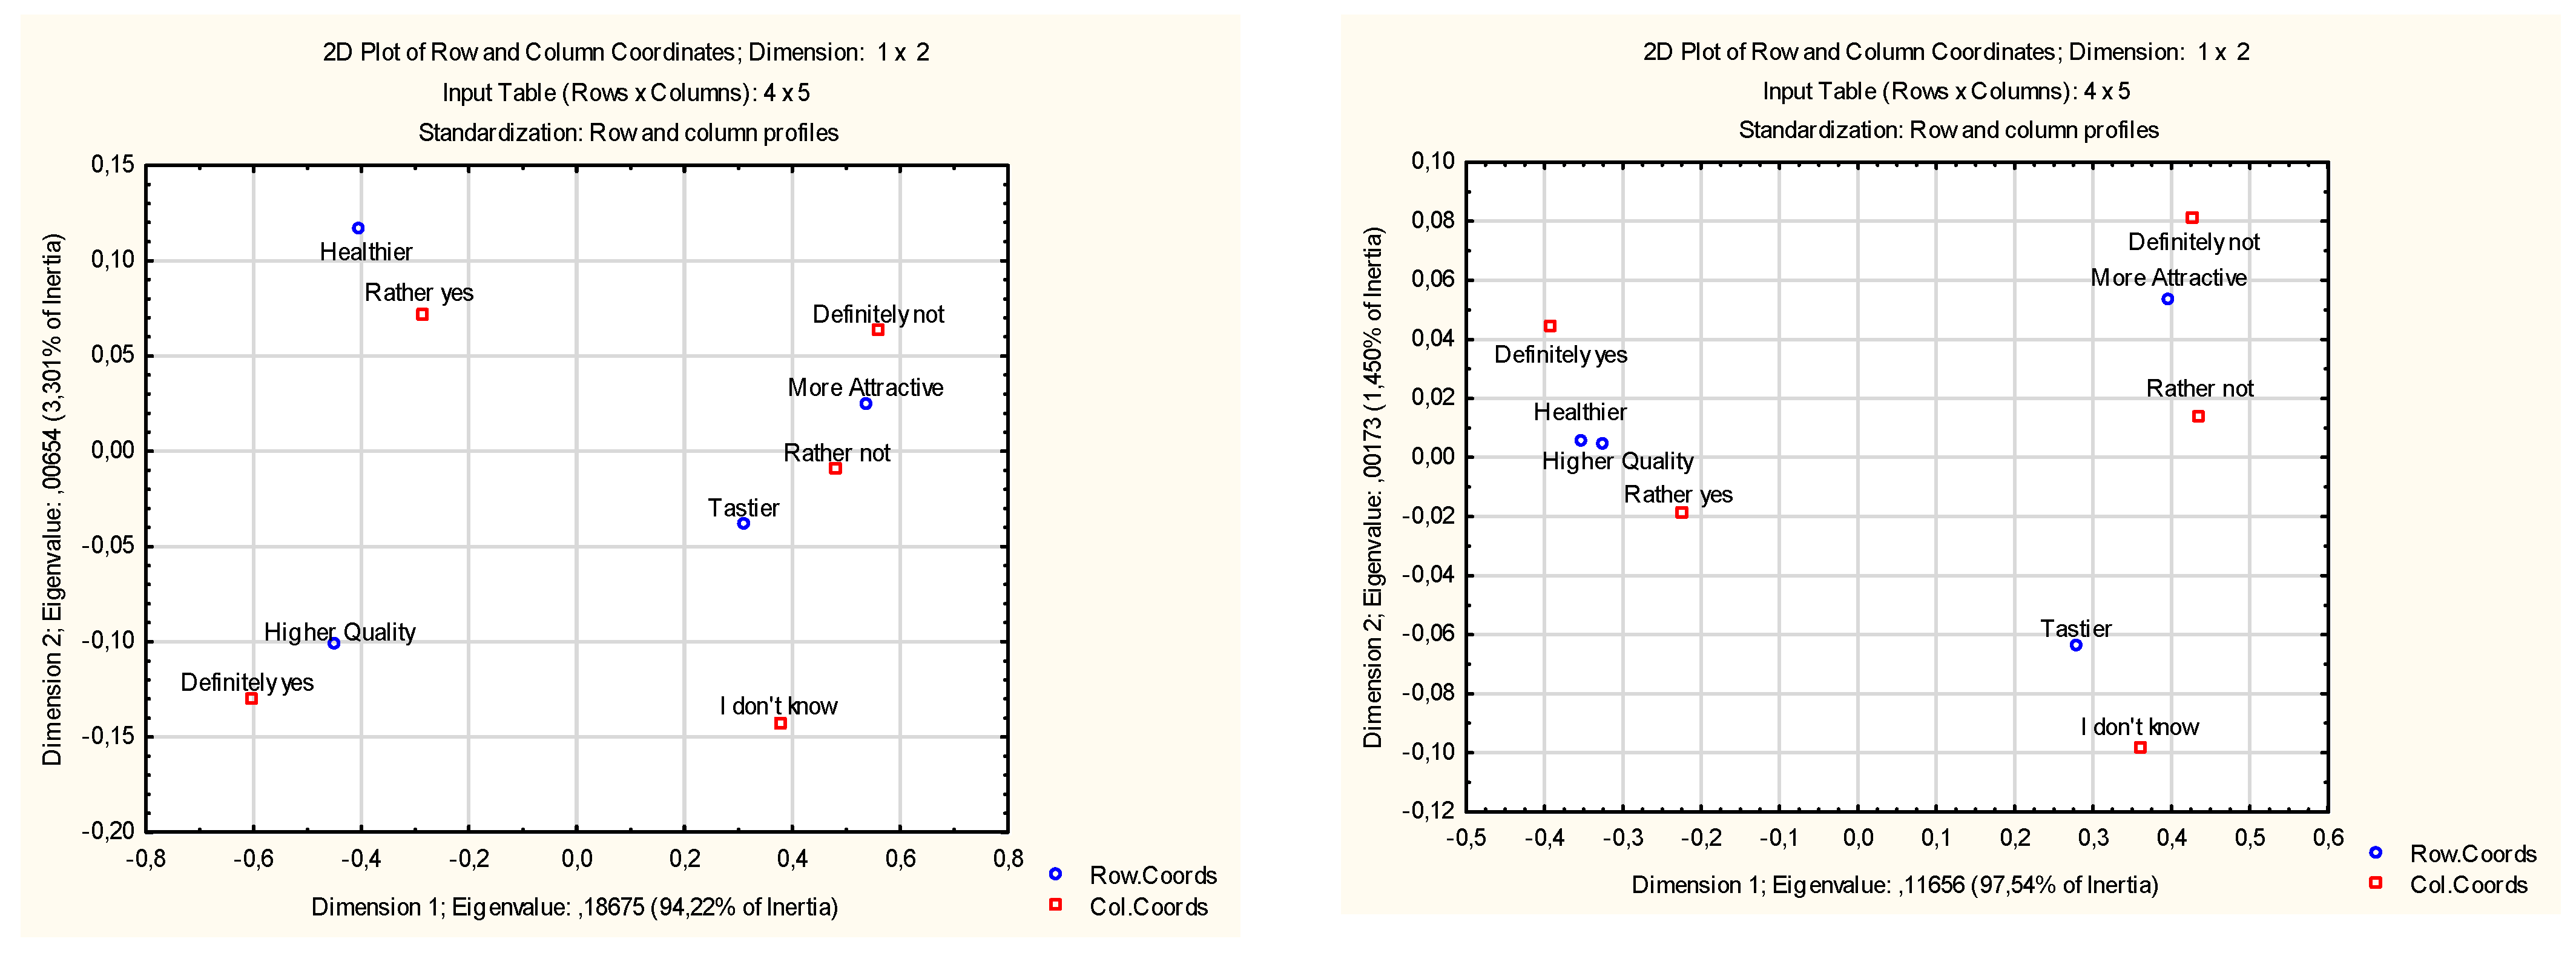
In another part of the survey, the respondents were asked, if they found (believe) organic food to be healthier, tastier, more attractive, or of higher quality. See the results for 2016 in
Table 2 and
Figure 2 (left). The table and the correspondence map confirm that respondents in 2016 were convinced of the superior quality of organic food, as well as its more significant health benefits (compared to non-organic food). Please note the fact that the participants did not find organic food to be more attractive or tastier (
p-value is less than 0.001, chi-square = 964.88, degrees of freedom = 12).
Table 2 and
Figure 2 (right) describe the situation in 2019. According to the survey, organic food in 2019 was considered healthier, as well as of higher quality than conventional food, while not more attractive; see the table and the correspondence map (
p-value is less than 0.001, chi-square = 572.13, degrees of freedom = 12).
The survey revealed a positive shift in organic food popularity, see
Table 3. The proportion of respondents who never bought organic food plunged to half of its original level. However, we recorded an increase in the number of respondents who did not care whether it was organic or not. Significant statistical dependence was proven (
p-value is less than 0.001, chi-square = 88.02, degrees of freedom = 3).
The respondents were then asked what kinds of organic food they bought the most; see
Table 4 and
Figure 3. In 2019, organic fruits and vegetables were more popular than in 2016 and the same was noted for organic meat and meat products. “Other” organic products (non-alcoholic drinks and processed food) were part of a similar trend. The year 2019 saw a decline (compared to 2016) in purchases of baked goods and confectionery products.
When it comes to the frequency of organic food shopping, we observed a striking positive trend; the proportion of respondents who did not buy it at all decreased by more than a half, while the rest of the categories saw an increase, sometimes even a substantial one (several times a month); see
Table 5 (
p-value is less than 0.001, chi-square = 83.04, degrees of freedom = 6).
The survey also revealed how much households spent monthly on organic food. In
Table 6, the numbers for 2016 are divided based on different genders. That year, women purchased organic food most often for under EUR 20, while men most frequently answered that they did not buy organic food at all. In 2019 (
Table 6), women would oftentimes buy organic food for EUR 4–20 and so would men. However, note that, in 2019, it was men who purchased organic food for over EUR 80 more often.
Now, let us look at different age categories and their spending tendencies. See the results for 2016 in the correspondence map—
Figure 4 (left)—and
Table 7. Younger survey participants would not buy organic food in 2016 or spend under EUR 20 for it. People in the age category of 31–45 would spend a similar amount. Older respondents would spend less than EUR 40, not more (
p-value is less than 0.001, chi-square = 59.70, degrees of freedom = 18).
See the results for 2019 in the correspondence map—
Figure 4 (right)—and
Table 7. Apparently, survey participants younger than 30 would not buy organic food often in 2019, or spent under EUR 4 for it. The numbers for 2019 clearly suggest that the older the person, the higher the amount of money they were willing to pay for organic food (
p-value is less than 0.001, chi-square = 170.01, degrees of freedom = 18).
The income of a household is yet another important factor to bear in mind when observing organic food shopping preferences. See the data from 2016 in the correspondence map in
Figure 5 (left) and
Table 8. Clearly, in 2016, households with income under EUR 1600 would not usually buy organic food at all or spend less than EUR 20. Only households with higher incomes would spend more for organic food (
p-value is less than 0.001, chi-square = 59.49, degrees of freedom = 18).
See the results for 2019 in
Table 8 and
Figure 5 (right). The year of 2019 marks a trend—the higher the household income, the higher the amount of money spent on organic food (
p-value is less than 0.001, chi-square = 94.86, degrees of freedom = 18).
A binary logistic regression was used to assess the level of influence of explanatory variables on whether the respondents buy organic food. The explanatory variables were the following: gender, age and household income. Women were represented by 0, men by 1 and the remaining variables by a growing scale of 1, 2, 3, etc. The respondents were only divided into two categories, those buying (1) or not buying (0) organic food.
Table 9 shows, for both years, that organic products were more often bought by women, older people and higher-income respondents. In 2016, statistically significant dependency on the respondents’ age was established; see
Table 9. In 2019, statistically significant dependency on all the categories analysed was established (gender, age and income); see
Table 9. The regression coefficient values show that the age of respondents had the greatest influence on the purchase of organic products, with gender being slightly less influential and household income being the least influential of the three. Both models are statistically significant; see
Table 9 (
p-value < 0.001). At the same time, the fact that the model corresponds to the data cannot be dismissed; see again
Table 9 (
p-value = 1).
4. Discussion
Research data show that there has been a positive shift in consumer shopping preferences of organic products between the years 2016 and 2019 in the Czech Republic. Price, once the most important factor of them all, was found to be taking a back seat as consumers started to go for higher quality and to value the health benefits of organic food. The shopping behaviour of Czech customers seems to be aligning with attitudes common in Germany, which is the leading country of organic agriculture and food production from the western countries in Europe [
29].
Further, the analysis of the data discovered the ongoing insufficiency of organic food promotion—this is a challenge ready for marketing experts to tackle. First of all, they must target modern media, because young consumers do not keep track of traditional media outlets anymore (newspapers, magazines, billboards, etc.). Visible promotion on social media and on the Internet, in general, is the best way to approach consumers who use mobile devices (phones, tablets, etc.). Such promotion has the potential to convince the consumers of the real benefits of organic food, since research has shown that many of them still doubt its added value (the absence of chemical additives, benefits for the environment and so on).
These research data show an increased inclination towards local products in general; this confirms the findings obtained by Thogersen et al. [
56], who noted that the country and place (such as countryside) of origin was more important when it came to purchases of products in compliance with quality standards than of conventional products. In addition, Jensen et al. [
23] discovered the perception of various benefits (taste, safety, animal welfare and environmentally friendly production) of local organic agricultural produce and their benefits for small farmers in the countryside.
Azzurra, Massimiliano and Angela [
57] discovered that consumers with high organic consumption intensity show a higher level of sustainability concern in their general food choices and have a more sustainable lifestyle. According to their research study, concerns over food safety, female gender and young age are among other strong predictors of organic consumption intensity. In addition, in other countries, outside of Europe as well, our research conclusions are confirmed, i.e., the research study conducted by Zhang et al. [
36] in the second largest world economy—China—the safety, highly regulated production and environmentally friendly character proved to be the most important factors. Two-thirds of respondents recognized organic vegetable from the certifications listed on the packaging and the same amount of people was willing to buy organic vegetables for a higher price. The list of positive factors also included household income, safety awareness, trust in the brand, packaging and the possibility of on-line shopping. This fashionable solution has not been analysed in the Czech Republic so far and it could be worth further research. For example, reasons for the limited development of the organic food market in Poland involve mainly the high price and consumers’ ignorance about its labelling [
4], whereas our study confirmed that organic food prices were becoming less and less important. A possible way to improve is, e.g., education and connection of organic farming with activities such as agritourism, etc. [
58,
59].
Organic products, as well as regional and locally produced food, are experiencing an increasing success among consumers in the EU, being as perceived as authentic high-quality food products [
1,
3]. From the perspective of organic food producers, an understanding of consumer perceptions, set within search, experience and credence attributes [
60], represents a potential that can be used to connect with customers and gain a competitive advantage. Our analysis aimed to identify the shifts in the attitudes and buying preferences of the Czech consumers towards organic food, using the data obtained by surveys administered in 2016 and 2019.
Generally, the vast majority of respondents took quality into consideration when buying food. The price did not constitute an important factor as it used to at the beginning of the century [
24]. The importance of the brand, availability and place of origin is on the rise. As for organic food, more and more respondents tended to think that it is tastier and more attractive. The number of respondents believing in its healthier nature increased moderately. Approximately 75% of respondents claimed that organic food was of higher quality than conventional products [
24].
In the EU, there is broad consensus on the key role of organic production and consumption on rural development; European consumers endorse sustainable farming and food production and public awareness of the EU organic logo has increased markedly, as suggested by Eurobarometer special report 504 [
61].
Our research study suggests that, when comparing 2016 and 2019 data, there were more respondents in 2019 who claimed that they could buy organic food in their favorite grocery store and who found it sufficiently recognizable, which is a positive trend; at the same time, the number of respondents who never looked for organic food dropped. The proportion of respondents who never bought organic food plunged to half of its original level. On one hand, we saw a significant decline in the number of respondents who did not spend anything or only a negligible amount on organic food. On the other hand, there were more and more respondents who spent quite considerable amounts of money on organic food. More and more people also tended to shop for organic food in large stores. There were fewer people growing their own. The share of regional production sold in local stores was growing, according to our respondents. It is also encouraging to find out that there were fewer respondents not interested in the origin of food.
On the negative side, we confirmed an increase in the number of respondents who believed that organic food was underpromoted and of respondents who did not care whether their purchase was organic or not. A detailed analysis of consumer behavior associated with advertising campaigns revealed that there were fewer respondents who noticed organic food ads in traditional media outlets (newspapers and magazines, etc.). However, we identified a boom in digital advertising. At the same time, the number of respondents who had never seen a food product ad also increased. The respondents who allegedly never bought organic products indicated several reasons why. To conclude, the years 2016 and 2019 saw a drop in the number of respondents who never thought of buying organic products, who did not trust the food is non-chemical, who did not know where to buy organic food, who struggled to find enough information about it, who felt the assortment is limited, who claimed organic food is not attractive enough and who said that organic food is too expensive. The only identified increase concerns the respondents who considered organic food to be an unnecessary luxury.
Furthermore, the logistic regression shows that, overall, the purchase of organic products was mostly influenced by the age of the respondents, followed by their gender, with household income being the least influential factor in this respect.
5. Conclusions
This research study shows a favourable change in the popularity of organic food in the Czech Republic as well. The proportion of respondents who never bought organic food decreased to half of the original number; in 2016, about 40% of respondents never bought organic food, whereas, in 2019, it was only about 20% of respondents. In 2016, the decisive factors in buying organic food were mainly its price and quality. Among important factors, the respondents also included appearance and availability of organic food. The research results also show that, in 2019, the most important factor in buying organic food was quality, according to the respondents. Among less important aspects, there was price, appearance and availability of organic food. Furthermore, this research study shows that, in 2016, the respondents believed that organic food was primarily superior in quality and healthier than conventional food. Interestingly, these respondents did not feel that organic food was more attractive or tastier than conventional food. The 2019 results imply that the respondents primarily considered organic food as healthier than conventional food. Compared to 2016, in 2019, people more frequently bought organic fruits, vegetables, meat and meat products. This was also true for organic food in the categories of non-alcoholic beverages and delicatessen. As for shopping frequency, we can say that, in 2019, the respondents bought organic food more frequently than in 2016 in all the relevant categories. It is further evident that, in 2016, women most often bought organic food for less than EUR 20 and, often, men did not buy any organic food at all. The 2019 results show that both men and women mostly bought organic food for about EUR 20. In 2016, younger respondents did not buy organic food or spent less than EUR 20 on it. Older respondents spent a maximum of EUR 40 on organic food. In 2019, younger respondents under 30 years of age did not buy organic food or spent less than EUR 40 on it. Furthermore, it is evident that, with the increase in the age of the respondent, the amount spent on organic food also grew, in 2019. The research results also show a correlation between household income and amount spent on organic food. The 2016 results show that respondents with an income of less than EUR 1600 did not usually buy organic food or spent less than EUR 20 on it. Higher income households spent more on organic food. The 2019 results indicate that, with the increase in the income, the amount spent on organic food also grew. The research results also show that the main target groups for organic food products were women, older respondents and consumers with the highest household income.
Implications for practice: Keeping in mind the results of this research study, we suggest that organic producers and retailers segment and target their customers carefully, bearing in mind the changes in customers’ attitudes. In addition, it is necessary to come up with strategically oriented marketing campaigns (preferably in retail outlets) where communication with the customers should be continuous and focused on a selected target group. In addition, we believe that the campaign within schools focused on organic production and backed by the government could have a long-term influence on the Czech market, improving the ongoing insufficiency of organic food promotion identified by this research study.
Limitations of the research study and future focus: The main limitation of this study is, for instance, the fact that the authors abstract the division of shopping behavior related to organic agricultural products for altruistic reasons, such as, for instance, Pilař et al. [
9]. This division is yet another interesting aspect mainly for creating specific marketing campaigns, which are not, however, the subject of this article and would be suitable for a marketing study, for instance, for label coordinators. The authors of this article are willing to cooperate on such studies with the respective stakeholders. Another limitation of this study is due to the COVID-19 pandemic. However, the authors also see this as an opportunity, since future research related to this topic, planned to start in 2021, would hopefully show the impact of COVID 19 pandemic on respondents’ opinions, as it is clearly predictable that not only people from the Czech Republic have been strongly focused on their health and have been searching for means to improve it. Organic food may have been one of the ways to do so.


 ,
, 


