Allelopathic Impact of Cover Crop Species on Soybean and Goosegrass Seedling Germination and Early Growth


Abstract
1. Introduction
2. Materials and Methods
2.1. Cover Crop Species and Harvesting Samples
2.2. Extract Preparation
2.3. Experiment I
2.3.1. Culture and Seed Bioassay
2.3.2. Data Collection
2.4. Experiment II
2.4.1. Plant Material and Cover Crop Extract Application in the Greenhouse
2.4.2. Data Collection
2.5. Statistical Analysis
2.5.1. Experiment I
2.5.2. Experiment II
3. Results
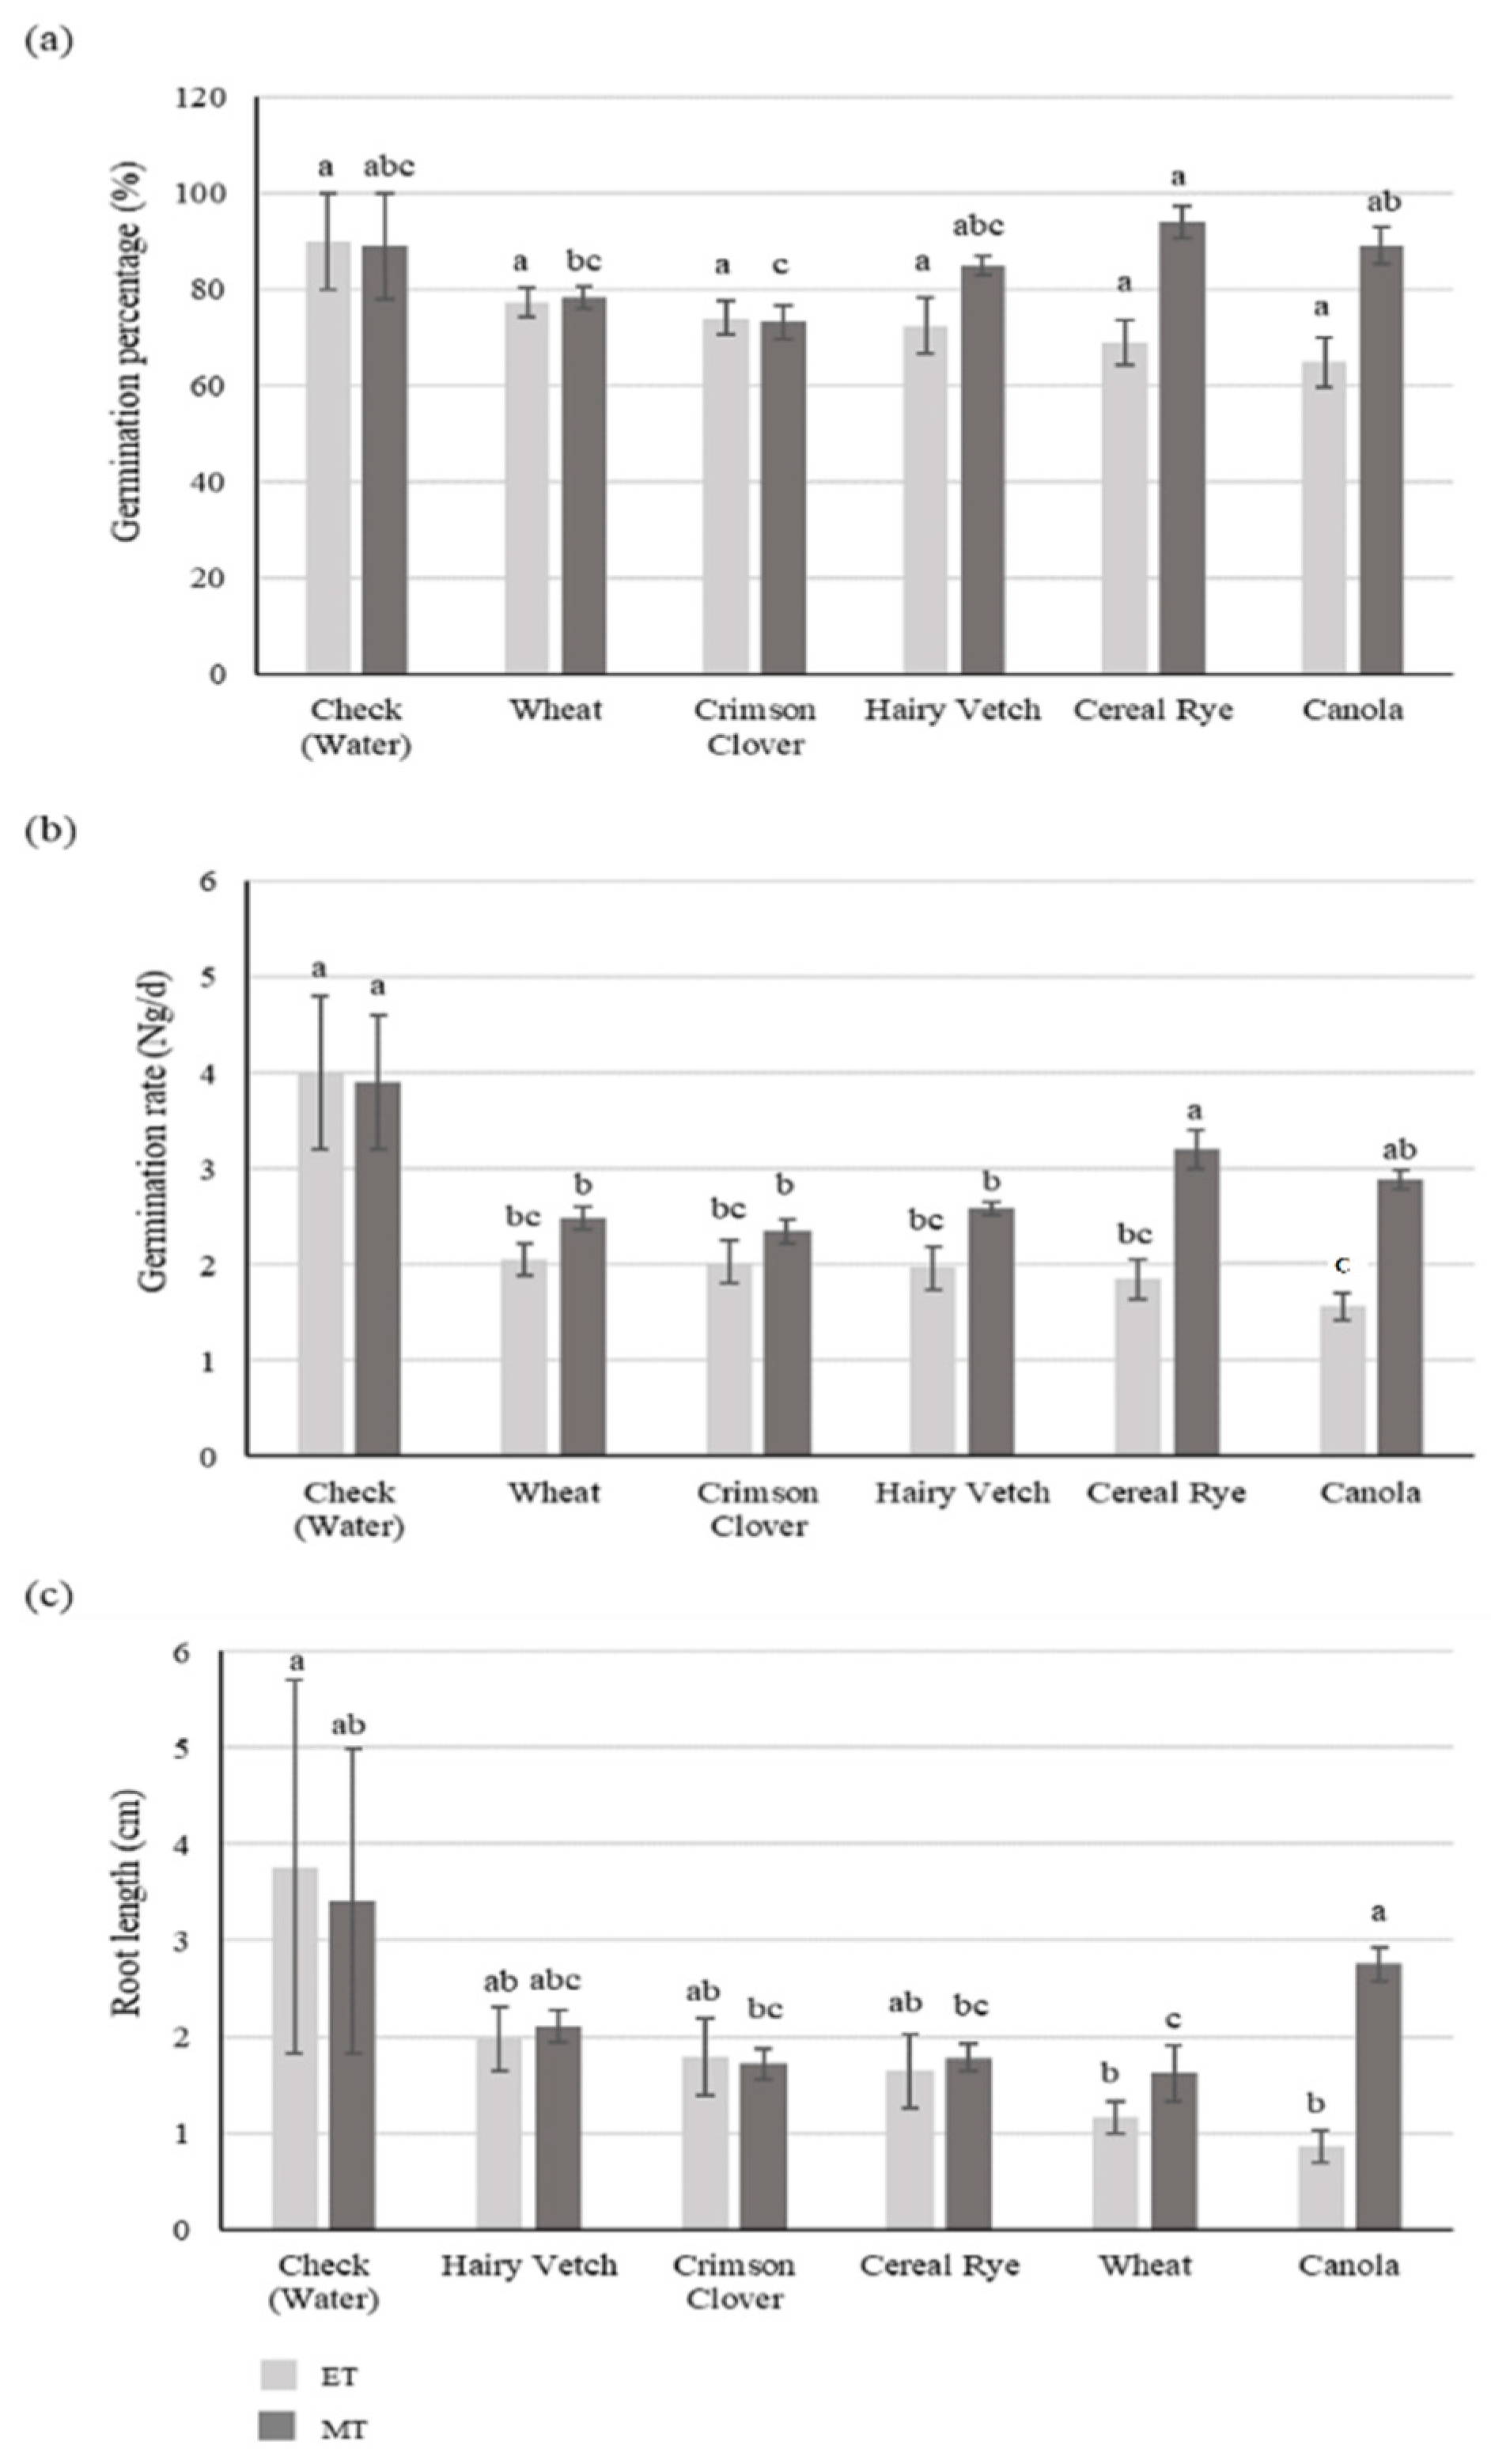
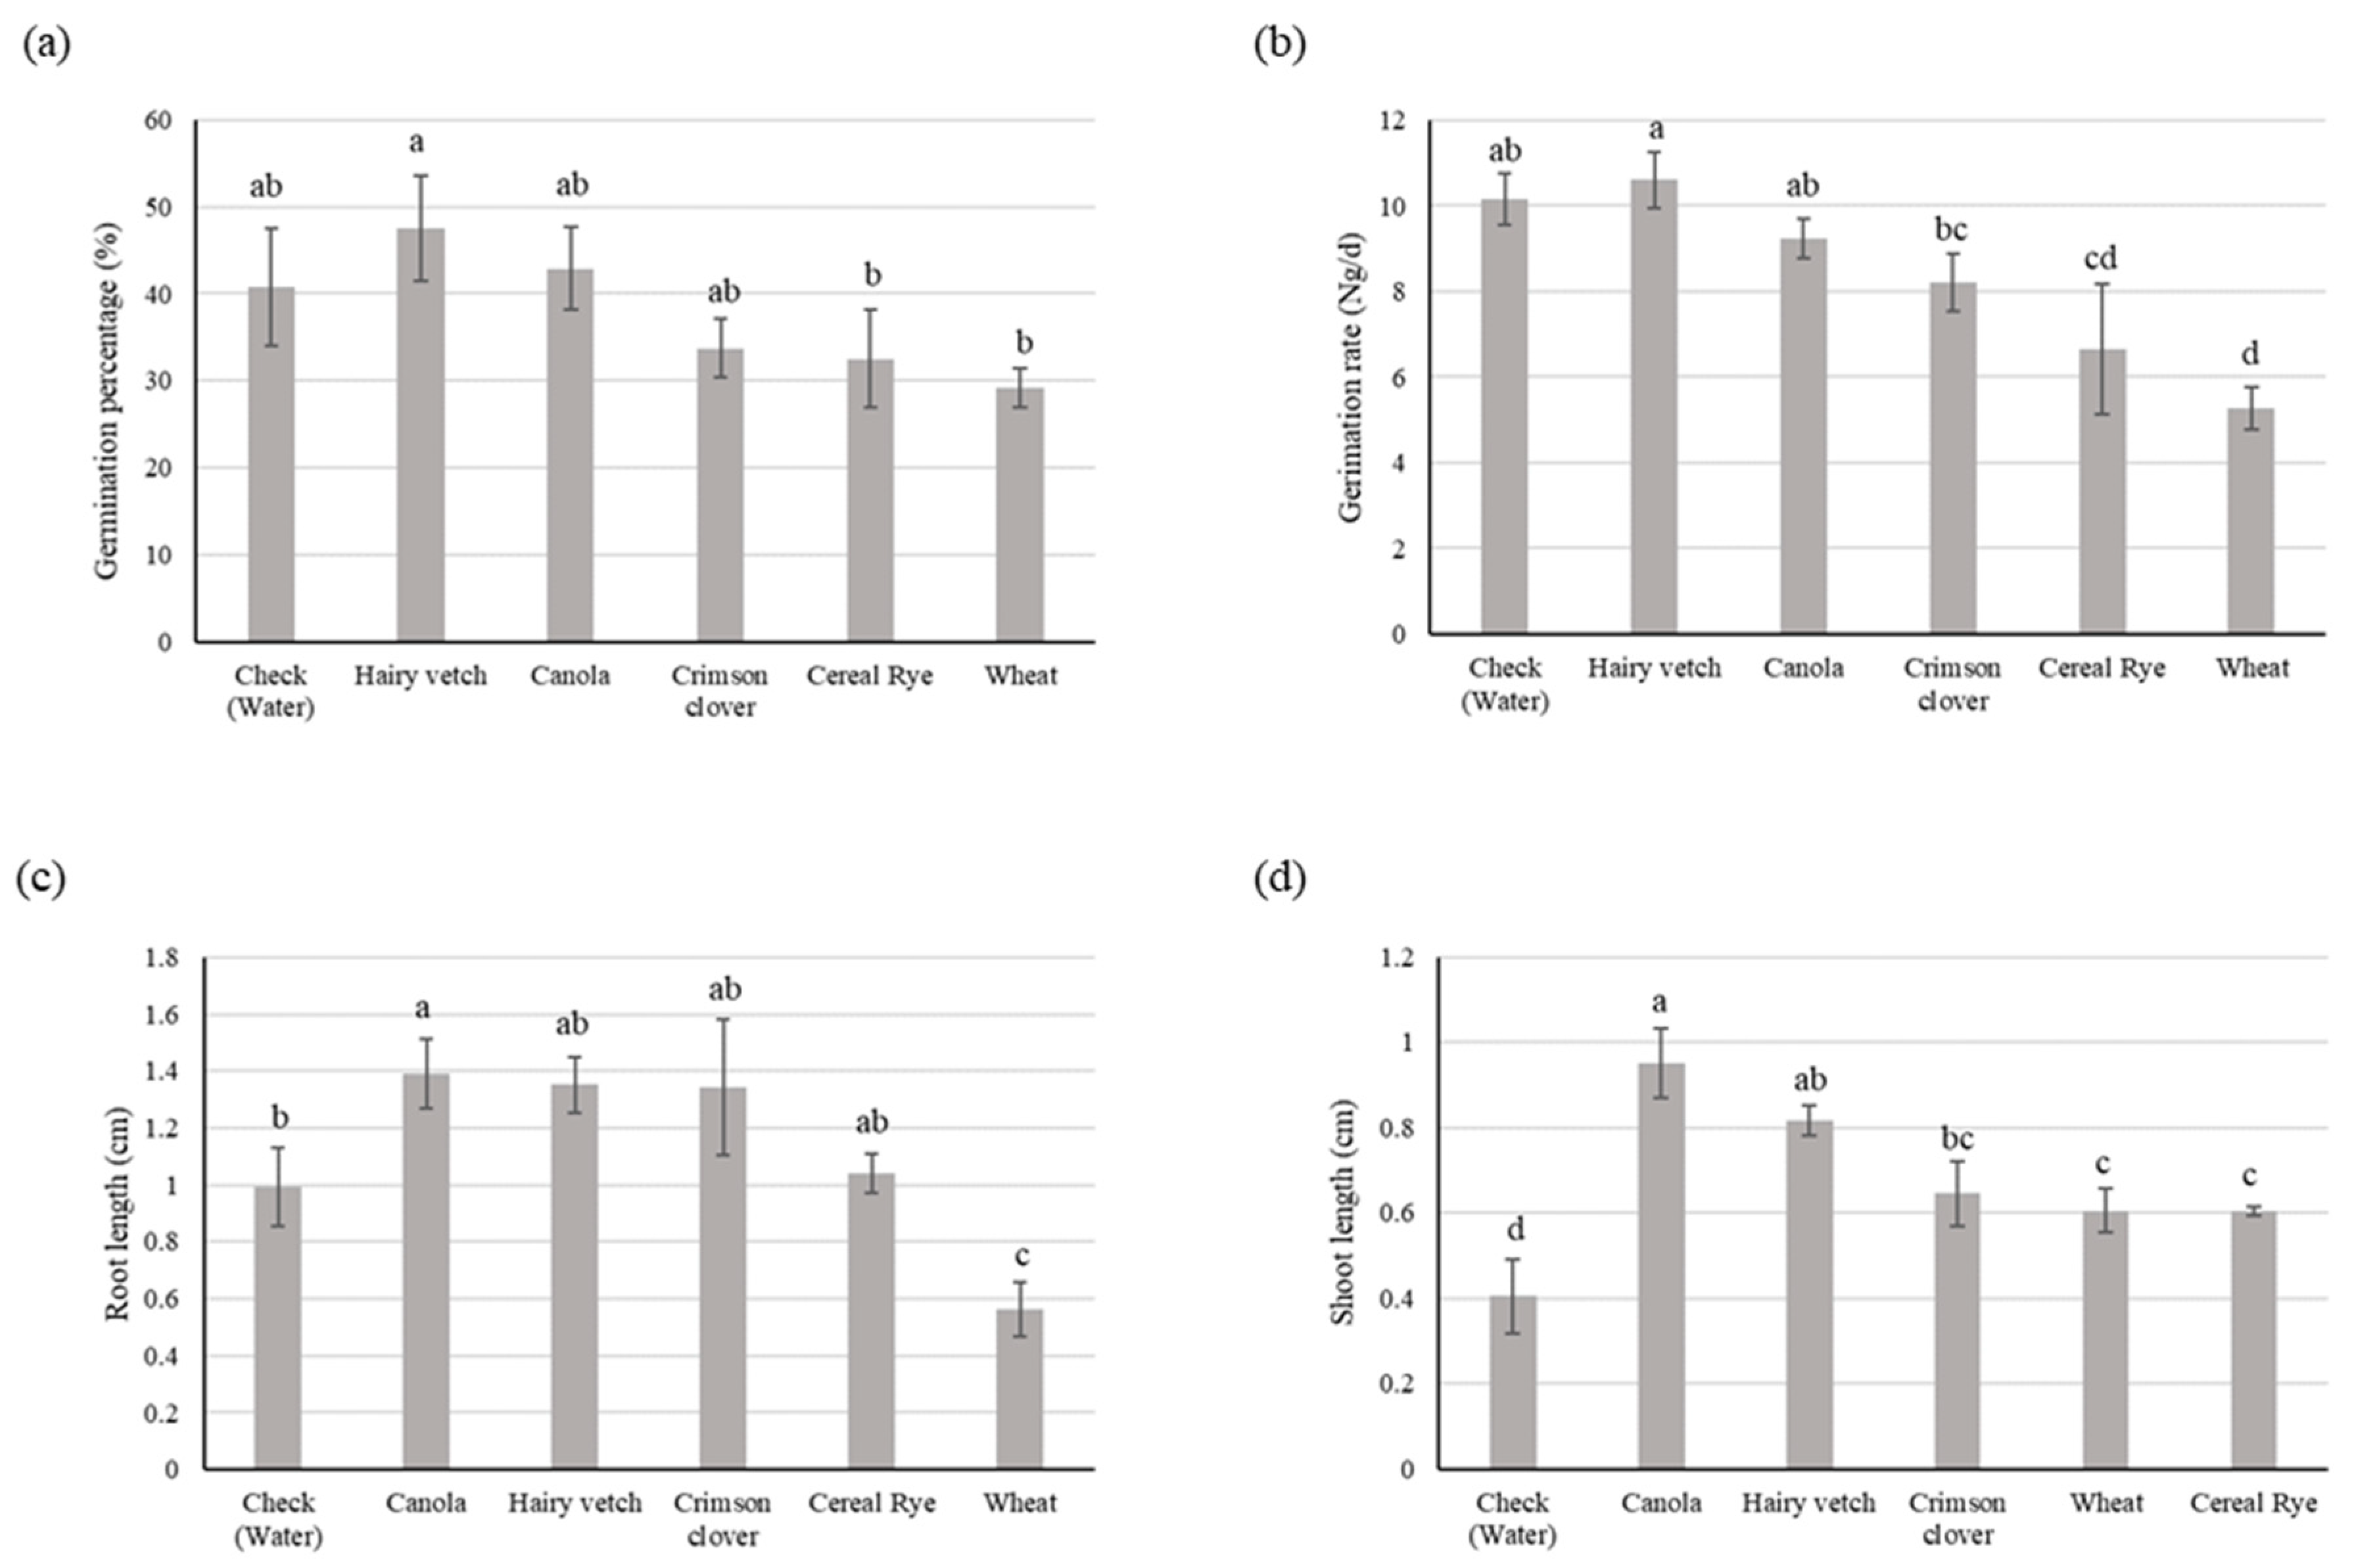
3.1. Experiment I
3.1.1. Soybean
3.1.2. Goosegrass
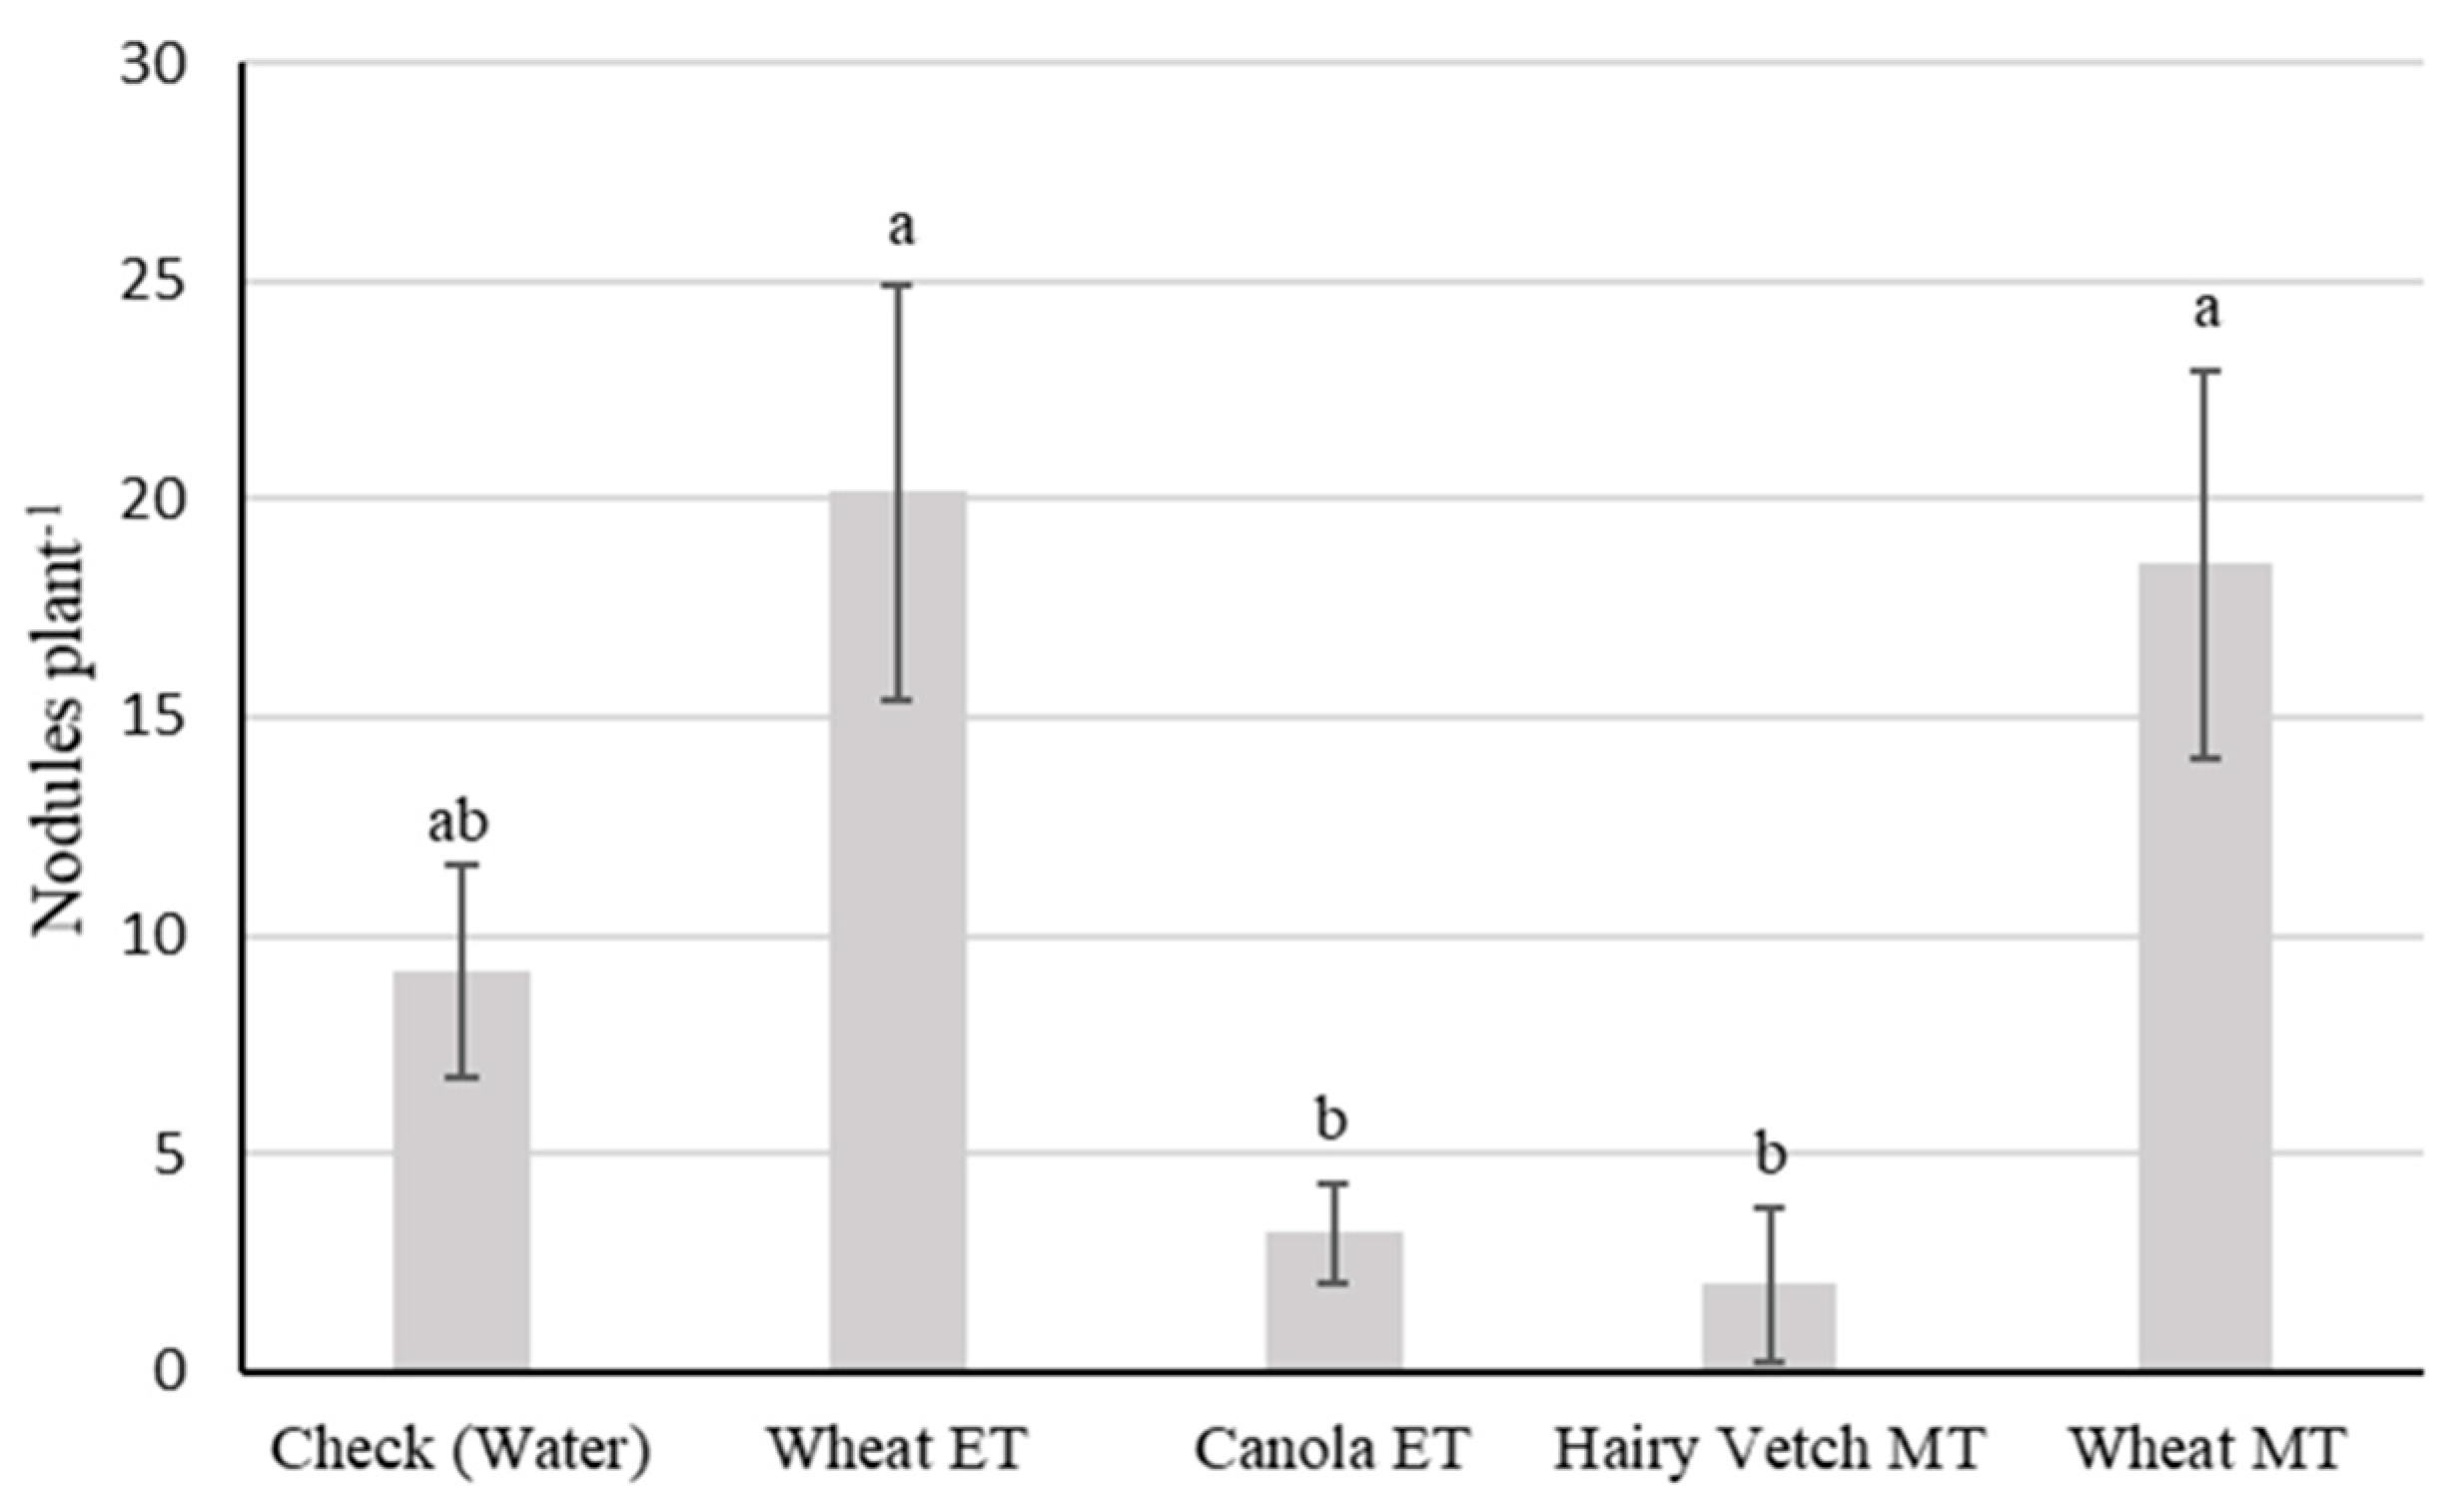
3.2. Experiment II
4. Discussion
Author Contributions
Funding
Institutional Review Board Statement
Informed Consent Statement
Data Availability Statement
Acknowledgments
Conflicts of Interest
Abbreviations
Appendix A

| Time Period | |||||||
|---|---|---|---|---|---|---|---|
| Cover Crop Extract | 20 DAP | ||||||
| SPAD | Hairy Vetch ET | 43.5 | ± | 1.0 | |||
| Wheat ET | 36.7 | ± | 1.5 | ||||
| Canola ET | 40.6 | ± | 1.9 | ||||
| Hairy Vetch MT | 40.0 | ± | 2.5 | ||||
| Wheat MT | 33.9 | ± | 2.1 | ||||
| Canola MT | 41.0 | ± | 1.0 | ||||
| Check (Water) | 37.8 | ± | 1.7 | ||||
| 22 DAP | 26 DAP | ||||||
| Hairy Vetch ET * | 2.7 | ± | 0.1 | - | ± | - | |
| Stem diameter | Wheat ET | 2.7 | ± | 0.1 | 2.7 | ± | 0.05 |
| Canola ET | 2.3 | ± | 0.1 | 2.5 | ± | 0.08 | |
| Hairy Vetch MT | 2.6 | ± | 0.1 | 2.7 | ± | 0.19 | |
| Wheat MT | 2.4 | ± | 0.1 | 2.6 | ± | 0.07 | |
| Canola MT * | 2.2 | ± | 0.1 | - | ± | - | |
| Check (Water) | 2.2 | ± | 0.1 | 2.4 | ± | 0.10 | |
| 26 DAP | |||||||
| Biomass | Hairy Vetch ET * | 1.2 | ± | 0.2 | |||
| Wheat ET | 1.1 | ± | 0.1 | ||||
| Canola ET | 1.4 | ± | 0.1 | ||||
| Hairy Vetch MT | 1.5 | ± | 0.2 | ||||
| Wheat MT | 1.0 | ± | 0.1 | ||||
| Canola MT * | 0.7 | ± | 0.1 | ||||
| Check (Water) | 1.0 | ± | 0.1 | ||||
| 22 DAP | 26 DAP | ||||||
| Root length | Hairy Vetch ET * | 25.8 | ± | 3.5 | - | ± | - |
| Wheat ET | - | ± | - | 38.9 | ± | 5.8 | |
| Canola ET | - | ± | - | 37.1 | ± | 4.3 | |
| Hairy Vetch MT | - | ± | - | 28.7 | ± | 1.3 | |
| Wheat MT | - | ± | - | 33.9 | ± | 4.1 | |
| Canola MT * | 21.6 | ± | 6.2 | - | ± | - | |
| Check (Water) | - | ± | - | 28.9 | ± | 0.7 | |
References
- Shekoofa, A.; Safikhan, S.; Raper, T.B.; Butler, S.A. Allelopathic Impacts of Cover Crop Species and Termination Timing on Cotton Germination and Seedling Growth. Agronomy 2020, 10, 638. [Google Scholar] [CrossRef]
- Wiggins, M.S.; Hayes, R.M.; Nichols, R.L.; Steckel, L.E. Cover crop and poste mergence herbicide integration for Palmer amaranth control in cotton. Weed Technol. 2017, 31, 348–355. [Google Scholar] [CrossRef]
- Montgomery, G.B.; McClure, A.J.; Hayes, R.M.; Walker, F.R.; Senseman, S.A.; Steckel, L.E. Dicamba-tolerant soybean combined cover crop to control Palmer amaranth. Weed Technol. 2018, 33, 109–115. [Google Scholar] [CrossRef]
- Scavo, A.; Abbate, C.; Mauromicale, G. Plant allelochemicals: Agronomic, nutritional and ecological relevance in the soil system. Plant Soil 2019, 442, 23–48. [Google Scholar] [CrossRef]
- Koehler-Cole, K.; Elmore, R.W.; Blanco-Canqui, H.; Francis, C.A.; Shapiro, C.A.; Proctor, C.A.; Ruis, S.J.; Heeren, D.M.; Irmak, S.; Ferguson, R.B. Cover crop productivity and subsequent soybean yield in the western Corn Belt. Agronomy 2020, 112, 2649–2663. [Google Scholar] [CrossRef]
- Koehler-Cole, K.; Everhart, S.E.; Gu, Y.; Proctor, C.A.; Marroquin-Guzman, M.; Redfearn, D.D.; Elmore, R.W. Is allelopathy from winter cover crops affecting row crops? A&EL 2020, 5, e20015. [Google Scholar] [CrossRef]
- Allen, V.G.; Brown, C.P.; Kellison, R.; Green, P.; Zilverberg, C.J.; Johnson, C.J. Integrating cotton and beef production in the Texas southern high plains: I. Water use and measures of productivity. Agronomy 2012, 104, 1625–1642. [Google Scholar] [CrossRef]
- Geddes, C.M.; Cavalieri, A.; Daayf, F.; Gulden, R.H. The allelopathic potential of hairy vetch (Vicia villosa Roth.) mulch. Am. J. Plant Sci. 2015, 6, 2651–2663. [Google Scholar] [CrossRef]
- Xuan, T.D.; Shinkichi, T.; Khanh, T.D.; Chung, I.M. Biological control of weeds and plant pathogens in paddy rice by exploiting plant allelopathy: An overview. J. Crop Prot. 2005, 24, 197–206. [Google Scholar] [CrossRef]
- Lalremsang, P.; Remlalpeka, C.; Upadhyaya, K.; Gopichand, B. Allelopathic potential of Mesua ferrea L. and Schima wallichi Reinw. ex Blume leaf extracts on seedling growth of maize (Zea mays L.). Int. J. Curr. Microbiol. 2017, 6, 2248–2255. [Google Scholar]
- Rueda-Ayala, V.; Ramos-Guerrero, L.; Vargas-Jentzsch, P.; Hernandez, B.; Hoglind, M.; Toscano, I.; Borja, D.; Goetschel, L.; Andujar, D. Allelopathic properties of Calliandra haematocephala Hassk. extracts and fractions as an alternative for weed management in quinoa and rice crops. Acta Physiol. Plant 2020, 42, 53. [Google Scholar] [CrossRef]
- Van Wychen, L. Survey of the Most Common and Troublesome Weeds in Broadleaf Crops, Fruits Vegetables in the United States and Canada. Weed Science Society of America National Weed Survey Dataset. Available online: http://wssa.net/wp-content/uploads/2018-survey-aquatic-noncrop.xlsx (accessed on 12 July 2021).
- Bates, G.; Harper, C.; McClure, A.; Raper, T.; Sykes, V. Forage Field Crop Seeding Guide for Tennessee (PB 378); Institute of Agriculture Extension, University of Tennessee: Knoxville, TN, USA, 2020. [Google Scholar]
- Pantalone, V.; Smallwood, C.; Fallen, B. Development of “Ellis” Soybean with High Soymeal Protein, Resistance to Stem Canker, Southern Root Knot Nematode, and Frogeye Leaf Spot. J. Plant Regist. 2017, 11, 250–255. [Google Scholar] [CrossRef]
- Qu, T.; Du, X.; Peng, Y.; Guo, W.; Zhao, C. Invasive species Allelopathy decreases plant growth and soil microbial activity. PLoS ONE 2021, 16, e0246685. [Google Scholar] [CrossRef]
- Blum, U.; Shafer, S.R.; Lehman, M.E. Evidence for inhibitory allelopathic interactions involving phenolic acids in field soils: Concepts vs. an experimental model. CRC Crit. Rev. Plant Sci. 1999, 18, 673–693. [Google Scholar] [CrossRef]
- Kruse, M.; Strandberg, M.; Strandberg, B. Ecological Effects of Allelopathic Plants—A Review; NERI Technical Report No. 315; National Environmental Research Institute: Silkeborg, Denmark, 2000; 66p. [Google Scholar]
- Hussain, M.I.; Danish, S.; Sánchez-Moreiras, A.M.; Vicente, Ó.; Jabran, K.; Chaudhry, U.K.; Branca, F.; Reigosa, M.J. Unraveling Sorghum Allelopathy in Agriculture: Concepts and Implications. Plants 2021, 10, 1795. [Google Scholar] [CrossRef] [PubMed]
- Bauer, P.J.; Reeves, D.W. A comparison of winter cereal species and planting dates as residue cover for cotton grown with conservation tillage. Crop Sci. 1999, 39, 1824–1830. [Google Scholar] [CrossRef]
- Reeves, D.W.; Price, A.J.; Patterson, M.G. Evaluation of three winter cereals for weed control in conservation-tillage non-transgenic cotton. Weed Technol. 2005, 19, 731–736. [Google Scholar] [CrossRef]
- Price, A.J.; Stoll, M.E.; Bergtold, J.S.; Arriaga, F.J.; Balkcom, K.S.; Kornecki, T.S.; Raper, R.L. Effect of cover crop extracts on cotton and radish radicle elongation. Commun. Biometry Crop. Sci. 2008, 3, 60–66. [Google Scholar]
- Abou Chehade, L.; Puig, C.G.; Souto, C.; Antichi, D.; Mazzoncini, M.; Pedrol, N. Rye (Secale cereale L.) and squarrose clover (Trifolium squarrosum L.) cover crops can increase their allelopathic potential for weed control when used mixed as dead mulch. (AOP). Ital. J. Agron. 2021. [Google Scholar] [CrossRef]
- Azirak, S.; Karaman, S. Allelopathic effect of some essential oils and components on germination of weed species. Acta Agric. Scand. B Soil Plant Sci. 2008, 58, 88–92. [Google Scholar] [CrossRef]
- Cordeiro, C.F.; Dos, S.; Batista, G.D.; Lopes, B.P.; Echer, F.R. Cover crop increases soybean yield cropped after degraded pasture in sandy soil. Rev. Bras. Eng. Agric. E Ambient. 2021, 25, 514. [Google Scholar] [CrossRef]
- Kobayashi, K. Factors affecting phytotoxic activity of allelochemicals in soil. Weed Biol. Manag. 2004, 4, 1–7. [Google Scholar] [CrossRef]
- Inderjit. Soil microorganisms: An important determinant of allelopathic activity. Plant Soil 2005, 274, 227–236. [Google Scholar] [CrossRef]
- Mishra, S.; Upadhyay, R.S.; Nautiyal, C.S. Unravelling the beneficial role of microbial contributors in reducing the allelopathic effects of weeds. Appl. Microbiol. Biotechnol. 2013, 97, 5659–5668. [Google Scholar] [CrossRef]
- Li, Y.P.; Feng, Y.L.; Chen, Y.J.; Tian, Y.H. Soil microbes alleviate allelopathy of invasive plants. Sci. Bull. 2015, 60, 1083–1091. [Google Scholar] [CrossRef]
- Schmidt, S. Degradation of juglone by soil bacteria. J. Chem. Ecol. 1988, 14, 1561–1571. [Google Scholar] [CrossRef] [PubMed]


| Location | pH | Phosphorus (kg·ha−1) | Potassium (kg·ha−1) | Calcium (kg·ha−1) | Magnesium (kg·ha−1) | Soil Type |
|---|---|---|---|---|---|---|
| ET | 6.3 | 82 | 111 | 1388 | 173 | Sequatchie loam (fine-loamy, siliceous, semiactive, thermic Humic Hapludult) |
| MT | 5.6 | 101 | 102 | 1960 | 214 | Maury silt loam (fine, mixed, active, mesic Typic Paleudalf) |
| Time Period | |||||||||||||||||||
|---|---|---|---|---|---|---|---|---|---|---|---|---|---|---|---|---|---|---|---|
| Cover Crop Extract | 4 DAP | 6 DAP | 8 DAP | 10 DAP | Mean | ||||||||||||||
| Germination percentage | Hairy Vetch ET | 66.7 a | ± | 16.7 | 66.7 a | ± | 16.7 | 66.7 ab | ± | 16.7 | 66.7 a | ± | 16.7 | 66.7 a | ± | 7.1 | |||
| Wheat ET | 25.0 cd | ± | 0.0 | 50.0 a | ± | 28.9 | 58.3 ab | ± | 16.7 | 50.0 a | ± | 0.0 | 45.8 bc | ± | 10.4 | ||||
| Canola ET | 50.0 abc | ± | 28.9 | 58.3 a | ± | 16.7 | 66.7 ab | ± | 16.7 | 66.7 a | ± | 16.7 | 60.4 ab | ± | 9.6 | ||||
| Hairy Vetch MT | 33.3 bcd | ± | 33.3 | 50.0 a | ± | 28.9 | 50.0 ab | ± | 28.9 | 50.0 a | ± | 28.9 | 45.8 bc | ± | 13.5 | ||||
| Wheat MT | 41.7 abcd | ± | 16.7 | 66.7 a | ± | 16.7 | 75.0 a | ± | 0.0 | 75.0 a | ± | 0.0 | 64.6 a | ± | 9.6 | ||||
| Canola MT | 16.7 d | ± | 16.7 | 41.7 a | ± | 16.7 | 41.7 b | ± | 16.7 | 66.7 a | ± | 16.7 | 41.7 c | ± | 12.8 | ||||
| Check (Water) | 62.5 ab | ± | 25.0 | 75.0 a | ± | 50.0 | 75.0 ab | ± | 50.0 | 62.5 a | ± | 25.0 | 68.8 a | ± | 15.7 | ||||
| p-Value | 0.05 | 0.53 | 0.28 | 0.35 | 0.90 | ||||||||||||||
| 16 DAP | 20 DAP | 22 DAP | 26 DAP | ||||||||||||||||
| Leaf number per plant | Hairy Vetch ET * | 2.0 a | ± | 0.0 | 3.5 b | ± | 0.4 | 3.7 b | ± | 0.4 | - | - | |||||||
| Wheat ET | 1.8 a | ± | 0.4 | 2.8 bc | ± | 0.3 | 3.2 b | ± | 0.3 | 3.8 b | ± | 0.3 | |||||||
| Canola ET | 1.8 a | ± | 0.3 | 3.3 bc | ± | 0.4 | 3.5 b | ± | 0.4 | 4.0 b | ± | 0.5 | |||||||
| Hairy Vetch MT | 1.6 ab | ± | 0.5 | 5.6 a | ± | 1.0 | 6.6 a | ± | 1.4 | 8.4 a | ± | 1.6 | |||||||
| Wheat MT | 1.7 a | ± | 0.4 | 2.7 c | ± | 0.4 | 3.0 b | ± | 0.5 | 3.8 b | ± | 0.3 | |||||||
| Canola MT * | 1.2 b | ± | 0.3 | 2.7 c | ± | 0.4 | 3.0 b | ± | 0.7 | - | - | ||||||||
| Check (Water) | 2.0 a | ± | 0.0 | 2.8 bc | ± | 0.3 | 3.0 b | ± | 0.0 | 3.5 b | ± | 0.4 | |||||||
| p-Value | 0.009 | 0.0001 | 0.01 | 0.0001 | |||||||||||||||
| 8 DAP | 12 DAP | 16 DAP | 20 DAP | 22 DAP | 26 DAP | ||||||||||||||
| Soybean plant height (mm) | Hairy Vetch ET * | 77.5 a | ± | 11.8 | 128.2 ab | ± | 9.5 | 171.7 ab | ± | 11.8 | 195.7 ab | ± | 14.4 | 240.2 a | ± | 24.4 | |||
| Wheat ET | 66.0 ab | ± | 20.3 | 115.0 ab | ± | 24.8 | 146.8 b | ± | 32.2 | 181.5 ab | ± | 37.0 | 230.7 a | ± | 45.2 | 266.5 b | ± | 43.3 | |
| Canola ET | 80.8 a | ± | 19.0 | 135.5 a | ± | 14.4 | 187.3 a | ± | 13.5 | 214.5 a | ± | 27.5 | 256.0 a | ± | 31.4 | 321.3 a | ± | 45.4 | |
| Hairy Vetch MT | 69.7 a | ± | 21.1 | 120.2 ab | ± | 27.4 | 142.6 b | ± | 27.4 | 166.0 b | ± | 28.5 | 211.0 ab | ± | 27.7 | 245.8 b | ± | 25.5 | |
| Wheat MT | 66.7 ab | ± | 12.8 | 119.3 ab | ± | 14.5 | 148.3 b | ± | 14.4 | 181.2 ab | ± | 22.2 | 227.0 a | ± | 19.9 | 276.2 ab | ± | 15.6 | |
| Canola MT * | 44.2 b | ± | 15.3 | 77.5 c | ± | 22.6 | 98.5 c | ± | 29.6 | 118.0 c | ± | 35.3 | 164.3 b | ± | 43.5 | ||||
| Check (Water) | 57.8 ab | ± | 11.5 | 107.5 b | ± | 14.3 | 140.7 b | ± | 17.5 | 169.3 b | ± | 21.2 | 214.8 a | ± | 32.8 | 256.2 b | ± | 33.5 | |
| p-Value | 0.06 | 0.002 | 0.0001 | 0.08 | 0.0001 | 0.05 | |||||||||||||
Publisher’s Note: MDPI stays neutral with regard to jurisdictional claims in published maps and institutional affiliations. |
© 2021 by the authors. Licensee MDPI, Basel, Switzerland. This article is an open access article distributed under the terms and conditions of the Creative Commons Attribution (CC BY) license (https://creativecommons.org/licenses/by/4.0/).
Share and Cite
Sheldon, K.; Purdom, S.; Shekoofa, A.; Steckel, L.; Sykes, V. Allelopathic Impact of Cover Crop Species on Soybean and Goosegrass Seedling Germination and Early Growth. Agriculture 2021, 11, 965. https://doi.org/10.3390/agriculture11100965
Sheldon K, Purdom S, Shekoofa A, Steckel L, Sykes V. Allelopathic Impact of Cover Crop Species on Soybean and Goosegrass Seedling Germination and Early Growth. Agriculture. 2021; 11(10):965. https://doi.org/10.3390/agriculture11100965
Chicago/Turabian StyleSheldon, Kendall, Sam Purdom, Avat Shekoofa, Larry Steckel, and Virginia Sykes. 2021. "Allelopathic Impact of Cover Crop Species on Soybean and Goosegrass Seedling Germination and Early Growth" Agriculture 11, no. 10: 965. https://doi.org/10.3390/agriculture11100965
APA StyleSheldon, K., Purdom, S., Shekoofa, A., Steckel, L., & Sykes, V. (2021). Allelopathic Impact of Cover Crop Species on Soybean and Goosegrass Seedling Germination and Early Growth. Agriculture, 11(10), 965. https://doi.org/10.3390/agriculture11100965