Article

Sugar Beet Shoot and Root Phenotypic Plasticity to Nitrogen, Phosphorus, Potassium and Lime Omission

1
Crop Science, Institute of Crop Science and Resource Conservation, University of Bonn, Katzenburgweg 5, 53115 Bonn, Germany
2
Agroecology and Organic Farming, Institute of Crop Science and Resource Conservation, University of Bonn, Auf dem Hügel 6, 53121 Bonn, Germany
3
Soil Science and Soil Ecology, Institute of Crop Science and Resource Conservation, University of Bonn, Nussallee 13, 53115 Bonn, Germany
4
Leibniz Centre for Agricultural Landscape Research (ZALF), Eberswalder Str. 84, 15374 Müncheberg, Germany
*
Author to whom correspondence should be addressed.
Agriculture 2021, 11(1), 21; https://doi.org/10.3390/agriculture11010021
Submission received: 30 November 2020 / Revised: 21 December 2020 / Accepted: 29 December 2020 / Published: 31 December 2020
(This article belongs to the Special Issue Root-Soil Interactions in Organic Farming)

Abstract

:
In low input agriculture, a thorough understanding of the plant-nutrient interactions plays a central role. This study aims to investigate the effects of nitrogen (N), phosphorus (P), and potassium (K) and liming omission on shoot growth as well as on topsoil root biomass, growth and morphology (tuber and fibrous roots) of sugar beet grown under field conditions at the Dikopshof long-term fertilizer experiment (Germany). Classical shoot observation methods were combined with root morphology and link measurements using an image analysis program. Omission of the nutrients N, P and K as well as of liming led to a significant decrease in shoot growth. Tuber yield was lowest for the unfertilized and the K omission treatment. The root shoot ratio was highest in the N deficient treatment. In the K omission treatment, a strategic change from a less herringbone root type (early stage) to a more herringbone root type (late stage), which is more efficient for the acquisition of mobile nutrients, was observed. By contrast, a change from a more herringbone (early stage) to a less herringbone root type (late stage) which is less expensive to produce and maintain was observed in the unfertilized treatment. We conclude that sugar beet alters its root morphology as a nutrient acquisition strategy.

1. Introduction

A deeper understanding of effects of nutrient limitation on shoot and root growth is of value for plant breeding and cultivar selection, organic farming and low-input agriculture [1], and improvement of crop models [2,3,4]. Crop production is considered as an integration of processes occurring in both root and shoot systems [5]. The shoot part of the plant is responsible for light interception and biomass allocation [6]. The root part comprises many other functions essential for crop production, including water and nutrient uptake, improvement of soil organic matter, carbon sequestration in form of root debris, root exudates and root respiration [7,8], plants anchoring in the soil and symbiosis with soils microorganisms. In general, the above-ground part of plants has been intensively studied, however, the below-ground parts have largely been neglected, in the past [9]. The reasons behind this are difficulties of observation of root systems related to the time and labor requirements. Two types of observation methods can be distinguished: destructive methods using an auger or shovel, implicating a big loss of soil volume and less insight into the architecture of the root systems; and non-destructive methods, such as the rhizotrons, which besides faster root morphology characterization, permit to have insight into root growth dynamics [10,11], but measurements with these methods are often carried out under controlled (non-field) conditions and do not allow estimation of root biomass or root nutrient concentrations. The choice of methods depends on the crop studied, the soil properties, labor availability and the objective of the study [12].
Recently, the study of below ground mechanisms have received a growing interest [13], focusing on fine roots traits, mycorrhizal associations and nutrient acquisition [14]. Effective nutrient acquisition largely depends on the ability of root systems to explore the soil [15] and on the source-sink relationship [16]. Especially in organic farming where mineral fertilizers are not applied, high efficiency of acquisition of nutrients by roots is important to secure yields. In general, root systems with either a more herringbone topology (branches more or less confined to the main axis) or with longer links (either interior or exterior) should be favored in conditions where soil-derived resources limit growth [17]. Long interior and exterior links are associated with more efficient exploitation of soils with low nutrient conditions [17] but are more expensive to produce. According to the authors, root systems of dicots became more herringbone and link length generally increased under low nutrient conditions.
According to Carvalho and Foulkes [18], root morphology refers to the surface features of a single root axis as an organ, including characteristics of the epidermis such as root hairs, root diameter, the root cap, the pattern of appearance of daughter roots, undulations of the root axis, and cortical senescence, root topology describes the branching pattern of the individual root axes. Parameters such as specific root length (SRL), root diameter, and surface area of roots are key root morphological traits and permit to study the response of root systems as affected by different edaphic factors [19]. Root length and root diameter distribution may be obtained in two ways: by microscopic measurements, which are laborious, or by computerized image analysis which is fast [20,21]. An advanced level of the morphology analysis constitutes the “link analysis”. It represents the study of each link (root part between two forks or a fork and a tip) regarding the morphology and the basic connectivity [22]. The link analysis delivers the following parameters for each link: length, average diameter, projected area, surface area and basic connectivity analysis. Whereas root morphology and link analysis can be done on incomplete roots, the root topology requires a complete root system.
The sugar beet is the most important sugar plant of the temperate latitudes. In 2019, sugar beet was cultivated on 409,000 ha in Germany, which is 3.5% of the agricultural area (German Federal Statistical Office DESTATIS). Sugar beet is a biennial plant, mainly cultivated for its taproot (tuber), a storage organ of sucrose. It constitutes with sugar cane the main sugar crops in the world. Kutschera [23] described the root system of sugar beet as being constituted from a classical taproot that grows vertically and produces several lateral branches, which subsequently branch further, forming an extended fibrous root system which progressively colonizes deep soil layers [24].
The effects of nutrient deficiency on sugar beet shoots and tap roots were described in several studies [12,25,26,27]. N is considered as the most important nutrient limiting sugar beet crop production. N deficiency results in low yield, but also, a high level of N leads to lower sugar beet yield quality [28,29]. P is considered as the second most limiting factor in sugar beet production, given its structural role, being part of the ADP and nucleic acid, and also given its role in energy transfer. In organic farming, P is most often delivered in form of manure. K was also shown to be an important nutrient in sugar beet growth due to its importance in photosynthesis and respiration [26]. Abdel-Motagally [30] reported that low K inputs led to a decrease in the photosynthetic activity of the sugar beet. However, few studies investigated the effect of nutrients on the fibrous root system of the sugar beet [31], although uptake of soil nutrients and water depends on the extension and functionality of laterals, fine roots and root hairs [24,32]. In particular, in sugar beet, the fibrous root system may be one of the most important factors affecting not only the biomass production but also the sugar production [33].
This study aims to investigate the effects of N, P, K and liming omission on sugar beet shoot growth (biomass, leaf area index (LAI), and yield) as well as on sugar beet root biomass and growth of both the tuber and the topsoil fibrous root system under field conditions. For that, we analyze field data of sugar beet grown in 2019 in a long-term fertilizer experiment and applied the image analysis software WinRhizo Pro.

2. Materials and Methods

2.1. Experimental Site

The Dikopshof long-term fertilizer field experiment was established in 1904 near Cologne, Germany (50°48′21″ N, 6°59′9″ E, altitude: 61 m), located at the intermediate strath terrace of the Rhine river. This long-term field experiment is the tenth oldest long-term field experiment in the world [34]. The groundwater table is about 20 m below the surface. The Atlantic climate with mild winters and summers results in a mean annual temperature of 10.1 °C and a mean annual precipitation of 630 mm. The general soil type is classified as a Haplic Luvisol derived from loess above sand [35]. The depth of the loess layer in the experimental field varies from about 1.1 to 1.3 m. The soil texture can be described as silty loam (topsoil) and (silty) clay loam (below 30 cm soil depth). The clay-depleted topsoil horizon (Al) is concordant with the plowed Ap horizon (0–30 cm), followed by an illuvial Bt horizon down to about 80 cm, which is characterized by an increase in clay content. The subsequent cambic horizon is 20 cm thick, followed by a layer of loess that is present until the sand and gravel layers starts [35]. Soil bulk density increased from about 1.4 g cm−3 in the topsoil (0–30 cm) to about 1.5–1.6 g cm−3 below 30 cm soil depth.

2.2. Experimental Design and Fertilizer Management

The experiment is a non-randomized block design and comprises 24 treatments and five strips. In this study we focus on the following six treatments: NPKCa, _PKCa, N_KCa, NP_Ca, NPK_, and no fertilizer applied (_stands for the omission of the corresponding nutrient) [36]. Cattle farmyard manure was supplied on sugar beet, potato and winter rye plots after harvesting of the preceding crop at an average rate of 60 t ha−1 year−1 (fresh matter manure), with a dry matter content of 20–30% and a C:N ratio of ~25:1 (treatments with “+m”). Moreover, treatments without application of manure (“ ”) and, since 1953, with (“+s”) and without (“ ”) supplemental mineral fertilizer application were established. This procedure aimed to compensate for the amount of nutrients previously supplied by manure. The fertilization management has not changed since 1953, except for a slight increase of the N fertilizer application (+30 kg N ha−1) on winter wheat, which occurred in the 1980s. The five-year crop rotation was performed with sugar beet (Beta vulgaris), winter wheat (Triticum aestivum L.), winter rye (Secale cereale L.), a fodder legume, and oat/potato (Avena L./Solanum tuberosum L., potato replaced oat in 1953). The fodder crop initially used was red clover (Trifolium pratense), then lucerne (Medicago sativa) and, after 1967, persian clover (Trifolium resupinatum L.) was mainly used. In each of the five strips, one of the crops of the rotation was grown. Thus, the experiment consists of five strips with 24 treatments per strip (120 plots, Figure 1). Crop residues were removed during the entire period, except for roots and senesced potato leaves. Since 1909, the depth of plowing before sugar beet was regularly about 30 cm. The plot size is 15 m × 18.5 m with a core plot for final harvest of 9 m × 10 m.

2.3. Crop Management and Field Data Collection

In this study, sugar beet grown in the treatments NPKCa + m + s (B13), NPKCa (B7), _PKCa (B8), N_KCa (B9), NP_Ca (B10), NPK_ (B11) and the unfertilized control (B12) of strip B were considered (Figure 1). In the framework of crop rotation at the Dikopshof, the crop that preceded the sugar beet was potato. In autumn 2018, the soil was tilled with a cultivator and then ploughed with a plough to 30 cm depth. In February, 20 t ha−1 of cattle farmyard manure was applied in treatment NPKCa + m + s. Before sowing of sugar beet, the soil was tilled with a cultivator (15 cm depth) and a harrow (8 cm depth). Sugar beet (variety BTS 7300 N, BETASEED, Frankfurt am Main, Germany) was sown on 8 April 2019 with a sowing density of 10 plants per m2. Amount of fertilizers applied in per treatment and in the whole 5-year crop rotation are shown in Table 1. Insects and diseases were controlled with pesticides according to standard grower practice.

2.4. Field Data Collection

The Dikopshof field trial was established more than a century ago without field repetitions of the treatments. Consequently we collected internal repetitions within one plot per treatment. The collection of field data was conducted on 16 May, 13 June, 10 July and 10 September 2019. Harvest started in November. The presented plant and soil data from 2019 comprise leaf area index (LAI), dry matter shoot weight (DM shoot), dry matter root weight (DM root), shoot and root C, N, P, K concentrations, root morphology and root link analysis, topsoil mineral N, P, K and pH values (Table S1), and yield at harvest (fresh matter sugar beet tuber).

2.4.1. Leaf Area Index

The leaf area index (LAI) was determined destructively on sampling dates two, three and four using the cut sugar beet plants and a LI-3100C Area Meter (LI-COR Biosciences GmbH, Bad Homburg, Germany). The same plants were then dried and weighted.

2.4.2. Shoot and Root Fresh and Dry Weight and Nutrient Concentrations

The shoot fresh matter was oven-dried (105 °C) and weighed to estimate shoot dry matter. Root weight was determined after analysis by drying (105 °C) and weighing using Sartorius ENTRIS 4231 fine scale with 0.001 g level of precision (Sartorius Lab Instrument GmbH & Co, Goettingen, Germany). For dates two to four, the root and shoot samples were milled, sieved and analyzed for total C and total N with an elemental analyzer (Euro-EA, HEKAtech GmbH, Wegberg, Germany) and for P and K with a flame photometer (ELEX 6361, Eppendorf, Hamburg, Germany). Only one mixed sample per treatment and date was analyzed for total C, total N, P and K (no replicates). The fresh matter tuber yield was collected in the core plot and weighed at harvest in November.

2.4.3. Root Sampling, Preparation and Scanning

The sugar beets were excavated with a shovel with the surrounding soil to minimize loss of roots on four dates during the growth period (5 plants per treatment). The extraction of the whole tuber with taproot was only possible at the first sampling date. Later, in sampling date 2, 3 and 4 the tuber and the first part of the taproot was harvested and analyzed (about first 30 cm) but not the whole taproot.
Due to severe drought and very dry soil conditions at sampling date 3, we decided to not present the root morphology data from that date. The sampling procedure at that date proved to be difficult as large dry chunks of soil were loosened when the plants were removed and probably many roots were torn off. The results of the analyses also differed fundamentally from those of the other dates.
The sugar beet roots were processed directly after harvest. To bare roots from soil, the soil was soaked in tap water and washed by hand using a sieve with 0.55 mm mesh size until rudest soil and debris was cleared away. On sampling dates two, three and four, large roots (tuber) had to be cut for scanning (Figure 2). Subsequently, roots were sorted by hand, filtering out smallest particles and dead roots. Afterwards, cleaned roots were scanned directly using an EPSON scanner (HP Expression 1100XL, Epson America, Inc., Los Alamitos, CA, USA). For that, the roots of each sample (one plant) were laid preferably without overlaps into an acrylic glass platter filled with tap water and scanned with a resolution of 800 dpi as black-and-white picture (Figure 2). All samples were scanned and finally analyzed via the root image software WinRHIZO version Pro 2020a (Regent Instruments, Québec, QC, Canada).

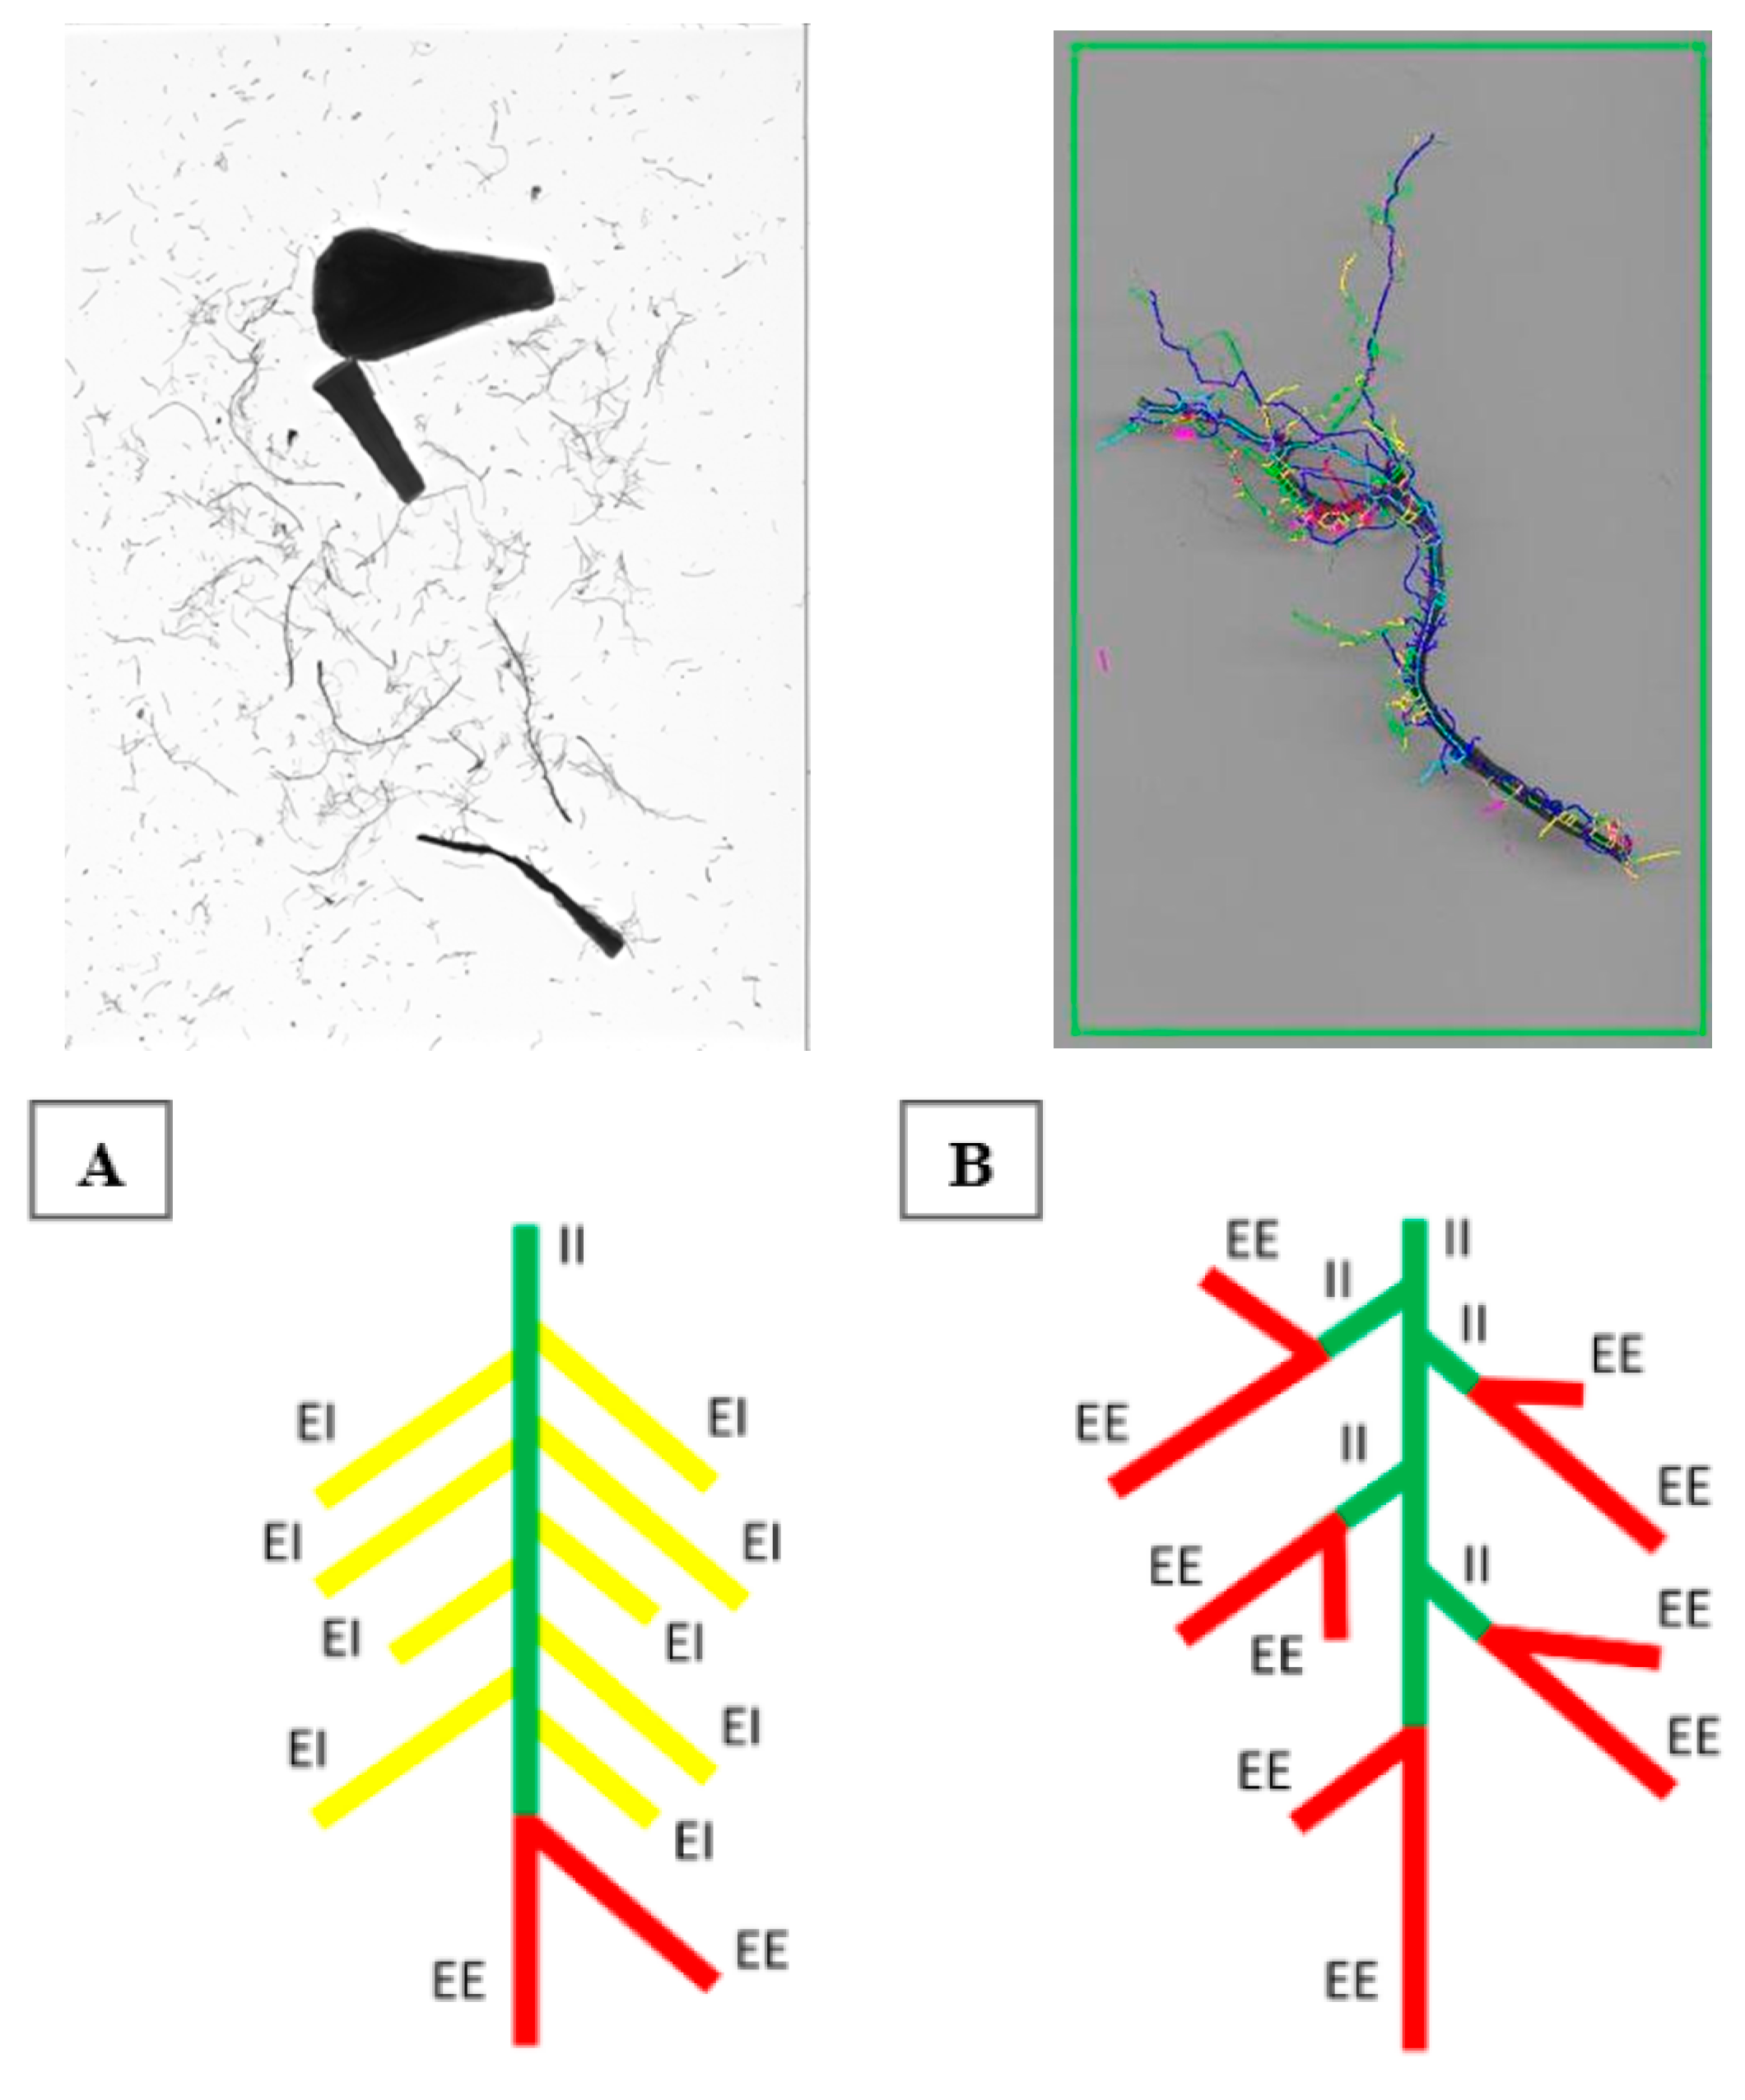
2.4.4. Image Analysis of Root Length, Root Diameter, and Analysis of Basic Link Connectivity

The root scans were analyzed using the software WinRHIZO. Topsoil root length was calculated per plant. Root diameter classes of very fine (<0.1 mm), fine (0.1–0.5 mm), medium to coarse (>0.5 mm) roots were defined and analyzed (Table 2). Besides measuring total root length (cm) and root diameter (mm), a link analysis was performed to investigate root basic link connectivity [17].
Classic herringbone root systems (tap root and primary laterals only and thus many interior links) can be distinguished from the highly branched dichotomous architecture type root systems with many exterior links [17]. Via link analysis, root segments (links) were classified into basic connectivity classifications by categorizing them into different link groups (EE, EI, and II; E stands of exterior and I for interior links). Exterior links which end in a meristem (EE and EI) can be distinguished from interior links (II) (Figure 2). For every link, data of the basic connectivity classification was analyzed (Table 2). To compare connectivity across the different treatments, the absolute number of each link group (EE, EI and II) per centimeter root length was calculated. For the statistical analysis, the mean across plants segment replicates was calculated, resulting in the mean absolute number of links per centimeter root length.

2.4.5. Soil Observations and Analysis

The frozen soil samples (one per treatment, depth and date) were thawed and the mineral nitrogen concentration (Nmin) was determined. After preparation of the samples (drying and sieving), the concentrations of P and K (PCAL and KCAL) available to plants were determined with a calcium-acetate-lactate extract [37]. Additionally, the pH value of the respective soil samples was determined (CaCl solution, with a Multi 3630 IDS pH Meter and a SenTix 940P electrode, both from WTW, Weilheim, Germany). Those samples were taken from the topsoil with a hand shovel.

2.5. Data Analyses

The data was analyzed using programming language R (version 1.3.959). Means and standard deviation of shoot dry matter, LAI, and mean values of root dry matter, root length over all replicates for each treatment and each sampling date were calculated. Due to the sampling procedure, the final number of replicates was different between dates, between treatments and between traits (Table S2).
A one-way univariate analysis of variances (ANOVA, α = 0.05) followed by a post hoc analysis of significance (Tukey-test) was conducted using the number of samples (plants) per treatment as replicates to assess the differences between treatments in affecting the root dry matter and shoot dry matter, LAI, SRL, root shoot ratio, total root length and average root diameter. Shapiro-Wilk test was used to assess the normality of all groups’ (defined by the treatment and sampling date). All groups were normally distributed and no transformations were needed. The experimental design at the Dikopshof is a non-randomized block design. So, due to the lack of plot replicates at this old trial we used measurement replicates within the plots for this analysis. The number of replicate for each analysis is presented in Table S2. The treatments with (n = 2) were excluded from the statistical analysis using ANOVA.
To have a better understanding of the proportion of root length classes within each single root system, we chose the sample with the median total root length within one treatment and per sampling date. The topological index (TI) of the roots was calculated as the ratio between log(altitude) and log(magnitude) [38].

3. Results

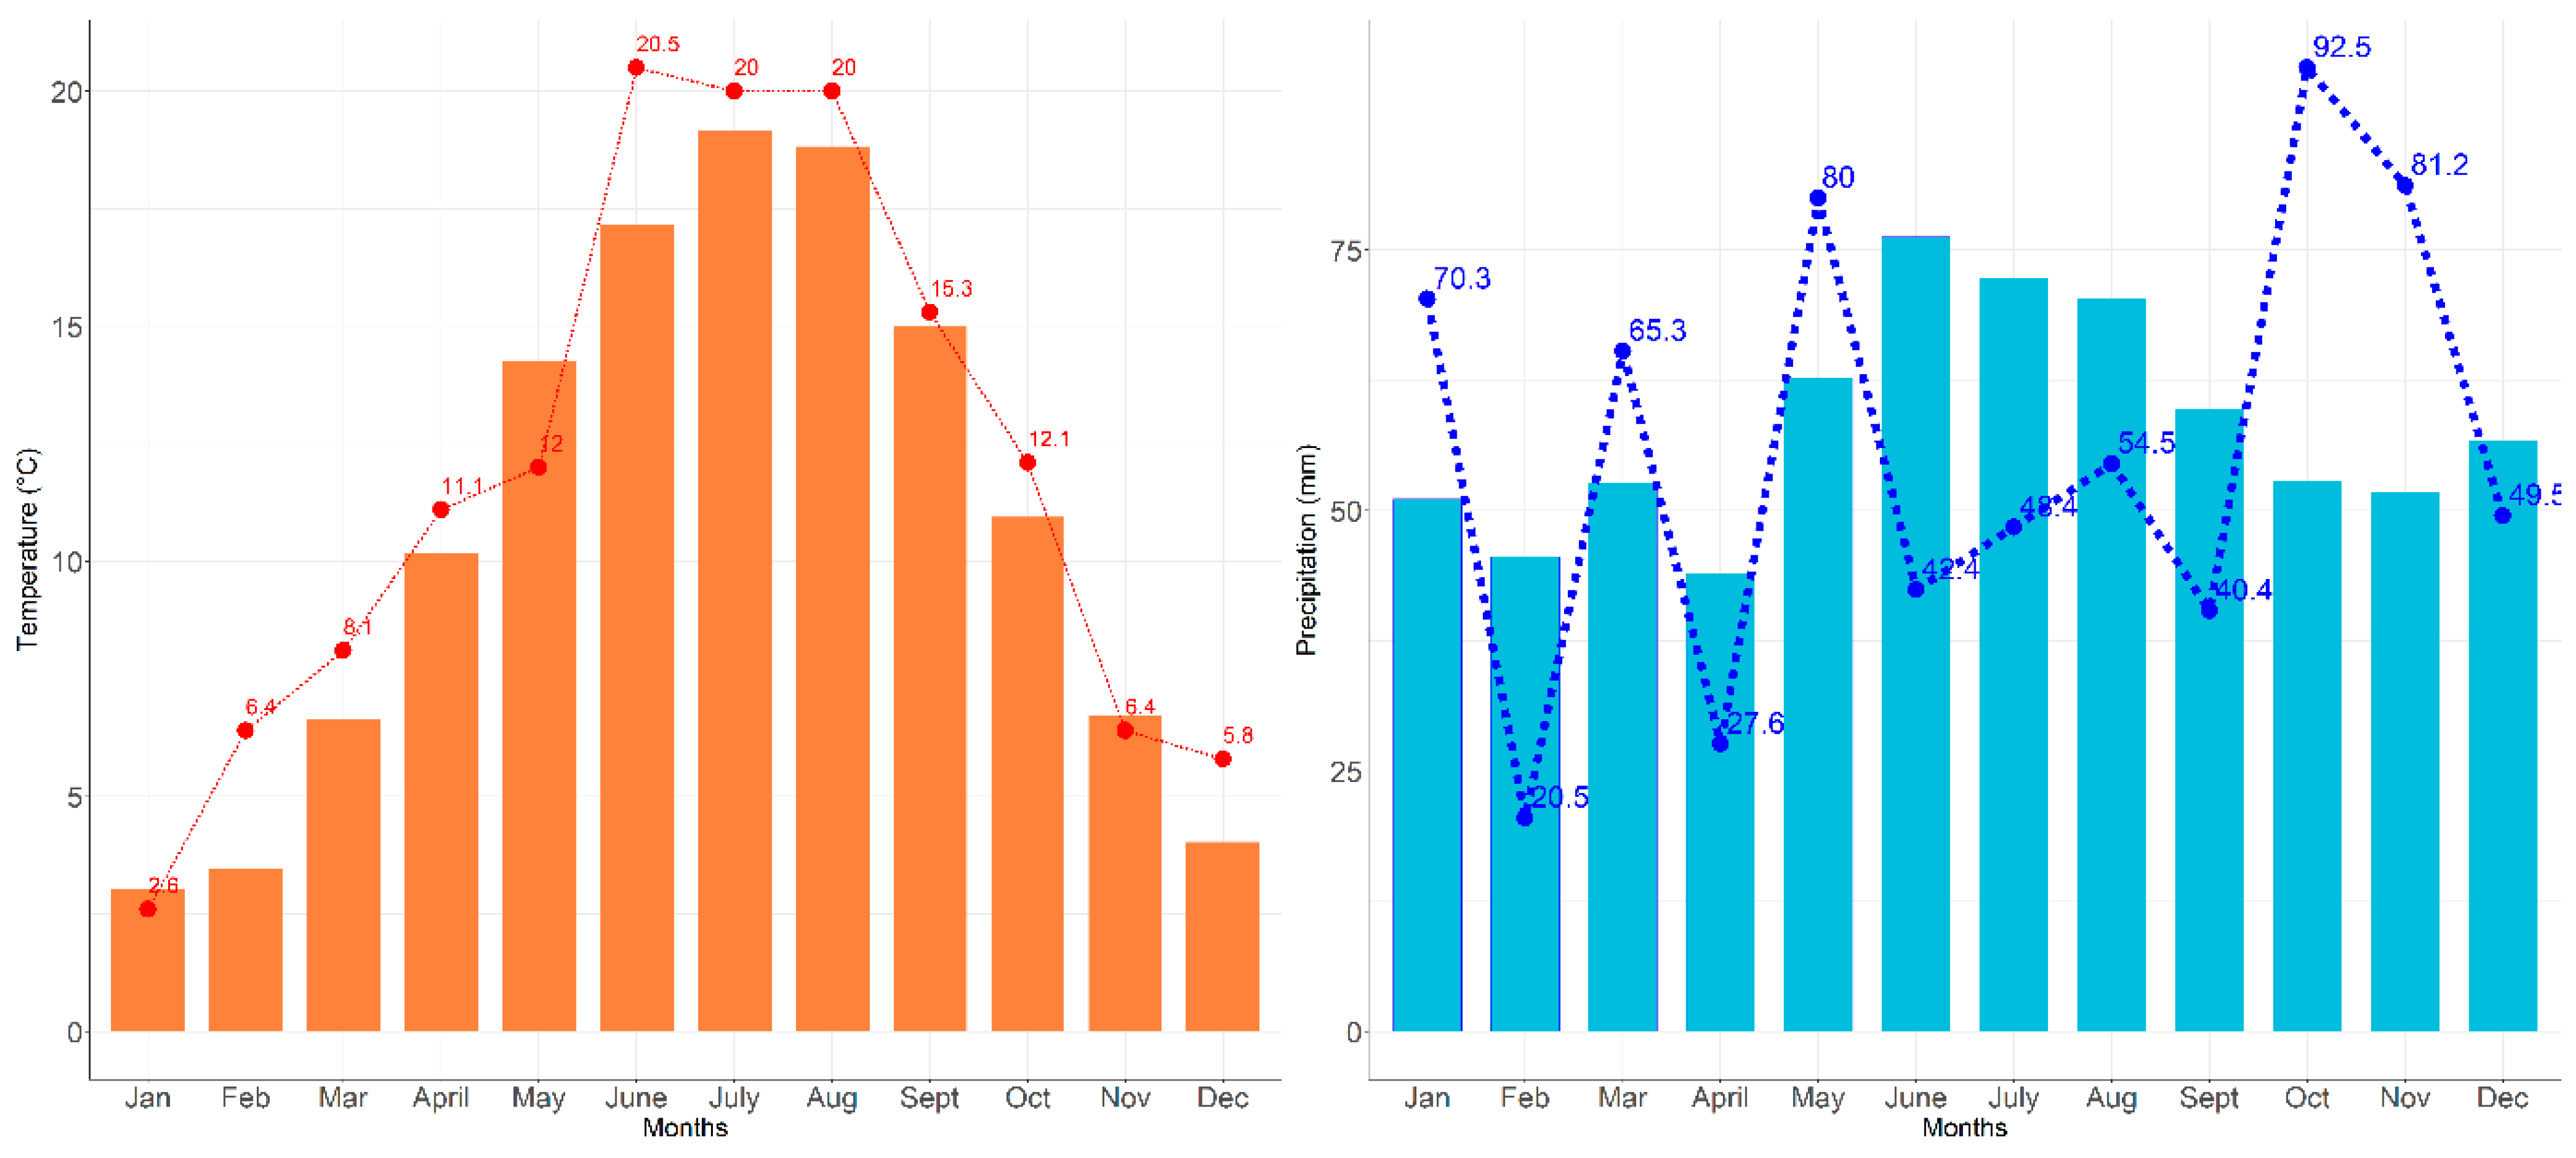
3.1. Growing Conditions during the Growth Period
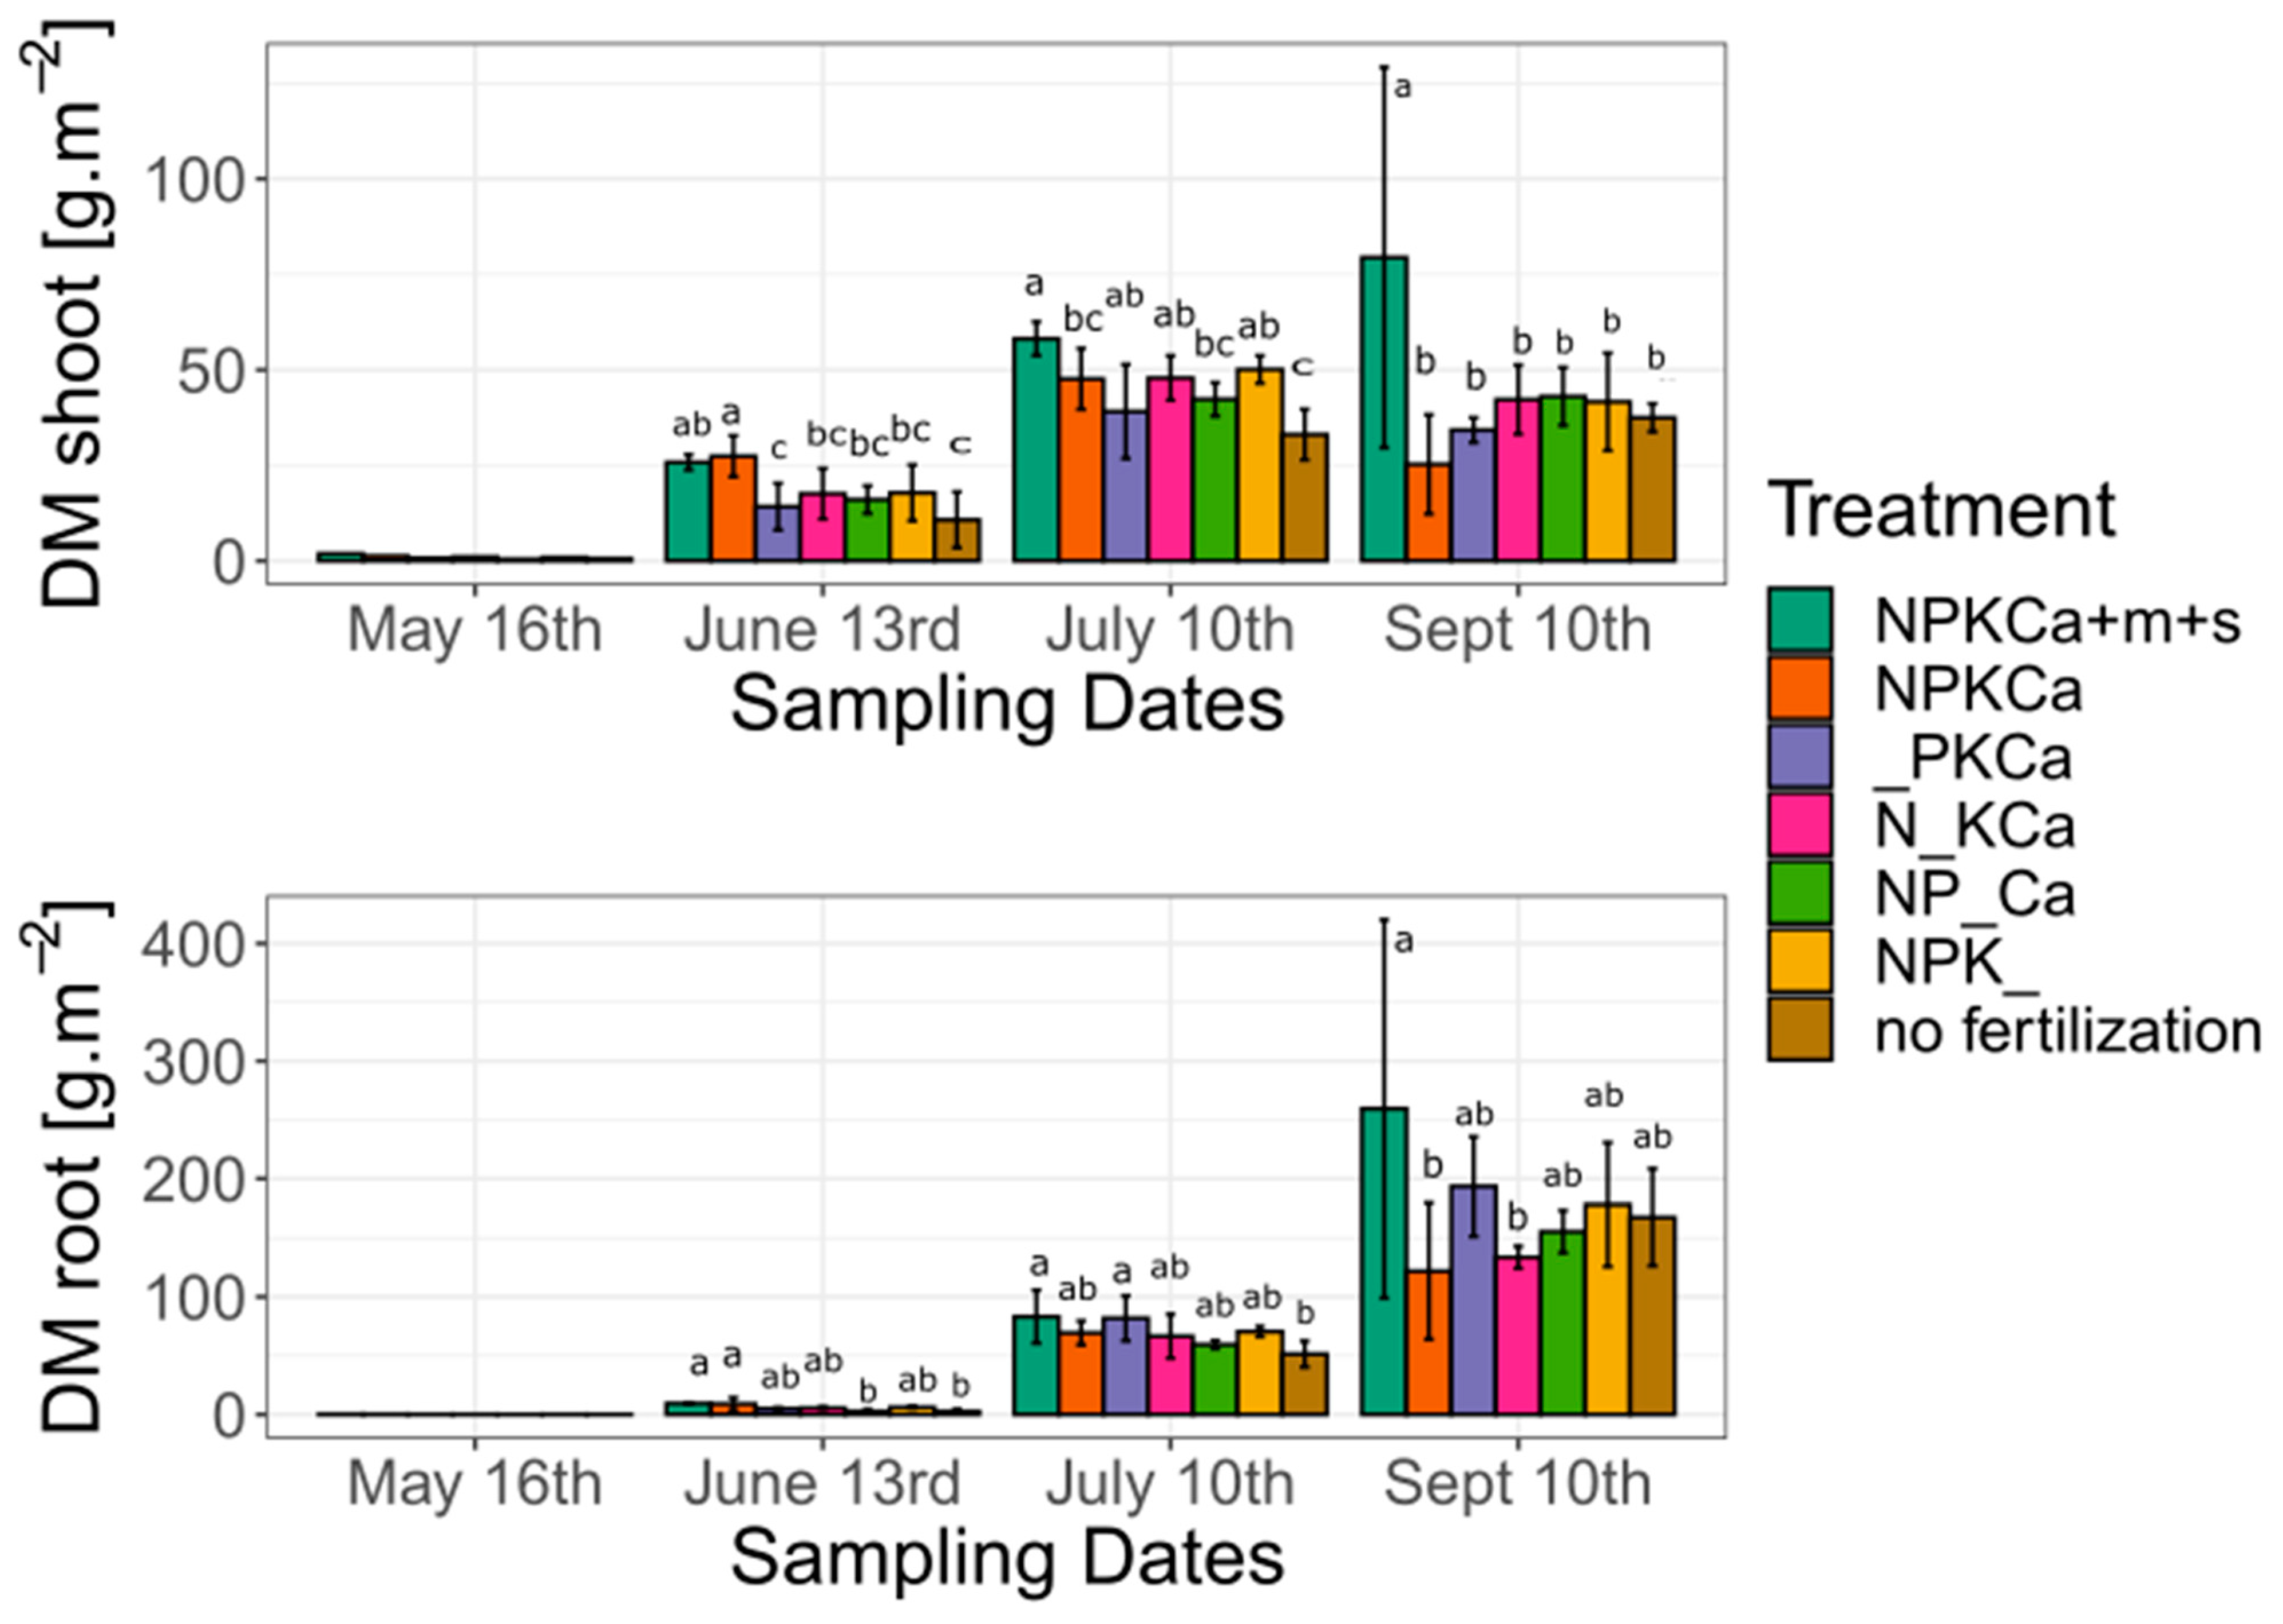
The growth period in 2019 can be characterized as exceptionally dry and hot (Figure 3). Especially in the months June, July, and August, above average air temperatures were observed. Rainfall was below average from June to September. Especially in the months of late June, July and August, the plants suffered from drought stress and leaves were wilted. The plants recovered in autumn after some rainfall events and when the temperature dropped.
The impact of nutrient or liming omission was clearly reflected by the soil analysis data (Table S1). The highest mineral topsoil N concentrations were observed in treatment NPKCa + m + s and the lowest ones in the N omission treatment. Nutrient omission (N, P, K) led to low values of the respective nutrient in the topsoil. Liming enhanced the pH value from mean value of 5.7 (NPK_) to 6.5 (mean of all other treatments).

3.2. Shoot Growth

The shoot dry matter weight increased from sampling date 1 to sampling date 3 for all treatments (Table 3, Figure 4). On sampling date 4, the measured shoot dry matter weight decreased in comparison to the values measured on sampling date 3 for all treatments except for the unfertilized and the treatment NPKCa + m + s, where shoot dry matter weight increased compared to sampling date 3. The LAI increased from date 2 to date 3. From date 3 to date 4 it decreased again for all treatments except for the treatment NPKCa + m + s. The decline of shoot dry matter and LAI from date 3 to 4 can be attributed to the dry spell and related visible wilting and drop of leaves.
The omission of the nutrients N, P and K as well as of liming led to a significant decrease in shoot growth (Table 3, Figure 4). In June, the shoot biomass of the N limited and the unfertilized treatment were significantly lower than the fully fertilized treatment NPKCa + m+s. In July, significant differences in shoot biomass were observed following the order: fully fertilized > P omission and no liming > N and K omission > unfertilized treatment. On sampling date 4, the shoot biomass of treatment NPKCa + m + s was significantly higher compared to the other treatments with nutrient omission or the unfertilized treatment, but no significant differences were observed between those treatments.
In general, the highest LAI value was observed for the fully fertilized treatment NPKCa + m + s. Treatment NPKCa experienced decreases in shoot growth parameters after sampling date 2. Although treatment NPKCa showed very similar values for LAI as well as for dry matter at the two first sampling dates compared to treatment NPKCa + m + s, its performance decreased significantly on the third and fourth sampling dates.

3.3. Root Dry Matter Weight

The root dry matter weight increased from sampling date 1 to sampling date 4 for all treatments (Table 3) and thus did not decline from date 3 to 4 such as the shoot traits (biomass and LAI) did for almost all treatmens. The highest value of root dry matter was measured in the treatment NPKCa + m + s and the lowest one in the unfertilized treatment for all sampling dates. Among the nutrient omission plots, the K omission treatment showed the lowest values of root dry matter weight on sampling date 2. On sampling date 3, the significantly highest value of root dry matter was observed in the treatment NPKCa + m + s and the N omission treatment. On sampling date 4, the lowest value of root dry matter was measured in the P omission and treatment NPKCa.

3.4. Root Shoot Ratio

The root shoot ratio provides insights on where the sugar beet allocates the most carbon in the current phase of its growth. While a ratio of below 1 was achieved in all treatments on the two first sampling dates, this changed at the third sampling date with values above 1 (Table 3). On the fourth sampling date, the ratio increased again. On sampling dates 2, 3 and 4, outstanding high values of root shoot ratio were observed in the N omission treatment. The lowest root shoot ratios on the fourth sampling date were measured in the P and the K omission treatment.
The analysis results of root and shoot nutrient concentrations (Table S3) showed that N omission resulted in lowest shoot and root N concentrations similar to the unfertilized treatment especially at the last sampling date where the shoot biomass was the highest. This trend could be also seen when investigating the results of the P and K root and shoot analysis. The unfertilized treatment showed higher N concentrations at sampling date 2 and 3 compared to the fully fertilized treatment. At sampling date 2 and 3, the NPKCa + m + s treatment showed low shoot N concentration as compared to the other treatment with N fertilizers, root N did not follow this trend. Low values of root N in all dates were given in the N omitted treatment and in the unfertilized treatment.
When P was omitted, low values of shoot P and root P were measured. When K was omitted, the values of K in shoot did not show a lower value comparable to the unfertilized treatment at the 2nd and 3rd sampling date, but at sampling date 4, the value of K in shoot was even lower than in the unfertilized treatment. The root K concentration was at all sampling dates affected by the omission of K.
The shoot and root total C and N analysis clearly showed that the C/N ratio of the N deficient treatment was higher in both shoot and root compared to the other treatments. Due to the lower N availability in the soil, sugar beet has consumed less N, which results in an increased value of the C/N ratio both in the shoots and in the roots. This was also observed in the unfertilized treatment at the fourth sampling date.

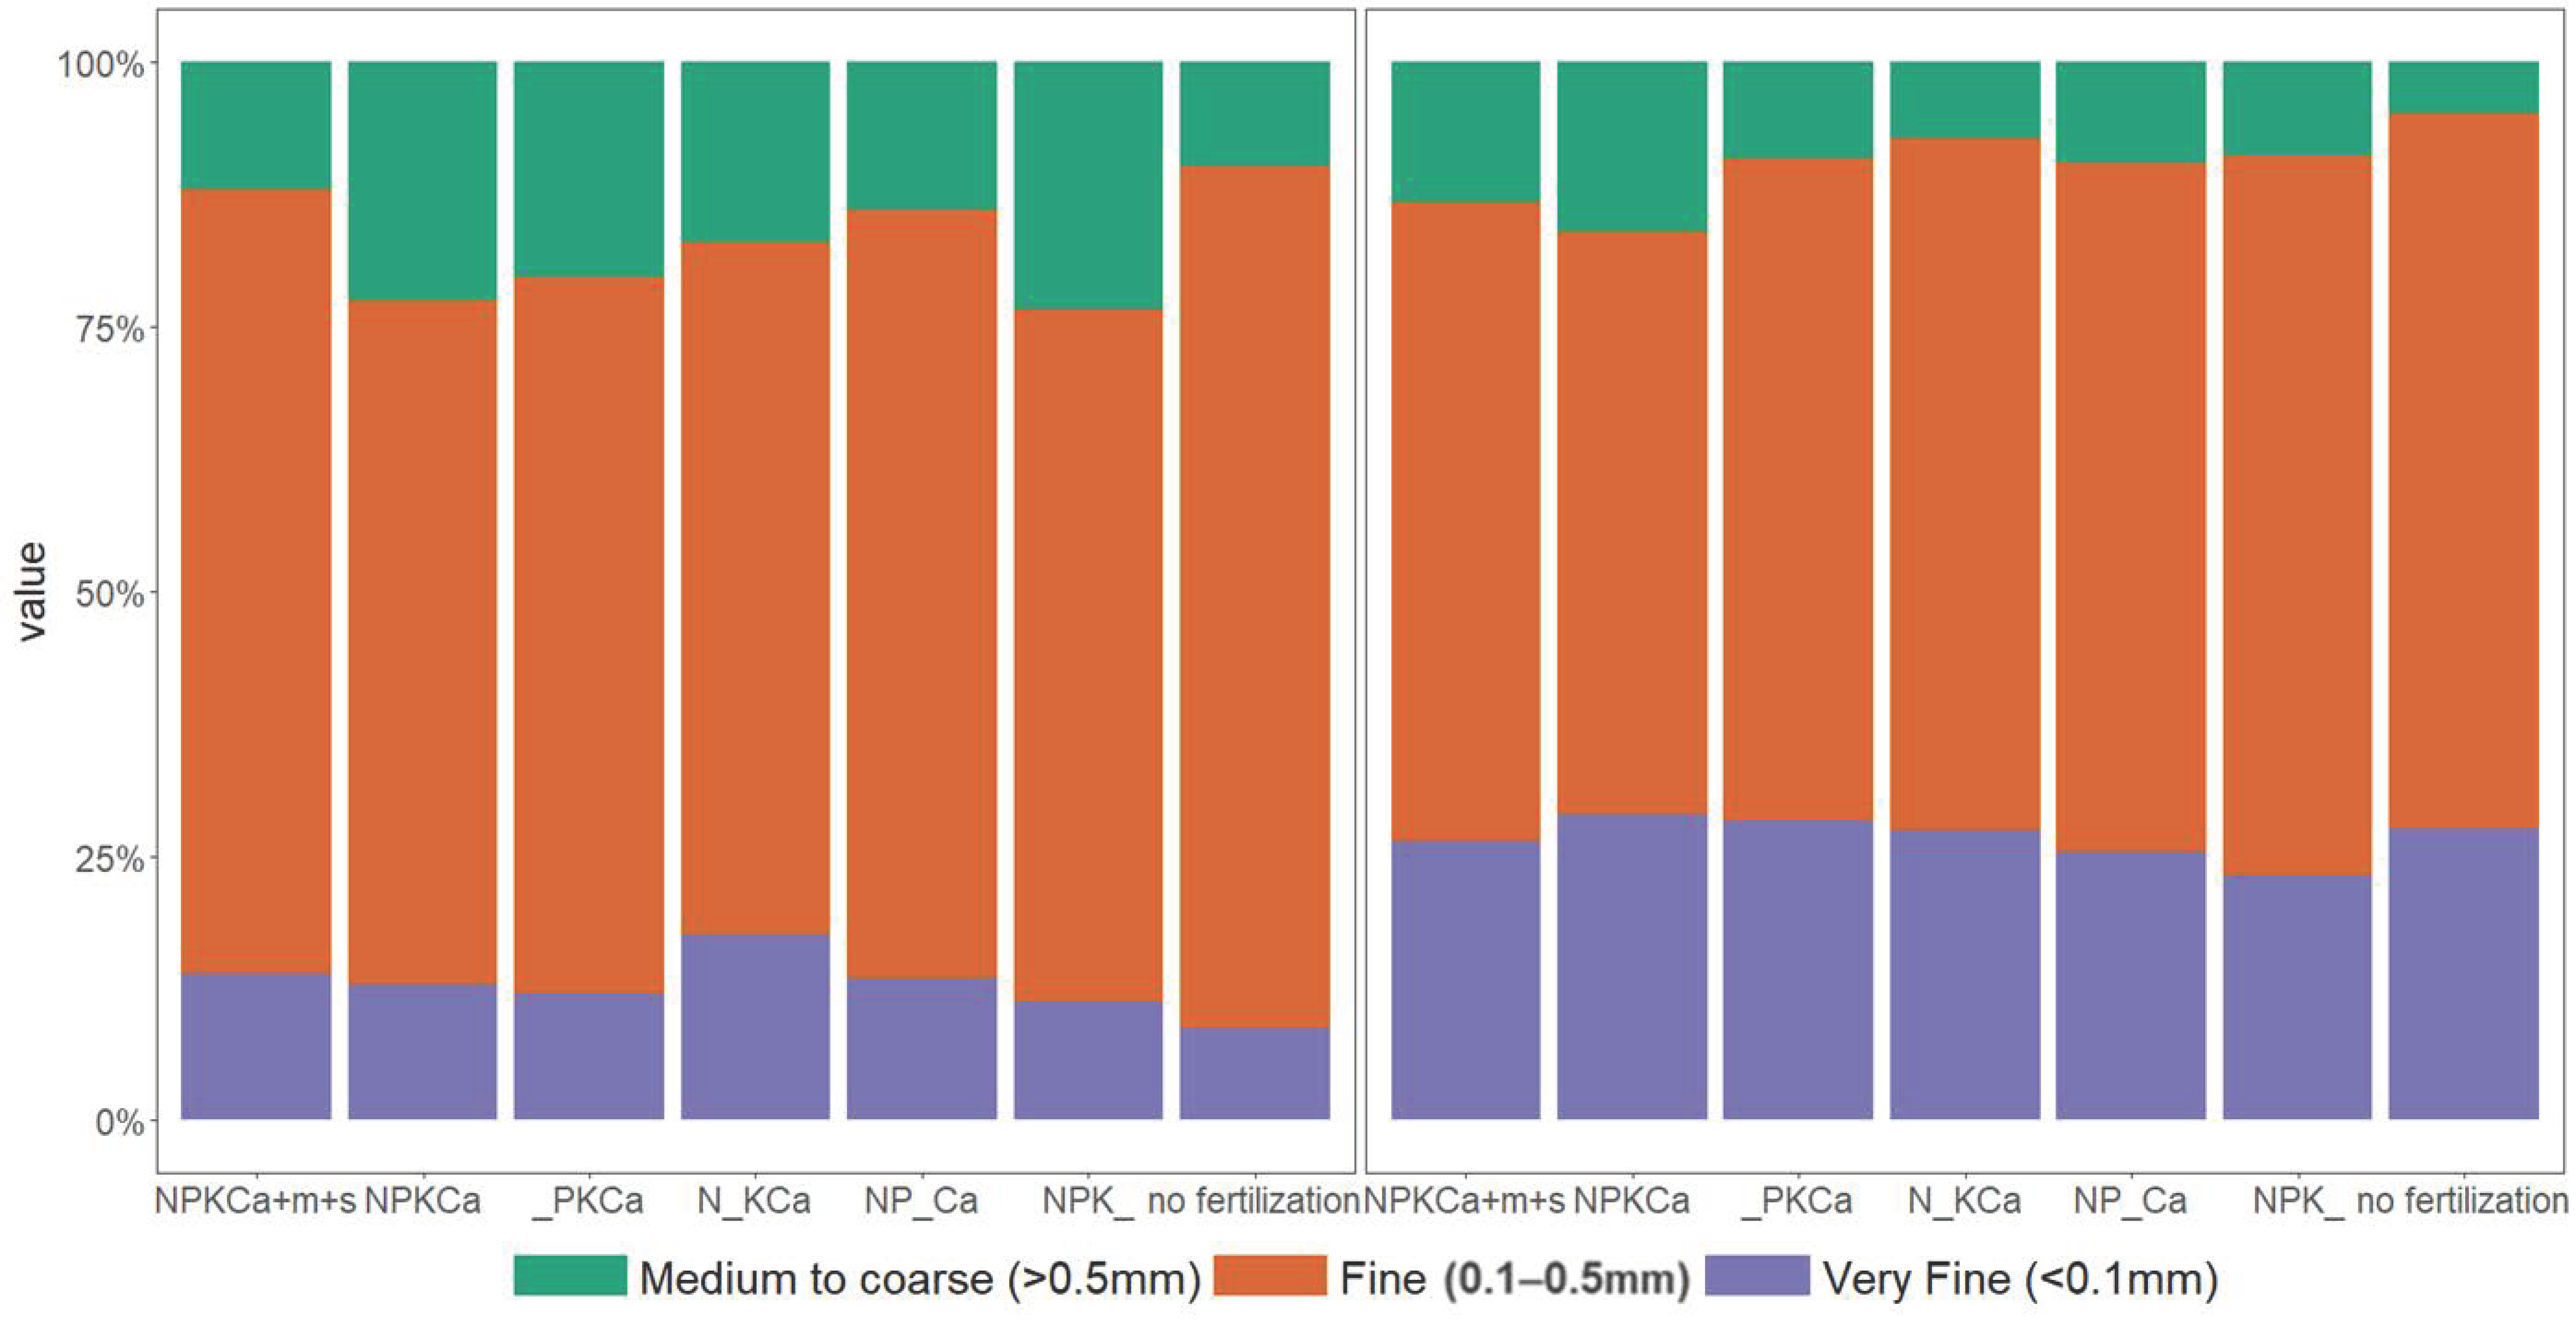
3.5. Root Morphology

The root morphology parameters root length, average root diameter and root length within each root diameter class were estimated for each treatment and each sampling date (Table 4). The values of root length increased between the two first sampling dates and decreased between the sampling date 2 and 3. The values increased again between the third and the fourth sampling dates. This trend could be also seen in the respective root classes.
The total root length was significantly highest in treatment NPKCa + m + s and the unfertilized treatment followed by treatment in May and July, however there was no significance differences between the treatments in late growing stage (July and September). The average root diameter was also not significantly different between treatment on sampling dates 1, 3 and 4. The only significant differences between the treatments could be detected on sampling date 2, where the treatment with no liming shows a higher value of average root diameter as compared to the treatment with no K.
The SRL differed only significantly between the treatments at the sampling date 4. The highest values were observed in the treatment NPKCa, and the lowest value in the fully fertilized with manure and the unfertilized treatment.
To have a better comparison between the root classes as well as between treatments, the results were presented as proportion of each class from the total root length for each treatment for dates 2 and 4 (Figure 5). The root diameter classes change their distributions across the sampling dates. The share of very fine and fine roots for the unfertilized treatment was low at date 2 but high at date 4. At the late stage, the share of medium to coarse roots was highest for the fully fertilized treatments NPKCa + m + s and NPKCa, also in P deficient treatment the share of very fine and fine roots was enhanced.

3.6. Root Link Analysis

The share of interior root length from total root length ranged from 50 to 70% (Table S4). In the early growth stage, the share of interior root length was low for the P omission treatment and high for the fully fertilized treatment. On sampling date 4, the share of interior root length was higher in the K omission and the no liming treatments compared to the other treatments. On the same date, the share of interior root length of total root length was highest in the P omission treatment and lowest in the unfertilized treatment. There was no clear trend observed for the unfertilized treatment.
The number of root links per cm root (branching) shows that in the K omission treatment, root branching was lowest on sampling date 1 but highest on date 4 (Table S5). Interestingly, branching is similar in the fully fertilized treatment NPKCa + m + s and the unfertilized treatment.
The topological index (TI) refers to the exploitation efficiency of plants, a higher TI characterize a more herringbone root system and lower TI refers to a more dichotomous root system. The TI of all treatments is higher than 1 (Figure 6). The topological index was highest for the liming omission (1.36) and the fully fertilized treatment (1.26) on date 1. On sampling dates 2 the topological index was highest for the K omission treatment. The TI was low for the N omission treatment and fully fertilized treatment without manure on sampling date 1. The P deficiency results in higher TI compared to the fully fertilized treatment.
The most outstanding and significant results of this study showing different impacts of nutrient limitation on shoot and root growth, root topology and root morphology are represented in Table 5.

4. Discussion

4.1. Effect of N, P and K Omission and Omission of Liming on Shoot Growth, Root Shoot Ratio and Yield

Sugar beet growth was affected by the omission of every single nutrient and the omission of liming. Our results showed that all shoot growth traits were significantly reduced as a result of nutrient omission compared to the fully fertilized treatment. A decrease of sugar beet shoot growth under low nutrient conditions was already reported [29]. Traits such as leaf area index, shoot dry matter and root dry matter are reacting differently to nutrient limitation type depending on the growth stage. Our findings show that, depending on the growth stage, nutrient omission can affect also N, P and K concentrations of the aboveground and belowground plant organs in different ways.
Based on tuber yields of different treatments, our study showed that K was the most limiting factor in sugar beet grown under field conditions at that site. In general, it is largely recognized that the nutrient most limiting sugar beet growth is N [39]. However, in our trial, N omission still resulted in the second highest fresh tuber yield among all treatments. Similar as described in [24,40], N omission caused a sharp decline in shoot biomass.
Plants respond to nutrient limitations by changing their root shoot ratio. In low nutrient conditions, the allocation of biomass to the roots is often favored [41,42]. Our results in the late growth stage (July and September) confirmed that in low nutrient conditions, the root shoot ratio—but not the absolute tuber yield of sugar beet—was enhanced in the N omission treatment. An increase of the root shoot ratio under P deficiency was not observed, this was also already reported by [43]. The highest root shoot ratio was achieved by the N omission treatment. According to the concept of functional equilibrium between above and below ground parts of plants, under N deficiency the greater part of the N taken up is used to ensure the root growth, and thus diminishing the translocated part to the shoot. Due to this, shoot growth is depressed earlier and to a much greater extent than root growth [35]. This this goes in line with Hoffmann [16] who stated that sugar yield is more determined by dry matter partitioning (sink) than by canopy formation (source). Also, the low but considerable topsoil mineral N values of 2 to 10 kg ha−1 [44] let us assume that N sources such as mineralization and atmospheric N deposition may have contributed to a low but sufficient N supply at that site.

4.2. Impact of Nutrient or Liming Omission on Root Morphology and Link Basic Connectivity

Root plasticity might be important factors in the acquisition of immobile resources such as P. In the late growing stage the shares of very fine roots and fine roots were higher under P deficiency compared to the other treatment, this plasticity was already reported for other [45,46]. Conversely, in Wheat, lower share of very fine roots under increased P stress was reported [47].
The root length was enhanced compared to the treatment with no P deficiency, a greater root length in deficient P plots compared to the fully fertilized was observed. Similar results were already reported for sugar beet [48]. However, the opposite was reported in Wheat [47].
Herringbone type root systems are characterized by many interior root links, long links, and a higher TI. They are more efficient in exploiting soils with low nutrient concentrations, but more expensive to produce and maintain by the plant [17]. The herringbone root topology is more efficient for the acquisition of mobile nutrients such as N or K due to the reduced incidence of depletion zone overlap, whereas the dichotomous-type root systems (highly branched, lower TI) were judged to be preferable for the uptake of immobile ions such as P [17,22,49]. However, the results of the root analysis presenting the share of II links of total link length in P, showed a shift from a less herringbone root architecture (56.5%) at the early stage to a more herringbone type root architecture (70.4%) with more interior links in the late stage (Table S4). The roots were particularly affected by K deficiency, as well as by non-fertilization and full fertilization. The roots in the fully fertilized treatments can be characterized with a high total root length, a high share of fine and very fine roots and many interior links at the early stage as well as a high average root diameter and a low SRL at late growth stages. Likewise, Hodge [31] reported of greater root length of thinner roots and low SRL in nutrient-rich zones and Song et al. [50] reported of significantly lower root length in the low nutrient (N, P, K) treatments than those of the two highest nutrient treatments in Pistacia chinensis Bunge seedlings. In the unfertilized treatment the share of very fine roots, SRL and TI were high compared to the other treatments in the early growth stage. In the later growth stages, average root diameter was high and total root length, SLR, share of interior links, number of total links, and TI were low In contrast to no fertilization, the K omission treatment shows high total RL, high SRL in the late growth stage, i.e., highly acquisitive traits, which makes sense if considering that at the loess site, K can be mineralized from the solid phase. Our results confirm the hypothesis of Mollier and Pellerin [51] that P deficiency mainly affects the root system morphology through its effect on the C budget with no additional specific effect of P deficiency on root morphogenesis.
The SRL provides insights into the crop investment in biomass. Plants with high SRL build more root length for a given dry-mass investment and are generally considered to have higher rates of nutrient and water uptake per dry mass [19]. However, other studies report increasing, decreasing or constant SRL values as response to nutrient limitation [52,53]. In Our study, no significant differences between the treatments for the first sampling dates were observed but there was a tendency for high SRL in the unfertilized treatment (date 1). During the late growing stage, SRL differed significantly between the treatments with the lowest values observed in the fully fertilized and the unfertilized treatments and highest values observed in the K omission treatment.

4.3. Other Factors Influencing Root Growth and Observations

Many factors influence root architecture such as water supply [54,55], soil texture [56], soil structure [57], temperature [58,59], micro-organisms [32] and the selected variety [55]. In particular, investigation of plant nutrient uptake should consider also the water supply [60]. On the one hand, because water in the soil is a main factor in the mobility of nutrients, and on the other hand, because it is largely recognized that water is an essential component of plant growth and forms with nutrients N, P and K the two most limiting factors to plant growth.
Both link analysis and other root morphology parameters behave differently as a function of the sampling dates. These changes are firstly related to the growth stage but also to the impact of climate parameters occurring at the respective sampling date. The growth period in 2019 was characterized by extreme drought and above-average temperatures. Precipitation in June, July and August 2019 was so low it can, be assumed that drought stress was an important factor for sugar beet deriving the differences in the response to nutrient deficiency. Moreover, the method of sampling only allowed to examine the roots located in the topsoil (about 0–30 cm) and the topsoil is usually most affected by in-season drought events. When comparing the root length over the four dates in the field, one can observe large differences between the measured total root lengths. Especially at sampling date 3 the crops already had suffered from drought for some weeks, leaves wilted and dropped off, and shoot and root growth was limited. Root sampling with the shovel was difficult at that date and may have led to a demolition of fine roots. Thus, the root morphology traits of that date were not presented in this study.
Sampling of fibrous sugar beet roots is complicated due to the root structure and depth. For instance, root augers cannot be used for sampling tubers with a diameter of more than 10 cm. The use of other methods for easier extraction of fine roots with a defined soil volume such as monoliths [61] should therefore be adopted when examining the root architecture of sugar beet.

5. Conclusions

Studies investigating the impact of nutrient deficiency are often carried out under controlled conditions such as pot experiments. To our knowledge no studies were carried out to investigate sugar beet root and shoot growth, root morphology and topology under various nutrient omissions and under field conditions. Our study reports that nutrient omission negatively impacted shoot growth parameters of sugar beet. All treatments but the fully fertilized one showed a decline in the shoot growth parameters shoot dry weight and LAI from date three to four due to the dry spell. In contrast, root weight increased from sampling date one to four. Shoot growth depression in the N omission treatment was high but root growth depression rather low. In September, the root-shoot ratio was highest for the N omission treatment and lowest for the K, P omission and fully fertilized treatments.
One of the main drivers of SRL is the shoot biomass and the carbon that can be allocated from the shoot to the roots. TI and SRL were highest for the K omission treatment which reveals the effort of the plants to exploit the soil with the low K concentrations. The findings also clearly underline the general importance of root plasticity including a shift towards the one or the other root type to maintain resource acquisition capacity in low input agriculture.
The study provides general insights into the effects of nutrient deficiency on root and shoots growth, root morphology and root branching of sugar beet under field conditions. A better understanding of the impact of nutrient limitation and low soil pH values on shoot and root growth is especially important in organic farming or in low-input agriculture systems. Further studies should be carried out under field conditions taking into consideration also crop water uptake and the deeper root system. Use of other methods such as monoliths should permit and easier extraction of fine roots in the context of studies that investigate the root architecture of sugar beet or other tuber crops.

Supplementary Materials

The following are available online at https://www.mdpi.com/2077-0472/11/1/21/s1, Table S1: Soil analysis data. Topsoil mineral N, plant available soil P and K (PCAL and KCAL) extracted with a calcium-acetate-lactate extract in kg ha-1 and topsoil pH value for the seven treatments and four sampling dates in 2019 at the long-term fertilizer experiment Dikopshof (taken from Yi et al. [44]), Table S2: Number of analyzed replicates per sampling date and treatment for LAI, DM root, DM shoot, Root morphology (total root length, root diameter) and link basic connectivity. For link basic connectivity, the replicates correspond to segments of one sample per treatment and per sampling date; Table S3. Means of shoot and root C, N, P, K parameters as well as shoot C/N ration and root C/N ratio; Table S4. Share of interior root length (II, in %) exterior-interior (EI, in %) and exterior (EE, in %) of total root length (II, EI and EE) for the seven treatments and three sampling dates in 2019 at the long-term fertilizer experiment Dikopshof; Table S5. Number of interior (II), exterior-interior (EI) and exterior-exterior (EE) links per cm root length for the seven treatments and three sampling dates in 2019 at the long-term fertilizer experiment Dikopshof.

Author Contributions

S.S. conceived the idea, planned the research and designed the experiments. D.P., S.S. and H.H. conducted the experiment in the field and collected the data. S.H. analyzed the data and wrote the article. T.G., S.S., R.K., F.E. and M.A. contributed to data interpretation, writing and editing of the article. All authors have read and agreed to the published version of the manuscript.

Funding

The presented study has partially been funded by the Deutsche Forschungsgemeinschaft (DFG, German Research Foundation) under Germany’s Excellence Strategy—EXC 2070—390732324 (PhenoRob) and by the German Federal Ministry of Education and Research (BMBF) in the framework of the funding measure ‘Soil as a Sustainable Resource for the Bioeconomy—BonaRes’, project BonaRes (Module A): BonaRes Center for Soil Research, subproject ‘Sustainable Subsoil Management—Soil3’ (grant 031B0151A).

Institutional Review Board Statement

Not applicable.

Informed Consent Statement

Not applicable.

Data Availability Statement

Data are available by contacting the authors.

Acknowledgments

We would like to explicitly thank all technicians and other assisting staff members of the Crop Science Group (INRES, University of Bonn, Germany) who have been running this experiment for decades. Moreover, we thank the BonaRes Data Center for the financial support to prepare a part of the data.

Conflicts of Interest

All authors of this manuscript declare no potential sources of conflict of interest.

References

  1. Goulding, K.; Jarvis, S.; Whitmore, A. Optimizing Nutrient Management for Farm Systems. Philos. Trans. R. Soc. B Biol. Sci. 2008, 363, 667–680. [Google Scholar] [CrossRef] [PubMed] [Green Version]
  2. Craufurd, P.Q.; Vadez, V.; Jagadish, S.K.; Prasad, P.V.; Zaman-Allah, M. Crop Science Experiments Designed to Inform Crop Modeling. Agric. For. Meteorol. 2013, 170, 8–18. [Google Scholar] [CrossRef] [Green Version]
  3. Warren, J.M.; Hanson, P.J.; Iversen, C.M.; Kumar, J.; Walker, A.P.; Wullschleger, S.D. Root Structural and Functional Dynamics in Terrestrial Biosphere Models–Evaluation and Recommendations. New Phytol. 2015, 205, 59–78. [Google Scholar] [CrossRef] [PubMed]
  4. McCormack, M.L.; Guo, D.; Iversen, C.M.; Chen, W.; Eissenstat, D.M.; Fernandez, C.W.; Li, L.; Ma, C.; Ma, Z.; Poorter, H.; et al. Building a Better Foundation: Improving Root-Trait Measurements to Understand and Model Plant and Ecosystem Processes. New Phytol. 2017, 215, 27–37. [Google Scholar] [CrossRef] [Green Version]
  5. Bingham, I. Soil-root-canopy Interactions. Ann. Appl. Biol. 2001, 138, 243–251. [Google Scholar] [CrossRef]
  6. Monteith, J.L. Climate and the Efficiency of Crop Production in Britain. Philos. Trans. R. Soc. Lond. B Biol. Sci. 1977, 281, 277–294. [Google Scholar]
  7. Allmaras, R.R.; Linden, D.R.; Clapp, C. Corn-Residue Transformations into Root and Soil Carbon as Related to Nitrogen, Tillage, and Stover Management. Soil Sci. Soc. Am. J. 2004, 68, 1366–1375. [Google Scholar] [CrossRef] [Green Version]
  8. Benjamin, J.G.; Halvorson, A.D.; Nielsen, D.C.; Mikha, M.M. Crop Management Effects on Crop Residue Production and Changes in Soil Organic Carbon in the Central Great Plains. Agron. J. 2010, 102, 990–997. [Google Scholar] [CrossRef]
  9. Fageria, N.K. The Role of Plant. Roots in Crop. Production; CRC Press: Boca Raton, FL, USA, 2012; ISBN 1-4398-6737-2. [Google Scholar]
  10. Smit, A.; George, E.; Groenwold, J. Root observations and measurements at (transparent) interfaces with soil. In Root Methods; Springer: Berlin, Heidelberg, 2000; pp. 235–271. [Google Scholar]
  11. Van Noordwijk, M. Roots: Length, Biomass, Production and Mortality. In Tropical Soil Biology and Fertility: A Handbook of Methods; CAB International Press: Wallingford, UK, 1993; pp. 132–144. [Google Scholar]
  12. Otto, R.; Trivelin, P.C.O.; Franco, H.C.J.; Faroni, C.E.; Vitti, A.C. Root System Distribution of Sugar Cane as Related to Nitrogen Fertilization, Evaluated by Two Methods: Monolith and Probes. Rev. Bras. Ciência Solo 2009, 33, 601–611. [Google Scholar] [CrossRef]
  13. Hoffmann, C.M. Changes in Root Morphology with Yield Level of Sugar Beet. Sugar Ind. 2017, 142, 420–425. [Google Scholar] [CrossRef]
  14. Klimešová, J.; Martínková, J.; Ottaviani, G. Belowground Plant Functional Ecology: Towards an Integrated Perspective. Funct. Ecol. 2018, 32, 2115–2126. [Google Scholar] [CrossRef] [Green Version]
  15. Li, X.; Zeng, R.; Liao, H. Improving Crop Nutrient Efficiency through Root Architecture Modifications. J. Integr. Plant. Biol. 2016, 58, 193–202. [Google Scholar] [CrossRef] [PubMed] [Green Version]
  16. Hoffmann, C.M. Importance of Canopy Closure and Dry Matter Partitioning for Yield Formation of Sugar Beet Varieties. Field Crop. Res. 2019, 236, 75–84. [Google Scholar] [CrossRef]
  17. Fitter, A.; Stickland, T. Architectural Analysis of Plant Root Systems 2. Influence of Nutrient Supply on Architecture in Contrasting Plant Species. New Phytol. 1991, 118, 383–389. [Google Scholar] [CrossRef]
  18. Carvalho, P.; Foulkes, M.J. Roots and Uptake of Water and Nutrients. In Encyclopedia of Sustainability Science and Technology; Meyers, R.A., Ed.; Springer: New York, NY, USA, 2018; pp. 1–24. ISBN 978-1-4939-2493-6. [Google Scholar]
  19. Ostonen, I.; Püttsepp, Ü.; Biel, C.; Alberton, O.; Bakker, M.; Lõhmus, K.; Majdi, H.; Metcalfe, D.; Olsthoorn, A.; Pronk, A. Specific Root Length as an Indicator of Environmental Change. Plant. Biosyst. 2007, 141, 426–442. [Google Scholar] [CrossRef]
  20. Bouma, T.; Nielsen, K.; Koutstaal, B. Sample Preparation and Scanning Protocol for Computerised Analysis of Root Length and Diameter. Plant. Soil 2000, 218, 185–196. [Google Scholar] [CrossRef]
  21. Berntson, G. A Computer Program for Characterizing Root System Branching Patterns. Plant. Soil 1992, 140, 145–149. [Google Scholar] [CrossRef]
  22. Fitter, A.H. An Architectural Approach to the Comparative Ecology of Plant Root Systems. New Phytol. 1987, 106, 61–77. [Google Scholar] [CrossRef]
  23. Kutschera, L. Wurzelatlas Mitteleuropäischer Ackerunkäuter Und Kulturpflanzen; DLG-Verlags-GmbH: Frankfurt, Germany, 1960; p. 249. [Google Scholar]
  24. Vamerali, T.; Guarise, M.; Ganis, A.; Mosca, G. Effects of Water and Nitrogen Management on Fibrous Root Distribution and Turnover in Sugar Beet. Eur. J. Agron. 2009, 31, 69–76. [Google Scholar] [CrossRef]
  25. Ulrich, A.; Hills, F.J. Sugar Beet Nutrient Deficiency Symptoms: A Color. Atlas and Chemical Guide; UCANR Publications: Oakland, CA, USA, 1969; Volume 4051. [Google Scholar]
  26. Terry, N.; Ulrich, A. Effects of Potassium Deficiency on the Photosynthesis and Respiration of Leaves of Sugar Beet. Plant. Physiol. 1973, 51, 783–786. [Google Scholar] [CrossRef] [Green Version]
  27. Christenson, D.R.; Draycott, A.P. Nutrition-Phosphorus, Sulphur, Potassium, Sodium, Calcium, Magnesium and Micronutrients-Liming and Nutrient Deficiencies. Sugar Beet 2006, 185–220. [Google Scholar] [CrossRef]
  28. Hergert, G.W. Sugar Beet Fertilization. Sugar Tech. 2010, 12, 256–266. [Google Scholar] [CrossRef] [Green Version]
  29. Shaw, B.; Thomas, T.; Cooke, D. Responses of Sugar Beet (Beta Vulgaris L.) to Drought and Nutrient Deficiency Stress. Plant. Growth Regul. 2002, 37, 77–83. [Google Scholar] [CrossRef]
  30. Abdel-Motagally, F.M.; Attia, K.K. Response of Sugar Beet Plants to Nitrogen and Potassium Fertilization in Sandy Calcareous Soil. Int. J. Agric. Biol. 2009, 11, 695–700. [Google Scholar]
  31. Hodge, A. The Plastic Plant: Root Responses to Heterogeneous Supplies of Nutrients. New Phytol. 2004, 162, 9–24. [Google Scholar] [CrossRef]
  32. Hetrick, B. Mycorrhizas and Root Architecture. Experientia 1991, 47, 355–362. [Google Scholar] [CrossRef]
  33. Theurer, J.C. Fibrous Root Growth and Partitioning in Smooth Root Sugarbeet versus Standard Root Type. J. Sugar Beet Res. 1993, 30, 143–150. [Google Scholar] [CrossRef]
  34. Körschens, M. Die Wihtigsten Dauerfeldversuche Der Welt Übersicht, Bedeutung, Ergebnisse. Arch. Agron. Soil Sci. 1997, 42, 157–168. [Google Scholar] [CrossRef]
  35. Holthusen, D.; Jänicke, M.; Peth, S.; Horn, R. Physical Properties of a Luvisol for Different Long-term Fertilization Treatments: I. Mesoscale Capacity and Intensity Parameters. J. Plant. Nutr. Soil Sci. 2012, 175, 4–13. [Google Scholar] [CrossRef]
  36. Rueda-Ayala, V.; Ahrends, H.E.; Siebert, S.; Gaiser, T.; Hüging, H.; Ewert, F. Impact of Nutrient Supply on the Expression of Genetic Improvements of Cereals and Row Crops–A Case Study Using Data from a Long-Term Fertilization Experiment in Germany. Eur. J. Agron. 2018, 96, 34–46. [Google Scholar] [CrossRef]
  37. Schüller, H. Die CAL-Methode, Eine Neue Methode Zur Bestimmung Des Pflanzenverfügbaren Phosphates in Böden. Z. Für Pflanz. Und Bodenkd. 1969, 123, 48–63. [Google Scholar]
  38. Fitter, A.H. Functional Significance of Root Morphology and Root System Architecture. Spec. Publ. Ser. Br. Ecol. Soc. 1985, 4, 87–106. [Google Scholar]
  39. Tsialtas, J.; Maslaris, N. Effect of N Fertilization Rate on Sugar Yield and Non-Sugar Impurities of Sugar Beets (Beta Vulgaris) Grown Under Mediterranean Conditions. J. Agron. Crop. Sci. 2005, 191, 330–339. [Google Scholar] [CrossRef]
  40. Davidson, R. Effects of Soil Nutrients and Moisture on Root/Shoot Ratios in Lolium Perenne L. and Trifolium Repens L. Ann. Bot. 1969, 33, 571–577. [Google Scholar] [CrossRef]
  41. Yan, Z.; Eziz, A.; Tian, D.; Li, X.; Hou, X.; Peng, H.; Han, W.; Guo, Y.; Fang, J. Biomass Allocation in Response to Nitrogen and Phosphorus Availability: Insight from Experimental Manipulations of Arabidopsis Thaliana. Front. Plant. Sci. 2019, 10, 598. [Google Scholar] [CrossRef]
  42. Hermans, C.; Hammond, J.P.; White, P.J.; Verbruggen, N. How Do Plants Respond to Nutrient Shortage by Biomass Allocation? Trends Plant. Sci. 2006, 11, 610–617. [Google Scholar] [CrossRef]
  43. Claassen, N.; Meyer, D.; Jungk, A. Phosphorus Acquisition of Field Grown Sugar Beet and Its Evaluation with a Simulation Model. In Proceedings of the First Congress of the European Society of Agronomy, Paris, France, 5–7 December 1990. [Google Scholar]
  44. Yi, J.; Krusenbaum, L.; Unger, P.; Hüging, H.; Seidel, S.J.; Schaaf, G.; Gall, J. Deep Learning for Non-Invasive Diagnosis of Nutrient Deficiencies in Sugar Beet Using RGB Images. Sensors 2020, 20, 5893. [Google Scholar] [CrossRef]
  45. Kumar, A.; Shahbaz, M.; Koirala, M.; Blagodatskaya, E.; Seidel, S.J.; Kuzyakov, Y.; Pausch, J. Root Trait Plasticity and Plant Nutrient Acquisition in Phosphorus Limited Soil. J. Plant. Nutr. Soil Sci. 2019, 182, 945–952. [Google Scholar] [CrossRef] [Green Version]
  46. Zhang, Y.; Peng, Y.; Yun-Feng, P.; Xue-Xian, L.; Fan-Jun, C.; Chun-Jian, L. Fine Root Patterning and Balanced Inorganic Phosphorus Distribution in the Soil Indicate Distinctive Adaptation of Maize Plants to Phosphorus Deficiency. Pedosphere 2012, 22, 870–877. [Google Scholar] [CrossRef]
  47. Shen, Q.; Wen, Z.; Dong, Y.; Li, H.; Miao, Y.; Shen, J. The Responses of Root Morphology and Phosphorus-Mobilizing Exudations in Wheat to Increasing Shoot Phosphorus Concentration. AoB Plants 2018, 10, ply054. [Google Scholar] [CrossRef]
  48. Steingrobe, B. Root Renewal of Sugar Beet as a Mechanism of P Uptake Efficiency. J. Plant. Nutr. Soil Sci. 2001, 164, 533–539. [Google Scholar] [CrossRef]
  49. Dunbabin, V.; Diggle, A.; Rengel, Z. Is There an Optimal Root Architecture for Nitrate Capture in Leaching Environments? Plant. Cell Environ. 2003, 26, 835–844. [Google Scholar] [CrossRef]
  50. Song, X.; Wan, F.; Chang, X.; Zhang, J.; Sun, M.; Liu, Y. Effects of Nutrient Deficiency on Root Morphology and Nutrient Allocation in Pistacia Chinensis Bunge Seedlings. Forests 2019, 10, 1035. [Google Scholar] [CrossRef] [Green Version]
  51. Mollier, A.; Pellerin, S. Maize Root System Growth and Development as Influenced by Phosphorus Deficiency. J. Exp. Bot. 1999, 50, 487–497. [Google Scholar] [CrossRef]
  52. Ryser, P. The Mysterious Root Length. Plant. Soil 2006, 286, 1–6. [Google Scholar] [CrossRef]
  53. Ryser, P. Intra-and Interspecific Variation in Root Length, Root Turnover and the Underlying Parameters. In Variation in Plant Growth; Backhuys Publishers: Leiden, The Netherlands, 1998; pp. 441–465. [Google Scholar]
  54. Maurel, C.; Nacry, P. Root Architecture and Hydraulics Converge for Acclimation to Changing Water Availability. Nat. Plants 2020, 6, 744–749. [Google Scholar] [CrossRef]
  55. Fitters, T.F.J.; Mooney, S.J.; Sparkes, D.L. Impact of Water Availability on Root Growth of Sugar Beet Varieties. Soil Use Manag. 2020. [Google Scholar] [CrossRef]
  56. Rogers, E.D.; Monaenkova, D.; Mijar, M.; Nori, A.; Goldman, D.I.; Benfey, P.N. X-Ray Computed Tomography Reveals the Response of Root System Architecture to Soil Texture. Plant. Physiol. 2016, 171, 2028. [Google Scholar] [CrossRef] [Green Version]
  57. Watt, M.; McCully, M.E.; Kirkegaard, J.A. Soil Strength and Rate of Root Elongation Alter the Accumulation of Pseudomonas Spp. and Other Bacteria in the Rhizosphere of Wheat. Funct. Plant. Biol. 2003, 30, 483–491. [Google Scholar] [CrossRef]
  58. Nagel, K.A.; Kastenholz, B.; Jahnke, S.; van Dusschoten, D.; Aach, T.; Mühlich, M.; Truhn, D.; Scharr, H.; Terjung, S.; Walter, A.; et al. Temperature Responses of Roots: Impact on Growth, Root System Architecture and Implications for Phenotyping. Funct. Plant. Biol. 2009, 36, 947–959. [Google Scholar] [CrossRef]
  59. Rich, S.M.; Watt, M. Soil Conditions and Cereal Root System Architecture: Review and Considerations for Linking Darwin and Weaver. J. Exp. Bot. 2013, 64, 1193–1208. [Google Scholar] [CrossRef] [Green Version]
  60. Gleeson, S.K.; Good, R.E. Root Growth Response to Water and Nutrients in the New Jersey Pinelands. Can. J. For. Res. 2010, 40, 167–172. [Google Scholar] [CrossRef] [Green Version]
  61. Perkons, U.; Kautz, T.; Uteau, D.; Peth, S.; Geier, V.; Thomas, K.; Holz, K.L.; Athmann, M.; Pude, R.; Köpke, U. Root-Length Densities of Various Annual Crops Following Crops with Contrasting Root Systems. Soil Tillage Res. 2014, 137, 50–57. [Google Scholar] [CrossRef]
Figure 1. Experimental setup of the long-term fertilizer experiment Dikopshof, Germany after 1953 (strips A to E). In the current study, the considered plots are plots B7 to B13 in strip B (marked in blue).
Agriculture 11 00021 g001
Figure 2. Example scan of sugar beet roots (left) and an example for the root analysis with Software WinRHIZO Pro 2020a (mid) from treatment NPKCa + m+s and sampling date 10 July. The diagram on the right shows the distinction between extreme branching patterns ((A) herringbone; (B) dichotomous), and the definition of terms used in the analysis, namely exterior-interior (El), interior-interior (II) and exterior-exterior (EE) links; unlabeled links are interior (based on Fitter and Stickland [17]).
Agriculture 11 00021 g002
Figure 3. Mean monthly air temperature (left panel) and precipitation (right panel) from 1980 to 2019 (bars) and for 2019 (lines) at Dikopshof (source: interpolated data from the German Weather Service, DWD).
Agriculture 11 00021 g003
Figure 4. Mean values of the observed shoot and root dry matter weight of sugar beet at the four sampling dates in 2019 at the long-term fertilizer experiment Dikopshof, Germany. The error bars correspond to the 95% interval of confidence. Different letters indicate significant differences between treatments (ANOVA, α = 0.05).
Agriculture 11 00021 g004
Figure 5. Proportion of fine root diameter class to total root length in % at early growth stage (13 June, left panel) and late growth stage (10 September, right panel) of sugar beet for seven fertilizer treatments grown in 2019 at the long-term fertilizer experiment Dikopshof, Germany. Median values of root length per root diameter class were used to represent the proportion.
Agriculture 11 00021 g005
Figure 6. Topological index (TI) of sugar beet topsoil root system for all considered treatments at three sampling dates in 2019 at the long term fertilizer experiment Dikopshof, Germany.
Agriculture 11 00021 g006
Table 1. Nutrients and fertilizer type applied at sugar beet in kg ha−1 a−1 and at the five year rotation in kg ha−1 since 1953 at the long term fertilizers experiment Dikopshof.
Application Rate per Element
Sugar Beet (kg ha−1 a−1)Rotation (kg ha−1)
TreatmentType of FertilizerNPKCaNPKCa
NPKCa + m + sSynthetic12053199053028710781293
Manure40228350
NPKCaSynthetic803111602301555801143
_PKCaSynthetic031116001555801143
N_KCaSynthetic800116023005801143
NP_CaSynthetic80310023015501143
NPK_Synthetic803111602301555800
unfertilized 00000000
Table 2. Parameters used to define root morphology and link basic connectivity.
ParameterDefinitionUnit
Root lengthTotal length of all roots present per plantcm
Average root diameterAverage diameter of all roots of one samplemm
L1Root length (cm) of very fine roots (diameter < 0.1 mm)cm
L2Root length (cm) of fine roots (diameter 0.1–0.5 mm)cm
L3Root length (cm) of medium fine roots (diameter > 0.5 mm)cm
EELength in cm of exterior-exterior links per cm of total root lengthcm
EILength in cm of exterior-interior links per cm of total root lengthcm
IILength in cm of interior-interior links per cm of total root lengthcm
Table 3. Mean values (and standard deviation if replicates were available) of the observed shoot and root variables of sugar beet at the four sampling dates (three in case of leaf area index) and fresh matter tuber yield of the core plot at harvest in 2019 at the long-term fertilizer experiment Dikopshof, Germany. Different letters indicate significant differences (ANOVA, α = 0.05).
Shoot Dry Matter Weight (g·plant−1)
NPKCa + m + sNPKCa_PKCaN_KCaNP_CaNPK_No Fertilization
16 May1.861.280.911.030.710.390.54
13 June25.80 ± 1.27 ab27.39 ± 5.13 a14.18 ± 4.93 c17.56 ± 5.34 bc16.01 ± 2.27 bc17.82 ± 5.91 bc10.73 ± 5.90 c
10 July58.15 ± 1.79 a47.62 ± 6.43 ab39.09 ± 9.91 bc47.85 ± 5.54 ab42.28 ± 2.75 bc50.08 ± 1.46 ab33.06 ± 6.32 c
10 September79.41 ± 31.30 a25.25 ± 8.16 b34.25 ± 1.30 b42.20 ± 3.64 b43.02 ± 6.12 b41.63 ± 8.03 b37.47 ± 1.48 b
Leaf area index (m−2 m−2)
13 June2.28 ± 0.42 b2.89 ± 0.21 a1.28 ± 0.16 cd1.53 ± 0.19 c0.99 ± 0.33 de1.66 ± 0.07 c0.73 ± 0.24 e
10 July3.96 ± 0.56 a3.38 ± 0.39 ab2.88 ± 0.77 bc2.93 ± 0.13 bc2.85 ± 0.50 bc3.06 ± 0.07 abc2.27 ± 0.40 c
10 September4.31 ± 2.33 a0.91 ± 0.34 b1.55 ± 0.47 b1.84 ± 0.39 b1.35 ± 0.31 b1.83 ± 0.35 b1.59 ± 0.14 b
Root dry matter weight (g·plant−1)
16 May0.30.220.170.180.140.070.1
13 June9.39 ± 0.31 a9.02 ± 5.05 a5.01 ± 0.69 ab5.50 ± 0.78 ab2.75 ± 1.25 b6.09 ± 0.76 ab2.72 ± 0.39 b
10 July83.19 ± 14.17 a69.34 ± 6.42 ab81.82 ± 7.70 a66.51 ± 17.83 ab59.37 ± 2.22 ab0.54 ± 1.75 ab51.35 ± 10.55 b
10 September259.55 ± 100.98 a121.79 ± 46.65 b193.48 ± 5.93 ab133.57 ± 5.93 b155.35 ± 11.28 ab178.18 ± 32.99 ab167.41 ± 25.80 ab
Root-shoot ratio
16 May0.160.170.190.170.20.170.19
13 June0.42 ± 0.11 a0.36 ± 0.24 a0.39 ± 0.13 a0.29 ± 0.05 a0.21 ± 0.08 a0.37 ± 0.12 a0.30 ± 0.05 a
10 July1.54 ± 0.16 b1.51 ± 0.13 b2.07 ± 0.27 a1.40 ± 0.38 b1.42 ± 0.07 b1.55 ± 0.20 b1.55 ± 0.14 b
10 September3.29 ± 0.27 bc4.04 ± 0.65 abc5.00 ± 0.27 a3.22 ± 0.17 c3.27 ± 0.20 bc4.29 ± 0.12 ab3.83 ± 0.69 bc
Fresh matter tuber yield at harvest (t ha−1)
93.463.666.9656.6551.1166.0950.42
Table 4. Effect of fertilization on the root morphology parameters of sugar beet on three sampling dates in 2019 at the long-term fertilizer experiment Dikopshof, Germany. Mean values of total root length are given in cm, average root diameter in mm and the specific root length in m g−1. Different letters indicate significant differences between treatments (ANOVA, α = 0.05). * excluded from the statistical test.
NPKCa + m + sNPKCa_PKCaN_KCaNP_CaNPK_No Fertilization
Total root length (cm)
16 May731.00 ± 150.15 a559.71 ± 281.50 ab225.91 ± 42.63 b432.79 ± 233.54 ab194.57 ± 91.13 b358.86 ± 296.45 ab606.51 ± 107.24 ab
13 June1096.59 ± 458.37 a904.53 ± 143.88 ab652.03 ± 90.55 bc810.76 ± 152.92 abc606.93 ± 41.35 bc578.67 ± 98.54 bc432.64 ± 158.07 c
10 September1658.6 ± 1107.65 a1921.9 ± 156.65 a1851.31 ± 249.68 a2047.73 ± 394.91 a2476.75 ± 696.71 a1475.9 ± 103.33 *1305.11 ± 150.79 a
Average root diameter (mm)
16 May0.41 ± 0.04 a0.44 ± 0.07 a0.46 ± 0.06 a0.44 ± 0.05 a0.50 ± 0.17 a0.50 ± 0.08 a0.34 ± 0.00 a
13 June0.74 ± 0.19 ab0.80 ± 0.03 ab0.68 ± 0.04 ab0.72 ± 0.10 ab0.58 ± 0.11 b0.85 ± 0.17 a0.82 ± 0.00 ab
10 September2.23 ± 1.23 a1.14 ± 0.13 a1.08 ± 0.36 a1.11 ± 0.22 a0.93 ± 0.26 a0.93 ± 0.44 a1.29 ± 0.24 a
Topological specific root length (m g−1)
16 May23.7343.1415.8931.8429.6216.8762.55
13 June1.29 ± 0.21 a6.15 ± 10.23 a1.32 ± 0.28 a1.49 ± 0.38 a2.94 ± 1.56 a0.96 ± 0.21 *1.81 ± 0.69 a
10 September0.06 ± 0.04 b0.22 ± 0.09 a0.09 ± 0.01 ab0.14 ± 0.00 *0.16 ± 0.03 ab0.08 ± 0.01 *0.08 ± 0.02 b
Table 5. The matrix presents the observed strategies of shoot and root growth of sugar beet under optimally fertilized conditions and nutrient omission of sugar beet at the long-term fertilizer experiment Dikopshof in 2019. The symbol/divides into strategy in the early growth stages from strategy in the late growth stage. Significant differences are marked with *, others are non-significant trends.
Full FertilizationNo NNo PNo KNo LimingNo Fertilization
Shoot DMhigh */high *low */low low */low
Leaf area indexhigh */high * low */
Root DMhigh */high */high/low * low */low
Root-shoot ratio high */high */low/low /low
Tuber yieldhigh low low
Total root lengthhigh */low * low */highlow */low
Root diameter /low * /high
Specific root length/low * high/highlow/high/low *
Share of very fine & fine rootshigh/ /highlow/ high/high
Share of interior linkshigh/ low/highlow/high /low
Number of total links low/ low/high/high/low
Topological index Low//high/highhigh/
Publisher’s Note: MDPI stays neutral with regard to jurisdictional claims in published maps and institutional affiliations.

