Article

Vertical Distributions of Soil Nutrients and Their Stoichiometric Ratios as Affected by Long Term Grazing and Enclosing in a Semi-Arid Grassland of Inner Mongolia

Jilin Provincial Laboratory of Grassland Farming, Northeast Institute of Geography and Agroecology, Chinese Academy of Sciences, Changchun 130102, China
*
Author to whom correspondence should be addressed.
Agriculture 2020, 10(9), 382; https://doi.org/10.3390/agriculture10090382
Submission received: 25 July 2020 / Revised: 12 August 2020 / Accepted: 25 August 2020 / Published: 31 August 2020

Abstract

:
Grazing and enclosing are two of the most important grassland managements. In order to evaluate the effects of different managements on the ecosystem balance of grassland, the vertical distributions of soil nutrients and their stoichiometric ratios were determined in the plots of grazing and enclosing over 38 years in a semi-arid grassland of Inner Mongolia. The results showed that total nitrogen (TN), total phosphorus (TP), available nitrogen (AN), calcium (Ca), magnesium (Mg) and sulfur (S) contents in 0–100 cm soil in the long term enclosing plot were lower than the long term grazing plot and these changes were much greater in the surface soil than in deep soil. However, the soil organic carbon (SOC) and available phosphorus (AP) contents in the long term enclosing plot in the surface soil were higher (p < 0.01) compared with the long term grazing plot. In addition, long term enclosing increased the C/N ratio in each soil layer and improved C/K and C/P ratios in the surface soil compared with long term grazing. However, significant decreases of N/P and N/K ratios in the long term enclosing plot in each soil layer were observed. In conclusion, enclosing for 38 years decreased most of nutrients and reduced the nutrients’ mineralization in the surface soil especially and thus might restrict nutrients cycling in a semi-arid grassland of Inner Mongolia.

1. Introduction

Grazing and enclosing are two of the most important grassland managements, which can directly or indirectly affect the balance of the ecosystem [1,2]. At present, many studies have focused on the effects of grazing and enclosing on grassland ecosystems; however, the results of these researches are very different [3,4,5]. Moderate grazing highlights the link and feedback between plant response and nutrient cycling and increases the primary production by compensatory growth [6]. However, unreasonable grazing often leads to a reduction in biodiversity of the ecosystem [7]. Enclosing is widely believed to be an economic, effective and simple method to recover the degenerated grassland ecosystem [3,8], which can improve vegetation cover, richness and biomass of species, as well as litter accumulation [9]. However, some scholars have found that enclosing might destroy the over compensation growth mechanism of herbage and decline the turnover rate of grassland productivity [10].
Ecological stoichiometry is a science that combines the ultimate principles of various subjects such as biology, chemistry and physics and can be used to study the balance of biological systems [11]. Many scholars have made great efforts to monitor the stoichiometric ratios of carbon (C), nitrogen (N) and phosphorus (P) in terrestrial ecosystems by more interest in biogeochemical cycles [12,13,14]. Previous studies have revealed that grazing could regulate the spatial pattern of C:N:P ratios through a cascade of plant-soil feedback [15,16,17]. The studies of ecological stoichiometry mainly focus on plants or plant tissues, while there are rarely studies on soil nutrients [18,19]. Soil is one of the essential conditions for plant life and its quality plays a key role in plant growth. Soil stoichiometric ratios of C, N and P can reflect the limited elements in soil [14,20] and are considered as important indicators for the structure and function of an ecosystem [21]. In addition, some research has found that the stoichiometric ratios between K and other nutrients strongly respond to environmental changes [22,23], which had been largely ignored [24].
Grazing and enclosing also directly impact the amounts and compositions of soil nutrients through their effects on plant growth, accumulation and decomposition of litter and soil erosion. At present, many studies have focused on the changes of soil C, N and P contents with different grassland managements. Soil C is an essential life element for plants and N and P are necessary mineral nutrients for plant growth [25]. Moreover, calcium (Ca), magnesium (Mg) and sulfur (S) are also essential mineral nutrients and available nitrogen (AN), available phosphorus (AP) and available potassium (AK) play vital roles in plant growth as well. The imbalance of these soil nutrients could not only restrict the growth of plant, but also affect the structure and function of a grassland ecosystem [26].
The stoichiometric characteristics of soil are closely related to grazing or enclosing patterns. Therefore, the outside (long term grazing) and inside (long term enclosing) of fenced plots were studied over a period of 38 years in a semi-arid grassland of Inner Mongolia. The study aimed to analyze the vertical distributions of soil mineral nutrients and stoichiometric ratios of C, N, P and K in the long term grazing plot and the long term enclosing plot. This study would greatly improve our knowledge on the elements cycling and balance mechanisms of soil C, N, P and K and might be helpful to provide basic guidelines for grassland management in a semi-arid grassland of Inner Mongolia.

2. Materials and Methods

2.1. Study Site and Experimental Design

This study was conducted at the Inner Mongolia Grassland Ecosystem Research Station (43°38′ N, 116°42′ E) of the Chinese Academy of Sciences, which is located in Xilin River Basin of Inner Mongolia, China [27]. The region has a semi-arid steppe climate with an annual average temperature of 2.3 °C, annual average precipitation of 330 mm and annual evaporation of 4–5 times than that of the precipitation. The soil is described as a dark chestnut with a loamy sand texture [28]. The typical original pasture species were Leymus chinensis and Stipa grandis. Strong winds occur in 3–5 months with an average monthly speed of up to 4.9 m/s. Wind erosion and dust storms are the common phenomena in this region [29]. The experimental site is composed of two grassland managements including a long term grazing plot and a long term enclosing plot. Up to the sampling year of 2018, the enclosing plot was fenced for 38 years (since 1981), which had long term excluded livestock. We researched the biomass and litter in these two grassland plots in 2018. The results showed that the amounts of dry matter of green plant in the long term grazing plot and the long term enclosing plot was 114.8 g/m2 and 160.9 g/m2, respectively. The amounts of litter dry matter in the long term enclosing plots reached 494.3 g/m2 while there was almost no litter in the long term grazing plot.

2.2. Sampling and Analysis

The total sampling area was 5000 m2. A typical transect (50 m long) was randomly located in each plot on 9 August 2018. Five quadrats were established at 10 m intervals for soil sampling within each transect. Five soil sampling locations were evenly spaced and treated as five replications within each transect. From each soil sampling location, three soil cores were collected (0–10 cm, 10–20 cm, 20–30 cm, 30–50 cm, 50–70 cm and 70–100 cm depth) to make a composite sample. Soil samples were placed into plastic bags and then transported to the laboratory where they were air-dried. The soil was then coarsely ground through a 2 mm sieve after stones, visible roots fragments and other plant materials were removed. The sieved samples (<2 mm) were used for the determination.
Soil organic carbon was measured by the H2SO4-K2Cr2O7 oxidation method [30]. The total nitrogen (TN) was determined according to the Kjeldahl method [30]. Total phosphorous (TP), total potassium (TK), calcium (Ca), magnesium (Mg) and sulfur (S) were determined using a flame atomic absorption machine (Model AA240, Varion, Palo Alto, CA, USA) with HF-HNO3 digested [30]. The available nitrogen (AN), available phosphorous (AP) and available potassium (AK) were determined by a diffusion method, a UV spectrophotometer method and a flame photometer method, respectively [30]. C:N, C:P, C:K, N:P and N:K was the SOC/TN ratio, SOC/TP ratio, SOC/TK ratio, TN/TP ratio and TN/TK ratio, respectively.

2.3. Statistical Analysis

SPSS software version 10.0 (SPSS for Windows Inc., Chicago, Illinois, USA) was used to statistically analyze all the data. One-way analysis of variance (ANOVA) was used to calculate the standard errors and compare the means. Multiple comparisons among means of soil parameters between two plots in one soil deep were performed with Tukey’s honestly significant difference (HSD) test. OriginPro 8.0 software (OriginLab, Northampton, MA, USA) was used to draw figures.

3. Results

3.1. Soil Nutrients

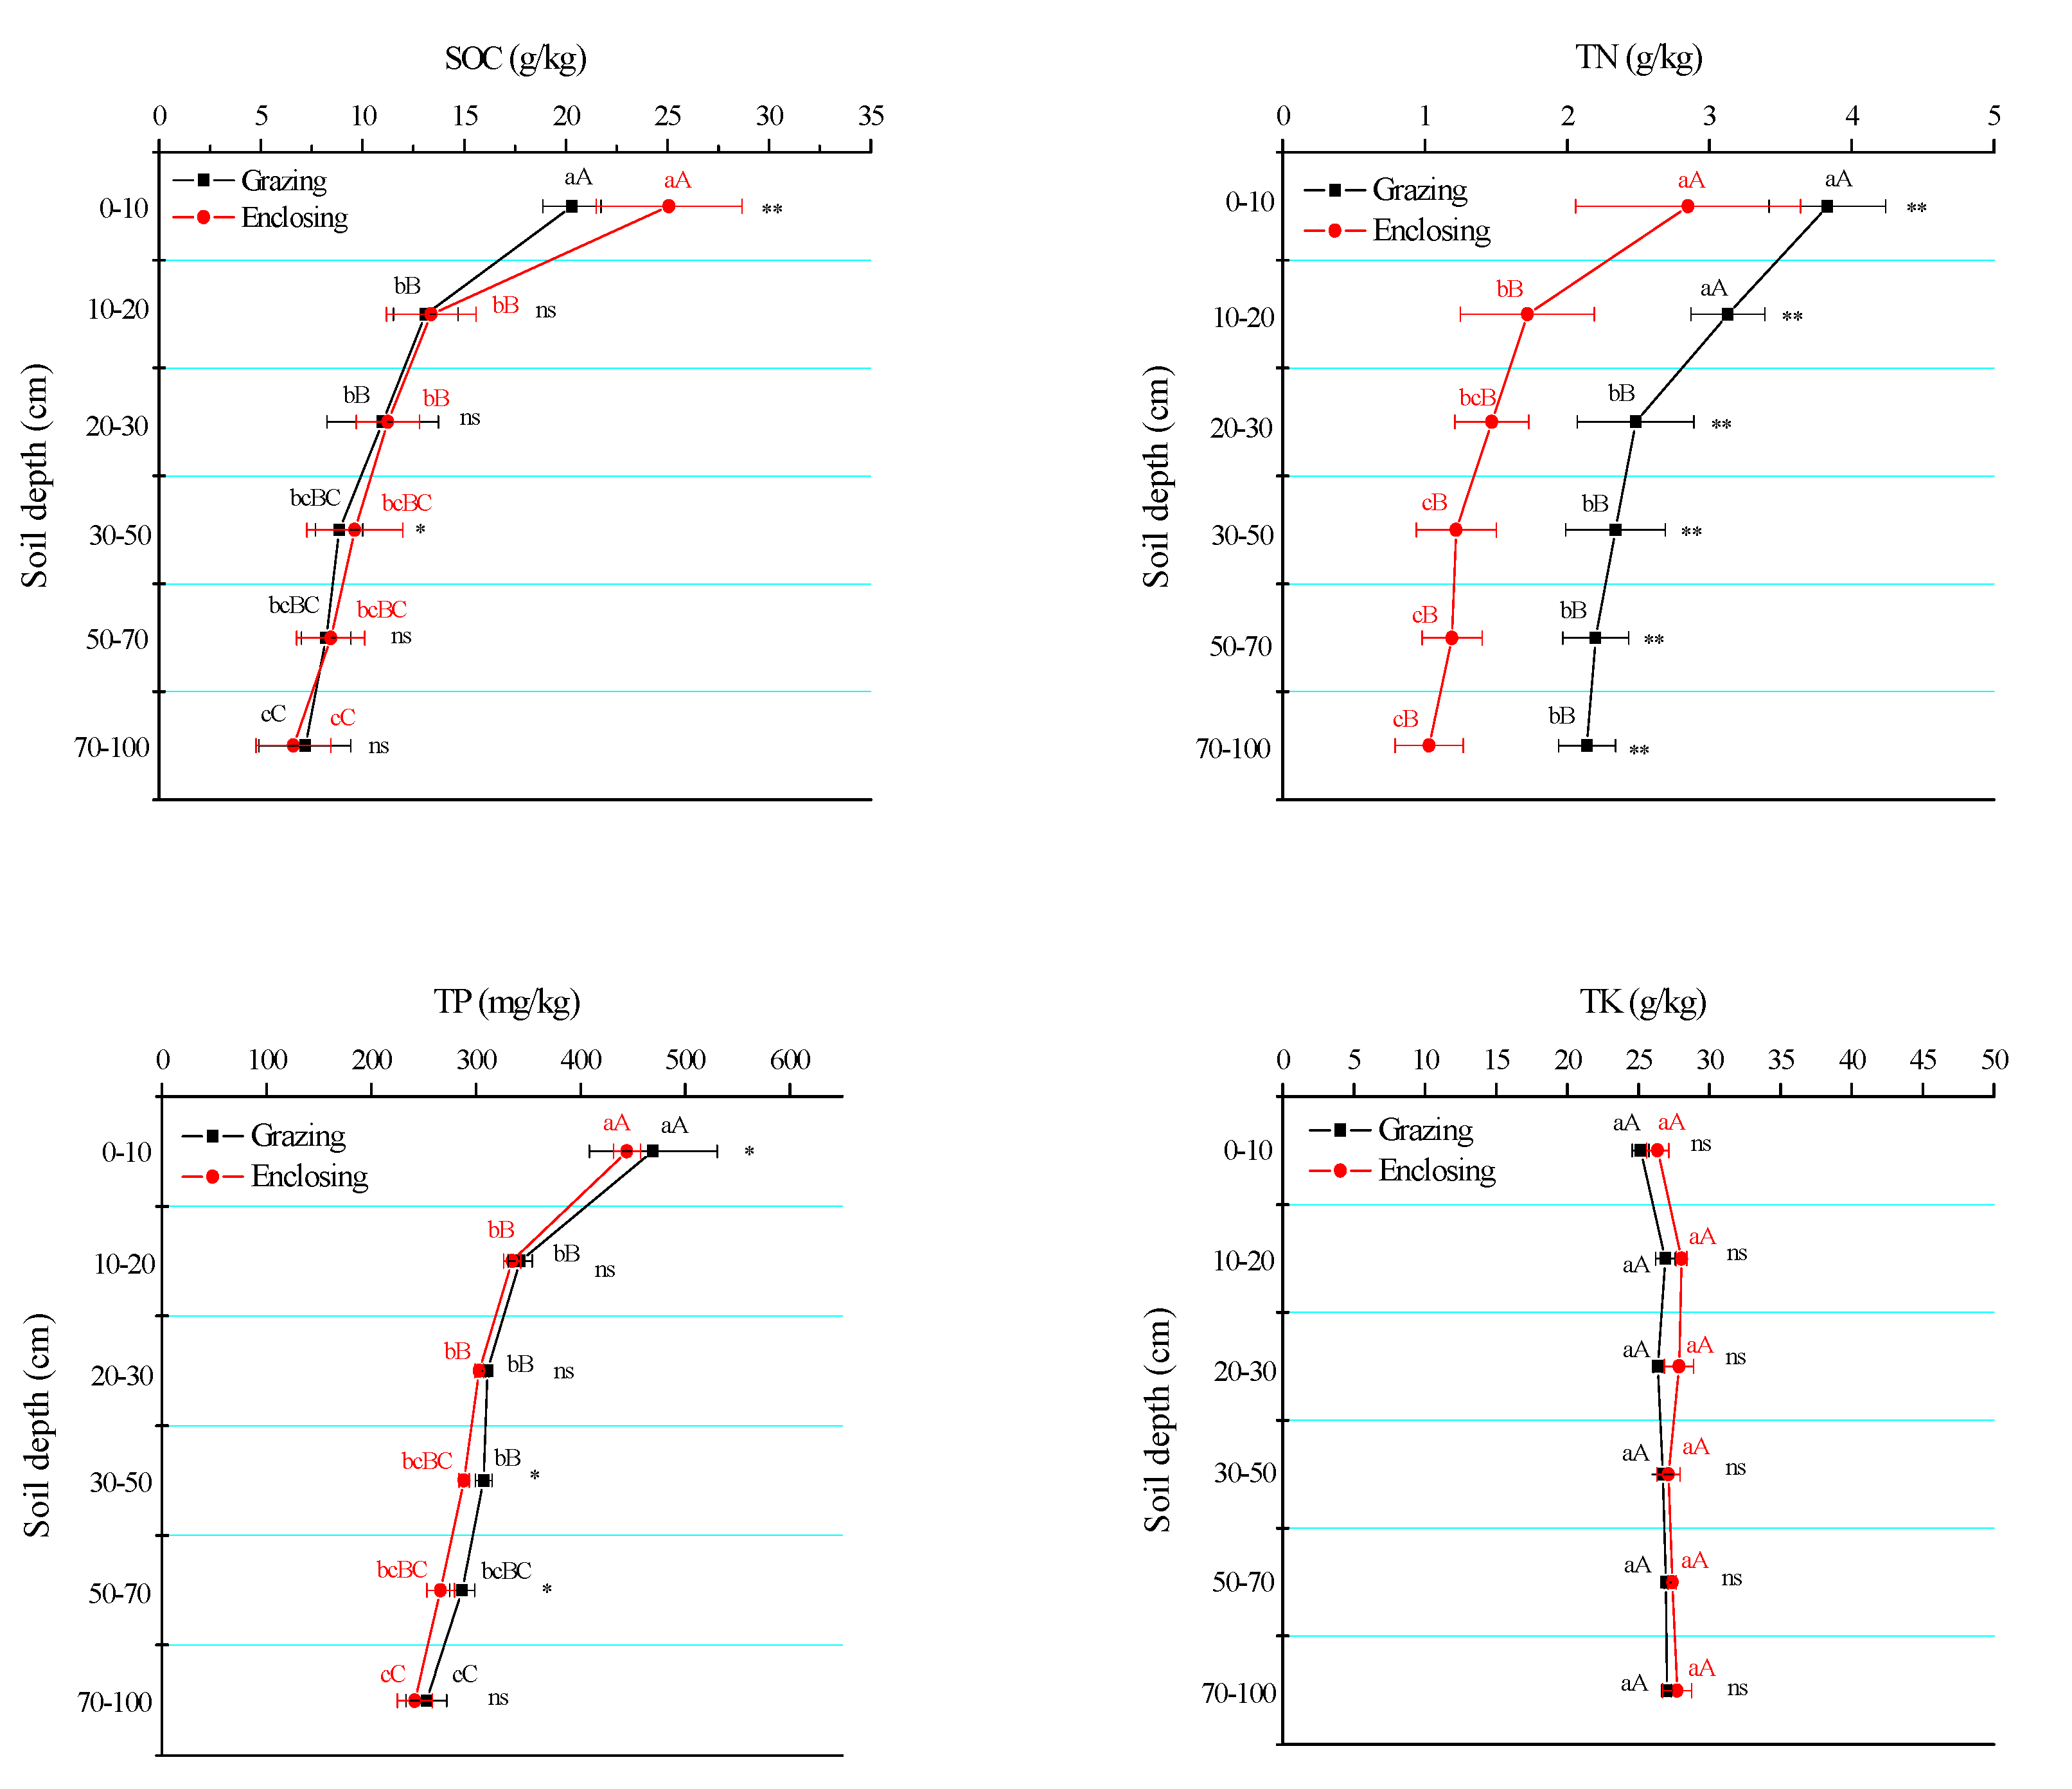
3.1.1. Contents of Soil SOC, TN, TP and TK

The SOC and TK contents in the long term enclosing plot were lower than the long term grazing plot, while TN and TP contents were higher (Figure 1). The SOC content in 0–10 cm soil in the long term enclosing plot was 19.1% (p < 0.01) higher relative to the long term grazing plot, whereas there was little change below the surface soil. The SOC contents showed declining trends with the increase of soil depth and largely accumulated in 0–10 cm soil in these two plots. The SOC content in the long term grazing plot and the long term enclosing plot in 0–10 cm soil was 54.9% (p < 0.01) and 87.4% (p < 0.01) higher than 20–30 cm soil, respectively. A significant decrease (p < 0.01) of TN content in the long term enclosing plot in each soil layer was observed relative to the long term grazing plot. The TN content in the long term grazing plot in 0–20 cm soil was significantly higher than other soil layers and in 0–10 cm soil and 10–20 cm soil was 54.5% and 26.3% higher than 20–30 cm soil, respectively. The TN content in the long term enclosing plot in 0–10 cm soil was significantly higher than other soil layers and was 65.8% and 93.2% higher than 10–20 cm soil and 20–30 cm soil, respectively. The TP content in the long term enclosing plot in 0–10 cm soil was 5.7% (p < 0.05) lower than the long term grazing plot and was 6.6% (p < 0.05) and 7.7% (p < 0.05) higher than 30–50 cm soil and 50–70 cm soil, respectively. The TP content also mainly accumulated in 0–10 cm soil and was 37.2% (p < 0.01) and 32.8% (p < 0.01) higher than 20–30 cm soil in the long term grazing plot and the long term enclosing plot, respectively. Long term grazing slightly decreased the TK content in 0–30 cm soil and there was almost no change below 30 cm soil.

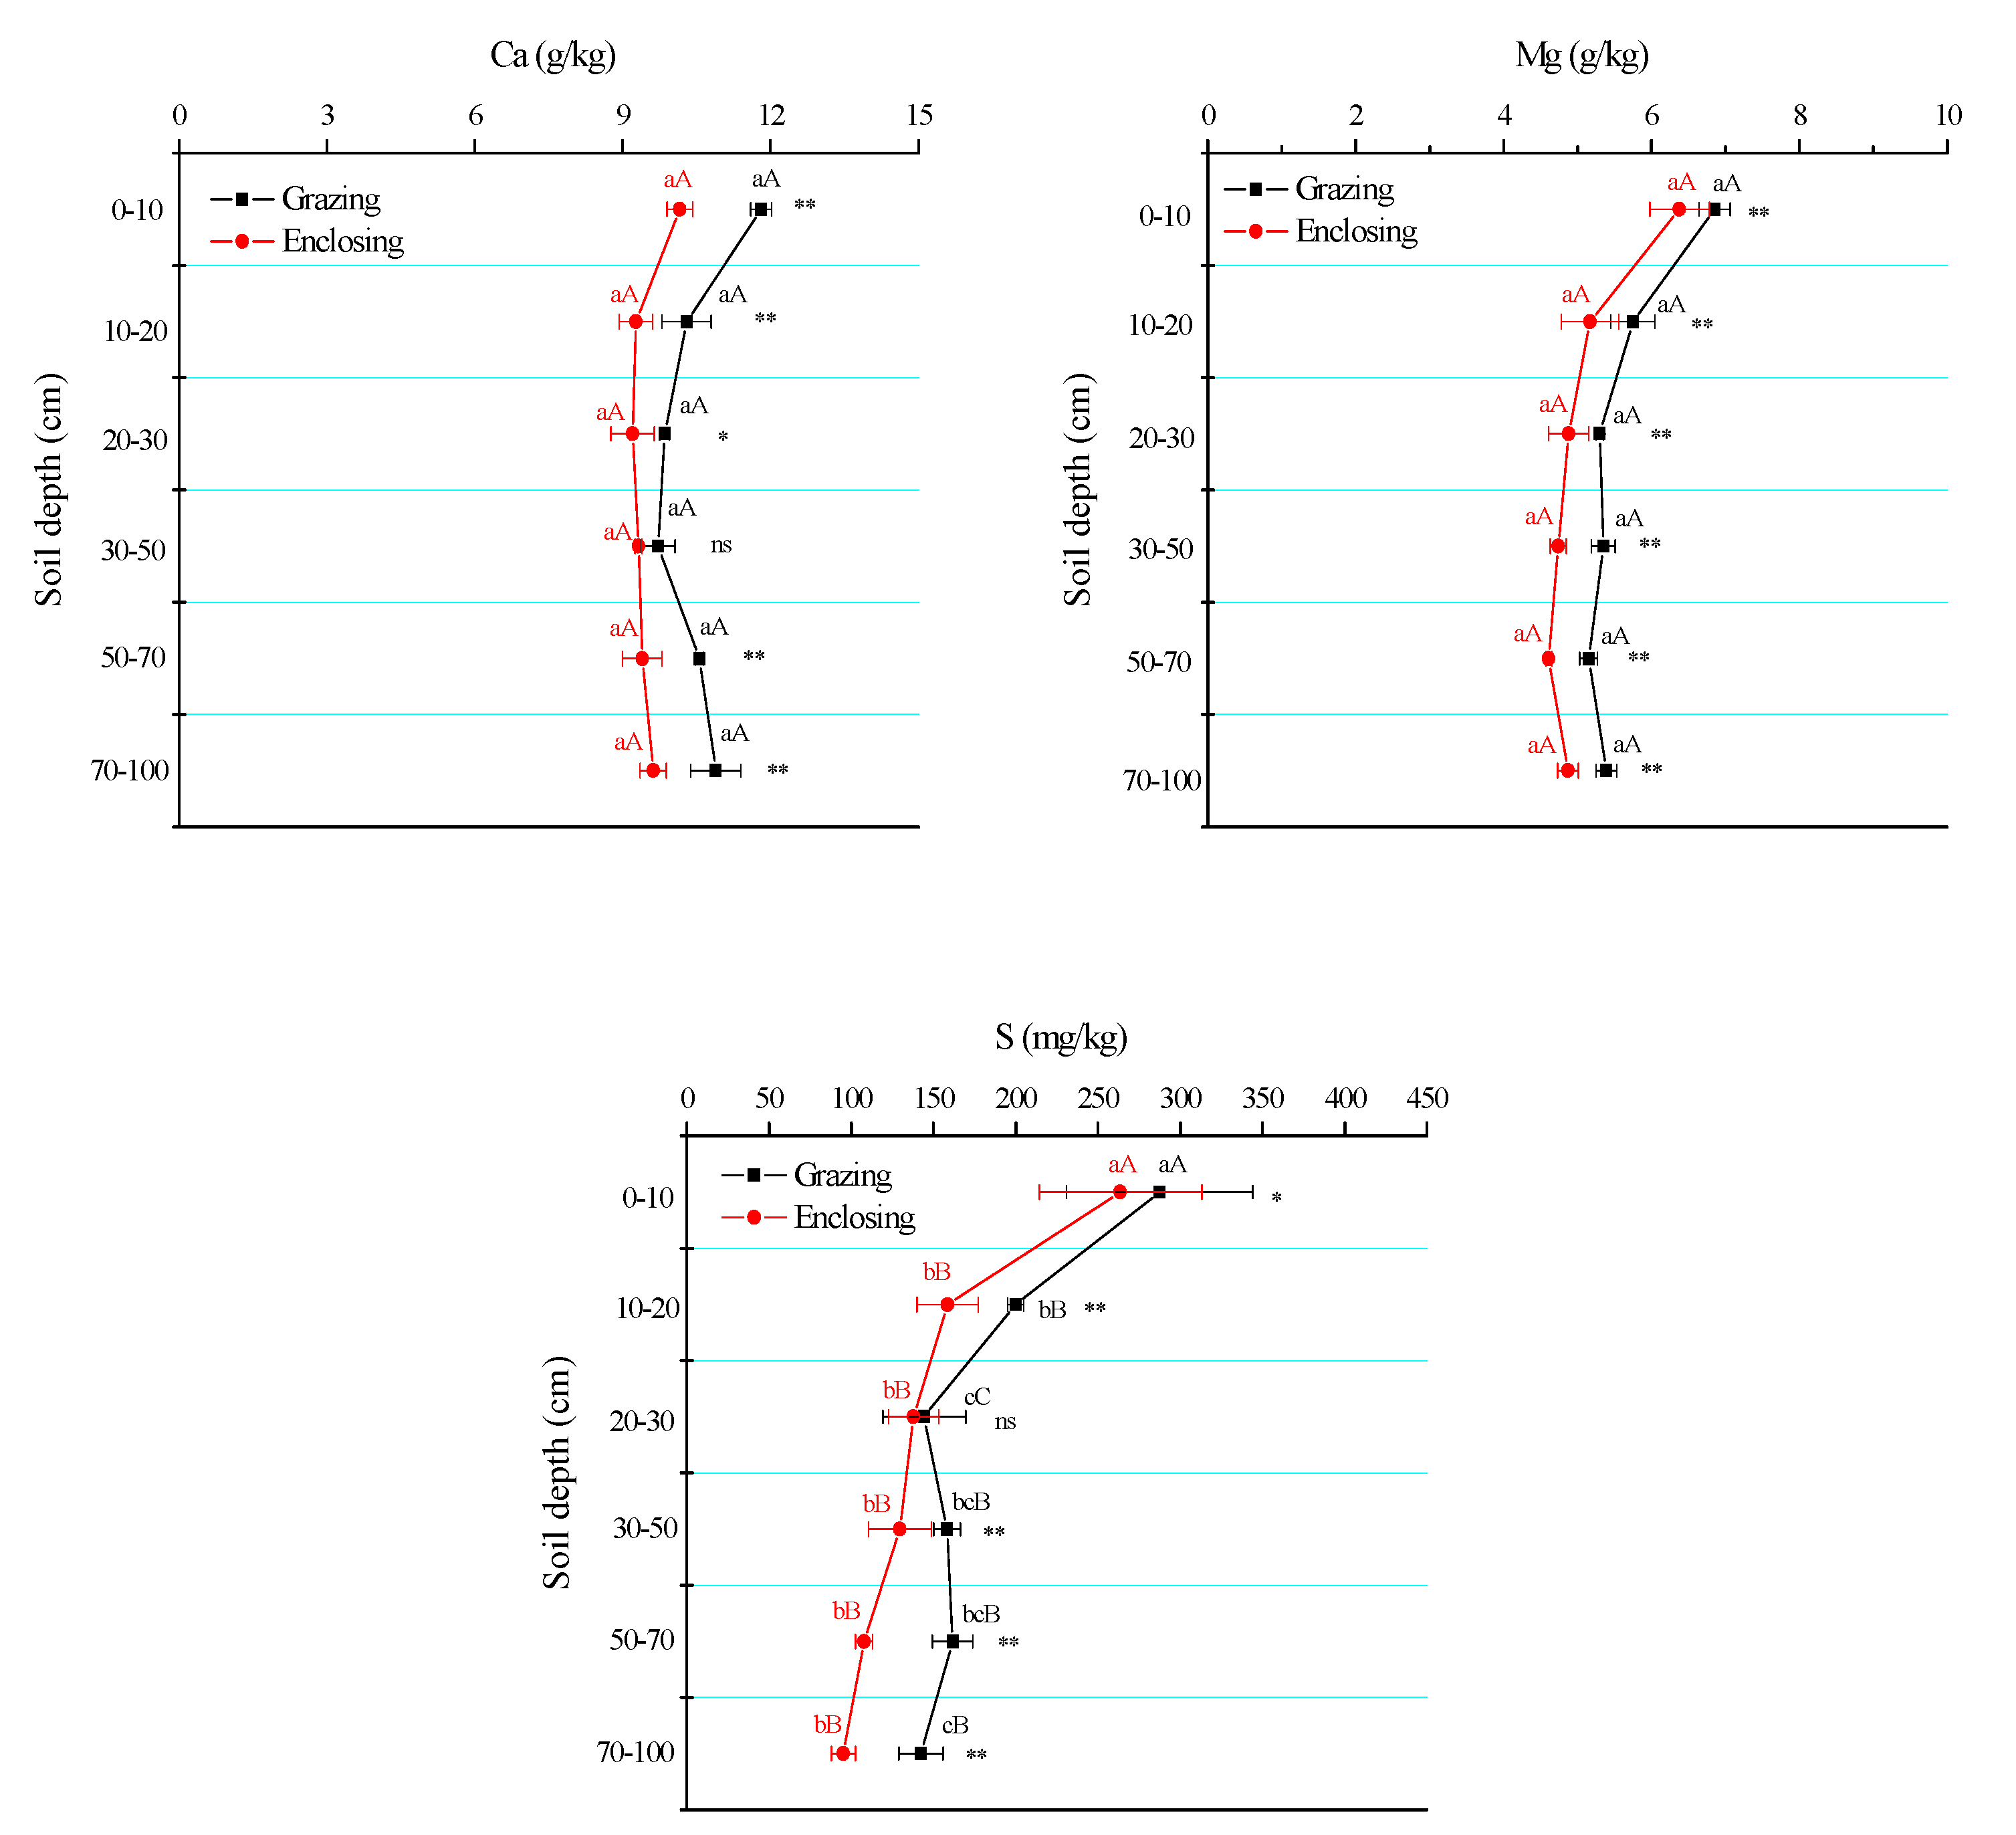
3.1.2. Contents of Soil Ca, Mg and S

Long term enclosing decreased Ca, Mg and S contents in each soil layer compared with long term grazing (Figure 2). The Ca content in the long term enclosing plot was 16.2%, 11.1%, 12.3% and 13.2% lower (p < 0.01) than the long term grazing plot in 0–10 cm, 10–20 cm, 50–70 cm and 70–100 cm soil, respectively. The Mg content in the long term enclosing plot was 7.3%, 11.4%, 8.6%, 13.0%, 11.6% and 10.8% higher (p < 0.01) than the long term grazing plot in 0–10 cm, 10–20 cm, 20–30 cm, 30–50 cm, 50–70 cm and 70–100 cm soil, respectively. In the long term grazing plot and the long term enclosing plot, no significant differences of Ca and Mg contents in each soil layer were observed but Ca and Mg contents in 0–10 cm soil were higher than other soil layers. With the increase of soil depth, the Ca content in the long term grazing plot in 0–50 cm soil showed a slight decline and in 50–70 cm soil showed a slight increase. Compared with the long term grazing plot, the S content in the long term enclosing plot was 9.0% lower (p < 0.05) in 0–10 cm soil and was 26.0%, 21.9%, 50.0% and 49.7% lower (p < 0.01) in 10–20 cm, 30–50 cm, 50–70 cm and 70–100 cm soils, respectively. With the increase of soil depth, the S content in the long term grazing plot significantly decreased in 0–30 cm soil and slightly increased in 30–70 cm soil. The S content in the long term enclosing plot decreased with the increase of soil depth and the S content in 0–10 cm soil was significantly higher (p < 0.01) than other soil layers.

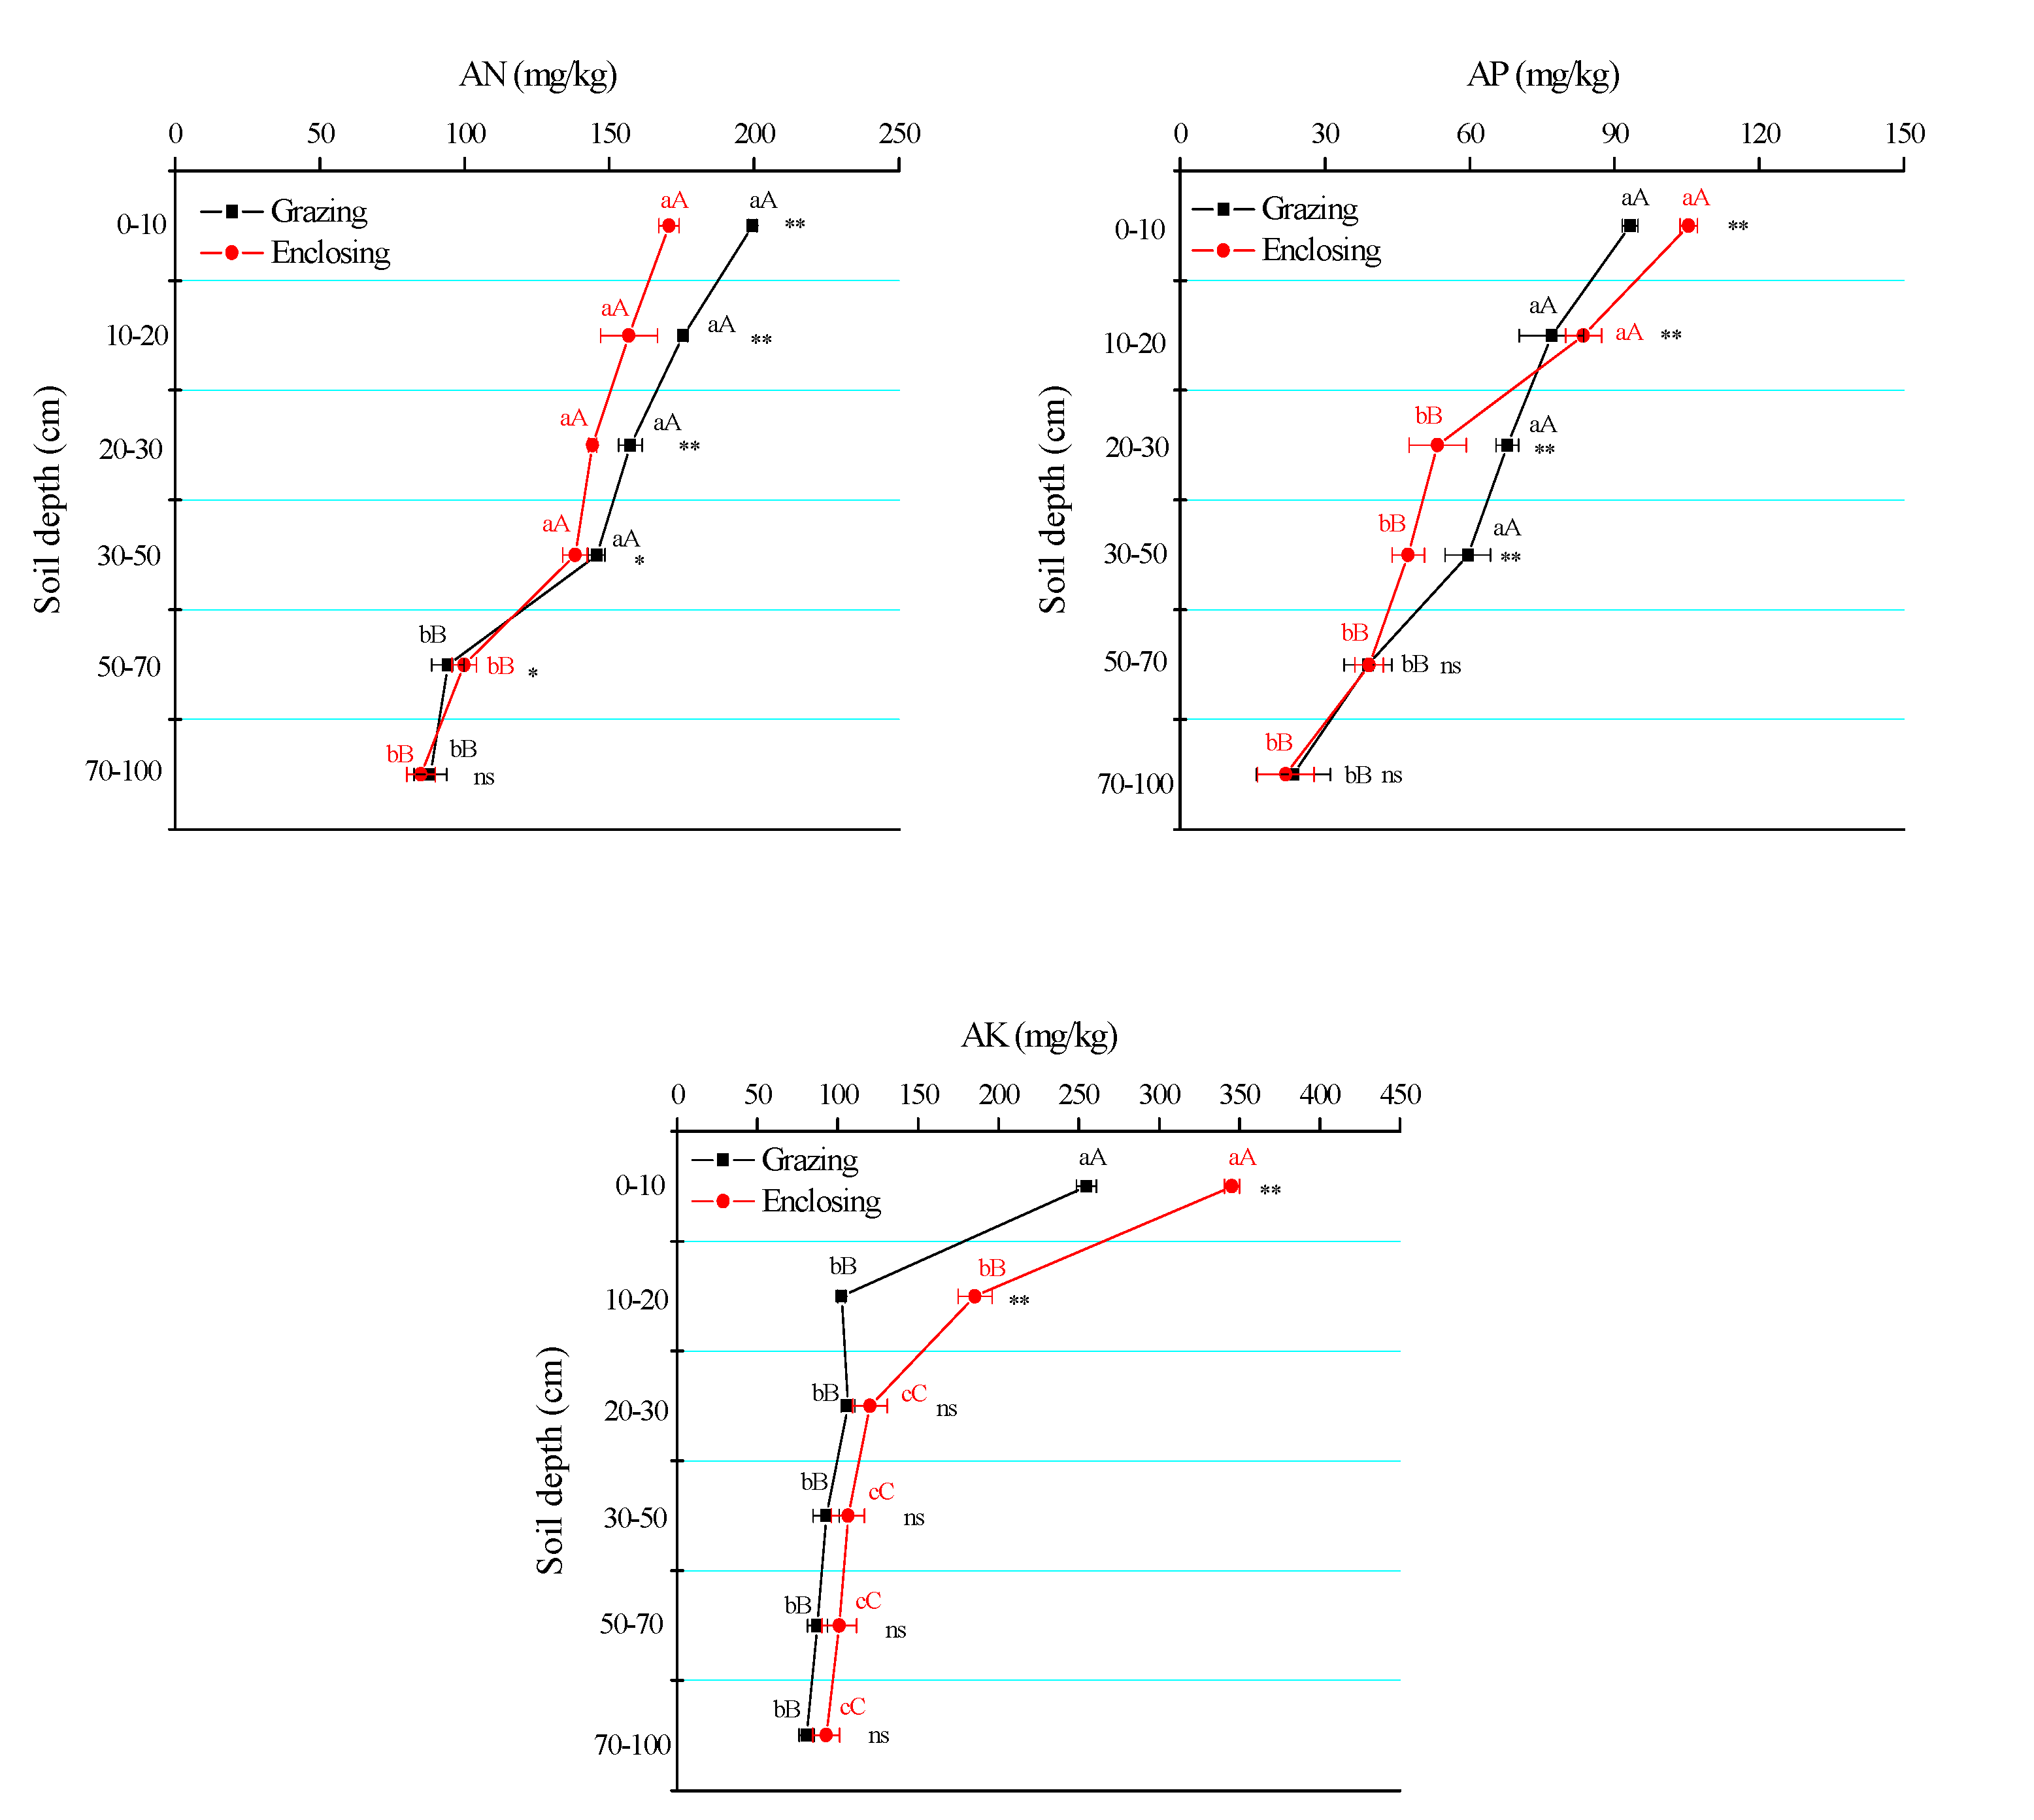
3.1.3. Contents of Soil AN, AP and AK

Long term enclosing significantly decreased the AN content in 0–30 cm soil and was 17.0%, 11.9% and 9.1% lower (p < 0.01) in 0–10 cm, 10–20 cm and 20–30 cm soils rather than long term grazing, respectively (Figure 3). The AN content in the long term grazing plot and the long term enclosing plot decreased with the increasing of soil depths and were higher (p < 0.01) in 0–50 cm soil than in 50–100 cm soil. The AN content in the long term grazing plot and the long term enclosing plot in 0–10 cm soil was 111.6% and 70.8% higher than that of 50–70 cm soil, respectively. Compared with long term grazing, long term enclosing increased the AK content (p < 0.01) in 0–20 cm soil and was 26.2% and 44.8% higher (p < 0.01) in 0–10 cm soil and in 10–20 cm soil, respectively. The AK content in the long term grazing plot in 0–10 cm soil was significantly higher (p < 0.01) than that of other soil layers and was 148.8% higher (p < 0.01) than 10–20 cm soil. The AK content in the long term enclosing plot in 0–20 cm soil was significantly higher (p < 0.01) than that of other soil layers and was 86.2% and 54.45% higher (p < 0.01) in 0–10 cm soil and 10–20 cm soil than 20–30 cm soil, respectively. The AP content in 0–10 cm soil and in 10–20 cm soil in the long term enclosing plot was 11.6% and 8.0% higher (p < 0.01) relative to the long term grazing plot, respectively. The AP content in the long term enclosing plot in 0–20 cm soil was significantly higher (p < 0.01) than in other soil layers.

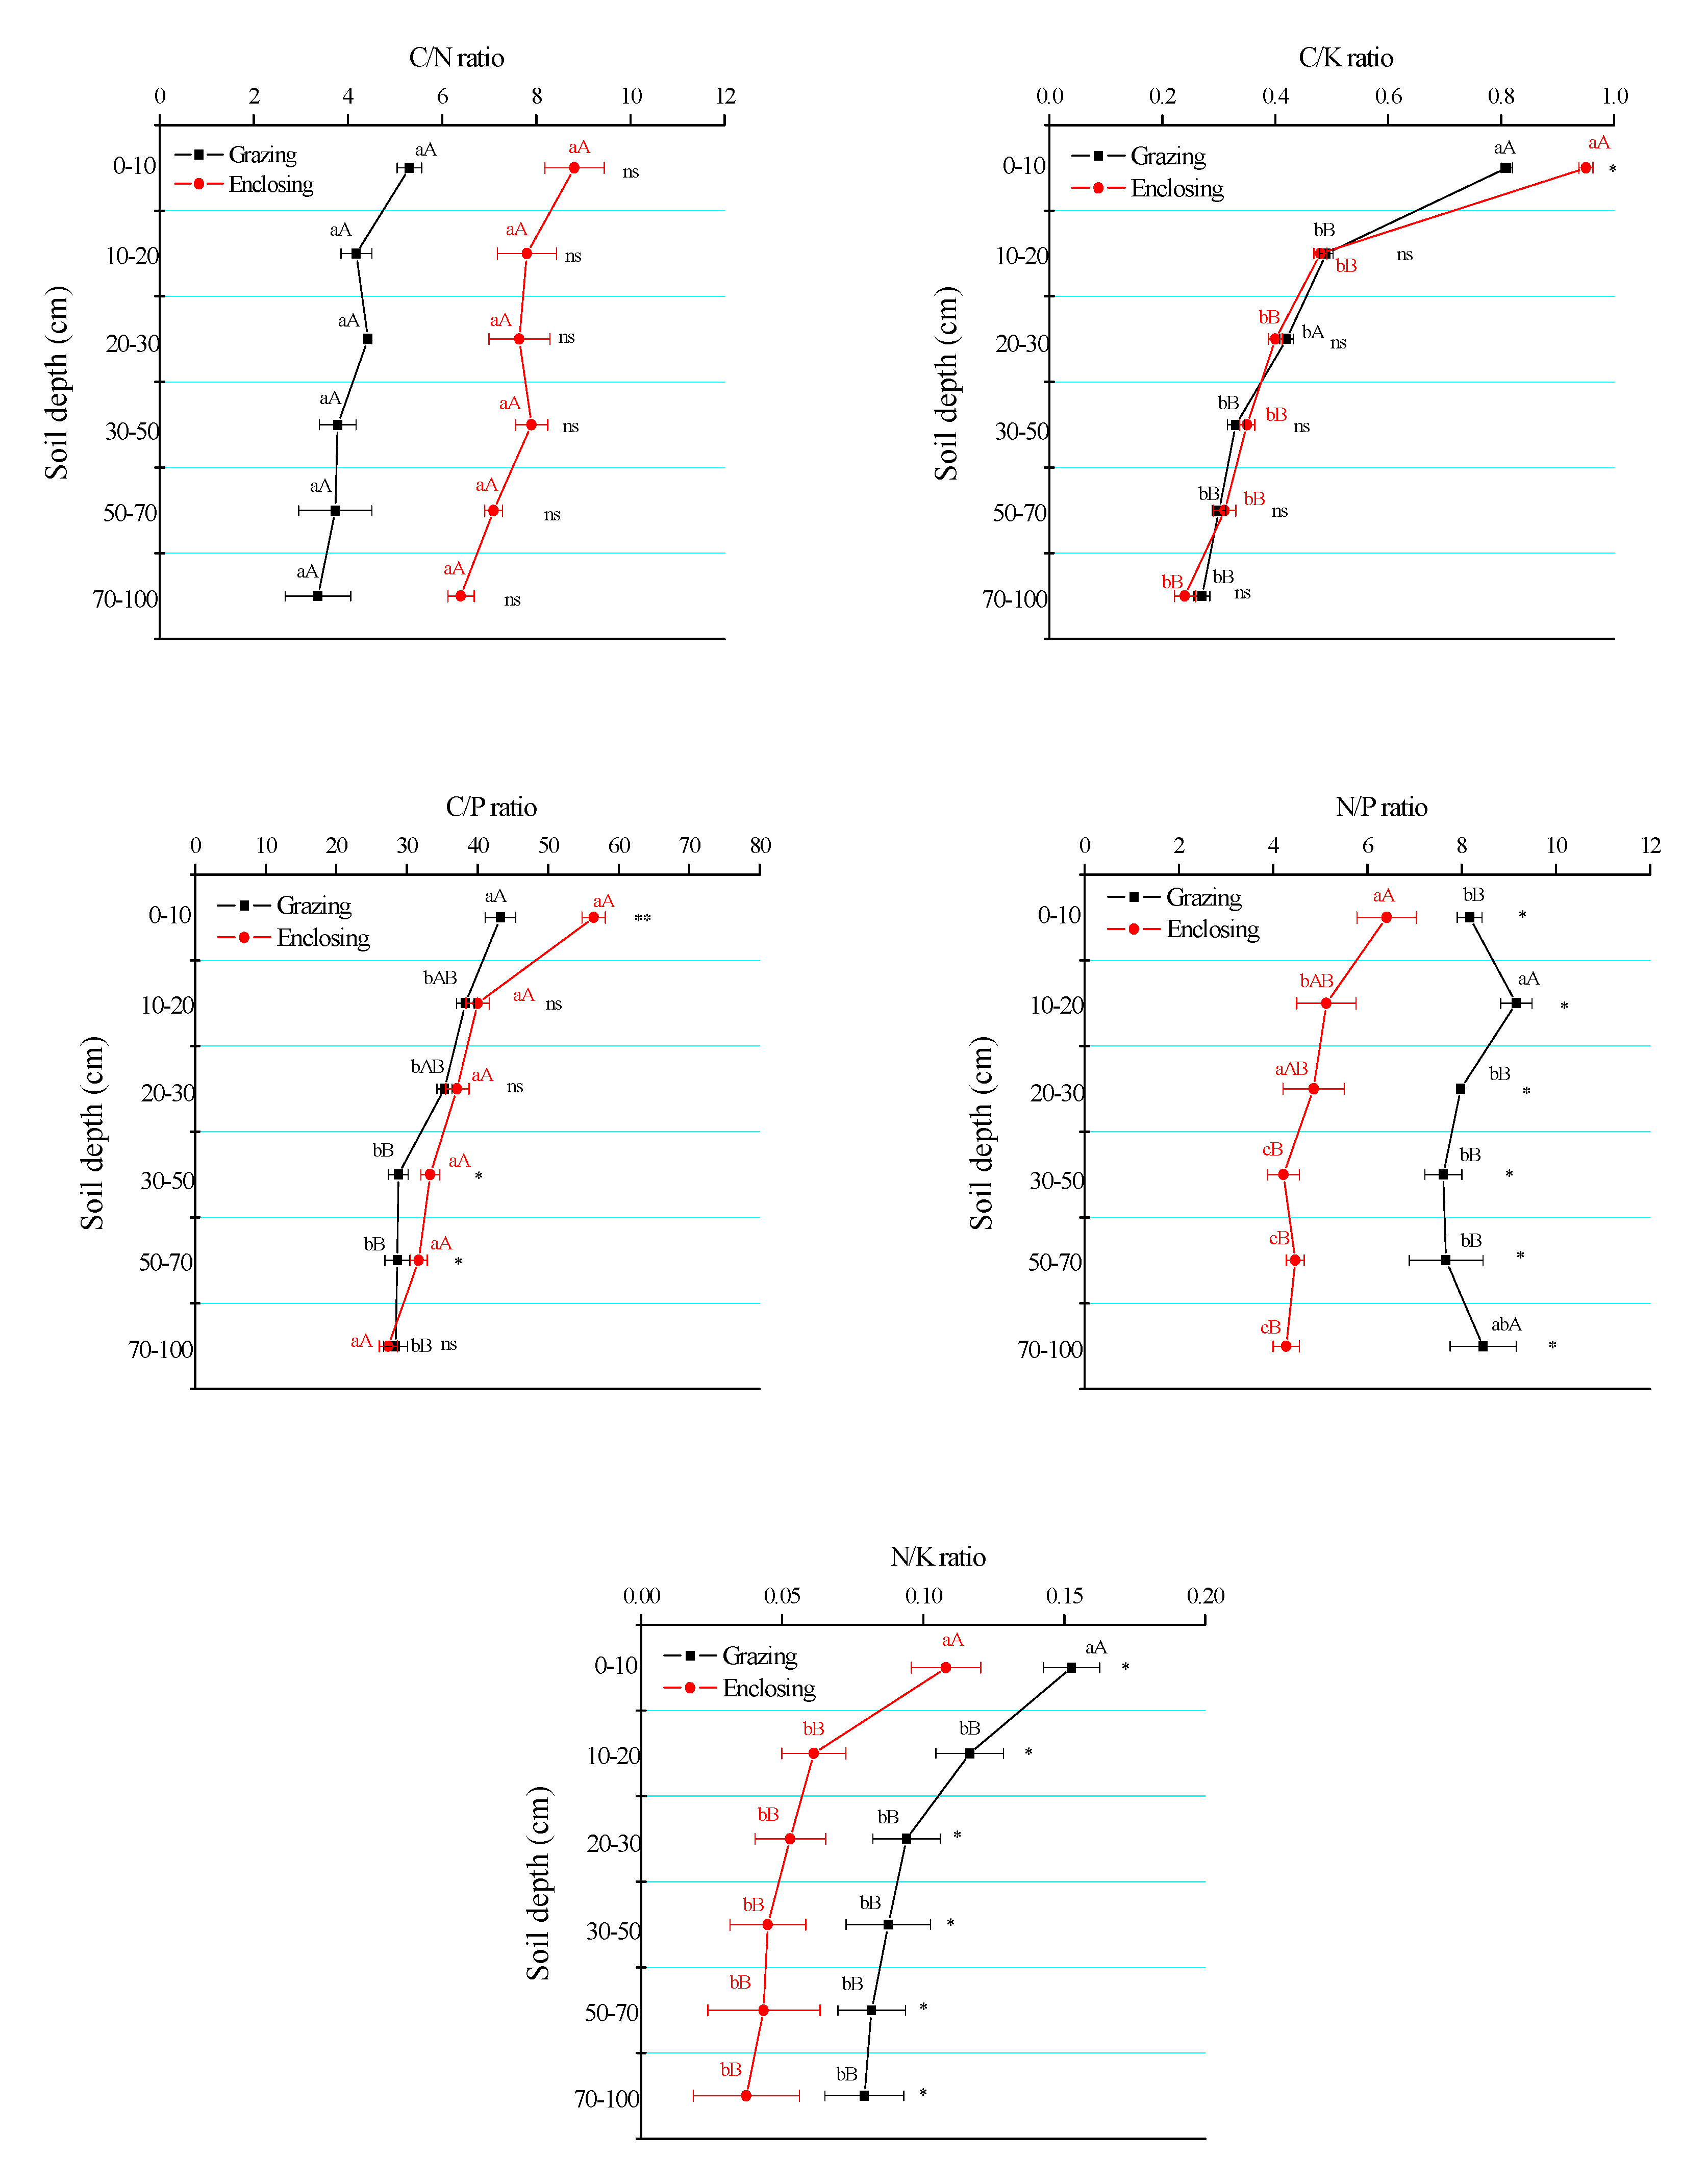
3.2. Stoichiometric Ratios of Soil Nutrients

Long term enclosing increased the C/N ratio in each soil layer compared with long term grazing and was 39.9%, 46.4%, 42.0%, 52.2%, 47.3% and 47.5% higher in 0–10 cm, 10–20 cm, 20–30 cm, 30–50 cm, 50–70 cm and 70–100 cm soil, respectively (Figure 4). Long term enclosing increased the C/P ratio and C/K ratio in the surface soil and was 23.4% (p < 0.01) and 15.2% (p < 0.05) higher in 0–10 cm soil compared with long term grazing. The C/P ratios and C/K ratios decreased with the increase of soil depths in the long term grazing plot and the long term enclosing plot and were significantly higher (p < 0.01) in 0–10 cm soil rather than other soil layers. In 0–10 cm soil, the C/P ratio in the long term grazing plot and the long term enclosing plot was 13.0% and 41.2% higher than 10–20 cm soil, respectively and the C/K ratio was 65.8% and 99.5% higher, respectively. Long term enclosing significantly decreased the N/P ratio and was 27.4%, 78.4%, 64.1%, 80.5%, 71.6% and 97.8% higher in 0–10 cm, 10–20 cm, 20–30 cm, 30–50 cm, 50–70 cm and 70–100 cm soil compared with long term grazing. The N/P ratio in the long term enclosing plot was the highest in 0–10 cm soil and the N/P ratio in the long term grazing plot was the highest in 10–20 cm soil. The N/K ratio in the surface soil was obviously higher than in other soil layers and it was slightly lower in the long term enclosing plot relative to the long term grazing plot.

3.3. Correlations of Soil Nutrient Contents and Their Stoichiometric Ratios

There were significant correlations that existed among soil nutrients and their stoichiometric ratios (Table 1). The SOC content was positively correlated (p < 0.01 or p < 0.05) with TN, TP, AN, AP and AK contents and C/P, C/K and N/K ratios. The TN content was positively correlated (p < 0.01 or p < 0.05) with TP, Ca, AN and AP contents and C/K, N/P and N/K ratios. The TP content was positively correlated (p < 0.01) with AN, AP and AK contents and C/P, C/K and N/K ratios. The AN, AP and AK contents were positively correlated (p < 0.01) with the C/P and C/K ratios. The Mg and S contents were significantly correlated (p < 0.01 or p < 0.05) with the SOC, TN, TP, AN, AP, AK and Ca contents and the C/P, C/K and N/K ratios. The Mg and S contents were negative correlated (p < 0.01) with the TK content. The TK content was significantly negatively correlated (p < 0.01 or p < 0.05) with the TN, TP and Ca contents and the C/K, N/P and N/K ratios.

4. Discussion

4.1. Soil Nutrients

Soil C is an essential life element for plants. N, P, K, Ca, Mg and S are essential mineral nutrients that play vital roles in plant growth. The imbalance of these soil nutrients could not only restrict plant growth, but also affect the structure and function of grassland ecosystems [26]. Soil nutrients of grassland are closely related to livestock consumption and decomposition rates of litter and dung [13,31]. There were large differences of soil nutrients between the two grassland plots, suggesting that long term grazing and long term enclosing significantly affected soil nutrients. SOC primarily comes from fragments produced by litter, root secretion and fine root. This study found that the SOC content of long term grazing in 0–10 cm soil was 23.5% lower (p < 0.01) relative to long term enclosing and there was little change below the surface soil, which indicated that long term grazing significantly decreased the SOC content in the surface soil. This might be attributed to the declined annual net primary production (ANPP) and the increased soil erosion loss from reduced ground cover that was caused by grazing [3,32]. In addition, grazing could seriously damage soil aggregate and improve organic matter decomposition, which was not beneficial to SOC accumulation. However, this study showed that long term grazing increased TN, TP, AN, Ca, Mg and S contents. It was consistent with Gillet et al. who found that moderate grazing was beneficial to soil nutrient accumulation [4]. On the one hand, grazing animals only retained a small proportion of ingested nutrients and about 75–95% was returned to soil in the form of dung and urine. In addition, the relatively faster decomposition rate of litter in grazing grassland also supplemented more nutrients to the soil [5]. On the other hand, greater vegetation in the long term enclosing grassland needed more soil nutrients. In addition, the relatively slower decomposition rate of litter accumulated in the long term enclosing grassland might limit the return of nutrients and most of the nutrients might exist in the litter. In this study, long term grazing slightly decreased the TK content and significantly decreased the AK content in the surface soil, which might be closely related to the absorption and assimilation of K by grazing animals. Dickinson et al. reported that nutrients such as P, Ca and Mg feeding by cattle was excreted into grassland by 65%, 78% and 80%, respectively and K was excreted into grassland by only 11% [33]. It might be responsible for the slight reduction of the TK content in the long term grazing grassland. We found that long term grazing significantly increased the AN content in 0–30 cm soil compared with long term enclosing, which might be attributed to the higher mineralization of organic N caused by the decomposition of dung. Nutrients and minerals in animal dung were more available for plant growth than those in soil. Moreover, grazing could increase C-rich root exudates and stimulate microbial activity and ultimately result in an increase of soil available nutrients for plant growth [34,35]. Animal dung contributed to higher AN, AP and water-soluble K concentrations in grazing grassland than in grazing excluded grassland. However, in our study, long term grazing significantly decreased the AK content and the AP content in the surface soil compared with long term enclosing. The study also showed that the SOC content was positively correlated with AK (r = 0.962, p < 0.01) and AP (r = 0.904, p < 0.01), therefore the decrease of AK and AP in the surface soil in the long term grazing plot might be attributed to lower SOC.
The study showed that most of the nutrients mainly distributed in the surface soil in these two grassland plots. Animal dung contributed to the higher available nutrient concentrations in the surface soil than in deep soil under the action of microbial activities. In addition, soil nutrients mainly came from the litter accumulated on the surface soil. Organic matter was formed in the surface soil in the process of litter decomposition by microorganism. Moreover, it was also attributed to the atmospheric input and legume-plant fixation of N, vegetation dieback input near the soil surface and stratification by vegetation that redistributed from a deeper depth towards the surface [36].

4.2. Soil Stoichiometric Ratios

A stoichiometric ratio of soil nutrients is a useful tool to measure soil organic matter composition and evaluate the mineralization of soil nutrients [12]. The soil C/N ratio can reveal the balances of carbon and nitrogen and indicate the soil nitrogen mineralization [37,38]. A lower soil C/N ratio is beneficial for nitrogen mineralization and can promote nitrogen absorption. Our results showed that the C/N ratio in each soil layer in the long term grazing plot was lower than the long term enclosing plot. It indicated that long term grazing accelerated the nitrogen mineralization, which could be responsible for the higher TN and AN content in the long term grazing grassland. This was very different from the result of Yin et al. who found that the C/N ratio in 0–10 cm soil was reduced from 22.86 to 20.09 by enclosing for 24 years in an Inner Mongolia typical steppe [39]. The possible reason for this might be attributed to the enclosing time and in this study the enclosing plot was grazing excluded for 38 years. On the other hand, the climate, topography, soil properties, plant composition and enclosing history also play important roles. The results found that there was no significant differences in the C/N ratios in these two plots, suggesting that the changes of C and N were comparatively stable in the long term grazing plot and the long term enclosing plot. In addition, we found that the C/N ratios decreased with the increase of soil depth in these two grassland plots, which was consistent with other research [26,40,41]. Moreover, there was also no significant difference of the C/N ratios with the increase of soil depth in these two plots, suggesting that the soil C/N ratios remained relatively stable along soil profiles [42]. This might be attributed to the relatively fixed ratio between accumulation and consumption of carbon and nitrogen as well as the synchronous changes of carbon and nitrogen in response to the external environment [43,44].
The soil C/P ratio is generally considered as a marker for soil phosphorus mineralization, which can reflect the release or fixation of phosphorus by the action of soil microorganisms [45]. A lower C/P ratio shows greater nutrient releases in the decomposition process of soil organic matter. This study found that the C/P ratio in the long term grazing plot in 0–10 cm soil was 23.4% lower than the long term enclosing plot, suggesting that long term grazing promoted soil mineralization and increased phosphorus content in the surface soil. The C/P ratio was significantly correlated with the SOC (r = 0.968, p < 0.01) and TP (r = 0.865, p < 0.01), which indicated that the decrease of the C/P ratio in the long term grazing grassland was caused by the reduction of SOC and the increase of TP.
The soil N/P ratio is often used to determine the threshold value of nutrient-limiting and can indicate the availability of soil nutrients in the plant growth process [46,47]. In this study, the N/P ratios in these two grassland plots were less than 14 (the range of N/P ratios was 4.22 to 9.16), which suggested that the plant growth was mainly restricted by N [48]. The N/P ratio correlated with the TN (r = 0.826, p < 0.01), but there was no significant difference with the TP, which suggested that the change of the N/P ratio was highly constrained by the TN. The study found that long term grazing increased the N/P ratios and N/K ratios in the soil profile, which explored that more TN could be accumulated in grazing grassland. However, Yin et al. found that the N/P ratio in 0–10 cm soil increased from 13.43 to 15.29 by enclosing for 24 years in an Inner Mongolia typical steppe, which might be attributed to the enclosing time [39]. The N/K ratio correlated with the TN (r = 0.998, p < 0.01) and the TK (r = −0.866, p < 0.01), suggesting that the change of the N/K ratio was highly constrained by both the TN and the TK.
In this study, C/N, C/P and N/P ratios in 0–10 cm soil ranged from 5.3 to 8.8, from 43.2 to 56.5 and from 8.2 to 6.4, respectively, which were relatively lower than the average ratios of C/N (14.4), C/P (136) and N/P (9.3) in 0–10 cm soil reported by Tian et al. [44]. The lower C/N ratio, C/P ratio and N/P ratio in this study area signified net mineralization of nutrients as suggested by Zhao et al. [49]. Yin et al. indicated that moderate grazing could ensure the sustainable use of grassland resources and maintain the stability of grassland ecosystems [50]. Grazing accelerated the mineralization of organic N and provided a more available form of N for plant growth. Higher N, P and K contents in herbage indicated that grazing promoted greater mineral cycling in a grassland system. In addition, previous studies reported that moderate grazing accelerated nutrient cycling by stimulating compensatory growth [51,52]. Ding et al. found that the C/N ratio of plants was significantly lower and decomposition rate of plant residue was faster in grazing grassland compared with enclosing grassland, which suggests that grazing improved the nutrient cycling of the ecosystem [53]. Janssen et al. indicated that the mineralization of soil organic nitrogen and soil organic phosphorus were negatively correlated with the C/N ratio and the C/P ratio [54]. In this study, compared with long term grazing, long term enclosing increased the C/N ratio and the C/P ratio and decreased the N/P ratio and the N/K ratio. This might indicate that long term grazing promotes the mineralization of soil nitrogen and soil phosphorus, thus accelerating the cycling of these nutrients. However, long term enclosing had a lower mineralization which might be attributed to the lower decomposition rate of large litter in the grassland.

5. Conclusions

Compared with the long term grazing plot, continually enclosing for 38 years decreased the TN, TP, AN, Ca, Mg and S contents and the N/P and N/K ratios in soil profile, while it increased the C/N, C/P and C/K ratios. These changes were greater in the surface soil than in deep soil.

Author Contributions

D.Z. contributed to the conception of the study. J.H. performed the data analyses and wrote the manuscript. J.H., Q.L. and Q.W. performed the experiment. All authors have read and agreed to the published version of the manuscript.

Funding

This research was supported by the National Key Research and Development Program of China [2016YFC0500606] and the STS Program of Chinese Academy of Sciences [KFJ-STS-ZDTP-048-03].

Conflicts of Interest

The authors declare no conflict of interest.

References

  1. Liu, J.H.; Wu, J.J.; Sua, H.B. Effects of grazing exclusion in Xilin Gol grassland differ between Regions. Ecol. Eng. 2017, 99, 271–281. [Google Scholar] [CrossRef]
  2. Mekuria, W.; Veldkamp, E.; Haile, M.; Nyssen, J.; Muys, B.; Gebrehiwot, K. Effectiveness of exclosures to restore degraded soils as a result of overgrazing in Tigray, Ethiopia. J. Arid Environ. 2007, 69, 270–284. [Google Scholar] [CrossRef]
  3. Su, H.; Liu, W.; Xu, H.; Wang, Z.S.; Zhang, H.F.; Hu, H.X.; Li, Y.G. Long-term livestock exclusion facilitates native woody plant encroachment in a sandy semiarid rangeland. Ecol. Evol. 2015, 5, 2445–2456. [Google Scholar] [CrossRef] [PubMed]
  4. Gillet, F.; Kohler, F.; Vandenberghe, C.; Buttler, A. Effect of dung deposition on small-scale patch structure and seasonal vegetation dynamics in mountain pastures. Agric. Ecosyst. Environ. 2010, 135, 34–41. [Google Scholar] [CrossRef] [Green Version]
  5. Xue, C.Y.; Jiao, F.; Zhang, H.D.; Ru, H.L. The characteristics of plant species and soil quality in the restoration process of the Loess Hilly Region. Pratacult. Sci. 2016, 33, 368–376. [Google Scholar]
  6. Baudron, F.; Mamo, M.; Tirfessa, T.; Argaw, A. Impact of farmland exclosure on the productivity and sustainability of a mixed crop-livestock system in the Central Rift Valley of Ethiopia. Agric. Ecosyst. Environ. 2015, 207, 109–118. [Google Scholar] [CrossRef]
  7. Bai, Y.F.; Wu, J.G.; Pan, Q.M.; Huang, J.H.; Wang, Q.B.; Li, F.S.; Buyantuyev, A.; Han, X.G. Positive linear relationship between productivity and diversity: Evidence from the Eurasian steppe. J. Appl. Ecol. 2007, 44, 1023–1034. [Google Scholar] [CrossRef]
  8. Frank, D.A.; Evans, R.D. Effects of native grazers on grassland N cycling in Yellowstone National Park. Ecology 1997, 78, 2238–2248. [Google Scholar] [CrossRef]
  9. Deléglise, C.; Loucougaray, G.; Alard, D. Effects of grazing exclusion on the spatial variability of subalpine plant communities: A multiscale approach. Basic Appl. Ecol. 2011, 12, 609–619. [Google Scholar] [CrossRef]
  10. Reeder, J.D.; Franks, C.D.; Milchunas, D.G. Root Biomass and Microbial Processes. Potential of U.S. Grazing Lands to Sequester Carbon and Mitigate the Greenhouse Effect; Lewis Publishers: New York, NY, USA, 2001; pp. 139–166. [Google Scholar]
  11. Paul, E. Nitrogen cycling in terrestrial ecosystems. Environ. Biogeochem. 1976, 1, 225–243. [Google Scholar]
  12. Bing, H.J.; Wu, Y.H.; Zhou, J.; Sun, H.Y.; Luo, J.; Wang, J.P.; Yu, D. Stoichiometric variation of carbon, nitrogen, and phosphorus in soils and its implication for nutrient limitation in alpine ecosystem of Eastern Tibetan Plateau. J. Soils Sediments 2015, 16, 405–416. [Google Scholar] [CrossRef]
  13. Gao, Y.; He, N.; Yu, G.-R.; Chen, W.; Wang, Q. Long-term effects of different land use types on C, N, and P stoichiometry and storage in subtropical ecosystems: A case study in China. Ecol. Eng. 2014, 67, 171–181. [Google Scholar] [CrossRef]
  14. Wang, M.M.; Chen, H.S.; Zhang, W.; Wang, K.L. Soil nutrients and stoichiometric ratios as affected by land use and lithology at country scale in a karst area, southwest China. Sci. Total Environ. 2018, 619–620, 1299–1307. [Google Scholar] [CrossRef] [PubMed]
  15. Tian, H.Q.; Chen, G.S.; Zhang, C.; Melillo, J.M.; Hall, C.A. Pattern and variation of C:N:P ratios in China’s soils: A synthesis of observational data. Biogeochemistry 2010, 98, 139–151. [Google Scholar] [CrossRef]
  16. Xu, X.F.; Thornton, P.E.; Post, W.M. A global analysis of soil microbial biomass carbon, nitrogen and phosphorus in terrestrial ecosystems. Glob. Ecol. Biogeogr. 2013, 22, 737–749. [Google Scholar] [CrossRef]
  17. Cools, N.; Vesterdal, L.; De Vos, B.; Vanguelova, E.; Hansen, K. Tree species is the major factor explaining C:N ratios in European forest soils. For. Ecol. Manag. 2014, 311, 3–16. [Google Scholar] [CrossRef]
  18. Fan, Y.M.; Wu, H.Q.; Jin, G.L.; Xie, Y. Effects of Enclosure on stoichiometric characteristics of C, N, P in desert grassland ecosystem. Chin. J. Grassl. 2018, 40, 76–81. [Google Scholar]
  19. Tang, Z.; Xu, W.; Zhou, G.; Bai, Y.; Li, J.; Tang, X.; Chen, D.; Liu, Q.; Ma, W.; Xiong, G.; et al. Patterns of plant carbon, nitrogen, and phosphorus concentration in relation to productivity in China’s terrestrial ecosystems. Proc. Natl. Acad. Sci. USA 2018, 115, 4033–4038. [Google Scholar] [CrossRef] [Green Version]
  20. Ågren, G.I. The C:N:P stoichiometry of autotrophs-theory and observations. Ecol. Lett. 2004, 7, 185–191. [Google Scholar] [CrossRef]
  21. Liu, X.; Ma, J.; Ma, Z.W.; Li, L.H. Soil nutrient contents and stoichiometry as affected by land-use in an agro-pastoral region of northwest China. Catena 2017, 150, 146–153. [Google Scholar] [CrossRef]
  22. Sardans, J.; Peñuelas, J. Climate and taxonomy underlie different elemental concentrations and stoichiometries of forest species: The optimum “biogeochemical niche”. Plant Ecol. 2014, 215, 441–455. [Google Scholar] [CrossRef] [PubMed] [Green Version]
  23. Huang, Z.Y.; Chen, J.; Ai, X.Y.; Li, R.R.; Ai, Y.W.; Li, W. The texture, structure and nutrient availability of artificial soil on cut slopes restored with OSSS-Influence of restoration time. J. Environ. Manag. 2017, 200, 502–510. [Google Scholar] [CrossRef] [PubMed]
  24. Tian, L.M.; Zhao, L.; Wu, X.D.; Fang, H.B.; Zhao, Y.H.; Hu, G.J.; Yue, G.Y.; Sheng, Y.; Wu, J.C.; Chen, J.; et al. Soil moisture and texture primarily control the soil nutrient stoichiometry across the Tibetan grassland. Sci. Total Environ. 2018, 622–623, 192–202. [Google Scholar] [CrossRef] [PubMed]
  25. Liang, X.; Liu, S.; Wang, H.; Wang, J. Variation of carbon and nitrogen stoichiometry along a chronosequence of natural temperate forest in northeastern China. J. Plant Ecol. 2018, 11, 339–350. [Google Scholar] [CrossRef]
  26. Fan, H.B.; Wu, J.P.; Liu, W.F.; Yuan, Y.H.; Hu, L.; Cai, Q.K. Linkages of plant and soil C:N:P stoichiometry and their relationships to forest growth in subtropical plantations. Plant Soil 2015, 392, 127–138. [Google Scholar] [CrossRef]
  27. Bai, Y.F.; Han, X.G.; Wu, J.G.; Chen, Z.Z.; Li, L.H. Ecosystem stability and compensatory effects in the Inner Mongolia grassland. Nature 2004, 431, 181–184. [Google Scholar] [CrossRef]
  28. Bai, Y.F.; Wu, J.G.; Clark, C.M.; Naeem, S.; Pan, Q.M.; Huang, J.H.; Zhang, L.X.; Han, X.G. Tradeoffs and thresholds in the effects of nitrogen addition on biodiversity and ecosystem functioning: Evidence from Inner Mongolia grasslands. Glob. Chang. Biol. 2010, 16, 358–372. [Google Scholar] [CrossRef]
  29. Hoffmann, C.; Giese, M.; Dickhoefer, U. Effects of grazing and climate variability on grassland ecosystem functions in Inner Mongolia: Synthesis of a 6 year grazing experiment. J. Arid Environ. 2016, 135, 50–63. [Google Scholar] [CrossRef]
  30. Lu, R.K. Analysis Methods of Soil Science and Agricultural Chemistry; Agriculture Science and Technology Press: Beijing, China, 1999. [Google Scholar]
  31. Wang, W.; Sardans, J.; Zeng, C.; Zhong, C.; Li, Y.; Peñuelas, J. Responses of soil nutrient concentrations and stoichiometry to different human land uses in a subtropical tidal wetland. Geoderma 2014, 232, 459–470. [Google Scholar] [CrossRef] [Green Version]
  32. Savadogo, P.; Sawadogo, L.; Tiveau, D. Effects of grazing intensity and prescribed fire on soil physical and hydrological properties and pasture yield in the savanna woodlands of Burkina Faso. Agric. Ecosyst. Environ. 2007, 118, 80–92. [Google Scholar] [CrossRef]
  33. Dickinson, C.H.; Underhay, V.S.H.; Ross, V. Effect of season, soil fauna and water content on the decomposition of cattle dung pats. New Phytol. 1981, 88, 129–141. [Google Scholar] [CrossRef]
  34. Bardgett, R.D.; Wardle, D.A.; Yeates, G.W. Linking aboveground and below-ground interactions: How plant responses to foliar herbivory influence soil organisms. Soil Biol. Biochem. 1998, 30, 1867–1878. [Google Scholar] [CrossRef]
  35. Hamilton, E.W.; Frank, D.A. Can plants stimulate soil microbes and their own nutrient supply? Evidence from a grazing tolerant grass. Ecology 2001, 82, 2397–2402. [Google Scholar] [CrossRef]
  36. Jobbágy, E.G.; Jackson, R.B. The vertical distribution of soil organic carbon and its relation to climate and vegetation. Ecol. Appl. 2000, 10, 423–436. [Google Scholar] [CrossRef]
  37. Wang, Z.; Wang, Z.Y.; Han, Q.F.; Li, W.J.; Han, L.N.; Ding, R.X.; Jia, Z.K.; Yang, B.P. Soil carbon and nitrogen variation characteristics of Alfalfa grassland in Loess Plateau Area. Acta Agrestia Sin. 2013, 21, 1074–1079. [Google Scholar]
  38. Zhang, L.X.; Fan, J.W.; Zhang, W.Y.; Tang, F.P. Impact of the Beijing and Tianjin Sand Source Control Project on the grassland soil organic carbon storage: A case study of Xilingol League, Inner Mongolia, China. Chin. J. Appl. Ecol. 2014, 25, 374–380. [Google Scholar]
  39. Yin, X.R.; Liang, C.Z.; Wang, L.X.; Wang, W.; Liu, Z.L.; Liu, X.P. Ecological stoichiometry of plant nutrients at different restoration succession stages in typical steppe of Inner Mongolia, China. J. Plant Ecol. 2010, 34, 39–47. [Google Scholar] [CrossRef]
  40. Bui, E.N.; Henderson, B.L. C:N:P stoichiometry in Australian soils with respect to vegetation and environmental factors. Plant Soil 2013, 373, 553–568. [Google Scholar] [CrossRef]
  41. Liu, W.J.; Chen, S.Y.; Qin, X. Storage, patterns, and control of soil organic carbon and nitrogen in the northeastern margin of the Qinghai-Tibetan Plateau. Environ. Res. Lett. 2012, 7, 035401. [Google Scholar] [CrossRef]
  42. Yang, Y.; Fang, J.; Guo, D.; Ji, C.; Ma, W. Vertical patterns of soil carbon, nitrogen and carbon: Nitrogen stoichiometry in Tibetan grasslands. Biogeosci. Discuss. 2010, 7, 1–24. [Google Scholar] [CrossRef]
  43. Ågren, G.I. Stoichiometry and nutrition of plant growth in natural communities. Annu. Rev. Ecol. Evol. Syst. 2008, 39, 153–170. [Google Scholar] [CrossRef]
  44. Tian, H.; Gai, J.P.; Zhang, J.L.; Christie, P.; Li, X.L. Arbuscular mycorrhizal fungi associated with wild forage plants in typical steppe of eastern Inner Mongolia. Eur. J. Soil Biol. 2009, 45, 321–327. [Google Scholar] [CrossRef] [Green Version]
  45. Zhu, Q.L.; Xing, X.Y.; Zhang, H.; An, S.S. Soil ecological stoichiometry under different vegetation area on loess hilly-gully region. Acta Ecol. Sin. 2013, 33, 4674–4682. [Google Scholar]
  46. Güsewell, S.; Koerselman, W.; Verhoeven, J.T.A. Biomass N:P ratios as indicators of nutrient limitation for plant populations in wetlands. Ecol. Appl. 2003, 13, 372–384. [Google Scholar] [CrossRef]
  47. Wu, W.; He, X.D.; Zhou, Q.X. Review on N:P Stoichiometry in Eco-system. J. Desert Res. 2010, 30, 296–302. [Google Scholar] [CrossRef]
  48. Wassen, M.J.; Olde Venterink, H.G.M.; De Swart, E.O.A.M. Nutrient concentrations in mire vegetation as measure of nutrient limitation in mire ecosystems. J. Veg. Sci. 1995, 6, 5–16. [Google Scholar] [CrossRef]
  49. Zhao, F.Z.; Kang, D.; Han, X.H.; Yang, G.H.; Feng, Y.Z.; Ren, G.X. Soil stoichiometry and carbon storage in long-term afforestation soil affected by understory vegetation diversity. Ecol. Eng. 2015, 74, 415–422. [Google Scholar] [CrossRef]
  50. Yin, Y.L.; Wang, Y.Q.; Li, S.X. Effects of enclosing on soil microbial community diversity and soil stoichiometric characteristics in a degraded alpine meadow. Chin. J. Appl. Ecol. 2019, 30, 127–136. [Google Scholar]
  51. McNaughton, S.J. Ecology of a grazing ecosystem: The Serengeti. Ecol. Monogr. 1985, 55, 259–294. [Google Scholar] [CrossRef]
  52. Frank, A.S.K.; Wardle, G.M.; Dickman, C.R.; Greenville, A.C. Habitat- and rainfall-dependent biodiversity responses to cattle removal in an arid woodland–grassland environment. Ecol. Appl. 2014, 24, 2013–2028. [Google Scholar] [CrossRef]
  53. Ding, X.H.; Gong, L.; Wang, D.B.; Wu, X.; Liu, G.H. Grazing effects on eco-stoichiometry of plant and soil in Hulunbeir, Inner Mogolia. Acta Ecol. Sin. 2012, 32, 4722–4730. [Google Scholar] [CrossRef] [Green Version]
  54. Janssen, B.H. Nitrogen mineralization in relation to C:N ratio and decomposability of organic materials. Plant Soil 1996, 181, 39–45. [Google Scholar] [CrossRef]
Figure 1. The effects of long term grazing and enclosing on the contents of soil SOC, TN, TP and TK. Note: * and ** indicate significant differences at p < 0.05 level and p < 0.01 level of SOC, TN, TP and TK contents in each soil layer between the long term grazing plot and the long term enclosing plot and ns indicates no significant difference (t test). Different lower case and capital letters indicate significant differences at p < 0.05 level and p < 0.01 level of SOC, TN, TP and TK contents among different soil layers for the long term grazing plot or the long term enclosing plot by one-way analysis of variance (ANOVA). Error bars were one standard deviation.
Agriculture 10 00382 g001
Figure 2. The effects of long term grazing and enclosing on soil contents of Ca, Mg and S. Note: * and ** indicate significant differences at p < 0.05 level and p < 0.01 level of Ca, Mg and S contents in each soil layer in the long term grazing plot and the long term enclosing plot and ns indicates no significant difference (t test). Different lower case and capital letters indicate significant differences at p < 0.05 level and p < 0.01 level of Ca, Mg and S contents among different soil layers for the long term grazing or the long term enclosing by one-way analysis of variance (ANOVA). Error bars were one standard deviation.
Agriculture 10 00382 g002
Figure 3. The effects of long term grazing and enclosing on contents of soil AN, AP and AK. Note: * and ** indicate significant differences at p < 0.05 level and p < 0.01 level of AN, AP and AK contents in each soil layer between the long term grazing plot and the long term enclosing plot and ns indicates no significant difference (t test). Different lower case and capital letters indicate significant differences at p < 0.05 level and p < 0.01 level of AN, AP and AK contents among different soil layers for long term grazing or long term enclosing by one-way analysis of variance (ANOVA). Error bars were one standard deviation.
Agriculture 10 00382 g003
Figure 4. The effects of long term grazing and enclosing on the stoichiometric ratios of soil nutrients. Note: * and ** indicate significant differences at p < 0.05 level and p < 0.01 level of stoichiometric ratios of soil nutrients in each soil layer between the long term grazing plot and the long term enclosing plot and ns indicates no significant difference (t test). Different lower case and capital letters indicate significant differences at p < 0.05 level and p < 0.01 level of stoichiometric ratios of soil nutrients among different soil layers for long term grazing or long term enclosing by one-way analysis of variance (ANOVA). Error bars were one standard deviation.
Agriculture 10 00382 g004
Table 1. Correlation matrix for the soil nutrient contents and their stoichiometric ratios.
SOCTNTPTKCaMgSANAPAKC/NC/PC/KN/PN/K
SOC1.000
TN0.661 *1.000
TP0.954 **0.792 **1.000
TK−0.559−0.841 **−0.700 *1.000
Ca0.3650.793 **0.510−0.792 **1.000
Mg0.827 **0.923 **0.902 **−0.815 **0.778 **1.000
S0.897 **0.890 **0.961 **−0.765 **0.684 *0.963 **1.000
AN0.772 **0.707*0.852 **−0.5440.2400.697 *0.764 **1.000
AP0.904 **0.689 *0.915 **−0.4930.2200.741 **0.828 **0.919 **1.000
AK0.962 **0.5080.887 **−0.4600.3010.750 **0.813 **0.626 *0.817 **1.000
C/N0.414−0.3910.2310.331−0.526−0.1170.0250.1790.3030.5251.000
C/P0.968 **0.5180.865 **−0.3770.1700.686 *0.780 **0.734 **0.888 **0.933 **0.5471.000
C/K0.998 **0.695 *0.966 **−0.612 *0.4180.856 **0.916 **0.775 **0.897 **0.957 **0.3720.951 **1.000
N/P0.1840.826 **0.323−0.633 *0.731 **0.607 *0.5160.3220.2680.015−0.795 **0.0630.2201.000
N/K0.667 *0.998 **0.804 **−0.866 **0.807 **0.931 **0.896 **0.708 **0.684 *0.520−0.3790.5160.704 *0.807 **1.000
Note: * and ** indicate a significant difference at p < 0.05 and p < 0.01, respectively.

