Article

Identification of Transformation Stages and Evolution of Agricultural Development Types Based on Total Factor Productivity Analysis: A Case Study of Gansu Province, China

College of Geography and Environmental Science, Northwest Normal University, Lanzhou 730000, China
*
Author to whom correspondence should be addressed.
Agriculture 2020, 10(8), 363; https://doi.org/10.3390/agriculture10080363
Submission received: 26 June 2020 / Revised: 12 August 2020 / Accepted: 13 August 2020 / Published: 17 August 2020
(This article belongs to the Special Issue Productivity, Efficiency, and Sustainability in Agriculture)

Abstract

:
Agricultural transformation is a transition process of agriculture from the low development stage to the high development stage. Identifying the agricultural transformation stage and analyzing the evolution of agricultural development types based on Total Factor Productivity (TFP) are of great significance for the rational formulation of agricultural development policies. Based on the total factor productivity analysis framework, the DEA-Malmquist index model was used to measure the agricultural TFP of the 87 counties in Gansu Province from 1988 to 2017. The cumulative anomaly method was used to help identify agricultural transformation stages. Agricultural development types of counties in different stages and their evolution process were analyzed. Results show that (1) the agricultural transformation of Gansu Province can be divided into three stages: Traditional agriculture in 1988–1998; low-capacity technology agriculture in 1999–2011; and high-capacity technology agriculture in 2012–2017. (2) From 1988 to 2017, the agricultural TFP showed periodic U-shaped fluctuations, and the areas with high TFP value expanded from the central region to the western region and then to the entire region of the province. (3) Gansu Province presented a significant spatiotemporal variation of agricultural development types. From 1988 to 1998, type-I (low technological efficiency and slow technological progress) and type-VI (high technological efficiency and fast technological progress) agricultural development was mainly observed, and these two kinds of counties accounted for 55.17% of all evaluation units. From 1999 to 2011, the number of counties with type-I agricultural development increased significantly, reaching 35, followed by the number of counties with type IV (low technological efficiency) agricultural development, reaching 18. They together accounted for 60.92% of all evaluation units. From 2012 to 2017, the number of counties with type-IV and type-VI agricultural development was the largest, reaching 29 and 25, respectively. They together accounted for 62.07% of all evaluation units. (4) Types of agricultural development frequently change—from 1988 to 2017, the influencing factors of agricultural development had undergone a transition from both technological efficiency and technological improvement to technological efficiency or technological improvement alone.

1. Introduction

“Transformation” was first used as a term in the economic field in 1921. Nikolai Bukharin explored the concept of “economic transformation” in the transition from a market economy to a planned economy. Transformation was later referred to as a system change [1,2]. Agricultural transformation is the transition process of agriculture from a low development stage to a high development stage [3,4]. On the basis of the original agricultural production situation, we changed the agricultural development mode, including the transformation of agricultural production structure and productivity transformation [5]. Agricultural transformation is closely related to factors, such as technological development, labor conditions, and external environment [6]. This will also have an important impact on social and economic development [7]. With rapid industrialization and urbanization, the world’s rural industrial structure, employment structure and agricultural production methods have undergone tremendous changes. Therefore, agricultural transformation and upgrading have attracted much attention [8,9]. Scholars engaged in the research of agriculture, rural areas and peasant issues have carried out multi-perspective research on the stages of the transformation and development of agriculture and rural areas [9,10]. In the current stage, research of agricultural transformation and development, most theories divide agricultural development into three stages based on agricultural production factors and technical characteristics. They are the primitive agricultural stage with lagging technology and less input in agricultural production factors. The traditional agriculture stage with a large investment in factors, such as land input, and the modern agriculture stage with technological and institutional innovation and high capital input [11,12,13,14]. In comparison, most of the existing research cases on agricultural transformation focus on the two stages of traditional agriculture and modern agriculture [15]. Most studies tend to overlook the temporal and spatial differences in agricultural development within different transformation stages. Therefore, it is easy to lead to the adoption of unreasonable agricultural development measures, which makes the improvement of agricultural productivity insignificant and the slow development of agricultural economy, which ultimately leads to difficulties in agricultural transformation.
Some scholars have tried to quantitatively study agricultural and rural transformation. In addition to evaluating agricultural productivity with statistical data or survey data by means of estimation method (parametric method or non-parametric method) [15,16], analysis framework of agricultural Total Factor Productivity (TFP) has gradually attracted academic attention [17,18,19]. As far as the study of agricultural production is concerned, it can determine the changes and sources of productivity growth other than inputs, and is an important indicator for measuring agricultural technological progress and agricultural scale efficiency [20,21]. TFP and its analytical framework has been widely used in agricultural research in around the world, especially in analyzing agricultural growth, changes in the productivity of various agricultural sectors and crops, and exploring the mechanisms that affect their changes [21,22,23,24,25]. Some scholars explored the dynamic changes and differentiation characteristics of agricultural total factor productivity in some regions, and identified problems in the process of agricultural development through the analysis of the efficiency combination of total factor productivity, and believed that the efficiency combination of regional agricultural total factor productivity has characteristics of temporal and spatial changes. Moreover, the factors that cause the total factor productivity lag are different [26,27]. However, current research mostly focuses on the change of agricultural total factor productivity and its factors in a certain period of time, and uses the change of agricultural total factor productivity to divide the different development stages of regional agriculture, and analyze the characteristics of agricultural total factor productivity efficiency combination in different stages there is not much research [28,29,30,31]. Therefore, it is of great significance to study the temporal and spatial changes of agricultural total factor productivity in typical regions, identify problems in the process of agricultural development, and guide agricultural transformation and upgrading, to realize agricultural modernization.
Along with the existing studies, there are three important that points should be noted. First of all, most current studies ignore the fact that there are multiple stages of agricultural development [10]. In addition, previous studies mainly analyzed the stage division of agricultural transformation under the system and policy environment, and it was rare to identify the stage of agricultural transformation through data-driven methods [8,32]. Second, most studies analyze the temporal and spatial changes of agricultural production without distinguishing the stages of agricultural development. However, it is very important to study the temporal and spatial differences of agricultural activities in different stages based on the division of regional agricultural development stages [26,27]. Third, in the past, little attention has been paid to the internal changes of agricultural production efficiency. Nonetheless, it is also very important to understand the characteristics and elements of the agricultural transformation stage through the framework of total factor productivity to diagnose the difficulties faced by agricultural production transformation and its solutions [33].
As China’s economy changes from high-speed growth to the “new normal” stage of high-quality development, the most important tasks facing China are accelerating the adjustment and optimization of economic structure and promoting economic transformation [27]. China’s agricultural development is in a critical period from the traditional agricultural development method based on increasing factor input to modern agriculture based on scientific and technological progress. Promoting agricultural transformation and upgrading is the most important task at present [34,35]. The China No. 1 Central Document of 2018 clearly stated that “the construction of a modern agricultural industry, production system and management system should be accelerated to improve agricultural innovation, competitiveness and TFP, and promote the transformation from a largely agricultural country to a strong agricultural country.” Gansu Province is one of the provinces in the economically underdeveloped areas in western China, as well as a large traditional agricultural province in China. Gansu Province has a vast territory, intricate terrain, and great differences in natural conditions. This has resulted in the uneven development of monsoon, non-monsoon, and alpine regions, and the eastern, central, and western regions of the province. There are significant regional differences in agricultural economic development [36]. The province’s agricultural production is greatly restricted by natural conditions. Natural disasters (especially drought and hail), soil erosion, etc., occur frequently. The complexity of the natural environment and the lack of resources have led to the limited space for survival and development of the province’s advantages, resulting in production and living. The competition for ecological space is fierce. In addition, it is particularly important to promote the transformation and upgrading of agriculture in Gansu Province by improving agricultural total factor productivity [36,37,38,39].
In sum, although fruitful research results have been achieved on agricultural and rural transformation and upgrading, there is still a lack of in-depth discussion of agricultural transformation stages and types in Gansu Province from the perspective of TFP. For Gansu Province, an underdeveloped region with poor resource endowments and fragile ecological environment in western China [40], it is necessary to study the process and characteristics of agricultural transformation. Here, by evaluating agricultural TFP in Gansu Province, we constructed a model for identifying agricultural transformation stages of less developed regions. The spatiotemporal variation of agricultural development was also analyzed in Gansu Province from 1988 to 2017. Then, we identified the types of agricultural development and their evolution characteristics. The results provide a theoretical basis and practical support for the transformation of agricultural regions.
Although many developed regions in the world have entered the stage of modern agricultural development, agriculture in many underdeveloped regions in the world is still at a relatively low stage of development. Therefore, it is of great significance to study the transformation mechanism and potential obstacles of agricultural development in underdeveloped regions [36]. Gansu Province, as a region with poor resource endowments and fragile ecological environment in western China, its agricultural development has the typical characteristics of underdeveloped regions [40,41,42]. Here, by evaluating agricultural TFP in Gansu Province, we constructed a model for identifying agricultural transformation stages of less developed regions. The spatiotemporal variation of agricultural development was also analyzed in Gansu Province from 1988 to 2017. Then, we identified the types of agricultural development and their evolution characteristics, and finally guides agricultural transformation and upgrading. To provide theoretical basis and practical support for the comprehensive transformation of agriculture in underdeveloped areas.

2. Materials and Methods

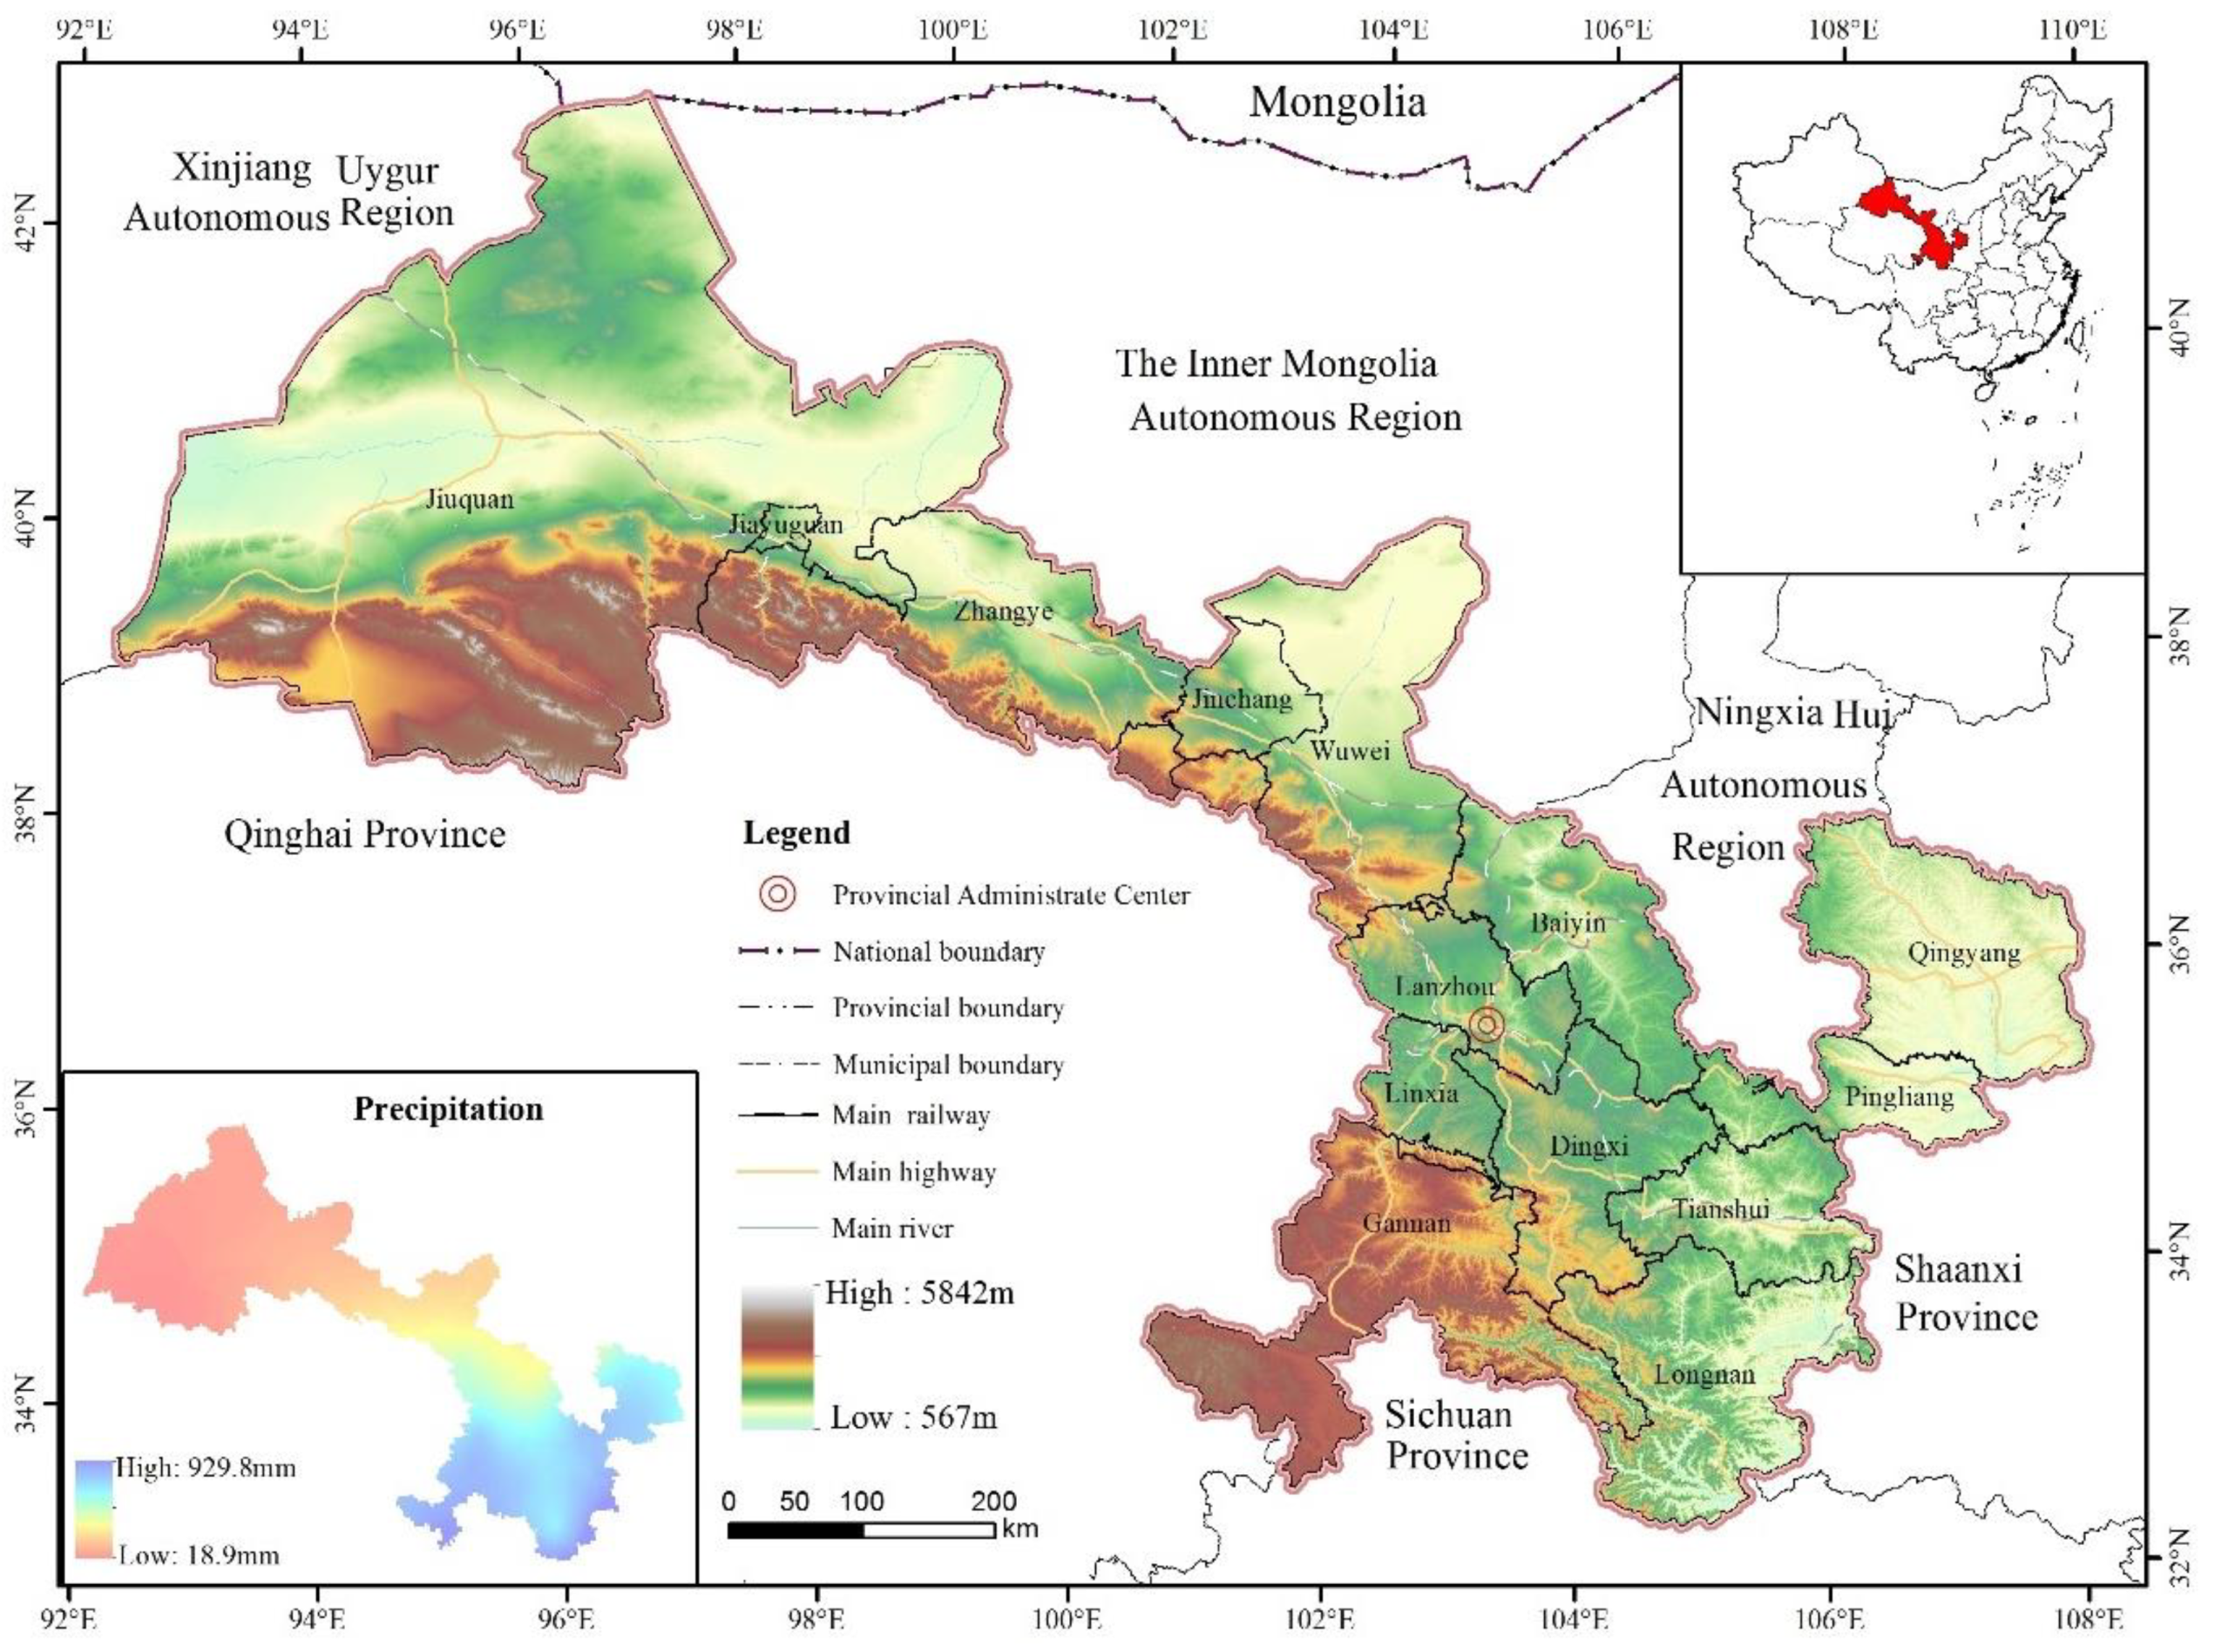
2.1. Overview of Study Region

2.1.1. Physical Geography

Gansu Province is located in northwestern China (92°13′–108°46′ E and 32°31′–42°57′ N). It is in the junction area of China’s northwestern arid region, Qinghai-Tibet alpine region and eastern monsoon region (Figure 1). The total land area of Gansu Province is 42.58 × 10⁴ km2, accounting for 4.72% of China’s total land area. Its landforms are complex and diverse, with the crisscross distribution of mountains, plateaus, plains, river valleys, deserts and Gobi. Gansu Province as a whole has a narrow and long shape, with a length of 1655 km from east to west and a length of 530 km from north to south. The elevation of the terrain decreases from southwest to northeast. The area of plateau accounts for about 70% of the total land area of the province. Since Gansu Province is located in inland China, the warm moist airflow from the ocean can hardly reach this region. As a result, the precipitation is low. The annual precipitation is only 36.6–734.9 mm and declines from southeast to northwest. Besides, about 50–70% of the precipitation is concentrated in June to August. The climate in most areas of Gansu Province is dry and belongs to the continental temperate monsoon climate. The annual average temperature is 0–15 °C. The province’s frost-free period varies from region to region. For the Longnan River Valley, the frost-free period is around 280 days. For the Gannan Plateau, the frost-free period is the shortest, only 140 days. The rivers in Gansu Province are branches of exorheic rivers, including the Yangtze River and the Yellow River, as well as inland rivers, with river basin areas accounting for 8%, 32% and 60%, respectively, of the province’s area. There are many types of vegetation, such as forest, bush, grassland, meadow, cushion vegetation, sparse vegetation on alpine rock slopes, swamp vegetation, aquatic vegetation, etc. The plant resources in Gansu Province are relatively rich.

2.1.2. Socio-Economic Profile

There are 14 prefectures composed of 87 counties/county-level cities in Gansu Province. Since the reform and opening up in 1978, agricultural production in Gansu Province has continued to grow. Crop production capacity and agricultural product supply have increased, which are driven by China’s agricultural modernization and the reform of the rural economic system. The total output of grain increased from 511.55 × 10⁴ t in 1978 to 1105.9 × 104 t in 2017 and the per capita share of grain increased from 273 kg in 1978 to 422 kg in 2017. With the rapid development of agriculture, China has continued to promote the strategic adjustment of agricultural structure and develop characteristic and advantageous industries. The agricultural structure has changed from a unary structure of food crops to a ternary structure of food crops, cash crops and forage crops. Besides, forestry, animal husbandry and fishing have all developed. At the end of 2017, the total power of agricultural machinery in Gansu Province reached 2018.59 × 104 kw, and the contribution rate of science and technology to agricultural economic growth reached 52.7%. In addition, characteristic agricultural specialty industries are also growing. By 2017, support the establishment of 33 national-level facility vegetable standardization communities, more than 200 provincial-level plateau summer vegetable standard gardens, facility vegetable standardization communities, and intensive seedling breeding bases, 37 provincial-level apple standardization demonstration parks, and Chinese medicinal materials The standardized production demonstration base is 50.02 km2.

2.2. Data Sources and Research Methods

2.2.1. Data Sources

This article estimated agricultural TFP at the county level. Considering the spatial integrity of socio-economic activities and the availability of data, the data used in this article were mainly derived from two sources—(1) Basic maps: The topographic map of Gansu Province (1:250,000) and vector administrative boundaries (1:250,000) from Gansu Provincial Bureau of Surveying and Mapping; (2) Agriculture-related data: Rural employees in counties (including county-level cities and districts) of Gansu Province in 1988–2017, the total power of agricultural machinery, rural electricity consumption, pure fertilizer application, crop planting area, total agricultural output value, and grain output from the “Gansu Province Development Yearbook (1989–2018)” and “Gansu Province Rural Statistical Yearbook (1989–2018)”. Some national-level indicator data from “China Statistical Yearbook” (1989–2018) and “China Rural Statistical Yearbook” (1989–2018) were also used. For some missing input-output data and a few outliers, corrections were made through referring to the related data of relevant county or adjacent year. The total output values of agriculture, forestry, animal husbandry and fishery were converted into constant prices of 1988.

2.2.2. Evaluation Model of Agricultural TFP

(1)
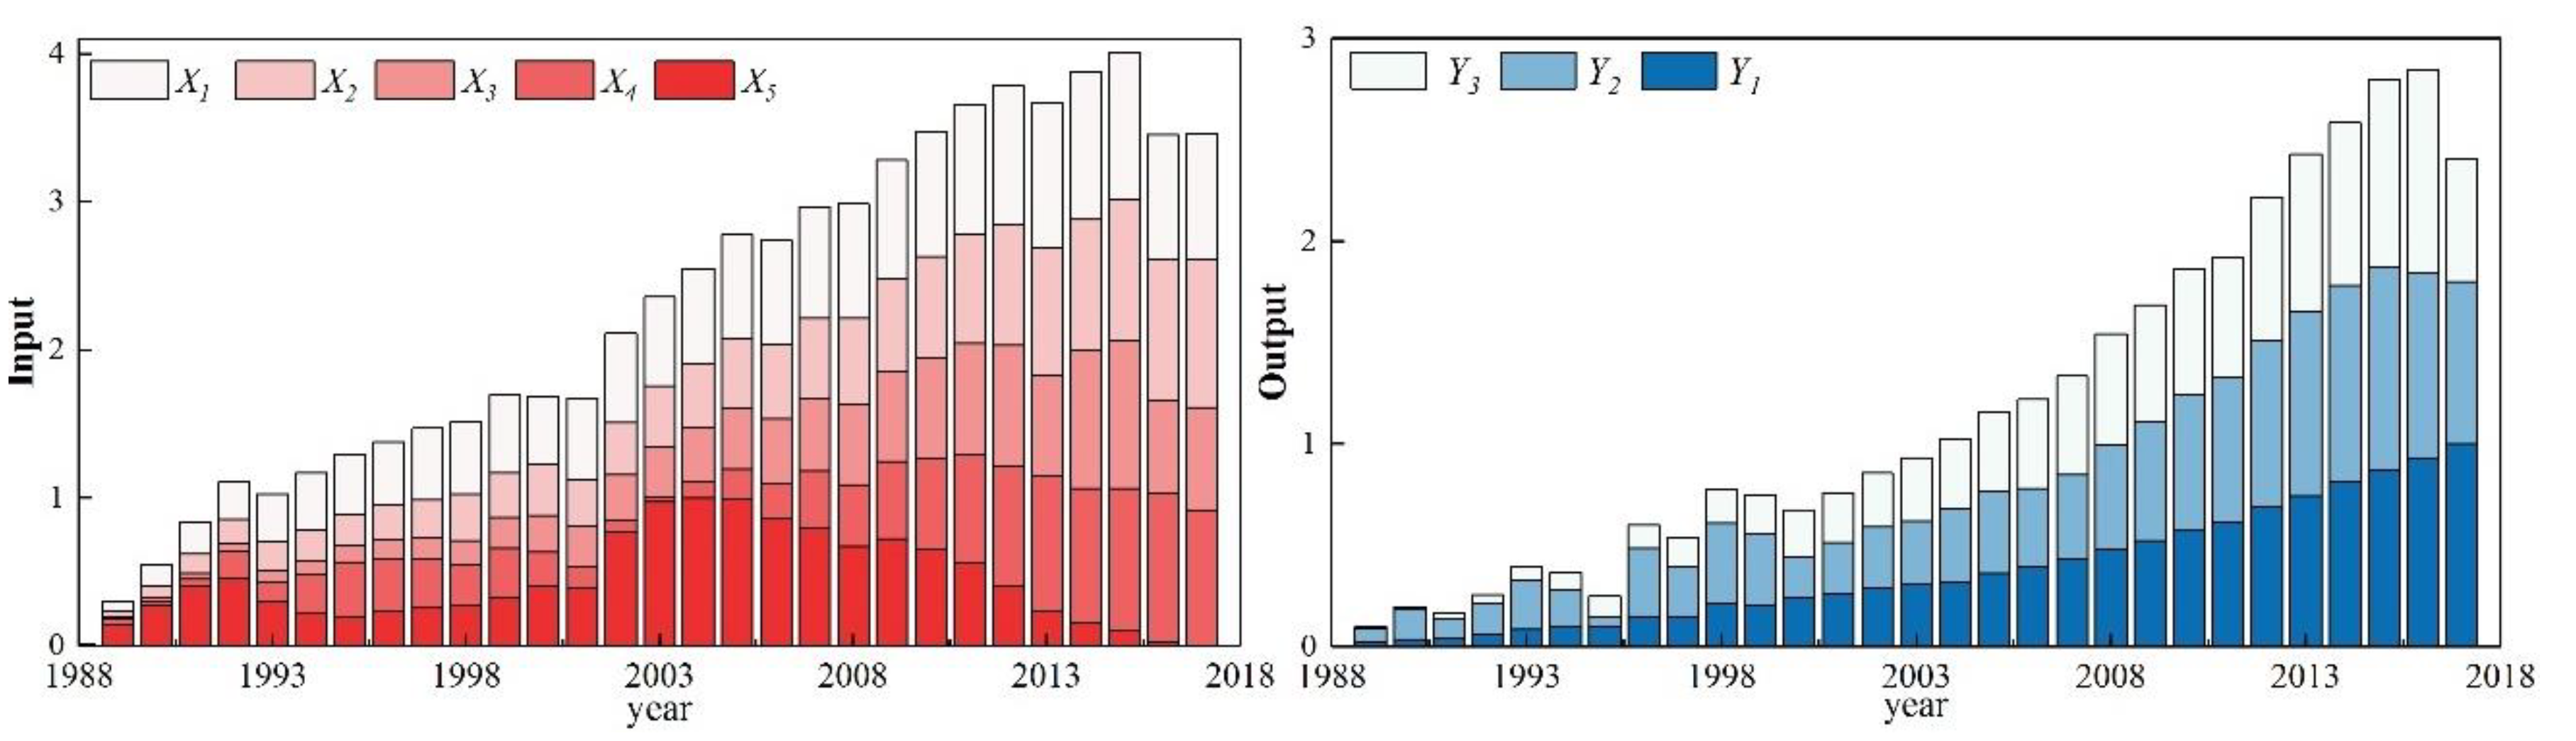
Indicator system for evaluating agricultural TFP
Start with “production-input-output”, we selected indicators that can reflect the characteristics of agricultural transformation and the comprehensive level of agricultural development. Ensuring the consistency and accessibility of data and considering existing research results [30,34] and the actual situation of agricultural development in Gansu Province, we constructed an indicator system for evaluating agricultural TFP (Table 1). Then, it was used to identify the stage of agricultural transformation in Gansu Province.
The total factor productivity of agriculture represents the additional production efficiency achieved when the level of various factors of production in agriculture is established. The input factors of agricultural production mainly include labor input, land input and capital input [35,40]. As a necessary condition for agricultural production, the quantity and quality of labor force will affect the level of agricultural output. Agricultural employees represent the scale of labor input in agricultural production, referring to the rural population over the age of 16 who participate in agricultural production and business activities and obtain income in kind or money [23,41]. Cultivated land is the carrier of agricultural production, and crop planting area reflects the input scale of land elements [26,29]. The total power of agricultural machinery, electricity consumption in rural areas, and fertilizer application are important capital inputs in agricultural production. The total power of agricultural machinery refers to the sum of the rated power of various machinery used in agriculture, forestry, animal husbandry and fishery, including farming machinery, irrigation and drainage machinery, harvesting machinery, agricultural transportation machinery, plant protection machinery, animal husbandry machinery, forestry machinery, and fishery Machinery and other agricultural machinery, which are calculated by converting their power into watts and reflect the level of agricultural machinery in the process of agricultural production and the total investment in agricultural technology and equipment [27,29]. Rural electricity consumption means electricity consumption in rural life and production (because there is no single indicator of agricultural electricity consumption, it is replaced by rural electricity consumption). Agricultural electricity consumption represents the degree of electrification of agricultural production. It refers to electricity consumption related to agricultural production and processing, mainly including drainage of farmland, irrigation, electric plough, well drilling, threshing, fertilizer accumulation, rice seedling breeding, grain processing of farmers, livestock feed processing, temporary lighting for flood control and insect-catching by blacklight lamps [21]. The scalar amount of pure fertilizer application is an important guarantee for increasing yield in agricultural production [34,36,37]. It is also an important guarantee for improving quality in agricultural production. Among the agricultural output indicators, the total output value of agriculture, forestry, animal husbandry and fishery shows the total output and total benefits of agricultural production. The output of food crops and cash crops are the main agricultural products, and their output represents the level of planting industry output [27,37]. There is no unified conversion standard when calculating the output of cash crops. Therefore, according to the objective weight method, oilseeds (0.319), cotton (0.073), vegetables (0.245), Chinese medicinal materials (0.195), and fruits (0.167) are obtained. Finally, the total index of cash crop output was obtained from the weighted sum.
(2)
Malmquist TFP index model
DEA-Malmquist index method was used to measure agricultural TFP. The Malmquist productivity index is often used to measure the trend of agricultural TFP in a certain period. The advantage is that the Malmquist productivity index only relies on quantitative information, and does not depend on price information or behavioral assumptions. It can also further decompose the improvement of TFP into efficiency changes and technological changes. The reasons for the improvement of TFP and its regional differences can provide a reference for further proposals for response policies [26,27]. Fare et al. decomposed the into technological efficiency change (TEC) and technological change (TC) under the assumption of constant scale. Under the assumption of variable scale, they further decomposed TEC into pure technological efficiency change (PEC) and scale efficiency change (SEC) [43], namely,
T F P = T E C × T C = P E C × S E C × T E C
where TFP represents a comprehensive productivity change. If TFP > 1, the comprehensive productivity has improved. TEC reflects the degree of improvement in resource allocation and utilization efficiency of decision-making units. PEC reflects the degree of improvement in resource utilization and allocation efficiency at a particular production technology level, which is mainly a result of corporate system reform and management level improvement. SEC indicates whether the input and utilization of production factors have reached the optimal economies of scale. TC indicates the degree of improvement in system production technology. The indicators are calculated as follows:
P E C = D v t ( x t + 1 , y t + 1 ) D v t ( x t , y t )
S E C = D v t ( x t , y t ) D c t ( x t , y t ) × D c t + 1 ( x t + 1 , y t + 1 ) D v t + 1 ( x t + 1 , y t + 1 )
T C = D t ( x t + 1 , y t + 1 ) D t + 1 ( x t + 1 , y t + 1 ) × D t ( x t , y t ) D t + 1 ( x t , y t )
where xt and xt+1 are input factors in the periods t and t + 1, respectively; yt and yt+1 are output factors in the periods t and t + 1, respectively; Dt(xt, yt) and Dt(xt+1, yt+1) are input distance functions of decision units in t and t + 1 periods, respectively; Dt(xt+1, yt+1) and Dt+1 (xt, yt) are input distance functions of decision unit in different periods; Dc and Dv are distance functions based on constant scale returns and variable scale returns, respectively, which are the effective function values of the investment-oriented DEA model [38,39]. If PEC (SEC or TC) > 1, it means that the pure technological efficiency (scale efficiency or technology) is improved. If PEC (SEC or TC) = 1, it means that the pure technological efficiency (scale efficiency or technology) remains unchanged. If PEC (SEC or TC) < 1, it means that the pure technological efficiency (scale efficiency or technology) is decreased.

2.2.3. Identification Methods of Agricultural Transformation Stage and Development Type

(1)
Identification method of agricultural transformation stage
Cumulative anomaly [44] was used to determine the time of change in TFP, and then determine the stage of agricultural transformation.
Y t = i = 1 t ( x t x ¯ )
where Yt is the cumulative anomaly in the tth year; xt is the average TFP in the tth year in Gansu Province; x ¯ is the 29-year average of TFP. Anomaly values may be positive or negative. When the cumulative anomaly continuously increases, the anomaly of TFP remains positive during the period. When the cumulative anomaly remains constant, the anomaly of TFP is zero during the period. When the cumulative anomaly continuously decreases, the anomaly of TFP remains negative during the period. The year with the maximum absolute value of the cumulative anomaly of TFP was considered as the abrupt mutation year, and the interannual change stage of TFP was determined.
In addition, the signal-to-noise ratio was calculated to check whether the selected mutation year meets the standard of TFP mutation [45,46]. The formula is:
S N = | X 1 X 2 | σ 1 + σ 2
where S N is the signal-to-noise ratio; X1 and X2 are the mean values for the periods before and after the mutation year, respectively; σ 1   and σ 2 are the standard deviations for the periods before and after the mutation year, respectively. When the ratio > 1.0, there is a difference between the values of the two periods at the significance level of 0.01 and the selected mutation year is the right year. Otherwise, no mutation phenomenon occurs.
(2)
Identification method of agricultural development type
TFP, TEC, and TC were calculated for each county. TFP, TEC, and TC were classified into high values (>1) and low values (≤1). The TFP, TEC, and TC values of all evaluation units were ranked to get rank data of “RTFP, RTEC, RTC” of each evaluation unit. The rank data were used to examine the relative relationship among the TFP, technological efficiency change, and technological change within the same region. As can be seen, this research not only focused on the absolute value of TFP, but also examined the specific changes in technological efficiency and technology in a region. On the above basis, six types of agricultural transformation can be identified, which correspond to different relative relationships among TFP, TEC, and TC (Table 2).
Agriculture is undergoing dynamic changes over time—according to the identification results of agricultural development types, we constructed a transfer matrix for agricultural development types, which can reflect the changing trend between different types [47]. Let A i j k and A i j k + 1 be agricultural development types in k period and k+1 period, respectively. Then from k to k + 1 period, the type of agricultural development changed from I to j. The change can be described by Cij(i, j = 1 .... n). According to the principles of map algebra, Cij can be obtained by using Formula (7). The matrix of the quantitative relationship between different types of agricultural development can be obtained from the Formula (8):
C i j = A i j k × 10 + A i j k + 1
(Applicable when the number of agricultural development types < 10)
A = | A 11 A 12 A 1 n A 21 A 22 A 2 n A n 1 A n 2 A n n |
where Aij is the type i agricultural development in the k period, which is changed into type j in k + 1 period; n represents the number of agricultural development types.

3. Results

Using panel data of the 87 counties (including county-level cities and districts) in Gansu Province from 1988 to 2017, this paper measured the agricultural Malmquist productivity index through Deap 2.1 software. The changes in TFP, TEC, and TC were also examined.

3.1. Identification of Agricultural Transformation Stage

The cumulative anomaly method was used to analyze the variation of TFP, TEC, and TC with time (Figure 2). The cumulative anomaly values of TFP, TEC, and TC of 1998 and 2011 are two turning points, where signal-to-noise ratios were greater than 1.0. Two significant turning points were thus identified. Then, the agricultural transformation of Gansu Province can be divided into three stages: 1988–1998, 1999–2011, and 2012–2017. In 1988–1998, the values of TFP, TEC, and TC increased with sharp fluctuations and were lower than the corresponding average values (Figure 2). In 1999–2011, the values of TFP, TEC, and TC increased with slight fluctuations and were lower than the corresponding average values (Figure 2). In 2012–2017, the values of TFP, TEC, and TC decreased with sharp fluctuations, but were greater than the corresponding average values (Figure 2). The annual growth rates of agricultural input indicators, including agricultural employees, agricultural electricity consumption, and pure fertilizer application showed a periodic decreasing trend in 1988–1998 and 1999–2011 (Figure 3). The annual growth rates of agricultural machinery power, the output values of agricultural, forestry, animal husbandry and fishery, and cash crop output showed a periodic increasing trend in 1988–1998 and 1999–2011 (Figure 3). It reveals that the overall Malmquist productivity in these two stages was mainly affected by technological inputs and agricultural outputs. During 2012–2017, agricultural employees decreased, other input and output indicators fluctuated, and the annual growth rates showed a downward trend (Figure 3). The comprehensive Malmquist productivity at this stage was affected by both input and output.
In the 1960s, American agricultural economist John Mayer divided agricultural development into three stages: Traditional agriculture, low capital technology agriculture and high capital technology agriculture. Figure 2 and Figure 3 show that in 1988–1998 with the increase of traditional inputs, such as agricultural workers and crop planting area, the output also increased. The expansion of agricultural production was achieved with an increase of various inputs and with the reduction of benefits and productivity per unit of inputs. Therefore, agriculture in this period was considered to be a traditional one. In 1999–2011, the power of agricultural machinery and agricultural electricity consumption increased significantly. Technological advancement led to significant improvement in the efficiency and growth rate of agricultural production. Low-capital technology agriculture was thus identified. In 2012–2017, the power of agricultural machinery and agricultural electricity consumption still showed upward trends, while the labor force showed a significant downward trend. Laborers were gradually replaced by agricultural machines, and the labor productivity continued to increase. A high capital technology agriculture was thus identified. To sum up, since 1988, the agricultural development of Gansu Province has undergone a transformation from traditional agriculture to low-capacity technology agriculture and then to high-capacity technology agriculture.

3.2. Spatiotemporal Variation of Agricultural Transformation and Development

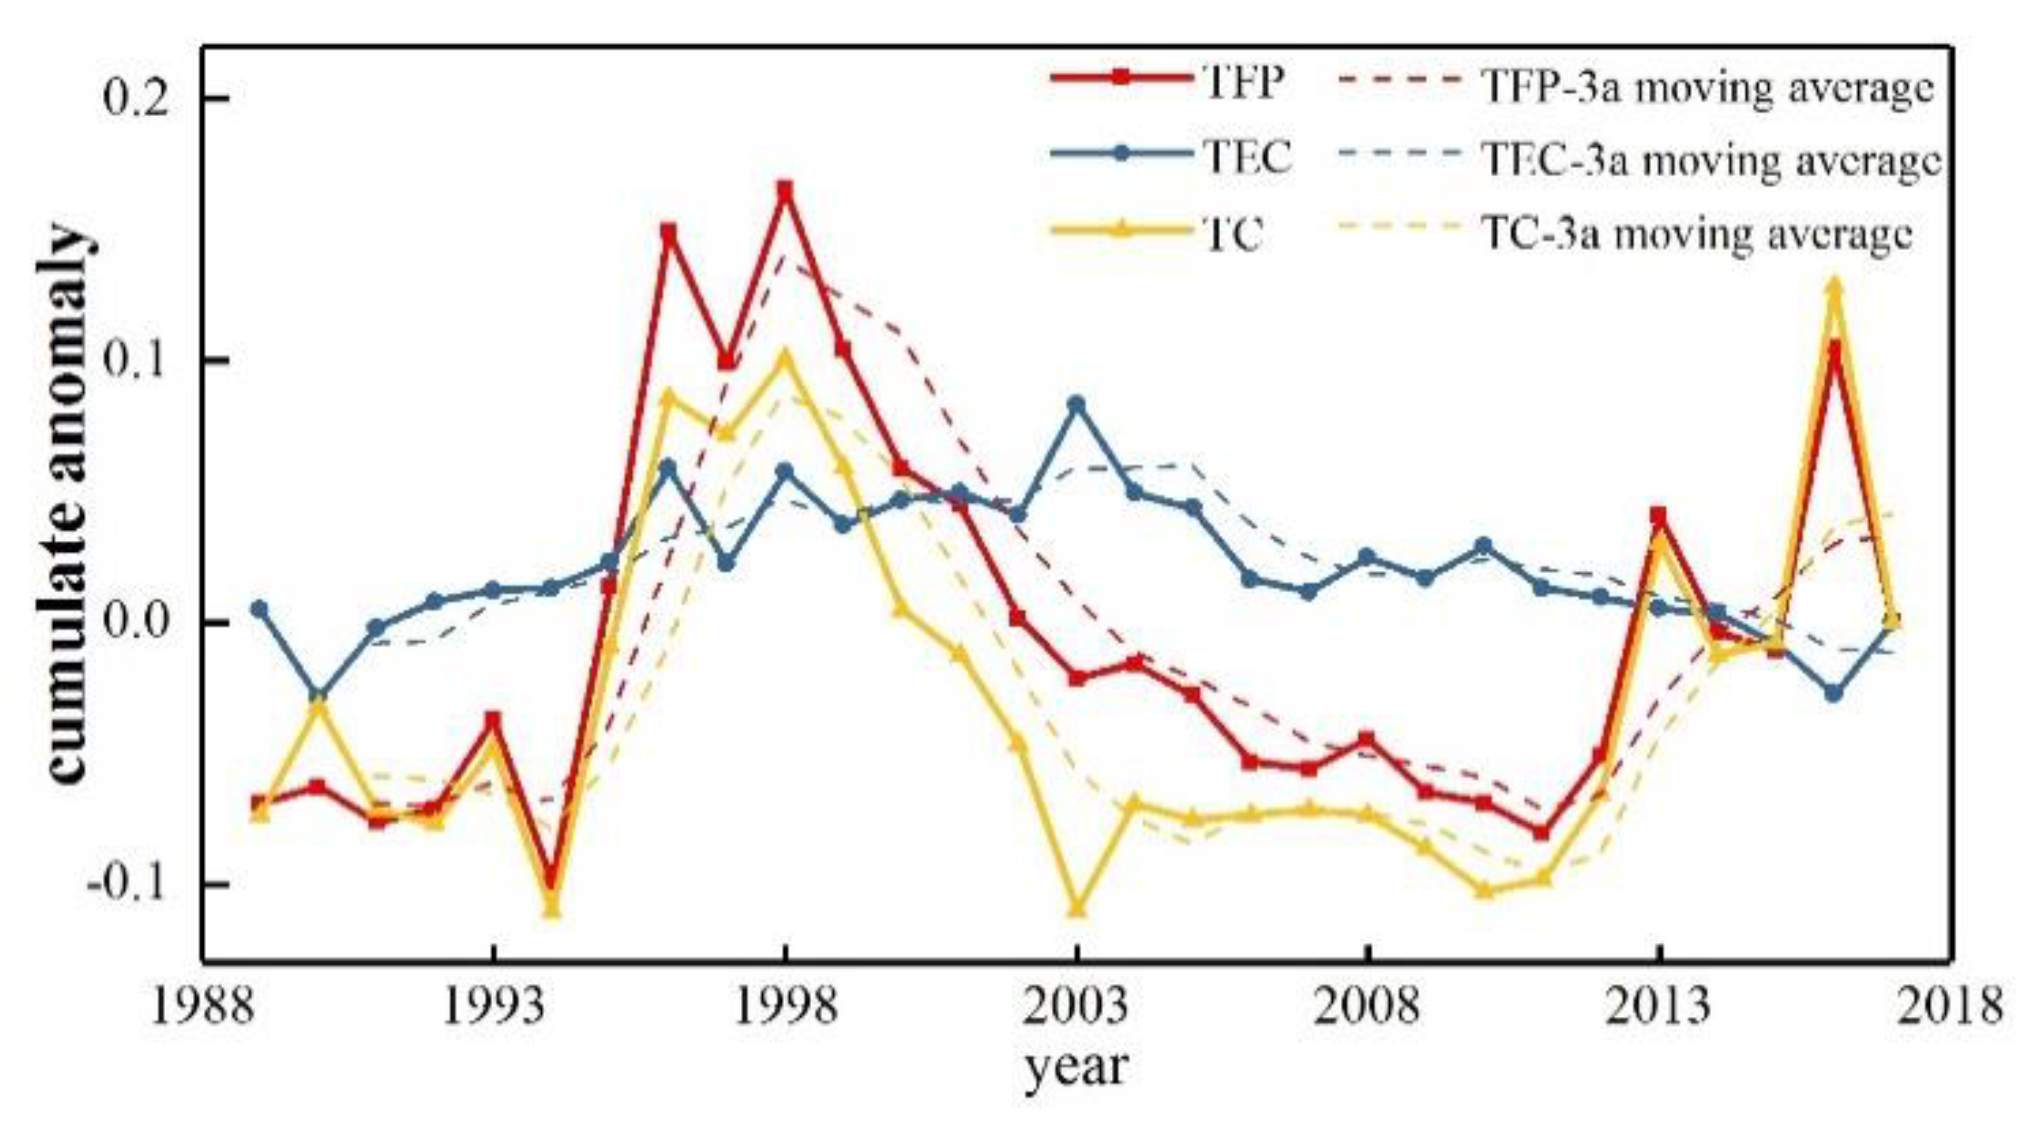
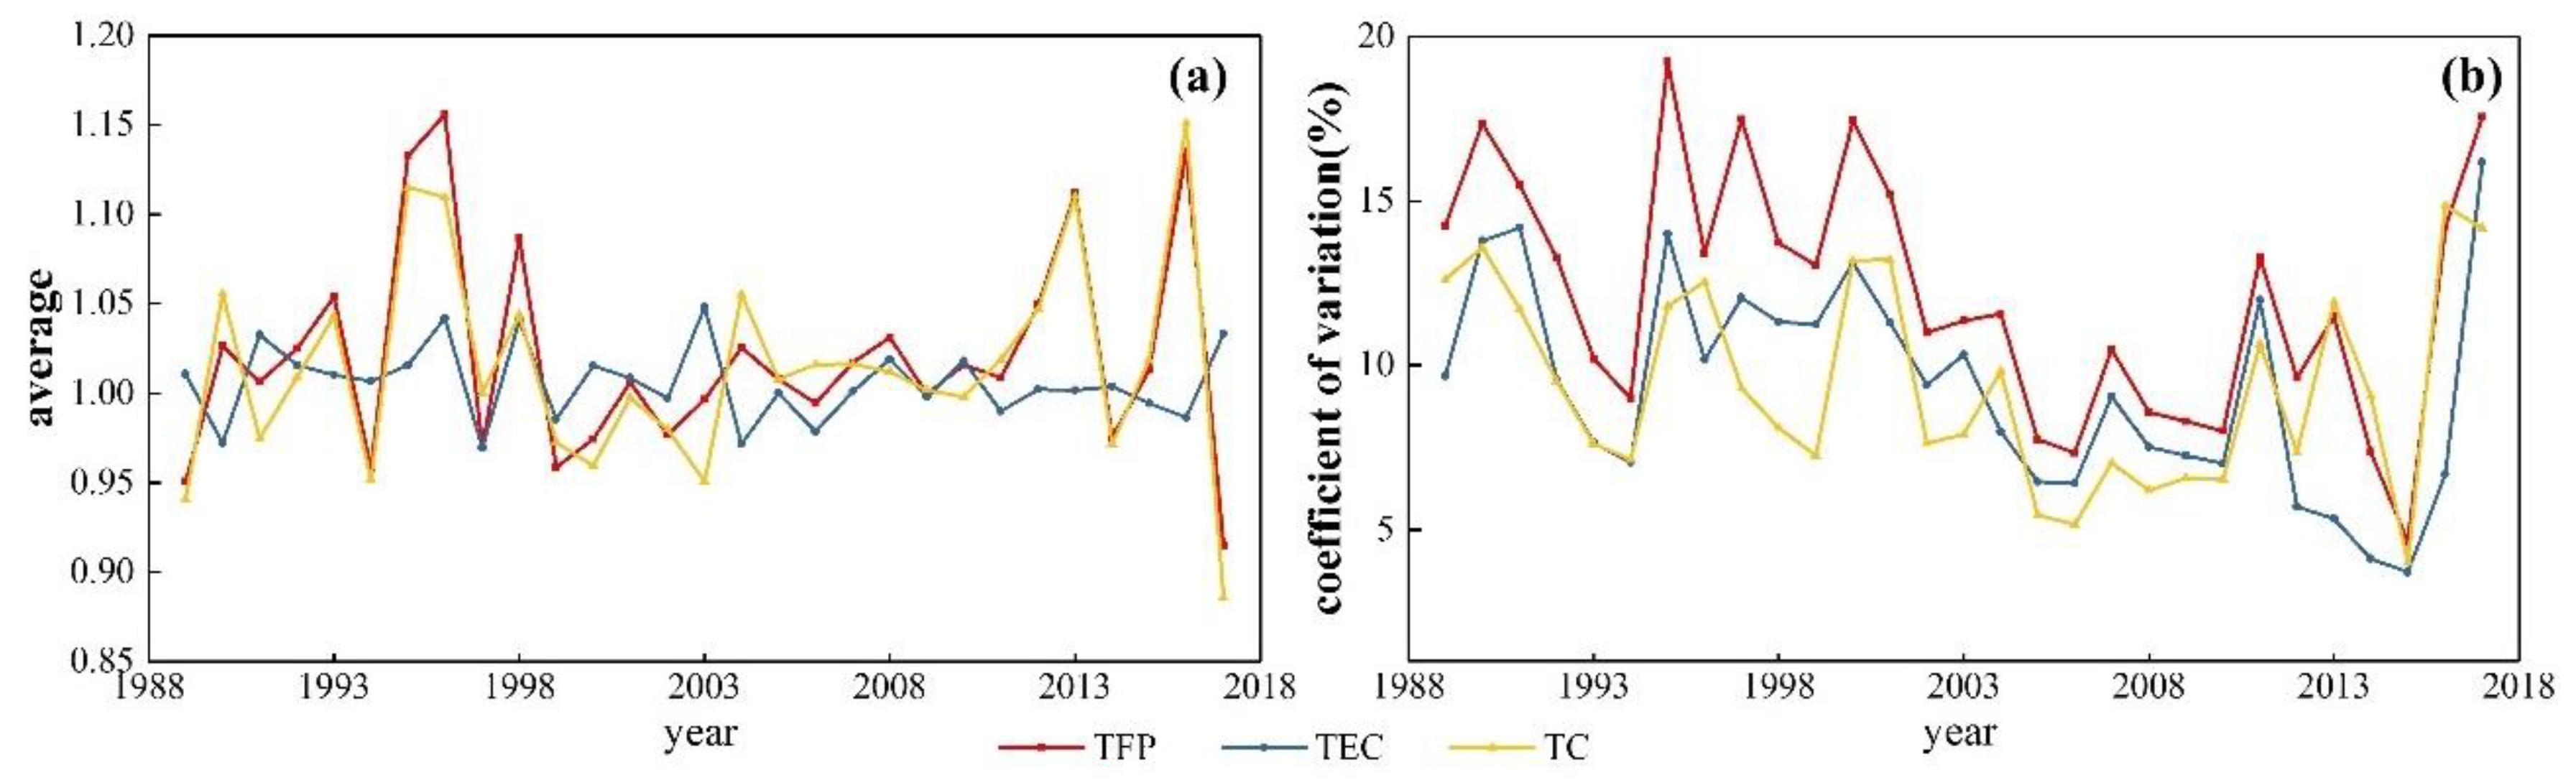
3.2.1. Time Characteristics of Agricultural TFP

During the 29 years from 1988 to 2017, the TFP value was greater than the average value (1.02) for 11 years, most of which (72.73%) were after 1995. The TFP value showed periodic U-shaped fluctuations and changed between 0.92 and 1.16 (Figure 4a). From 1989 to 1998, the TFP value increased rapidly from 0.95 to 1.16, and then declined to 0.97 in 1997. The value rose to 1.09 in 1998. During this period, the structure of the agricultural industry was fine-tuned, which was reflected in the increase in the output of cash crops and improvement in agricultural production efficiency. Among them, the proportion of planting (agricultural) output value in the total output value of agriculture, forestry, animal husbandry and fishery increased from 66.6% to 75.21%, and the proportion of the sown area of food crops in the total sown area decreased from 78.62% to 76.65%. The fluctuation was significant from 1994 to 1998. In 1994–1998, agricultural inputs continued to increase. However, the total output value of agriculture, forestry, animal husbandry, and fishery only increased a little, and grain output showed varying degrees of decrease. During the period, various natural disasters frequently occurred in Gansu Province in 1994, 1995, and 1997 (the impact of drought was the most significant in 1995), and the drought-affected areas of crops in the province reached 13,907 km2, 8343 km2 and 18,029 km2, respectively. Leading to a large reduction in crops (especially food crops) [43,44].
From 1998 to 2011, the TFP value fluctuated and increased a little. During this period, governments at all levels focused on increasing farmers’ incomes and adjusting the structure. They issued a series of policies to encourage agricultural production, intensified the adjustment of the planting industry structure, and actively suppressed summer and expanded autumn (expanded grain growth), and worked hard to improve the proportion of cash crops. At the same time, the whole province has made great efforts to fight drought. This ensures grain income and increases investment in farmland water conservancy and rural infrastructure construction. Various measures have been adopted to adapt to local conditions, such as the promotion of mulching, water-retaining agents, and mechanized dry farming and water saving to minimize the losses caused by disasters. Therefore, the change of TFP is slower than the previous stage. Besides, previous immigration policies caused a great change in scale efficiency, but this change had a lagged impact on agriculture. This period was also an important period for the transformation of the structure of the agricultural industry in China. In addition, due to the impact of the international agricultural industry on China after it entered the WTO in 2006, China’s agricultural production efficiency did not increase rapidly [26,27].
From 2012 to 2017, the TFP value fluctuates greatly, showing an alternating trend of increase and decrease. Among them, it increased slowly from 2012 to 2013, and fell to 0.98 in 2014. The main reason was that the investment increases in 2014 were more significantly than in 2013 (especially the total power of agricultural machinery increased by 28.74%). However, the output indicators have changed slightly. After that, TFP increased significantly, reaching 1.01 in 2015, and 1.14 2016. In 2017, due to the significant decline in the output of food crops and cash crops in each county, the TFP value also reached the lowest value of 0.92. Compared with that of TC, the change range of TFC was relatively small. The average value was 1.01. The TFC values in 14 years were greater than the average value. There was a strong correlation between TEC and TFP, indicating that technological efficiency was an important factor affecting agricultural TFP.
Figure 4b shows that from 1988 to 2017, the gap between TFP and its constituent indicators TEC and TC in different counties tended to decrease, and their values tended to be close to each other. In general, the coefficients of variation of the three indicators showed a downward trend and then an upward trend, from 14.25, 9.68 and 12.62 in 1988 to 4.62, 3.7, and 4.01 in 2015, respectively, and then back to the initial levels.

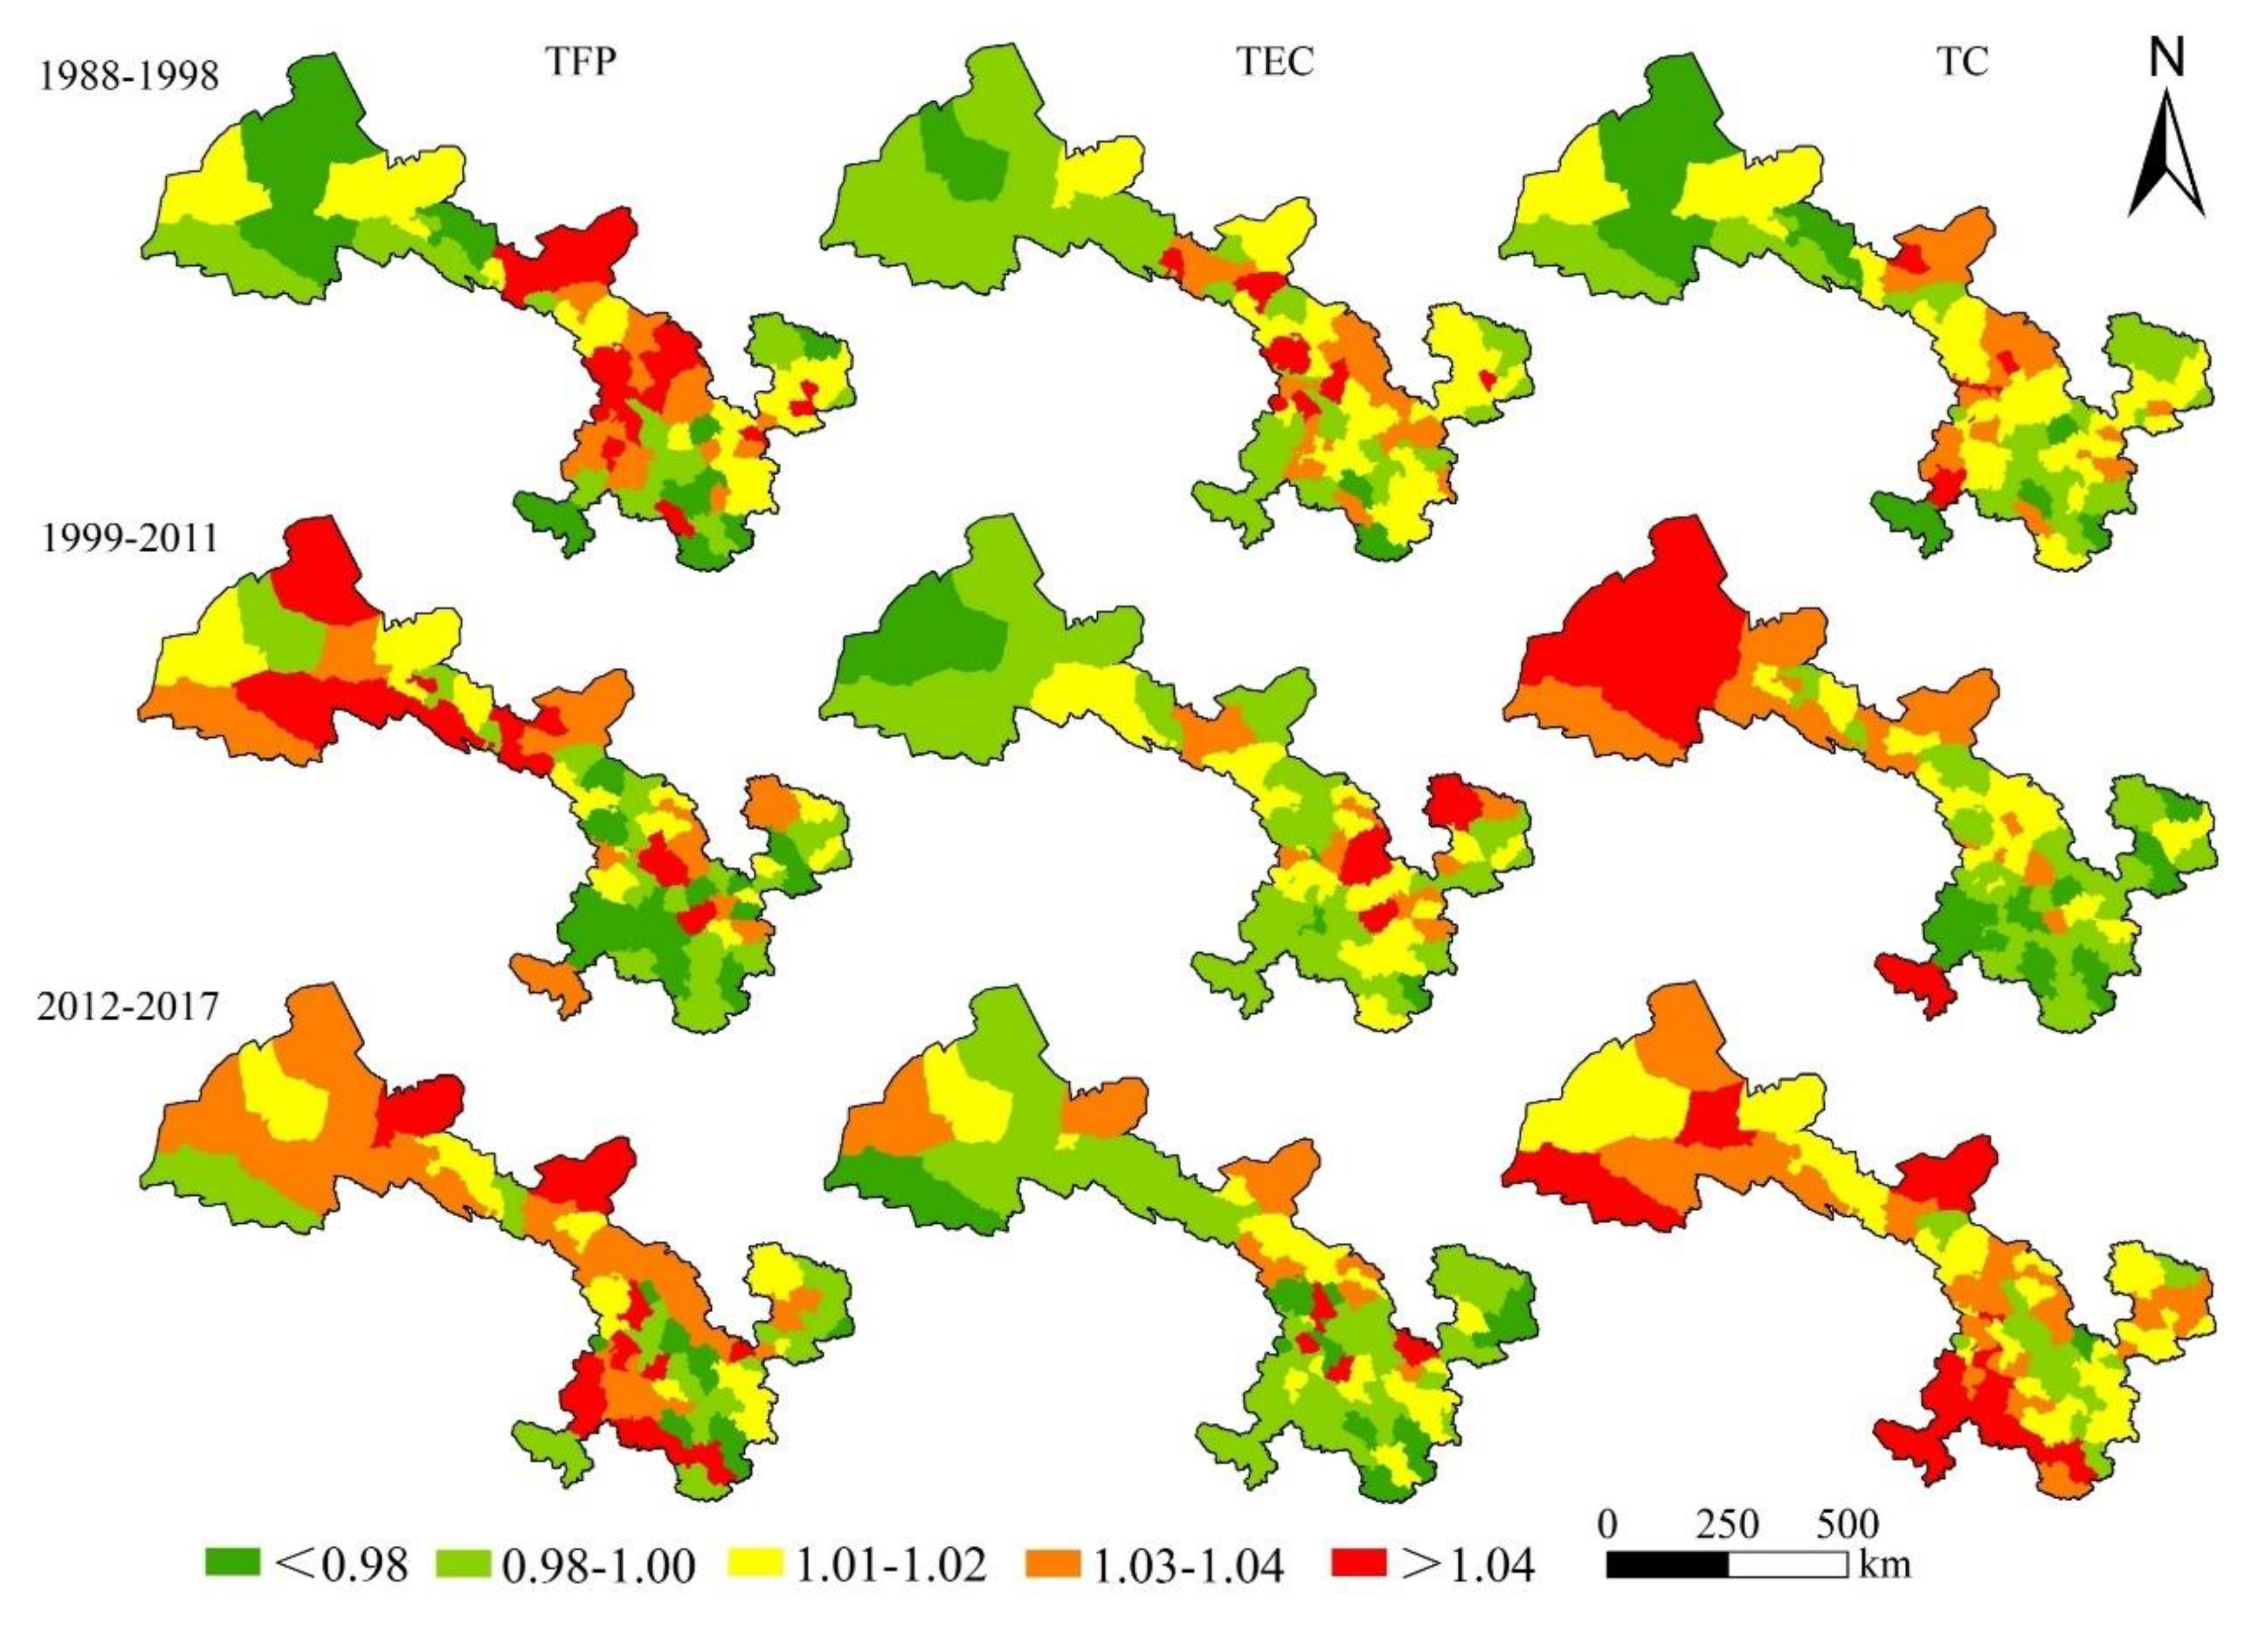
3.2.2. Spatial Characteristics of Agriculture TFP

The Global Moran’s I index is used to explore the spatial pattern characteristics of agricultural TFP in Gansu Province (Table 3). The Global Moran’s I of TFP, TEC, and TC in each period are all greater than 0, as shown in Table 3. This indicates that they show a positive correlation in spatial distribution. The p-value of TEC in 1988–1998 was less than 0.01, which failed the significance test. However, the others passed the test. In addition, the spatial distribution of TEC has gradually changed from weak agglomeration to strong agglomeration with the temporal changes of their Global Moran’s I. The pattern of continuous distribution of high or low values of TEC has become more obvious. The spatial agglomeration degree of TFP and TC has no obvious rule over time.
In Gansu Province, significant spatial variation of TFP, TEC, and TC was observed in all three periods (Figure 5). The areas with medium and high TFP values expanded from the central part to western part and then to the entire region of the province. In 1988–1998, TFP showed a spatial pattern of “high value in the middle and low value in the east and west”. Among the 87 counties, 63 (72.41%) showed TFP values greater than 1. In 1999–2011, the spatial difference in TFP between east and west of Gansu Province increased. TFP showed a spatial pattern of “high value in the west and low value in the east”, and the TFP value decreased in general. The number of counties with TFP value greater than 1 decreased to 42. The TFP value of central region decreased significantly, while that of western region increased significantly. In 2012–2017, the TFP values increased significantly compared with those in the previous stage. The number of counties with TFP value greater than 1 increased to 59, accounting for 67.82% of all evaluation units.
From 1988 to 2017, TEC showed a spatial pattern of “high value in the east and low value in the west”, and the TEC value decreased significantly. In 1988–1999, the areas with medium and high TEC values were mainly concentrated in the central and eastern regions of Gansu Province. There were 54 counties with TEC value greater than 1, accounting for 62.07% of all evaluation units. In 1999–2011, the number of counties with TEC value greater than 1 decreased to 42. The TEC value of the central region decreased significantly, while the TEC value of the northeast region increased. In 2012–2017, the number of counties with TEC value greater than 1 decreased to 32, accounting for 36.78% of all evaluation units. The distribution of areas with high TEC values tended to be scattered.
The spatial pattern of TC was similar to that of TFP. From 1988 to 2017, the TC values increased. The number of evaluation units with TC value greater than 1 increased from 57 in 1988–1998 to 72 in 2012–2017. From 1988 to 1998, the TC values of the areas surrounding Lanzhou city were higher than those of other areas, and counties with a TC value greater than 1 accounted for 78.57% of the counties in the central region. From 1999 to 2011, the spatial pattern of TC values was exactly the opposite of that in the previous stage. The TC value of the areas to the west of Lanzhou city increased significantly, and the counties with a TC value greater than 1 increased from 11 to 16. The TC values of the areas around Lanzhou city and the eastern region decreased, and the counties with a TC value smaller than 1 increased from 13 to 26. From 2012 to 2017, except for some counties, the TC value of most areas increased to varying degrees, and the proportion of counties with TC values greater than 1 increased significantly to 82.76%.
The significant spatial differences in TFP, TEC, and TC in Gansu Province from 1988 to 2017 are related to the natural and socio-economic conditions of each region. Because of the differences in natural conditions and economic foundations, the spatial level of agricultural production and development speed are unbalanced. From 1988 to 1998, TFP, TEC, and TC all showed a spatial pattern of “medium-high and low-period”, indicating that TFP during this period was jointly influenced by TEC and TC. Compared with other regions, Longzhong region (central Gansu Province) presents a significantly high-value area, which is closely related to the advantages of Longzhong region in population and industry during this period. The Liujiaxia, Yanguoxia, Bapanxia and other hydropower stations and high-voltage transmission grids in the area provide favorable conditions for the development of electrical irrigation and agricultural mechanization [48]. From 1999 to 2011, the spatial patterns of TFP and TC were similar, and the Hexi Corridor region (western Gansu Province) showed obvious high-value areas. It shows that the improvement of TFP during this period was mainly affected by TC, and the contribution of TEC was limited. During this period, the industrial structure of the Hexi Corridor area has been upgraded and optimized, and the level of agricultural mechanization has also been continuously improved. Coupled with the construction of modern agricultural demonstration zones in Jiuquan and Zhangye, the process of agricultural industrialization has been accelerated, and the comprehensive agricultural production capacity has been significantly improved [33]. From 2012 to 2017, except for the individual Longdong region (eastern Gansu Province) and Longdongnan region (southeast of Gansu Province), where the TFP and TC values were less than 1, most other regions were greater than 1. The growth of TFP during this period is still due to the contribution of TC. Although the TFP, TEC, and TC in Longdong region and Longdongnan region have increased compared with the previous two periods, the changes are not significant. This is related to its poor agricultural foundation and backward farming technology [33]. The sown areas of crops in the two regions accounted for 26.73% and 19.69% of the provinces, respectively, but the irrigated areas only accounted for 8.9% and 8.8% of the province. The degree of water conservancy is low, and agricultural planting has the characteristics of wide cropping and thin harvesting [45,48].

3.3. Evolution of Agricultural Development Types

3.3.1. Identification of Agricultural Development Types

According to the classification criteria for agricultural development types, GIS spatial query tools were used to extract areas with TFP, TEC or TC lower than 1 in 1988–1998, 1999–2011, and 2012–2017. The agricultural development types of different regions were identified through overlay analysis (Figure 6). The agricultural development type showed significant spatiotemporal variation.
In 1988–1998, the numbers of counties with type-I and type-VI agricultural development reached 22 and 26, respectively, together accounting for 55.17% of all evaluation units. The number of counties with type-II agricultural development was the smallest and only 5. In the northeast and west parts of the province, type-I agricultural development was mainly observed, and the number of such counties reached 22. In the middle region of the province, type-VI agricultural development was mainly observed, and the number of such counties reached 26. These two types of counties together accounted for 55.17% of all evaluation units. The low agricultural technological efficiency and slow technological improvement were the main reasons for the low agricultural TFP at this stage.
In 1999–2011, the number of counties with type-I agricultural development was the largest and reached 35, followed by the number of counties with type-IV agricultural development, reaching 18. These two types of counties together accounted for 60.92% of all evaluation units. The numbers of counties with type-V, type-VI type-II, and type-III agricultural development was 10, 10, 7, and 7, respectively. The agricultural development in the western part of the province changed from type I in 1988–1998 to type IV in 1999–2011. The agricultural development in the central region changed from type VI in 1988–1998 to type II in 1999–2011. The agricultural development in the eastern part of the province was still type I. However, the concentration region of this type changed from middle to south of the eastern part of the province. The number of these three types of counties reached 60, accounting for 68.97% of all evaluation units. The results indicate that low agricultural technological efficiency was very common at this stage.
In 2012–2017, the numbers of counties with type-IV and type-VI agricultural development were the largest, reaching 29 and 25, respectively. These two types of counties together accounted for 62.07% of all evaluation units. In comparison, the number of counties with type-I agricultural development decreased significantly, from 35 in 1999–2011 to 12 in 2012–2017, by 65.91%. In addition, there were no counties with type-III agricultural development. Spatially, the regions to the west of Lanzhou city were dominated by type-IV and type-VI agricultural development, and the number of such counties reached 18, accounting for 90% of all evaluation units in the region. The overall pattern of agricultural development in the regions to the east of Lanzhou city was similar to that in 1988–1998, presenting scattered distribution. The regions were also dominated by type-IV and type-VI agricultural development, and the number of such counties reached 36, accounting for 53.73% of all evaluation units in these regions.

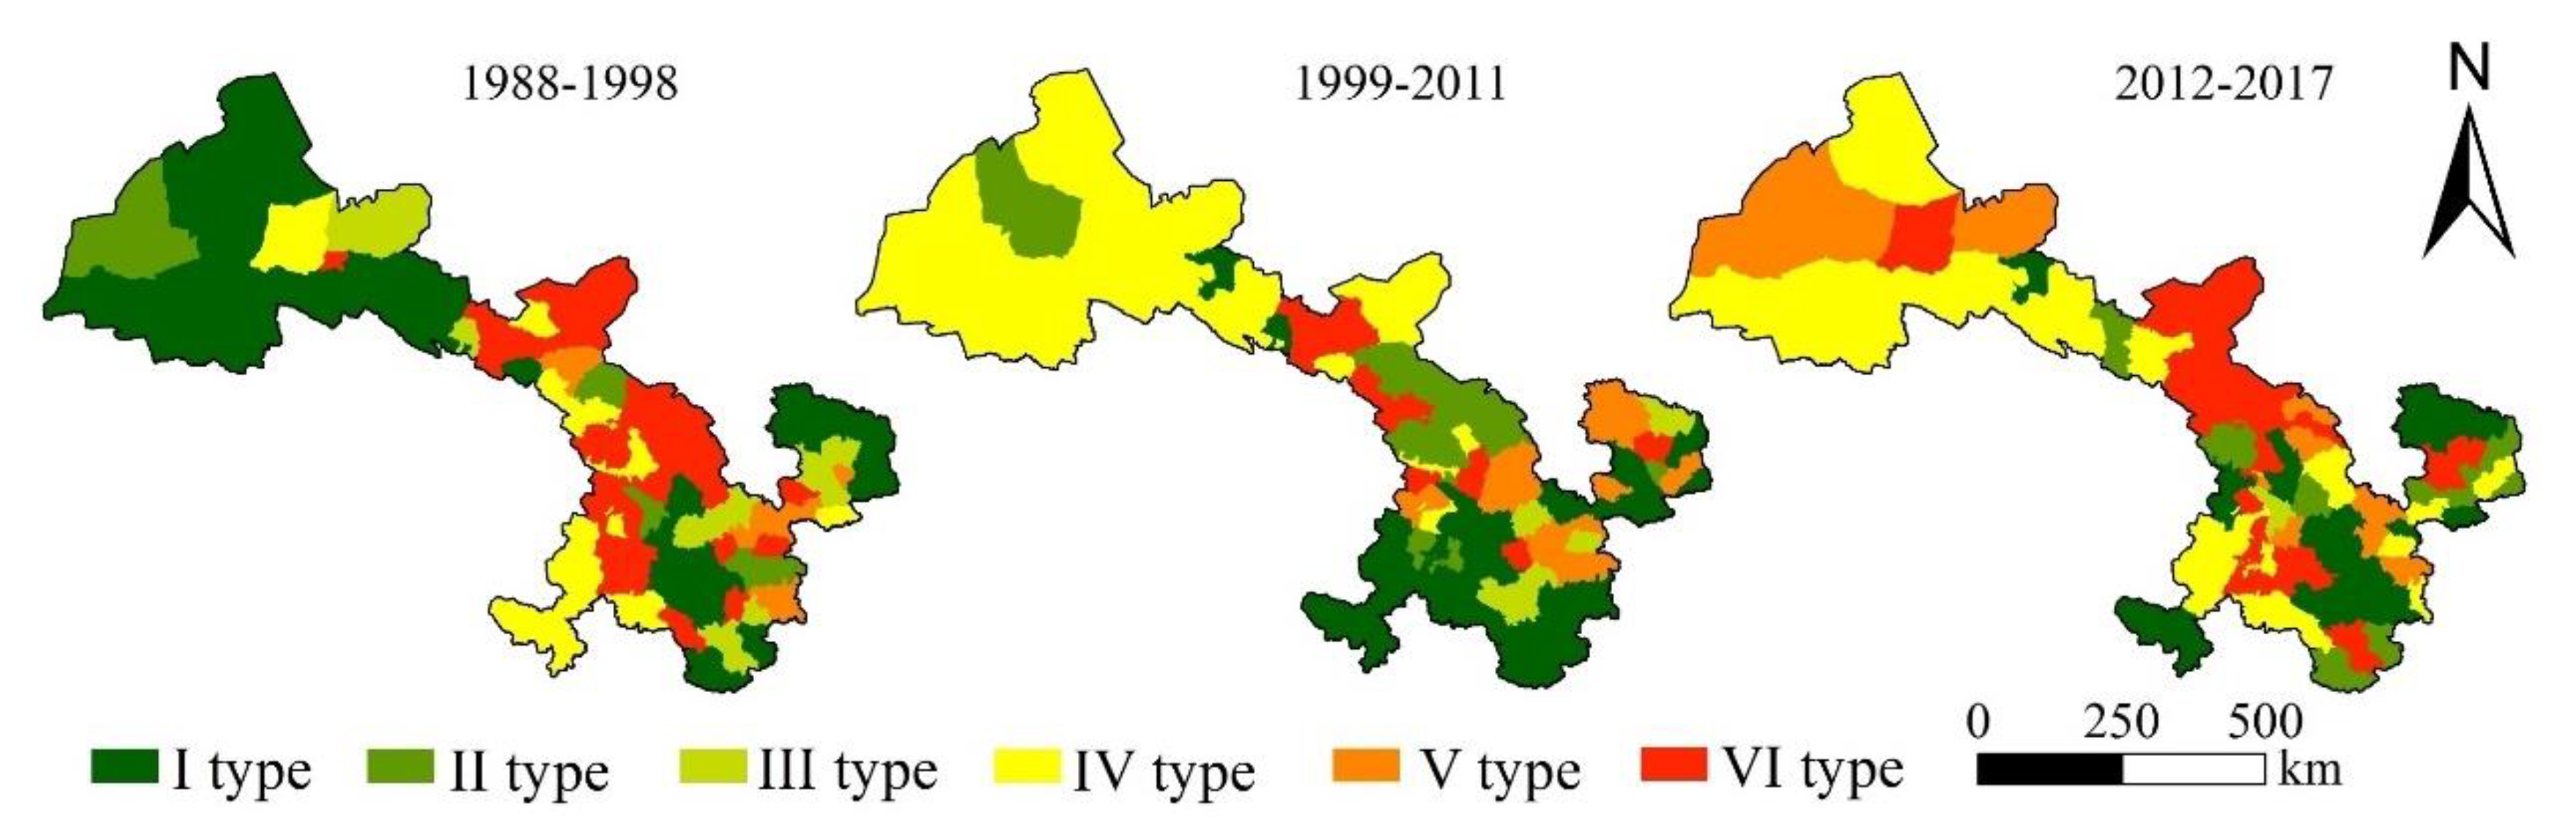
3.3.2. Evolution of Agricultural Development Types

Many regions of Gansu Province experienced changes in agricultural development types. The change process of agricultural development types in the study area was complicated. According to Equations (7) and (8), and through the overlay analysis of agricultural development types in 1988–1998, 1999–2011, and 2012–2017, we obtained the transition matrix of different types of agricultural development (Table 4).
The types of agricultural development in Gansu Province changed significantly during the three stages. From stage 1988–1998 to stage 1999–2011, there were only 26 (29.88%) counties that experienced no change of agricultural development type. From stage 1999–2011 to stage 2012–2017, there were 17 (19.54%) counties with no change of agricultural development type. From stage 1988–1998 to stage 1999–2011, counties originally with type-I and type-VI agricultural development changed the most. It was found that 54.55% (12) and 76.92% (20) of counties originally with type-I and type-VI agricultural development changed to other types. Fifty percent of counties originally with type-I agricultural development changed to counties with type-IV agricultural development. 40%, 75%, 36.36%, 71.43% and 40% of counties originally with type-II, type-III, type-IV, type-V and type-VI agricultural development, respectively, changed to counties with type-I agricultural development. The results indicate that around 1998 the change in agricultural TFP was gradually due to both low technological efficiency and slow technological improvement. From the period 1999–2011 to period 2012–2017, the counties with type-I agricultural development changed the most. It was found that 88.57% (31) of counties originally with type-I agricultural development changed to other types, such as IV (35.48%), VI (32.26%), II (29.03%), etc. The shift from types II, III and V to types IV or VI was also observed. The results indicate that the change in agricultural TFP around 2011 was gradually due to low technological efficiency or slow technological improvement instead of them. This was exactly the opposite of that around 1998. In sum, from the perspective of TFP, influencing factors of agricultural development had undergone a transition from both technological efficiency and technological improvement to technological efficiency or technological improvement.

4. Discussion

From 1988 to 2017, the agricultural development of Gansu Province experienced a transition from traditional agriculture to low-capacity technology agriculture and then to high-capacity technology agriculture. Agricultural TFP in Gansu Province showed periodic U-shaped fluctuations with time. The gap between TFP and its constituent indicators TEC and TC in different counties tended to decrease, and their values tend to be close to each other. Gansu Province presented a significant spatiotemporal variation of agricultural development types. The influencing factors of agricultural development had undergone a transition from both technological efficiency and technological improvement to technological efficiency or technological improvement
There has been research on the types or models, trend characteristics, dynamic mechanisms and influencing factors of agricultural and rural transformation [9,11]. However, few scholars have accurately studied the stage characteristics of agricultural transformation in Gansu Province. In the present study, from the perspective of TFP, we divided the agricultural transformation in Gansu Province into three stages, identified different types of agricultural development and studied the evolution of agricultural development type in the research area. Specifically, the cumulative anomaly method was used to accurately determine the year at which agricultural TFP experienced abrupt change. Then, the signal-to-noise ratio was calculated to test whether the two selected years meet the criteria for the abrupt change in TFP. On this basis, the agricultural transformation in Gansu Province was divided into three stages. Different types of agricultural development were identified in Gansu Province. Transition matrix model was used to analyze the evolution of various agricultural development types at different stages in Gansu Province.
The agricultural TFP in Gansu Province is significantly affected by technological efficiency and technological progress. Agricultural TFP and its constituent indicators TEC and TC present significant spatiotemporal variation in Gansu Province. The main reason is that the ability to resist risks is weak when encountering natural disasters. This leads to a reduction of crop production. Another reason is that the disordered and unreasonable input structure in the process of agricultural structural adjustment leads to input redundancy. Therefore, the future focus of agricultural transformation and development in Gansu Province should be on promoting the sustainable and effective increase of agricultural income, and accelerating the development of modern agriculture. First, the government should recognize that the rural infrastructure is poor. In addition, rural agriculture has poor resistance to risks, such as drought, flood, and waterlogging [40,47]. It is necessary to improve agricultural infrastructure, such as water conservancy transportation and production conditions, in order to enhance the comprehensive competitiveness of agriculture and realize mechanization and industrialization [46]. Secondly, the efficiency of agricultural technology should be improved to reduce the negative impact of low agricultural technological efficiency on agricultural TFP.
The agricultural TFP and its decomposition index have significant and unstable spatial differences at different stages. The main reason is that the natural conditions and economic foundations of various regions in Gansu Province are very different, which has caused the imbalance in the level of agricultural production and development speed between eastern and western regions, mountainous and Sichuan regions, and agricultural and pastoral areas [36]. According to the difference in agricultural TFP among different regions, the government should formulate and implement region-specific measures, rationally construct the distribution of agricultural productivity, promote specialized production, improve economic efficiency, and promote agricultural transformation and upgrading [39,49,50,51]. In addition, the government should continue to further promote the development of characteristic agriculture on the basis of the original agriculture, for example, Dingxi-based potato planting and commercial potato production bases; Longdong region and Longdongnan region high-quality apple production bases; Linxia and Gannan livestock breeding bases; Dingxi and Longnan Chinese medicinal materials production bases and Hexi Corridor hybrid corn, melon and vegetable seed production bases.
Finally, the government should also focus on the formulation and implementation of policies. For example, the government should deepen the reform of the rural land system, improve land transfer policies, and accelerate the formulation of relevant laws and regulations on the transfer of land contractual management rights. These can promote the standardized and orderly transfer of rural land use rights, promote the optimal allocation of rural land resources, and solve the problems of small-scale operations and scattered cultivated lands. In addition, the government should increase rural human capital investment, establish an agricultural human resource development and training system that suits the actual national conditions. Furthermore, the government improve the quality of farmers, and cultivate entrepreneurial farmers and new types of farmers [19,52].
According to the three stages of agricultural development proposed by John Mayer, the agricultural development in Gansu Province was divided into three stages based on agricultural TFP. In future research, the research area should be expanded to explore the applicability of John Mayer’s theory to the agricultural development of China. Moreover, Due to the long study period and difficulties in data collection, the selected indicators are limited. In fact, agricultural input should include various indicators, such as agricultural water conservancy, chemistry, and mechanization. The agricultural output should also include output indicators, such as agriculture, forestry, animal husbandry, and fishery [23,26,27]. In the future, more indicators will be used to comprehensively evaluate agricultural TFP. In addition, in the context of China’s vigorous promotion of agricultural modernization, future research will focus on the problems in agricultural development, methods to accelerate the transformation and upgrading of China’s traditional agriculture, the mechanism that underlies the spatiotemporal variation of agricultural transformation types, and the coupling between agricultural transformation and rural transformation.

5. Conclusions

(1)
The agricultural transformation of Gansu Province was divided into three stages: 1988–1998, 1999–2011, and 2012–2017. In 1988–1998, the agricultural TFP presented sharp fluctuations below the average value, indicating traditional agriculture. In 1999–2011, the agricultural TFP presented small fluctuations, rose in general and was still below the average value, indicating low-capital technology agriculture. In 2012–2017, the agricultural TFP presented large fluctuations, decreased in general, but was greater than the average value, indicating high-capital technology agriculture.
(2)
During the 29 years from 1988 to 2017, the TFP value was greater than the average value (1.02) for 11 years, most of which (72.73%) were after 1995. The TFP value changed between 0.92 and 1.16, and exhibited periodic U-shaped fluctuations with time. The importance of agricultural TFP is mainly from TC, and the contribution of TEC is limited. In terms of space, agricultural TFP and its decomposition indicators have significant and unstable spatial differences at different stages, showing a strong imbalance. The areas with medium or high TFP values expanded from the central region to the western region and then to the entire region of the province. TEC showed a spatial pattern of high-value in the east and low value in the west of the province. The TEC values showed a significant downward trend with time. The spatial pattern of TC was similar to that of TFP and increased with time.
(3)
From 1988 to 1998, type-I and type-VI agricultural development were mainly observed in Gansu Province, and such counties accounted for 55.17% of all evaluation units. From 1999 to 2011, the number of counties with type-I agricultural development was the largest, reaching 35, followed by the number of counties with type-IV agricultural development, reaching 18. These two types of counties together accounted for 60.92% of all evaluation units. From 2012 to 2017, the numbers of counties with type-IV and type-VI agricultural development were the largest, reaching 29 and 25, respectively. These two types of counties together accounted for 62.07% of all evaluation units.
(4)
The agricultural development types frequently changed in Gansu Province. The change in agricultural TFP was due to both low technological efficiency and slow technological progress around 1998. The change in agricultural TFP was due to low technological efficiency or slow technological progress instead of them around 2011.
(5)
The main reason for the significant fluctuation of TFP and its index in time is due to the weak ability to resist risks and the disordered and unreasonable input structure. Therefore, agricultural infrastructure and production conditions should be improved. The investment and construction in water conservancy, transportation and infrastructure should be strengthened. The reason for the significant spatial difference and imbalance in space is that the natural conditions and economic foundations of various regions are quite different. This results in an imbalance in the level of agricultural production and development speed in space. According to the differences in TFP of agriculture in different regions, regionally differentiated measures should be formulated and implemented. Various measures should be adopted in accordance with local conditions to make full use of natural advantages to rationally construct the layout of agricultural productivity. Ultimately, these measures will improve the comprehensive competitiveness of agricultural production and promote the transformation and upgrading of agriculture.

Author Contributions

Conceptualization, M.C., L.M., and X.C.; methodology, M.C., L.M., and H.D.; validation, M.C., L.M., X.C., and H.D.; formal analysis, M.C., and L.M.; data curation, M.C., X.C. and H.D.; writing—original draft preparation, M.C., L.M., X.C., and H.D.; writing—review and editing, M.C., and L.M.; supervision, M.C., and L.M. All authors have read and agreed to the published version of the manuscript.

Funding

This work was supported by the National Natural Science Foundation of China under Grant No. 41961033.

Acknowledgments

Authors express great thank to the financial support from National Natural Science Foundation of China.

Conflicts of Interest

The authors declare no conflict of interest.

References

  1. Bukharin, N.; Lenin, V.I. Imperialism and World Economy; International Publishers: New York, NY, USA, 1929; Volume 4. [Google Scholar]
  2. Bukharin, N.; Preobrazhenskiĭ, E.A. ABC of Communism; Socialist Labour Press: Cambridge, UK, 1921. [Google Scholar]
  3. Koppel, B.; Zurick, D. Rural transformation and the future of agricultural development policy in Asia. Am. J. Agric. Econ. 1988, 28, 283–301. [Google Scholar] [CrossRef]
  4. Goldman, A.; Smith, J. Agricultural transformations in India and Northern Nigeria: Exploring the nature of Green Revolutions. World Dev. 1995, 23, 243–263. [Google Scholar] [CrossRef]
  5. Grigg, D. The Transformation of Agriculture in the West; Blackwell Publishers: Oxford, UK, 1992. [Google Scholar]
  6. Federico, G. Feeding the World: An Economic History of Agriculture, 1800–2000; Princeton University Press: Princeton, NJ, USA, 2008. [Google Scholar]
  7. Pinilla, V.; Willebald, H. Agricultural Development in the World Periphery; Springer International Publishing: Berlin, Germany, 2018. [Google Scholar]
  8. Ge, D.; Long, H.; Qiao, W.; Wang, Z.; Sun, D.; Yang, R. Effects of rural–urban migration on agricultural transformation: A case of Yucheng City, China. J. Rural. Stud. 2020, 76, 85–95. [Google Scholar] [CrossRef]
  9. Huang, J.; Pray, C.; Rozelle, S. Enhancing the crops to feed the poor. Nature 2002, 418, 678–684. [Google Scholar] [CrossRef]
  10. Barrett, C.B.; Christian, P.; Shimeles, A. The processes of structural transformation of African agriculture and rural spaces. World Dev. 2018, 105, 283–285. [Google Scholar] [CrossRef]
  11. Chen, L.; Hu, W.; Long, C.; Wang, D. Exogenous plant growth regulator alleviate the adverse effects of U and Cd stress in sunflower (Helianthus annuus L.) and improve the efficacy of U and Cd remediation. Chemosphere 2020, 262, 127809. [Google Scholar] [CrossRef]
  12. John, W. The Economics of Agricultural Development; Cornell University Press: New York, NY, USA, 1969. [Google Scholar]
  13. Raanan, W. Rural Development in a Changing World; The MIT Press: Boston, MA, USA, 1971. [Google Scholar]
  14. Takeshima, H. Geography of plant breeding systems, agroclimatic similarity, and agricultural productivity: Evidence from Nigeria. Agric. Econ. 2018, 50, 67–78. [Google Scholar] [CrossRef]
  15. Belton, B.; Filipski, M. Rural transformation in central Myanmar: By how much, and for whom? J. Rural Stud. 2019, 67, 166–176. [Google Scholar] [CrossRef]
  16. Li, J.; Jia, L.; Liu, Y.; Yang, Y.; Jiang, N. Measuring model of rural transformation development path in Fuping County of Beijing-Tianjin-Hebei region. Habitat Int. 2018, 74, 48–56. [Google Scholar] [CrossRef]
  17. Bezu, S.; Holden, S. Are rural youth in Ethiopia abandoning agriculture? World Dev. 2014, 64, 259–272. [Google Scholar] [CrossRef] [Green Version]
  18. Rozelle, S.; Taylor, J.E.; Debrauw, A. Migration, remittances, and agricultural productivity in China. Am. Econ. Rev. 1999, 89, 287–291. [Google Scholar] [CrossRef]
  19. Weber, W.L.; Domazlicky, B.R. Total factor productivity growth in manufacturing: A regional approach using linear programming. Reg. Sci. Urban Econ. 1999, 29, 105–122. [Google Scholar] [CrossRef]
  20. Jorgenson, D.W.; Griliches, Z. The explanation of productivity change. Rev. Econ. Stud. 1967, 34, 249–283. [Google Scholar] [CrossRef]
  21. Mao, W.; Koo, W.W. Productivity growth, technological progress, and efficiency change in chinese agriculture after rural economic reforms: A DEA approach. China Econ. Rev. 1997, 8, 157–174. [Google Scholar] [CrossRef]
  22. Wu, S.; Walker, D.; Devadoss, S.; Lu, Y.C. Productivity growth and its components in Chinese agriculture after reforms. Rev. Dev. Econ. 2001, 5, 375–391. [Google Scholar] [CrossRef] [Green Version]
  23. Quan, B.Z. Empirical analysis of agricultural total factor productivity growth in China: From 1978 to 2007. Chin. Rural Econ. 2009, 9, 36–47. [Google Scholar]
  24. Moghaddasi, R.; Pour, A.A. Energy consumption and total factor productivity growth in Iranian agriculture. Energy Rep. 2016, 2, 218–220. [Google Scholar] [CrossRef] [Green Version]
  25. Ang, F.; Kerstens, P.J. Decomposing the Luenberger–Hicks–Moorsteen total factor productivity indicator: An application to U.S. agriculture. Eur. J. Oper. Res. 2017, 260, 359–375. [Google Scholar] [CrossRef]
  26. Ma, X.D.; Sun, X.X. Space-time evolvement and problem area diagnosis of agriculture transformation development in Jiangsu Province since 2000—Based on a total factor productivity perspective. Econ. Geogr. 2016, 36, 132–138. [Google Scholar]
  27. Yin, C.J.; Li, Z.L.; Li, Q.N.; Zhao, T.L. Spatiotemporal evolvement and problem region diagnosis of agricultural transformation in Chongqing city: Based on a total factor productivity perspective. J. Nat. Resour. 2019, 34, 573–585. [Google Scholar]
  28. Jin, S.; Huang, J.; Hu, R.; Rozelle, S. The creation and spread of technology and total factor productivity in China’s agriculture. Am. J. Agric. Econ. 2002, 84, 916–930. [Google Scholar] [CrossRef]
  29. Liu, S.W.; Zhang, P.Y.; Song, F.B.; Pan, X.H.; Wen, X. Measuring the agricultural modernization level of heilongjiang reclamation areas in China. Sci. Geogr. Sin. 2018, 38, 1051–1060. [Google Scholar]
  30. Kalirajan, K.P.; Obwona, M.B.; Zhao, S. A Decomposition of Total Factor Productivity Growth: The Case of Chinese Agricultural Growth before and after Reforms. Am. J. Agric. Econ. 1996, 78, 331–338. [Google Scholar] [CrossRef]
  31. Wu, Y.; Wei, Y.D.; Li, H. Firm suburbanization in the context of urban sprawl: Neighborhood effect and sectoral difference. Prof. Geogr. 2020, 1–20. [Google Scholar] [CrossRef]
  32. Ge, D.; Zhou, L.; Long, H.; Qiao, W.; Li, Y. Types of agricultural production transformation and implications for rural vitalization: A case of the Huang-Huai-Hai Plain. Progr. Geogr. 2019, 38, 1329–1339. [Google Scholar] [CrossRef] [Green Version]
  33. Vandercasteelen, J.; Beyene, S.T.; Minten, B.; Swinnen, J. Cities and agricultural transformation in Africa: Evidence from Ethiopia. World Dev. 2018, 105, 383–399. [Google Scholar] [CrossRef]
  34. Fang, F. Research of spatial and temporal pattern of agricultural production efficiency and its convergence in Beijing-Tianjin-Hebei Region. World Reg. Stud. 2019, 28, 130–140. [Google Scholar]
  35. Wang, Y.; Zhou, Q. Evaluation of development of agricultural modernization in Central China. IERI Procedia 2013, 4, 417–424. [Google Scholar] [CrossRef] [Green Version]
  36. Zheng, H.X.; Feng, Z.M. The analysis on development dominance ratio of agricultural resources in Gansu Province. Geogr. Res. 2007, 5, 1013–1020. [Google Scholar]
  37. Tan, C.F. Technological progress, Technological efficiency and Agricultural Productivity Growth—An empirical analysis in Gansu Province. Chin. J. Agric. Res. Reg. Plan. 2015, 36, 93–98. [Google Scholar]
  38. Gao, H.R.; Chen, Y. Analysis of temporal Difference of Agricultural Total factor productivity in Gansu Province. Prod. Res. 2020, 6, 61–63. [Google Scholar]
  39. Zheng, H.X.; Feng, Z.M.; You, S.C. A study on potential land productivity based on GIS technology in Gansu Province. Progr. Geogr. 2003, 4, 400–408 + 437–438. [Google Scholar]
  40. Wen, X.H.; Wu, X.Q.; Gao, M. Spatiotemporal variability of temperature and precipitation in Gansu Province (Northwest China) during 1951–2015. Atmos. Res. 2017, 197, 132–149. [Google Scholar] [CrossRef]
  41. Qin, G.; Zhang, P.; Hou, X.; Wu, S.; Wang, Y. Risk assessment for oil leakage under the common threat of multiple natural hazards. Environ. Sci. Pollut. Res. 2020, 27, 16507–16520. [Google Scholar] [CrossRef] [PubMed]
  42. Yan, G.F.; Wang, M.N.; Yu, L.; Duan, R.Y.; Xia, P.X. Effects of ambient pressure on smoke movement patterns in vertical shafts in tunnel fires with natural ventilation systems. Build. Simul. 2020, 13, 931–941. [Google Scholar] [CrossRef]
  43. Fare, R.; Grosskopf, S.; Norris, M.; Zhang, Z. Productivity growth, technical progress and efficiency change in industrialized countries. Am. Econ. Rev. 1994, 87, 66–83. [Google Scholar]
  44. Zhang, Y.H.; Song, X.F. Techniques of abrupt change detection and trends analysis in hydroclimatic time-series. Arid Land Geogr. 2015, 38, 652–665. [Google Scholar]
  45. Gao, X.; Shen, J.; He, W.; Sun, F.; Kong, Y. An evolutionary game analysis of governments’ decision-making behaviors and factors influencing watershed ecological compensation in china. J. Environ. Manag. 2019, 251, 109592. [Google Scholar] [CrossRef]
  46. Zhao, F.F.; Xu, Z.X.; Huang, J.X. Long-term trend and abrupt change for major climate variables in the upper Yellow River Basin. Acta Meteorol. Sin. 2007, 21, 204–214. [Google Scholar]
  47. Zhang, R.T.; Jiao, H.F. Land use pattern evolution and scene simulation in Zhenjiang. Econ. Geogr. 2015, 35, 156–162. [Google Scholar]
  48. Wang, Z.; Deng, X.; Li, X.; Zhou, Q.; Yan, H. Impact analysis of government investment on water projects in the arid Gansu Province of China. Phys. Chem. Earth Parts A/B/C 2015, 79, 54–66. [Google Scholar] [CrossRef]
  49. Ren, C.; Guo, P.; Tan, Q.; Zhang, L. A multi-objective fuzzy programming model for optimal use of irrigation water and land resources under uncertainty in Gansu Province, China. J. Clean. Prod. 2017, 164, 85–94. [Google Scholar] [CrossRef]
  50. Sun, X.X.; Ma, X.D. On pattern evolution and driving factor of agriculture modernization in Jiangsu Province. Econ. Geogr. 2016, 36, 123–130. [Google Scholar]
  51. Wu, Y.; Wei, Y.D.; Li, H. Analyzing spatial heterogeneity of housing prices using large datasets. Appl. Spat. Anal. Policy 2019, 13, 223–256. [Google Scholar] [CrossRef]
  52. Li, D.; Wei, Y.D.; Miao, C.; Wu, Y.; Xiao, W. Innovation, Network Capabilities, and Sustainable Development of Regional Economies in China. Sustainability 2019, 11, 4770. [Google Scholar] [CrossRef] [Green Version]
Figure 1. Location map of Gansu Province.
Agriculture 10 00363 g001
Figure 2. The trend of the cumulative anomaly of agricultural TFP, TEC, and TC with time in Gansu Province.
Agriculture 10 00363 g002
Figure 3. Agricultural input-output changes in Gansu Province from 1988 to 2017.
Agriculture 10 00363 g003
Figure 4. Trends of (a) agricultural TFP, TEC, and TC of Gansu Province and (b) their coefficients of variation with time.
Agriculture 10 00363 g004
Figure 5. Spatial patterns of TFP, TEC, and TC in Gansu Province from 1988 to 2017.
Agriculture 10 00363 g005
Figure 6. Spatial patterns of agricultural development types in Gansu Province in 1988–2017.
Agriculture 10 00363 g006
Table 1. Indicator system for evaluating agricultural Total Factor Productivity (TFP) in Gansu Province.
Indicator TypeIndicatorMeanStandard DeviationMinimum ValueMaximum Value
Agricultural inputsAgricultural workers (10,000 people) X1 8.055.570.0131.37
Crop planting area (hm2) X243.90 33.950.00163.05
Agricultural machinery power (kw·h) X3 150,907.73177,725.02963.001,597,621.00
Agricultural electricity consumption (kw·h) X43668.004538.3211.7246,881.82
Pure fertilizer application (kg) X57871.149364.240.0088,811.00
Agricultural outputTotal output value of agriculture, forestry, animal husbandry and fishery (Yuan) Y1 48,594.5750,698.560.00580,380.31
Output of food crops (kg) Y2 100,052.7489,299.460.00681,908.87
Output of cash crops Y3 0.12830.09210.000.6852
Table 2. Classification criteria for different types of agricultural development. TEC, technological efficiency change; TC, technological change.
TypesDescriptionRelative Relationship
ILow technological efficiency and slow technological change cause lag of TFP improvementTFP < 1 ∩ TEC < 1 ∩ TC < 1
IILow technological efficiency causes lag of TFP improvementTFP1 ∩ TEC < 1 ∩ TC > 1
IIISlow technological change causes lag of TFP improvementTFP < 1 ∩ TEC > 1 ∩ TC < 1
IVLow technological efficiencyTFP > 1 ∩ TEC < 1 ∩ TC > 1
VSlow technological changeTFP > 1 ∩ TEC > 1 ∩ TC < 1
VIHigh technological efficiency and fast technological changeTFP > 1 ∩ TEC > 1 ∩ TC > 1
Table 3. Global Moran’s I of agricultural TFP, TEC, and TC in Gansu Province.
IndexTFPTECTC
Year1988–19981999–20112012–20171988–19981999–20112012–20171988–19981999–20112012–2017
Moran’s I0.3450.122 0.227 0.074 0.121 0.133 0.343 0.161 0.134
Z(I)9.3013.475 6.422 2.211 3.456 3.836 9.399 4.586 4.151
p-value0.0000.001 0.000 0.027 0.001 0.000 0.000 0.000 0.000
Table 4. Evolution of agricultural development types in Gansu Province from 1988 to 2017.
Year1988–1998
Types ofTotal
1999–2011102645835
1011137
3121007
61160418
11012510
10021610
Total225101592687
Year1999–2011
Types ofTotal
2012–201740322112
90022316
0000000
112383229
1111105
104052425
Total357718101087

