Effects of Mass Selection on Husk and Cob Color in Five Purple Field Corn Populations Segregating for Purple Husks

 , ,
, ,
Abstract
1. Introduction
2. Materials and Methods
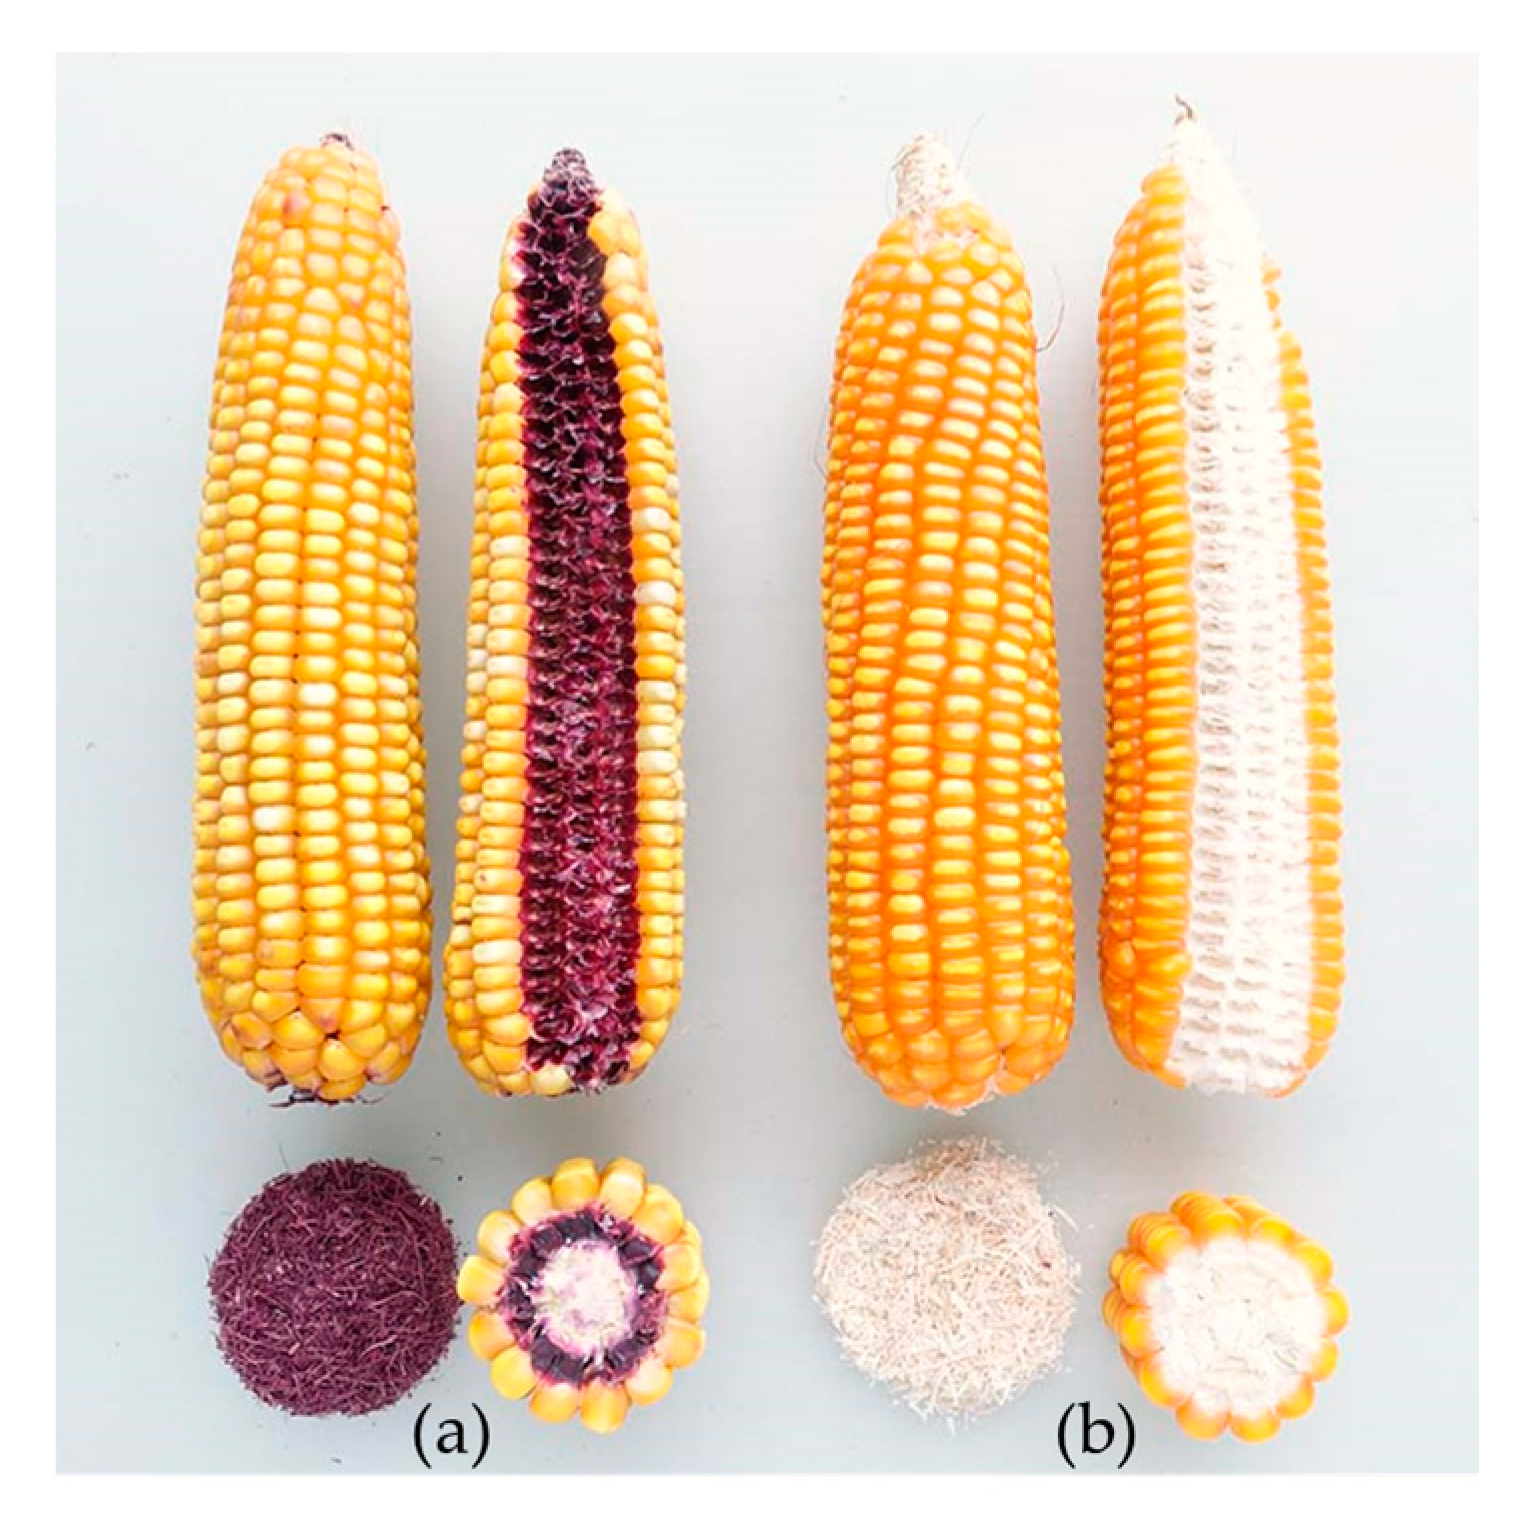
2.1. Plant Materials
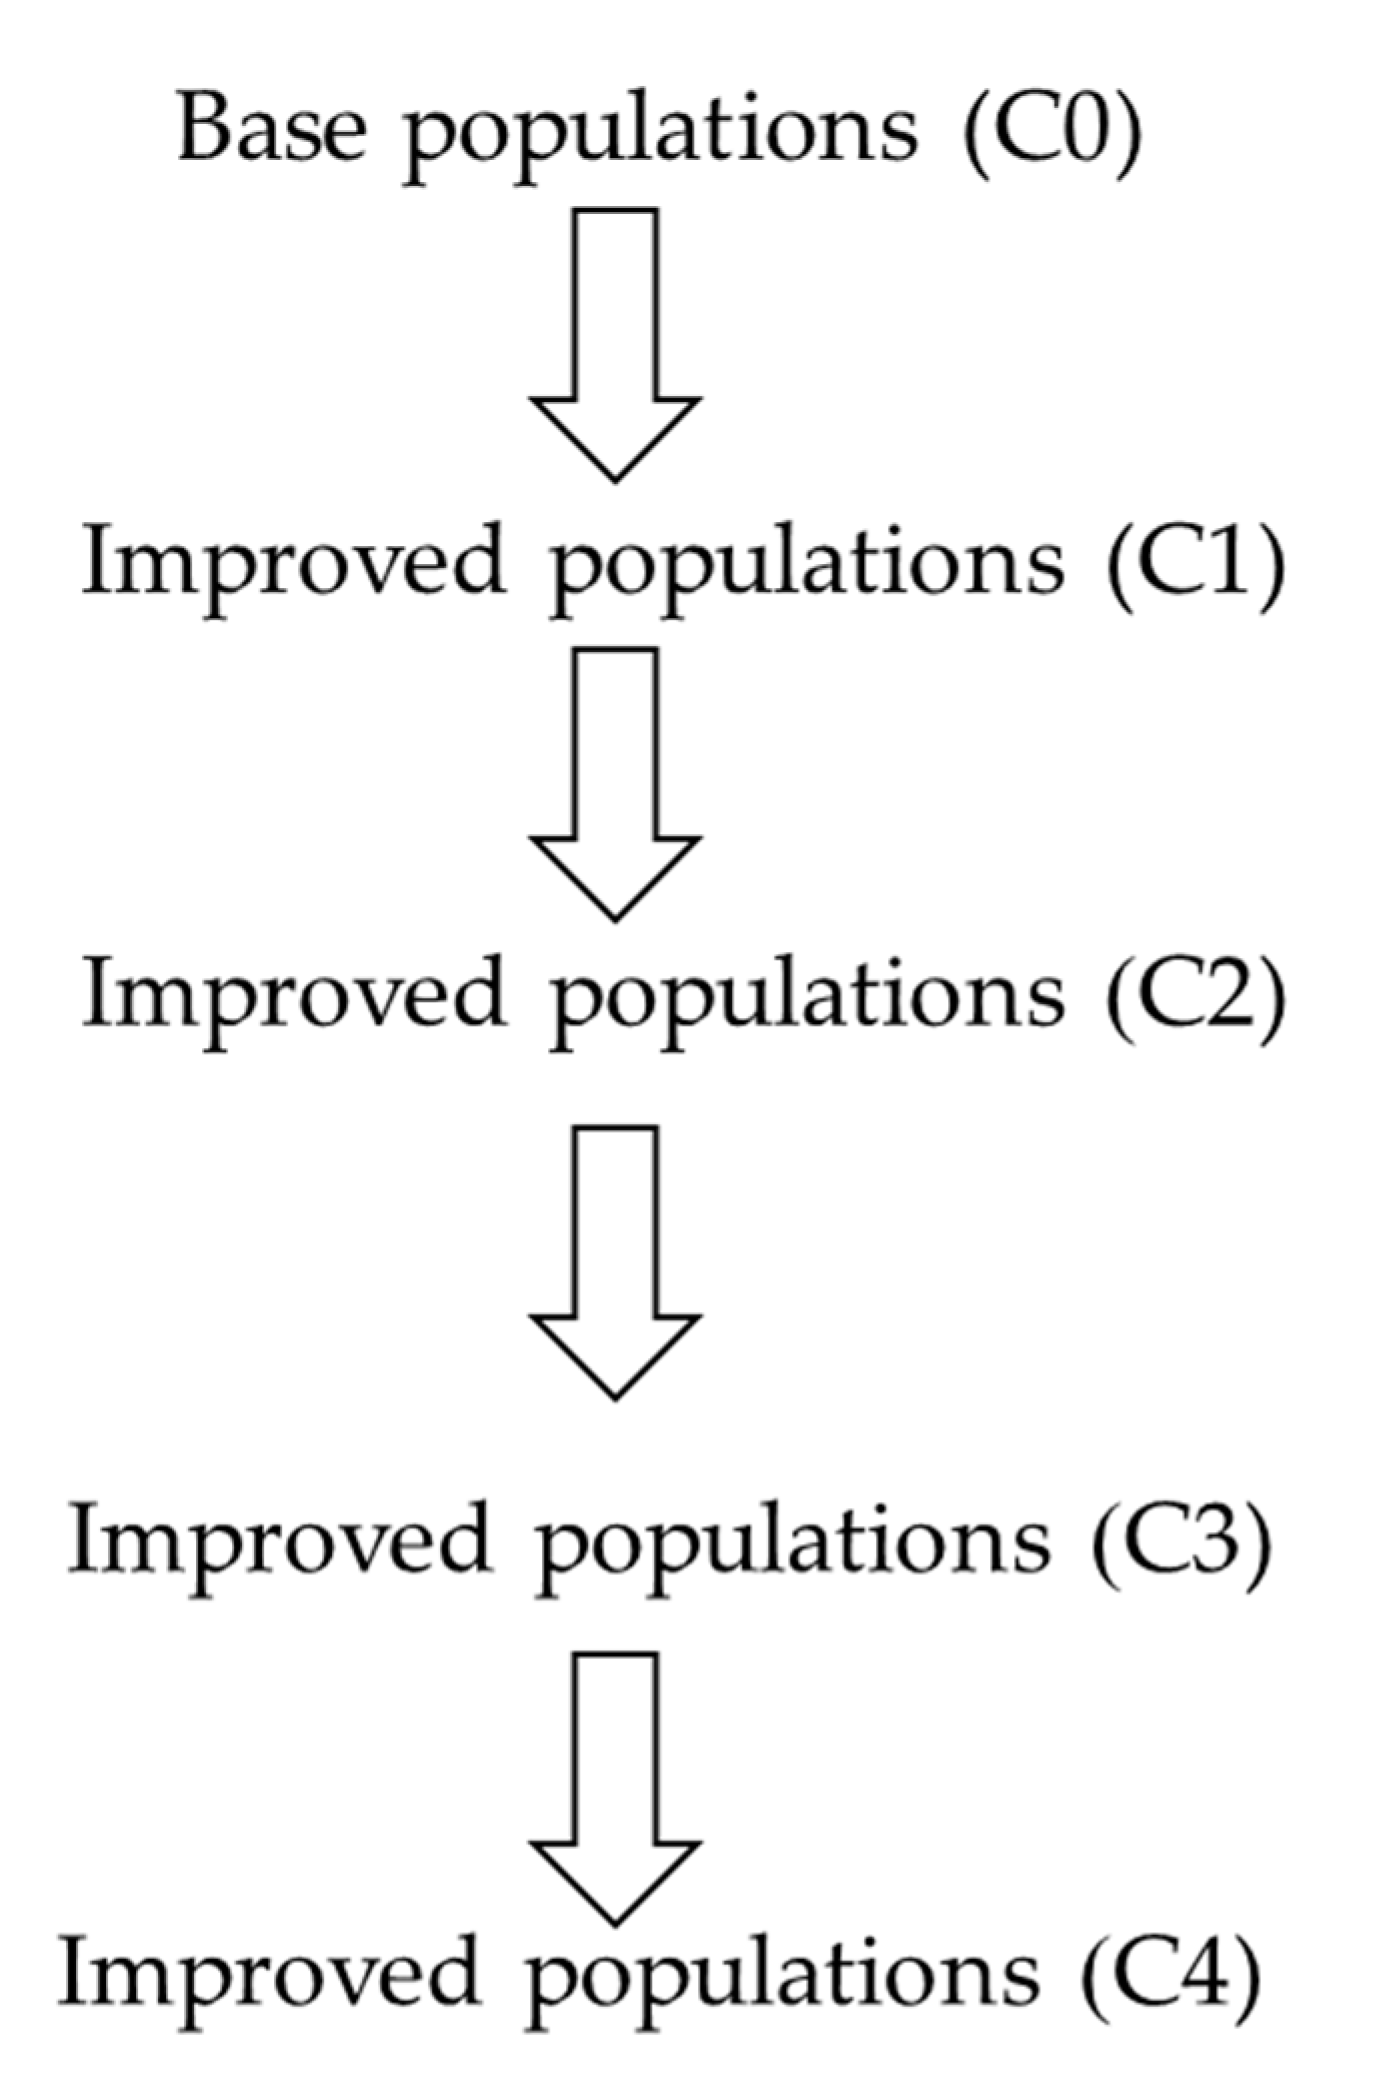
2.2. Population Improvement
2.3. Field Experiment
2.4. Sample Preparation and Extraction
2.4.1. Determination of Total Anthocyanin Content (TAC)
2.4.2. Determination of Total Phenolic Content (TPC)
2.4.3. Determination of Antioxidant Assay
2.5. Statistical Analysis
3. Results and Discussion
3.1. Analysis of Variance
3.2. Response to Selection
3.3. Correlation
4. Conclusions
Author Contributions
Funding
Acknowledgments
Conflicts of Interest
Appendix A


| Population | Cycle | Grain Yield | Husk Mass | ||||||
|---|---|---|---|---|---|---|---|---|---|
| (kg ha−1) | (kg ha−1) | ||||||||
| E1 | E2 | E3 | E4 | E1 | E2 | E3 | E4 | ||
| A | C0 | 7031cd 1 | 6562c–f | 7213b–f | 7643a | 1000c–e | 825ab | 752e–g | 782b–g |
| C1 | 7660a | 7049a–d | 7906a–c | 7668a | 1033b–d | 733b–e | 880b–d | 723e–g | |
| C2 | 7667a | 7233a | 7882a–c | 7568ab | 1017b–e | 719c–e | 954ab | 745c–g | |
| C3 | 7660a | 6827a–e | 6618c–g | 7093a–e | 1024b–d | 777a–e | 904bc | 735d–g | |
| C4 | 7479ab | 6027f | 7633a–d | 7137a–e | 1108ab | 789a–d | 800c–f | 775b–g | |
| b | 90ns | −129ns | −45ns | −159 * | 21ns | −3ns | 12ns | −0.2ns | |
| r | 0.27ns | 0.19ns | 0.02ns | 0.79 * | 0.61ns | 0.01ns | 0.06ns | 0.00ns | |
| B | C0 | 6856de | 6581b–f | 8131ab | 7376a | 1087bc | 809a–b | 838b–e | 741c–g |
| C1 | 6943d | 7196a–c | 8622a | 7702a | 1118ab | 764a–e | 842b–e | 912a | |
| C2 | 7265a–d | 6665a–f | 7358a–e | 7630a | 1071bc | 796a–d | 760d–g | 761b–g | |
| C3 | 6904d | 6507d–f | 6696c–g | 7155a–e | 1115ab | 703de | 900bc | 765b–g | |
| C4 | 6979cd | 6893a–e | 6590c–g | 7323a–d | 1100 a–c | 797a–d | 890bc | 817a–e | |
| b | 21ns | −7ns | −501 * | 65ns | 2ns | −9ns | 16ns | 1ns | |
| r | 0.04ns | 0.00ns | 0.80 * | 0.21ns | 0.03ns | 0.10ns | 0.21ns | 0.00ns | |
| C | C0 | 5634hi | 6476d–f | 6732c–g | 6652e | 840f | 736a–e | 800c–f | 831a–c |
| C1 | 6171fg | 6907a–e | 7198b–f | 7502ab | 950de | 804a–d | 897bc | 844ab | |
| C2 | 6095fg | 7026a–e | 6231e–g | 6935b–e | 914ef | 840a | 817c–e | 766b–g | |
| C3 | 5507i | 6040f | 6895b–g | 6713de | 952de | 680e | 833b–e | 769b–g | |
| C4 | 6938d | 6534e–f | 6959b–g | 6717de | 1120ab | 781a–e | 850b–e | 742c–g | |
| b | 194ns | −75ns | 15ns | −66ns | 56ns | −3ns | 4ns | −25 * | |
| r | 0.30ns | 0.09ns | 0.00ns | 0.09ns | 0.75ns | 0.01ns | 0.02ns | 0.81 * | |
| D | C0 | 7044cd | 6655a–f | 6973b–g | 7510ab | 1025b–d | 807a–d | 615h | 716fg |
| C1 | 6268fg | 6798a–e | 7177b–f | 7212a–e | 1077bc | 789a–d | 780c–f | 721e–g | |
| C2 | 7206b–d | 6650a–f | 6735c–g | 7255a–e | 1029b–d | 749a–e | 687f–h | 710g | |
| C3 | 6001gh | 6377ef | 5889fg | 6798c–e | 1080bc | 812a–c | 643gh | 763b–g | |
| C4 | 6450ef | 7215ab | 7246b–f | 7122 a–e | 1195a | 782a–e | 848b–e | 794b–g | |
| b | −146ns | 70ns | −74ns | −119ns | 34ns | 0ns | 33ns | 20ns | |
| r | 0.20ns | 0.13ns | 0.05ns | 0.54ns | 0.63ns | 0.03ns | 0.29ns | 0.74ns | |
| E | C0 | 6441ef | 6504d–f | 7548a–e | 7365a–d | 993c–e | 743a–e | 785c–f | 766b–g |
| C1 | 6998cd | 6531d–f | 6568c–g | 7700a | 1055b–d | 729b–e | 830b–e | 776b–g | |
| C2 | 6897d | 7214ab | 6449d–g | 7417a–c | 1122ab | 763a–e | 883b–d | 726e–g | |
| C3 | 7380a–c | 6606a–f | 5678g | 7671a | 1113ab | 792a–d | 1038a | 823a–d | |
| C4 | 7589ab | 6821a–e | 6486d–g | 7646a | 1100a–c | 792a–d | 868b–e | 810b–f | |
| b | 268 * | 71ns | –301ns | 53ns | 27ns | 16 * | 37ns | 13ns | |
| r | 0.90 * | 0.14ns | 0.51ns | 0.29ns | 0.65ns | 0.80 * | 0.38ns | 0.31ns | |
| Check var. | KND | 6676 | 6761 | 7490 | 6600 | 1102 | 667 | 697 | 772 |
| KGW | 7330 | 6628 | 6164 | 7309 | 1097 | 512 | 643 | 591 | |
| P339 | 9297 | 10,773 | 12,419 | 10,995 | 1687 | 1545 | 1257 | 1660 | |
| Population | Cycle | Cob Mass | Anthesis Day | ||||||
|---|---|---|---|---|---|---|---|---|---|
| (kg ha−1) | (DAP) | ||||||||
| E1 | E2 | E3 | E4 | E1 | E2 | E3 | E4 | ||
| A | C0 | 1017b–e 1 | 828a–c | 853cd | 892a–c | 60ab | 54b–d | 55cd | 52a–d |
| C1 | 1067a–c | 833a–c | 946a–d | 838a–d | 59cd | 53d–g | 54d–f | 52c–e | |
| C2 | 1094ab | 777bc | 899b–d | 819b–d | 58d–f | 53e–g | 54e–g | 51de | |
| C3 | 1115ab | 835a–c | 955a–d | 866a–d | 58e–g | 52g | 54e–g | 51ef | |
| C4 | 1117ab | 870ab | 986a–c | 815b–d | 56i–k | 53fg | 52i | 50f | |
| b | 25 * | 9ns | 28ns | −13ns | −1 ** | −0.4 * | −1 * | −1 ** | |
| r | 0.89 * | 0.17ns | 0.69ns | 0.37ns | 0.97 ** | 0.80 * | 0.89 * | 0.96 ** | |
| B | C0 | 1028a–e | 890ab | 918a–d | 809b–d | 59bc | 54b–d | 56bc | 53a–c |
| C1 | 1095ab | 828a–c | 913a–d | 888a–c | 59c–e | 54b–d | 55c–e | 52b–e | |
| C2 | 1088ab | 750c | 842d | 846a–d | 57g–i | 54b–e | 53f–h | 52c–e | |
| C3 | 1108ab | 777bc | 897b–d | 805b–d | 56h–j | 53e–g | 53g–i | 51de | |
| C4 | 1128a | 791a–c | 976a–d | 905ab | 55j–L | 53fg | 52i | 50f | |
| b | 21 * | −25ns | 10ns | 11ns | −1 ** | −1 * | −1 ** | −1 ** | |
| r | 0.81 * | 0.53ns | 0.11ns | 0.15ns | 0.95 ** | 0.89 * | 0.98 ** | 0.92 ** | |
| C | C0 | 935e | 860a–c | 905a–d | 831b–d | 60ab | 55b | 56ab | 53ab |
| C1 | 946de | 822a–c | 917a–d | 942a | 59cd | 55bc | 55cd | 52a–d | |
| C2 | 1042a–d | 797a–c | 1030a–b | 825b–d | 57f–h | 54c–f | 54e–g | 52a–b | |
| C3 | 1033a–e | 819a–c | 948a–d | 872a–d | 56 h–j | 53d–g | 53f–h | 52a–d | |
| C4 | 1100ab | 869ab | 914a–d | 770d | 55l | 53e–g | 52i | 52b–e | |
| b | 42 * | 2ns | 5ns | −19ns | −1 ** | −1 ** | −1 ** | −0.2ns | |
| r | 0.90 * | 0.01ns | 0.02ns | 0.27ns | 1.00 ** | 0.96 ** | 0.97 ** | 0.75ns | |
| D | C0 | 950de | 825a–c | 837d | 793cd | 60ab | 56a | 57ab | 53a |
| C1 | 980c–e | 902a | 919a–d | 843a–d | 59c–e | 54b–d | 55c–e | 53ab | |
| C2 | 1017b–e | 825a–c | 921a–d | 870a–d | 57f–i | 54b–e | 53f–h | 53a–c | |
| C3 | 1083ab | 777bc | 925a–d | 819b–d | 56i–k | 54c–f | 53g–i | 53a–c | |
| C4 | 1119a | 837a–c | 959a–d | 897a–c | 55l | 54c–f | 52hi | 52c–e | |
| b | 44 ** | −10ns | 25ns | 19ns | −1 ** | −1 ** | −1 * | −0.3 * | |
| r | 0.98 ** | 0.13ns | 0.77 * | 0.51ns | 0.99 ** | 0.72 ** | 0.91 * | 0.86 * | |
| E | C0 | 973c–e | 883ab | 937a–d | 897a–c | 61a | 55b | 57a | 53ab |
| C1 | 1038a–d | 820a–c | 1043a | 901a–c | 59c–e | 54b–e | 56ab | 52b–e | |
| C2 | 1068a–c | 794a–c | 848cd | 898a–c | 57f–h | 53d–g | 55c–e | 52b–e | |
| C3 | 1028a–e | 779bc | 938a–d | 821b–d | 56h–j | 53fg | 54e–g | 52c–e | |
| C4 | 1122a | 862a–c | 988a–c | 850a–d | 55kl | 53e–g | 53g–i | 51ef | |
| b | 29ns | −8ns | −0.2ns | −17ns | −1 ** | −1 * | −1 ** | −0.4 * | |
| r | 0.69ns | 0.09ns | 0.00ns | 0.58ns | 0.97 ** | 0.83 * | 0.98 ** | 0.90 * | |
| Check var. | KND | 1155 | 877 | 1073 | 798 | 50 | 42 | 46 | 42 |
| KGW | 1127 | 744 | 868 | 822 | 51 | 46 | 49 | 45 | |
| P339 | 1273 | 1150 | 1210 | 1229 | 64 | 57 | 62 | 56 | |
| Population | Cycle | Plant Height | Ear Height | ||||||
|---|---|---|---|---|---|---|---|---|---|
| (cm) | (cm) | ||||||||
| E1 | E2 | E3 | E4 | E1 | E2 | E3 | E4 | ||
| A | C0 | 198.3c–h 1 | 162.0a–e | 190.7b–f | 195.3a–f | 101.3e–h | 85.3a–d | 101.3b–e | 104.0a–c |
| C1 | 187.7i | 169.0a–e | 183.7ef | 190.7c–i | 99.3f–h | 80.0b–h | 101.3b–e | 102.0a–e | |
| C2 | 198.7c–h | 170.0a–e | 189.3b–f | 184.3f–j | 104.0b–h | 78.3c–j | 103.7a–e | 89.3h–i | |
| C3 | 204.0a–f | 159.7c–e | 190.0b–f | 183.7f–j | 102.3c–h | 74.0f–j | 100.0b–e | 91.0f–h | |
| C4 | 207.7a–c | 163.7a–e | 196.3a–f | 184.7e–j | 103.7b–h | 74.3f–j | 102.0b–e | 96.0b–g | |
| b | 3.5ns | −6.0ns | 1.8ns | −2.8 * | 0.8ns | −2.8 * | 0.0ns | −2.7ns | |
| r | 0.54ns | 0.04ns | 0.38ns | 0.77 * | 0.41ns | 0.91 * | 0.00ns | 0.43ns | |
| B | C0 | 203.0a–g | 172.0a–c | 197.7a–e | 196.0a–f | 98.0g–i | 87.0a–c | 102.7a–e | 100.3a–f |
| C1 | 196.0d–i | 169.3a–e | 191.0b–f | 191.3b–h | 101.7d–h | 82.3a–f | 99.0c–e | 97.3b–g | |
| C2 | 196.3d–i | 169.3a–e | 182.0f | 176.7j | 91.7i | 69.3jk | 96.3de | 78.7jk | |
| C3 | 189.0hi | 158.0c–e | 189.3b–f | 181.0h–j | 90.7i | 64.0k | 92.3e | 75.0k | |
| C4 | 202.0a–g | 172.3a–c | 195.3a–f | 197.7a–d | 103.3b–h | 79.3c–i | 100.3b–e | 101.0a–e | |
| b | −0.9ns | −1.1ns | −0.6ns | −0.7ns | −0.03ns | −3.4ns | −1.1ns | −2.1ns | |
| r | 0.06ns | 0.08ns | 0.03ns | 0.01ns | 0.00ns | 0.32ns | 0.20ns | 0.07ns | |
| C | C0 | 204.7a–e | 172.0a–c | 207.7a | 205.0a | 104.0b–h | 81.7a–g | 109.3a–c | 104.7ab |
| C1 | 205.3a–d | 171.0a–d | 203.7ab | 201.0a–c | 110.0ab | 87.0a–c | 111.3ab | 103.7a–d | |
| C2 | 206.7a–c | 154.3e | 185.0d–f | 174.3j | 107.7b–e | 70.3i–k | 100.7b–e | 78.7jk | |
| C3 | 207.3a–c | 160.0b–e | 198.7a–d | 184.3f–j | 105.3b–g | 72.0h–k | 103.3a–e | 80.3i–k | |
| C4 | 205.7a–d | 158.7c–e | 200.0a–c | 185.3d–j | 105.7b–f | 75.7e–j | 114.0a | 92.7e–h | |
| b | 0.4ns | −3.8ns | −2.0ns | −5.6ns | −0.1ns | −2.7ns | 0.1ns | −4.7ns | |
| r | 0.35ns | 0.57ns | 0.14ns | 0.49ns | 0.01ns | 0.38ns | 0.00ns | 0.37ns | |
| D | C0 | 194.0g–i | 159.3c–e | 198.7a–d | 178.3ij | 107.3b–e | 84.7a–e | 114.3a | 98.0b–g |
| C1 | 196.7d–i | 175.7ab | 207.3a | 200.7a–c | 97.7hi | 84.0a–e | 111.7ab | 101.0a–e | |
| C2 | 194.3f–i | 177.7a | 196.3a–f | 175.7j | 105.3b–g | 76.7d–j | 106.7a–d | 85.7h–j | |
| C3 | 199.0c–g | 154.7e | 190.3b–f | 181.3g–j | 98.0g–i | 72.7g–k | 104.0a–e | 94.7c–h | |
| C4 | 195.3e–i | 156.0de | 197.3a–e | 193.3a–h | 97.3hi | 79.7c–i | 107.3a–d | 97.0b–g | |
| b | 0.5ns | −2.8ns | −2.0ns | 1.1ns | −2.0ns | −2.1ns | −2.2ns | −0.8ns | |
| r | 0.15ns | 0.16ns | 0.26ns | 0.02ns | 0.42ns | 0.45ns | 0.69ns | 0.05ns | |
| E | C0 | 202.7a–g | 175.7ab | 207.0a | 203.7ab | 107.0b–e | 91.0a | 107.7a–d | 108.3a |
| C1 | 211.7a | 172.7a–c | 206.3a | 197.3a–e | 116.0a | 87.0a–c | 110.7a–c | 108.0a | |
| C2 | 210.3ab | 171.7a–d | 186.3c–f | 176.0j | 109.3a–c | 76.0d–j | 105.0a–d | 86.3h–j | |
| C3 | 207.3a–c | 164.3a–e | 202.3ab | 194.0a–g | 107.3b–e | 79.0c–i | 109.0a–c | 94.3d–h | |
| C4 | 201.0b–g | 175.7ab | 199.7a–c | 198.0a–d | 109.0a–d | 89.3ab | 104.7a–d | 103.3a–d | |
| b | −1.0ns | −0.8ns | −1.9ns | −1.5ns | −0.5ns | −1.1ns | −0.8ns | −2.4ns | |
| r | 0.07ns | 0.08ns | 0.12ns | 0.05ns | 0.04ns | 0.07ns | 0.22ns | 0.15ns | |
| Check var. | KND | 196 | 178.7 | 204.7 | 203.7 | 105 | 85 | 102 | 98 |
| KGW | 215.3 | 175.7 | 214.7 | 198.3 | 109 | 82 | 99.3 | 90 | |
| P339 | 207 | 173.3 | 198.3 | 174 | 112 | 87 | 116 | 96.7 | |
| Population | Cycle | TAY in Husk | TAY in Cob | ||||||
|---|---|---|---|---|---|---|---|---|---|
| (kg CGE/DW ha−1) | (kg CGE/DW ha−1) | ||||||||
| E1 | E2 | E3 | E4 | E1 | E2 | E3 | E4 | ||
| A | C0 | 1.0j 1 | 0.8l | 1.2kl | 1.1j | 1.5lm | 0.5m | 1.1j–l | 0.5m |
| C1 | 2.9i | 2.1jk | 3.0ij | 2.4i | 2.1j–l | 1.5l | 1.8h–l | 1.8l | |
| C2 | 7.4f | 4.9ef | 5.8g | 4.1fg | 4.7g | 2.1i–k | 3.9fg | 2.3i–l | |
| C3 | 17.1d | 12.9b | 14.3cd | 10.9de | 6.5f | 3.5de | 6.1e | 3.3e–g | |
| C4 | 25.0a | 16.0a | 15.6bc | 13.2c | 12.7bc | 4.2bc | 11.5b | 4.2cd | |
| b | 6.2 ** | 4.1 ** | 4.0 ** | 3.3 ** | 2.7 * | 1.0 ** | 2.5 * | 0.9 ** | |
| r | 0.94 ** | 0.93 ** | 0.93 ** | 0.92 ** | 0.89 * | 0.99 ** | 0.90 * | 0.98 ** | |
| B | C0 | 0.6j | 1.1kl | 1.0l | 0.9j | 1.3lm | 0.6m | 1.1j–l | 0.4m |
| C1 | 4.0g–i | 2.2i–k | 2.9ij | 2.7hi | 1.9j–l | 1.5l | 1.4i–l | 2.0kl | |
| C2 | 8.0f | 4.9ef | 3.9h–j | 4.1fg | 3.0hi | 2.3h–j | 2.9gh | 2.7hi | |
| C3 | 19.0c | 10.9c | 13.8d | 10.7e | 7.1f | 2.9fg | 5.6e | 3.3e–g | |
| C4 | 24.7a | 15.9a | 17.1a | 15.5b | 12.0c | 4.6b | 9.6cd | 5.4b | |
| b | 6.3 ** | 3.8 ** | 4.3 ** | 3.7 ** | 2.7* | 0.9 ** | 2.1 * | 1.1 ** | |
| r | 0.96 ** | 0.94 ** | 0.89 ** | 0.92 ** | 0.88* | 0.97 ** | 0.89 * | 0.96 ** | |
| C | C0 | 1.0j | 1.0kl | 0.5l | 0.8j | 1.5k–m | 0.8m | 1.3j–l | 0.7m |
| C1 | 5.0g | 3.4g–i | 3.5h–j | 3.6gh | 2.4ij | 1.9j–l | 2.3h–j | 2.0kl | |
| C2 | 7.0f | 4.5fg | 4.7gh | 3.5gh | 4.4g | 2.5g–i | 4.2f | 2.4h–k | |
| C3 | 16.2d | 9.5d | 12.1e | 11.9d | 10.9d | 3.1ef | 9.6cd | 2.9gh | |
| C4 | 24.2ab | 15.6a | 15.9ab | 13.8c | 13.3b | 3.9cd | 10.7bc | 3.8de | |
| b | 5.8 ** | 3.5 ** | 3.9 ** | 3.4 * | 3.2 * | 0.7 ** | 2.6 ** | 0.7 ** | |
| r | 0.94 ** | 0.92 ** | 0.94 ** | 0.89 * | 0.92 * | 0.99 ** | 0.93 ** | 0.96 ** | |
| D | C0 | 0.7j | 1.5kl | 0.9l | 1.2j | 1.0m | 0.8m | 0.8l | 0.8m |
| C1 | 4.9gh | 3.0h–j | 2.5jk | 3.1g–i | 1.4lm | 1.7kl | 1.1j–l | 1.9kl | |
| C2 | 7.8f | 3.8f–h | 4.2hi | 3.3g–i | 5.1g | 2.2i–k | 3.0f–h | 3.2fg | |
| C3 | 18.6c | 12.2b | 10.1f | 11.9d | 12.8bc | 2.8f–h | 10.9b | 3.3e–g | |
| C4 | 24.3a | 15.3a | 15.6bc | 15.5b | 16.0a | 4.6b | 13.6a | 6.0a | |
| b | 6.1 ** | 3.7 * | 3.7 ** | 3.7 * | 4.4 ** | 0.8 ** | 3.5 * | 1.2 ** | |
| r | 0.96 ** | 0.89 * | 0.92 ** | 0.88 * | 0.92 ** | 0.93 ** | 0.88 * | 0.92 ** | |
| E | C0 | 1.1j | 1.2kl | 0.8l | 1.0j | 1.0m | 0.8m | 1.0kl | 0.9m |
| C1 | 3.7hi | 3.1h–j | 3.0ij | 3.8g | 2.3i–k | 1.9j–l | 2.2h–k | 2.2j–l | |
| C2 | 9.5e | 6.1e | 6.0g | 5.0f | 3.5h | 2.2i–k | 2.6hi | 2.5h–j | |
| C3 | 18.5c | 12.1bc | 15.8ab | 13.8c | 9.9e | 3.2ef | 8.7d | 3.6ef | |
| C4 | 22.9b | 16.5a | 16.9ab | 18.2a | 12.1c | 5.5a | 10.5bc | 4.7c | |
| b | 5.9 ** | 4.0 ** | 4.5 ** | 4.6 ** | 3.0 * | 1.1 * | 2.6 * | 0.9 ** | |
| r | 0.97 ** | 0.96 ** | 0.92 ** | 0.93 ** | 0.91 * | 0.91 * | 0.88 * | 0.98 ** | |
| Check var. | KND | 3.0 | 0.9 | 1.6 | 1.1 | 6.2 | 3.6 | 6.2 | 3.5 |
| KGW | 2.6 | 0.7 | 1.5 | 0.6 | 3.4 | 0.6 | 2.5 | 1.4 | |
| P339 | 0.2 | 0.0 | 0.1 | 0.0 | 0.0 | 0.1 | 0.0 | 0.0 | |
| Population | Cycle | TAC | TPC | ||||||
|---|---|---|---|---|---|---|---|---|---|
| (mg CGE/g 100 DW) | (mg GAE/100 g DW) | ||||||||
| E1 | E2 | E3 | E4 | E1 | E2 | E3 | E4 | ||
| A | C0 | 102.7n 1 | 93.8n | 163.6o | 134.3no | 188.3n | 147.2n | 197.2q | 183.1rs |
| C1 | 275.5m | 288.5l | 342.8mn | 326.9m | 362.2l | 562.7jk | 381.5o | 631.0kl | |
| C2 | 730.6i | 685.1h | 609.0i | 549.8i | 975.1h | 949.2g | 822.6j | 839.9i | |
| C3 | 1672.5f | 1657.4d | 1586.7e | 1489.2f | 1927.2ef | 1890.1d | 1779.7gh | 1651.2gh | |
| C4 | 2251.8a | 2029.5ab | 1953.6a | 1704.1d | 2685.4a | 2253.4c | 2472.6a | 1937.7d | |
| b | 569.5 ** | 524.0 ** | 482.4 ** | 430.2 ** | 655.9 ** | 554.0 ** | 594.9 ** | 452.9 ** | |
| r | 0.95 ** | 0.94 ** | 0.93 ** | 0.92 ** | 0.95 ** | 0.97 ** | 0.94 ** | 0.97 ** | |
| B | C0 | 56.4o | 137.6mn | 117.6p | 126.1no | 129.9o | 308.1m | 177.2q | 225.1qr |
| C1 | 357.3l | 289.9l | 348.6m | 291.8m | 564.1j | 478.7l | 477.4n | 365.2o | |
| C2 | 744.6hi | 614.8i | 511.8k | 534.6ij | 988.1h | 523.2j–l | 632.9l | 446.5n | |
| C3 | 1708.5e | 1547.8e | 1531.9f | 1397.6g | 1949.8e | 1684.6e | 1887.6f | 1601.8h | |
| C4 | 2244.3a | 2001.9bc | 1924.7b | 1895.0c | 2510.7b | 2204.7c | 2177.3d | 2100.1c | |
| b | 572.7 ** | 498.7 ** | 479.8 ** | 464.7 ** | 614.7 ** | 499.9 * | 541.0 * | 498.7 * | |
| r | 0.96 ** | 0.93 ** | 0.92 ** | 0.93 ** | 0.98 ** | 0.86 * | 0.91 * | 0.87 * | |
| C | C0 | 118.6n | 127.1mn | 64.1q | 99.1o | 297.6m | 250.4m | 155.9q | 146.2s |
| C1 | 523.9j | 425.0k | 395.8l | 421.6l | 654.1i | 784.0h | 537.2m | 727.1j | |
| C2 | 762.8h | 532.9j | 575.6j | 462.9kl | 998.4gh | 676.9i | 746.2k | 579.7lm | |
| C3 | 1699.1e | 1397.5f | 1450.9g | 1543.8e | 2039.4d | 1553.3f | 1741.7h | 1706.1f | |
| C4 | 2156.7b | 1993.2bc | 1879.6c | 1858.7c | 2426.0c | 2413.8a | 2292.3c | 2237.7b | |
| b | 525.1 ** | 470.5 ** | 468.6 ** | 464.1 * | 564.2 ** | 509.6 * | 547.7 ** | 516.2 * | |
| r | 0.96 ** | 0.92 ** | 0.95 ** | 0.90 * | 0.96 ** | 0.89 * | 0.95 ** | 0.89 * | |
| D | C0 | 71.3o | 185.8m | 151.5o | 170.5n | 158.0no | 316.1m | 267.7p | 298.4p |
| C1 | 452.1k | 377.2k | 322.1n | 426.0l | 694.1i | 492.5kl | 389.4o | 640.7k | |
| C2 | 753.1hi | 509.1j | 613.6i | 461.7kl | 994.3h | 579.2j | 834.1j | 539.7m | |
| C3 | 1716.6e | 1504.9e | 1572.3e | 1559.7e | 2046.3d | 1655.1e | 1809.0g | 1661.3fg | |
| C4 | 2031.4d | 1957.1c | 1841.0d | 1949.4b | 2418.7c | 2337.0ab | 2116.1e | 2193.4b | |
| b | 518.5 ** | 467.0 * | 462.9 ** | 469.2* | 587.7 ** | 520.4 * | 511.6 ** | 481.1 * | |
| r | 0.96 ** | 0.90 * | 0.93 ** | 0.89 * | 0.97 ** | 0.88 * | 0.93 ** | 0.87 * | |
| E | C0 | 104.6n | 159.7mn | 99.1p | 120.4no | 396.2l | 291.2m | 169.7q | 254.6pq |
| C1 | 351.5l | 428.6k | 360.5m | 485.7jk | 467.3k | 668.7i | 478.8n | 745.8j | |
| C2 | 850.5g | 798.9g | 675.7h | 683.4h | 1043.8g | 953.5g | 1003.7i | 889.9i | |
| C3 | 1660.3f | 1535.9e | 1523.5f | 1680.4d | 1899.3f | 1656.3e | 1760.1h | 1882.0e | |
| C4 | 2085.2c | 2077.4a | 1942.8ab | 2249.3a | 2415.3c | 2263.9bc | 2399.6b | 2407.6a | |
| b | 527.0 ** | 494.3 ** | 485.0 ** | 545.3 ** | 547.0 ** | 493.3 ** | 574.1 ** | 544.2 ** | |
| r | 0.97 ** | 0.97 ** | 0.96 ** | 0.94 ** | 0.95 ** | 0.97 ** | 0.98 ** | 0.95 ** | |
| Check var. | KND | 270.3 | 132.7 | 229.6 | 138.5 | 534.2 | 185.1 | 439.2 | 185.1 |
| KGW | 238.7 | 128.9 | 234.0 | 109.6 | 446.2 | 172.3 | 462.4 | 173.7 | |
| P339 | 11.0 | 1.2 | 10.8 | 1.2 | 44.7 | 22.5 | 44.4 | 28.1 | |
| Population | Cycle | DPPH | TEAC | ||||||
|---|---|---|---|---|---|---|---|---|---|
| (mmol TE/100 g DW) | (mmol TE/100 g DW) | ||||||||
| E1 | E2 | E3 | E4 | E1 | E2 | E3 | E4 | ||
| A | C0 | 27.3s 1 | 34.1p | 33.8lm | 55.7mn | 169.0p | 117.8p | 294.9o | 102.1m |
| C1 | 61.4p | 110.0l | 46.5j | 161.4h | 526.6l | 168.9no | 449.0l | 193.2k | |
| C2 | 96.2l | 169.4g | 99.2f | 153.7i | 743.2j | 353.6k | 789.3h | 332.6i | |
| C3 | 250.9e | 383.1c | 243.5c | 351.0g | 1651.1e | 972.5i | 1468.6g | 974.8g | |
| C4 | 298.0a | 423.1b | 265.2b | 392.4d | 2218.4a | 1789.1d | 1980.6b | 1584.4d | |
| b | 73.1 ** | 105.1 ** | 66.0 * | 86.3 * | 522.3 ** | 414.6 * | 439.1 ** | 374.6 * | |
| r | 0.92 ** | 0.94 ** | 0.91 * | 0.91 * | 0.95 ** | 0.86 * | 0.95 ** | 0.88 * | |
| B | C0 | 22.1t | 51.8o | 37.4kl | 49.6no | 136.1p | 106.9p | 269.0op | 155.7kl |
| C1 | 67.5o | 153.4h | 42.6jk | 130.9k | 489.4m | 223.7m | 338.5n | 160.4kl | |
| C2 | 105.1k | 130.3k | 84.3h | 145.6j | 885.5h | 319.8kl | 748.4i | 269.3j | |
| C3 | 228.3h | 327.6f | 224.7d | 357.0fg | 1573.4f | 1044.9h | 1461.5g | 1013.0fg | |
| C4 | 294.1ab | 363.7d | 239.3c | 403.0c | 2081.4b | 1732.5e | 1777.7cd | 1713.9c | |
| b | 70.5 ** | 79.8 * | 58.6 * | 93.3 * | 497.5 ** | 407.2 * | 414.0 ** | 396.9 * | |
| r | 0.96 ** | 0.89 * | 0.88 * | 0.92 * | 0.98 ** | 0.87 * | 0.94 ** | 0.83 * | |
| C | C0 | 33.7r | 46.3o | 18.2n | 45.1o | 265.9o | 151.1op | 134.2q | 138.0lm |
| C1 | 74.6n | 149.8hi | 49.8ij | 122.0l | 612.3k | 228.5m | 446.6l | 248.5j | |
| C2 | 117.7i | 143.8ij | 88.0gh | 145.0j | 834.1i | 361.7k | 601.3j | 278.4j | |
| C3 | 229.8h | 329.1f | 213.5e | 352.3g | 1640.6e | 954.9i | 1619.6ef | 1010.1fg | |
| C4 | 285.8c | 453.7a | 263.1b | 403.2c | 1967.2c | 1890.1c | 1807.2c | 1753.9c | |
| b | 65.9 ** | 99.4 ** | 65.6 ** | 94.7 ** | 443.1 ** | 420.4 * | 451.9 ** | 399.3 * | |
| r | 0.97 ** | 0.92 ** | 0.94 ** | 0.93 ** | 0.96 ** | 0.83 * | 0.92 * | 0.84 * | |
| D | C0 | 25.6st | 48.5o | 30.9lm | 56.9m | 160.7p | 115.9p | 240.2p | 151.6kl |
| C1 | 81.2m | 100.4m | 46.9ij | 153.2i | 506.1lm | 202.8mn | 376.6m | 266.6j | |
| C2 | 110.1j | 143.2ij | 92.7fg | 120.4l | 816.0i | 288.8l | 728.4i | 289.8ij | |
| C3 | 235.4g | 350.0e | 219.0de | 382.5e | 1720.9d | 1141.5g | 1641.1e | 1047.3f | |
| C4 | 289.6bc | 427.2b | 237.8c | 423.3b | 1997.7c | 2127.2a | 1758.7d | 1946.3b | |
| b | 68.2 ** | 100.7 ** | 58.6 * | 96.2 * | 488.9 ** | 496.1 * | 430.2 * | 437.0 * | |
| r | 0.96 ** | 0.93 ** | 0.91 * | 0.85 * | 0.96 ** | 0.83 * | 0.92 * | 0.82 * | |
| E | C0 | 38.6q | 62.9n | 29.2m | 61.8m | 350.2n | 130.2op | 79.0r | 129.7lm |
| C1 | 62.3p | 135.5jk | 53.9i | 122.9l | 581.8k | 202.3mn | 486.6k | 295.6ij | |
| C2 | 120.9i | 171.1g | 99.2f | 131.3k | 980.8g | 422.3j | 807.4h | 382.2h | |
| C3 | 240.8f | 367.6d | 216.2e | 360.4f | 1673.9e | 1370.1f | 1592.9f | 1321.1e | |
| C4 | 278.9d | 451.4a | 274.1a | 444.9a | 2218.2a | 2060.6b | 2037.7a | 2044.4a | |
| b | 65.9 ** | 100.9 ** | 65.2 ** | 100.4 * | 482.8 ** | 502.9 * | 502.4 ** | 485.5 * | |
| r | 0.95 ** | 0.94 ** | 0.95 ** | 0.90* | 0.97 ** | 0.89 * | 0.98 ** | 0.88 * | |
| Check var. | KND | 60.5 | 44.8 | 46.8 | 48.3 | 353.9 | 120.0 | 323.8 | 118.8 |
| KGW | 49.3 | 46.8 | 46.2 | 43.2 | 298.6 | 118.0 | 302.0 | 104.3 | |
| P339 | 12.8 | 15.6 | 12.8 | 17.9 | 33.5 | 47.7 | 36.2 | 46.2 | |
| Population | Cycle | TAC | TPC | ||||||
|---|---|---|---|---|---|---|---|---|---|
| (mg CGE/g 100 DW) | (mg GAE/100 g DW) | ||||||||
| E1 | E2 | E3 | E4 | E1 | E2 | E3 | E4 | ||
| A | C0 | 143.8op 1 | 59.2l | 130.9m–o | 52.6o | 322.7mn | 184.7p | 307.9mn | 208.7n |
| C1 | 197.4mn | 184.8j | 187.0kl | 217.4m | 351.0lm | 579.4l | 286.3no | 523.9k | |
| C2 | 432.9i | 276.5h | 431.5g | 279.5k | 696.1hi | 785.5h | 752.4h | 623.5ij | |
| C3 | 577.8g | 416.4e | 635.2f | 387.5hi | 1188.8f | 858.9g | 1184.2g | 777.9gh | |
| C4 | 1137.5c | 487.1c | 1167.4b | 515.1d | 1504.9e | 1603.1a | 1492.3d | 1776.7a | |
| b | 236.8 * | 108.7 * | 252.1 ** | 109.5 ** | 320.2 ** | 311.6 * | 326.7 ** | 339.0 ** | |
| r | 0.88 * | 0.99 * | 0.91 ** | 0.98 ** | 0.94 ** | 0.90 * | 0.94 ** | 0.82 ** | |
| B | C0 | 130.6op | 62.1l | 122.5n–p | 57.1o | 260.8op | 272.2o | 248.1op | 268.2m |
| C1 | 169.3no | 176.1j | 156.9lm | 220.1m | 384.3l | 627.4k | 355.3lm | 651.2i | |
| C2 | 278.0k | 308.4g | 345.4h | 316.6j | 568.6j | 533.9m | 550.2j | 721.8h | |
| C3 | 643.2f | 370.0f | 629.0f | 418.0fg | 1234.1f | 660.1jk | 1193.8g | 860.2f | |
| C4 | 1065.4d | 576.1b | 987.9d | 595.0b | 1508.4de | 1168.5d | 1337.2e | 1045.1d | |
| b | 234.4 * | 122.2 ** | 220.3 ** | 127.4 ** | 334.5 ** | 182.5 * | 301.7 ** | 176.3 ** | |
| r | 0.88 * | 0.97 ** | 0.92 ** | 0.99 ** | 0.93 ** | 0.78 * | 0.93 ** | 0.93 ** | |
| C | C0 | 162.6no | 86.1k | 142.8mn | 84.3n | 274.5no | 391.2n | 208.2pq | 388.9l |
| C1 | 256.7kl | 228.6i | 247.6j | 207.4m | 575.9j | 673.1j | 580.3j | 557.1k | |
| C2 | 420.4i | 308.2g | 405.3g | 292.1k | 720.3hi | 848.5g | 684.4i | 656.3i | |
| C3 | 1058.1d | 376.3f | 1014.6d | 327.6j | 1518.7de | 743.6hi | 1493.0d | 754.2gh | |
| C4 | 1208.3b | 444.5d | 1170.2b | 485.6e | 1718.7b | 985.8e | 1651.5b | 1418.2b | |
| b | 289.3 * | 86.4 ** | 282.2 * | 92.3 ** | 383.1 ** | 126.0 * | 380.0 ** | 225.6 * | |
| r | 0.91 * | 0.97 ** | 0.92 * | 0.96 ** | 0.94 ** | 0.80 * | 0.94 ** | 0.95 * | |
| D | C0 | 104.6p | 93.7k | 96.4p | 96.2n | 211.7pq | 511.0m | 196.1q | 513.5k |
| C1 | 140.1op | 191.9j | 119.5n–p | 225.4lm | 459.9k | 544.5lm | 424.8k | 569.6jk | |
| C2 | 495.6h | 262.6h | 326.2hi | 369.2i | 742.1h | 641.6jk | 395.5kl | 763.2gh | |
| C3 | 1180.7b | 362.3f | 1181.8b | 405.4gh | 1629.3c | 738.5i | 1556.0c | 787.9g | |
| C4 | 1432.8a | 552.7b | 1418.2a | 669.0a | 1949.5a | 1549.0b | 1953.4a | 1463.1b | |
| b | 369.7 ** | 108.8 ** | 370.6 * | 132.6 ** | 464.5 ** | 227.0ns | 464.6 * | 211.8 * | |
| r | 0.93 ** | 0.96 ** | 0.88 * | 0.95 ** | 0.95 ** | 0.70ns | 0.89 * | 0.78 * | |
| E | C0 | 104.6p | 96.9k | 105.6op | 97.1n | 179.9q | 401.5n | 228.9pq | 381.7l |
| C1 | 222.9lm | 229.4i | 207.6k | 238.9l | 398.4l | 624.5k | 329.4mn | 658.9i | |
| C2 | 328.1j | 283.4h | 301.3i | 276.0k | 661.1i | 921.8f | 547.9j | 550.3k | |
| C3 | 963.9e | 412.3e | 930.8e | 434.8f | 1085.4g | 865.9g | 1282.8f | 946.5e | |
| C4 | 1080.1d | 636.4a | 1059.8c | 549.1c | 1567.0d | 1483.5c | 1344.2e | 1308.5c | |
| b | 269.2 * | 126.2 ** | 263.2 * | 110.0 ** | 346.1 ** | 240.5 * | 318.4 * | 214.1 * | |
| r | 0.90 * | 0.95 ** | 0.89 * | 0.98 ** | 0.97 ** | 0.88 * | 0.90 * | 0.86 * | |
| Check var. | KND | 542.5 | 416.9 | 580.7 | 437.5 | 1053.5 | 874.4 | 1081.4 | 941.3 |
| KGW | 307.3 | 81.0 | 284.9 | 161.6 | 563.4 | 269.6 | 467.2 | 462.9 | |
| P339 | 3.1 | 6.5 | 1.9 | 2.8 | 83.5 | 85.3 | 76.2 | 106.8 | |
| Population | Cycle | DPPH | TEAC | ||||||
|---|---|---|---|---|---|---|---|---|---|
| (mmol TE/100 g DW) | (mmol TE/100 g DW) | ||||||||
| E1 | E2 | E3 | E4 | E1 | E2 | E3 | E4 | ||
| A | C0 | 38.2n 1 | 34.3q | 37.9lm | 35.8q | 176.8o | 122.1n | 170.0o | 97.1o |
| C1 | 47.8m | 50.7no | 44.3kl | 68.0m | 404.7l | 344.7i–k | 372.3m | 309.4jk | |
| C2 | 97.3i | 90.6k | 92.2i | 86.6k | 772.2gh | 489.8gh | 699.6h | 373.1i | |
| C3 | 173.6g | 144.6f | 166.8de | 143.9g | 1218.7f | 795.8e | 1263.5f | 760.1f | |
| C4 | 205.2d | 178.4b | 197.5c | 183.4b | 1718.7c | 944.4c | 1613.0c | 1004.9b | |
| b | 46.0 ** | 38.2 ** | 44.2 ** | 37.1 ** | 389.8 ** | 209.6 ** | 377.7 ** | 266.6 ** | |
| r | 0.95 ** | 0.98 ** | 0.94 ** | 0.97 ** | 0.98 ** | 0.99 ** | 0.98 ** | 0.96 ** | |
| B | C0 | 30.0o | 41.9p | 27.8mn | 35.7q | 232.6n | 154.5mn | 212.4o | 157.1n |
| C1 | 51.2lm | 52.1no | 42.4l | 67.7m | 416.6l | 281.8kl | 391.8m | 340.8ij | |
| C2 | 84.2j | 99.0j | 107.9g | 117.0i | 644.6i | 378.9i | 556.1jk | 431.2h | |
| C3 | 182.5f | 125.3h | 150.8f | 170.7cd | 1229.3f | 597.7f | 1186.8g | 892.9cd | |
| C4 | 208.3cd | 207.0a | 191.5c | 206.4a | 1766.8b | 1022.6b | 1543.0d | 921.5c | |
| b | 48.8 ** | 40.4 ** | 43.6 ** | 44.5 ** | 388.1 ** | 205.2 * | 345.6 ** | 208.1 ** | |
| r | 0.94 ** | 0.92 ** | 0.98 ** | 0.99 ** | 0.94 ** | 0.91 * | 0.94 ** | 0.93 ** | |
| C | C0 | 36.5n | 48.1op | 24.1n | 44.9p | 285.0m | 196.9m | 199.5o | 185.9mn |
| C1 | 59.3k | 65.7m | 54.6k | 57.0n | 534.7j | 374.2ij | 531.3k | 339.0ij | |
| C2 | 98.2i | 132.7g | 94.1hi | 97.2j | 755.0h | 573.1f | 726.7h | 493.1g | |
| C3 | 193.1e | 149.1ef | 169.3d | 149.3g | 1319.6e | 747.2e | 1280.2f | 744.4f | |
| C4 | 224.7b | 156.8d | 211.4b | 165.6d–f | 1793.9b | 884.4cd | 1704.4b | 927.2c | |
| b | 51.0 * | 30.0 * | 48.9 ** | 33.4 ** | 380.3 ** | 174.8 ** | 375.9 ** | 188.8 ** | |
| r | 0.95 * | 0.90 * | 0.98 * | 0.96 ** | 0.96 ** | 1.00 ** | 0.98 ** | 0.99 ** | |
| D | C0 | 25.6op | 57.1n | 23.0n | 53.4no | 218.5no | 280.4kl | 178.8o | 275.9kl |
| C1 | 57.4kl | 52.6no | 46.8kl | 67.3m | 487.0k | 307.1j–l | 486.2l | 231.8lm | |
| C2 | 102.0i | 76.7l | 75.4j | 135.9h | 808.4g | 464.6h | 612.7i | 473.2gh | |
| C3 | 191.1e | 154.6de | 158.0ef | 160.8f | 1493.7d | 782.5e | 1255.8f | 835.8e | |
| C4 | 239.3a | 168.4c | 229.4a | 168.0c–e | 1968.7a | 1035.3b | 1945.8a | 1176.8a | |
| b | 56.1 ** | 32.5 * | 52.4 ** | 32.3 * | 450.7 ** | 198.5 ** | 430.4 ** | 240.6 * | |
| r | 0.97 ** | 0.86 * | 0.94 ** | 0.91 * | 0.97 ** | 0.93 ** | 0.93 ** | 0.90 * | |
| E | C0 | 23.4p | 51.1no | 24.6n | 47.7op | 208.5no | 201.4m | 207.3o | 189.7mn |
| C1 | 50.2m | 69.5m | 46.2kl | 76.8l | 440.1kl | 270.9l | 324.7n | 279.9k | |
| C2 | 99.2i | 115.7i | 104.3gh | 104.0j | 755.5h | 551.7fg | 590.1ij | 433.1h | |
| C3 | 164.1h | 160.3d | 174.0d | 162.1ef | 1322.3e | 869.2d | 1288.2f | 865.3de | |
| C4 | 212.0c | 179.8b | 200.6bc | 174.2c | 1687.2c | 1234.9a | 1484.5e | 1183.4a | |
| b | 49.1 ** | 34.8 ** | 48.0 ** | 33.8 ** | 384.0 ** | 266.5 ** | 351.8 ** | 257.3 ** | |
| r | 0.98 ** | 0.98 ** | 0.97 ** | 0.97 ** | 0.98 ** | 0.96 ** | 0.93 ** | 0.93 ** | |
| Check var. | KND | 139.4 | 116.1 | 137.5 | 130.7 | 1055.9 | 848.6 | 1066.4 | 953.3 |
| KGW | 98.5 | 70.5 | 88.2 | 90.2 | 791.4 | 374.3 | 627.1 | 465.3 | |
| P339 | 14.3 | 14.2 | 14.3 | 9.2 | 104.2 | 92.4 | 108.0 | 91.7 | |
References
- Burt, A.J.; Caston, L.; Leeson, S.; Shelp, B.J.; Lee, E.A. Development and utilization of high carotenoid maize germplasm: Proof of concept. Crop Sci. 2013, 53, 554–563. [Google Scholar] [CrossRef]
- Abdel-Aal, E.M.; Young, J.C.; Rabalski, I. Anthocyanin composition in black, blue, pink, purple, and red cereal grains. J. Agric. Food Chem. 2006, 54, 4696–4704. [Google Scholar] [CrossRef] [PubMed]
- Khampas, S.; Lertrat, K.; Lomthaisong, K.; Suriharn, B. Variability in phytochemicals and antioxidant activity in corn at immaturity and physiological maturity stages. Int. Food Res. J. 2013, 20, 3149–3157. [Google Scholar]
- Herrera-Sotero, M.Y.; Cruz-Hernández, C.D.; Trujillo-Carretero, C.; Rodríguez-Dorantes, M.; García-Galindo, H.S.; Chávez-Servia, J.L.; Oliart-Ros, R.M.; Guzmán-Gerónimo, R.I. Antioxidant and antiproliferative activity of blue corn and tortilla from native maize. Chem. Cent. J. 2017, 11, 1–8. [Google Scholar] [CrossRef]
- Khamphasan, P.; Lomthaisong, K.; Harakotr, B.; Ketthaisong, D.; Scott, M.P.; Lertrat, K.; Suriharn, B. Genotypic variation in anthocyanins, phenolic compounds, and antioxidant activity in cob and husk of purple field corn. Agronomy 2018, 8, 271. [Google Scholar] [CrossRef]
- Ghasemzadeh, A.; Karbalaii, M.T.; Jaafar, H.Z.E.; Rahmat, A. Phytochemical constituents, antioxidant activity, and antiproliferative properties of black, red, and brown rice bran. Chem. Cent. J. 2018, 12, 17–29. [Google Scholar] [CrossRef]
- Isabelle, M.; Lee, B.L.; Lim, M.T.; Koh, W.P.; Huang, D.; Ong, C.N. Antioxidant activity and profiles of common fruits in Singapore. Food Chem. 2010, 123, 77–84. [Google Scholar] [CrossRef]
- Nabae, K.; Hayashi, S.M.; Ichihara, T.; Hagiwara, A.; Tamano, S. A 90-day oral toxicity study of purple corn color, a natural food colorant, in F344 rats. Food Chem. Toxicol. 2008, 46, 774–780. [Google Scholar] [CrossRef]
- Lao, F.; Sigurdson, G.T.; Giusti, M.M. Health benefits of purple corn (Zea mays L.) phenolic compounds. Compr. Rev. Food Sci. F 2017, 16, 234–246. [Google Scholar] [CrossRef]
- Anderson, E.G. Pericarp studies in maize: II. The allelomor- phism of a series of factors for pericarp color. Genetics 1924, 9, 442–453. [Google Scholar]
- Coe, E.H.; Neuffer, M.G.; Hoisingto, D.A. The genetics of corn. In Corn and Corn Improvement; Sprague, G.F., Dudlley, J., Eds.; ASA: Madison, WI, USA, 1988; pp. 81–258. [Google Scholar]
- Goettel, W.; Messing, J. Divergence of gene regulation through chromosomal rearrangements. BMC Genom. 2010, 11, 678. [Google Scholar] [CrossRef] [PubMed]
- Robbins, M.L.; Wang, P.; Sekhon, R.S.; Chopra, S. Gene structure induced epigenetic modifications of pericarp color1 alleles of maize result in tissue-specific mosaicism. PLoS ONE. 2009, 4, 1–12. [Google Scholar] [CrossRef]
- Chopra, S.; Athma, P.; Li, X.G.; Peterson, T. A maize Myb homolog is encoded by a multicopy gene complex. Mol. Gen. Genet. 1998, 260, 372–380. [Google Scholar] [CrossRef]
- Zhang, F.; Peterson, T. Comparisons of maize pericarp color1 alleles reveal paralogous gene recombination and an organ-specific enhancer region. Plant Cell 2005, 17, 903–914. [Google Scholar] [CrossRef] [PubMed]
- Landi, P.; Cane, M.A.; Frascaroli, E. Responses to divergent selection for cob color in maize. Euphytica 2008, 164, 645–658. [Google Scholar] [CrossRef]
- Samanta, A.K.; Senani, S.; Kolte, A.P.; Sridhar, M.; Sampath, K.T.; Jayapal, N.; Devi, A. Production and in vitro evaluation of xylooligosaccharides generated from corn cobs. Food Bioprod Process 2012, 90, 466–474. [Google Scholar] [CrossRef]
- Wachirapakorn, C.; Pilachai, K.; Wanapat, M.; Pakdee, P.; Cherdthong, A. Effect of ground corn cobs as a fiber source in total mixed ration on feed intake, milk yield and milk composition in tropical lactating crossbred Holstein cows. Anim. Nutr. 2016, 2, 334–338. [Google Scholar] [CrossRef]
- Chen, M.; Xia, L.; Xue, P. Enzymatic hydrolysis of corn cob and ethanol production from cellulosic hydrolysate. Int. Biodeterior Biodegrad 2007, 59, 85–89. [Google Scholar] [CrossRef]
- Ji, Z.; Lin, H.; Chen, Y.F.; Dong, Y.B.; Imran, M. Corn cob modified by lauric acid and ethanediol for emulsified oil adsorption. J. Cent. South Univ. T 2015, 22, 2096–2105. [Google Scholar] [CrossRef]
- Hosoda, K.; Eruden, B.; Matsuyama, H.; Shioya, S. Effect of anthocyanin-rich corn silage on digestibility, milk production and plasma enzyme activities in lactating dairy cows. Anim. Sci. J. 2012, 83, 453–459. [Google Scholar] [CrossRef]
- Khonkhaeng, B.; Cherdthong, A. Pleurotus ostreatus and Volvariella volvacea can enhance the quality of purple field corn stover and modulate ruminal fermentation and feed utilization in tropical beef cattle. Animals 2019, 9, 1084. [Google Scholar] [CrossRef] [PubMed]
- Li, C.Y.; Kim, H.W.; Won, S.R.; Min, H.K.; Park, K.J.; Park, J.Y.; Ahn, M.S.; Rhee, H.I. Corn husk as a potential source of anthocyanins. J. Cent. South Univ. T 2008, 56, 11413–11416. [Google Scholar] [CrossRef] [PubMed]
- Yang, Z.; Zhai, W. Identification and antioxidant activity of anthocyanins extracted from the seed and cob of purple corn (Zea mays L.). Innov. Food Sci. Emerg. Technol. 2010, 11, 169–176. [Google Scholar] [CrossRef]
- Simla, S.; Boontang, S.; Harakotr, B. Anthocyanin content, total phenolic content, and antiradical capacity in different ear components of purple waxy corn at two maturation stages. AJCS 2016, 10, 675–682. [Google Scholar] [CrossRef]
- Fehr, W.R. Principles of Cultivar Development: Theory and Technique; Macmillan: New York, NY, USA, 1987. [Google Scholar]
- De Leon, N.; Coors, J.G. Twenty-four cycle of mass selection for prolification in the Golden Glow maize population. Crop Sci. 2002, 42, 325–333. [Google Scholar] [CrossRef]
- De Galarreta, J.I.R.; Álvarez, A. Short communication: Divergent mass selection for different flowering times in a Spanish synthetic maize population. Span, J. Agric. Res. 2008, 6, 56–60. [Google Scholar] [CrossRef]
- Hallauer, A.R.; Carena, M.J.; Miranda-Filho, J.B. Quantitative Genetics in Maize Breeding; Springer: New York, NY, USA, 2010. [Google Scholar]
- Kesornkeaw, P.; Lertrat, K.; Suriharn, B. Response to four cycles of mass selection for prolificacy at low and high population densities in small ear waxy corn. Asian, J. Plant Sci. 2009, 8, 425–432. [Google Scholar] [CrossRef]
- Senamontry, K.; Lertrat, K.; Suriharn, B. Response to five cycles of modified mass selection for ear length in waxy corn. Sabrao, J. Breed. Genet. 2013, 45, 332–340. [Google Scholar]
- Hussanun, S.; Bhalang, S.; Lertrat, K. Yield and early maturity response to four cycles of modified mass selection in purple waxy corn. Turk. J. Field Crops 2014, 19, 84–89. [Google Scholar] [CrossRef]
- Dudley, J.W.; Lambert, R.J. 100 generations of selection for oil and protein in corn. Plant Breed. Rev. 2004, 24, 79–110. [Google Scholar] [CrossRef]
- Scott, M.P.; Darrigues, A.; Stahly, T.S.; Lamkey, K. Recurrent selection to alter grain methionine concentration and improve nutritional value of maize. Crop Sci. 2008, 48, 1705–1713. [Google Scholar] [CrossRef]
- Preciado-Ortiz, R.E.; García-Lara, S.; Ortiz-Islas, S.; Ortega-Corona, A.; Serna-Saldivar, S.O. Response of recurrent selection on yield, kernel oil content and fatty acid composition of subtropical maize populations. Field Crops Res. 2013, 142, 27–35. [Google Scholar] [CrossRef]
- Dhliwayo, T.; Palacios-Rojas, N.; Crossa, J.; Pixley, K.V. Effects of S1 recurrent selection for provitamin A carotenoid content for three open-pollinated maize cultivars. Crop Sci. 2014, 54, 2449–2460. [Google Scholar] [CrossRef]
- Jing, P.; Noriega, V.; Schwartz, S.J.; Giusti, M.M. Effects of growing conditions on purple corncob (Zea mays L.) anthocyanins. J. Agr. Food Chem. 2007, 55, 8625–8629. [Google Scholar] [CrossRef]
- Yang, Z.; Fan, G.; Gu, Z.; Han, Y.; Chen, Z. Optimization extraction of anthocyanins from purple corn (Zea mays L.) cob using tristimulus colorimetry. Eur. Food Res. Technol. 2008, 227, 409–415. [Google Scholar] [CrossRef]
- Lee, J.; Durst, R.W.; Wrolstad, R.E. Determination of total monomeric anthocyanin pigment content of fruit juices, beverages, natural colorants, and wines by the pH differential method: Collaborative study. J. AOAC Int. 2005, 88, 1269–1278. [Google Scholar] [CrossRef]
- Hu, Q.P.; Xu, J.G. Profiles of carotenoids, anthocyanins, phenolics, and antioxidant activity of selected color waxy corn grains during maturation. J. Agric. Food Chem. 2011, 59, 2026–2033. [Google Scholar] [CrossRef]
- Gomez, K.A.; Gomez, A.A. Statistical Procedure for Agricultural Research; John Wiley & Sons: New York, NY, USA, 1984. [Google Scholar]
- Holland, J.B.; Nyquist, W.E.; Cervartes-Martinez, C.T. Estimating and interpreting heritability for plant breeding: An update. Plant Breed. Rev. 2003, 22, 2–112. [Google Scholar]
- Abakemal, D.; Shimelis, H.; Derera, J. Analyses of combining ability and genotype-by-environment interaction of quality protein maize inbred lines adapted to tropical-highlands. Crop Sci. 2016, 56, 3078–3089. [Google Scholar] [CrossRef]
- Badu-Apraku, B.; Menkir, A.; Ajala, S.; Akinwale, R.; Oyekunle, M.; Obeng-Antwi, K. Performance of tropical early-maturing maize cultivars in multiple stress environments. Can. J. Plant Sci. 2010, 90, 831–852. [Google Scholar] [CrossRef]
- Khampas, S.; Lertrat, K.; Lomthaisong, K.; Simla, S.; Suriharn, B. Effect of location, genotype and their interactions for anthocyanins and antioxidant activities of purple waxy corn cob. Turk, J. Field Crops 2015, 20, 15–23. [Google Scholar] [CrossRef]
- Mohamed, G.; Lertrat, K.; Suriharn, B. Phenolic compound, anthocyanin content, and antioxidant activity in some parts of purple waxy corn across maturity stages and locations. Int. Food Res. J. 2017, 24, 490–497. [Google Scholar]
- Baron, V.S.; Najda, H.G.; Stevenson, F.C. Influence of population density, row spacing and hybrid on forage corn yield and nutritive value in a cold-season environment. Can. J. Plant Sci. 2006, 86, 1131–1138. [Google Scholar] [CrossRef]
- Tollenaar, M.; Daynard, T.B.; Hunter, R.B. Effect of temperature on rate of leaf appearance and flowering date in maize. Crop Sci. 1979, 19, 363–366. [Google Scholar] [CrossRef]
- Harakotr, B.; Suriharn, B.; Scott, M.P.; Lertrat, K. Genotypic variability in anthocyanins, total phenolics, and antioxidant activity among diverse waxy corn germplasm. Euphytica 2015, 203, 237–248. [Google Scholar] [CrossRef]
- Mahan, A.L.; Murray, S.C.; Rooney, L.W.; Crosby, K.M. Combining ability for total phenols and secondary traits in a diverse set of colored (red, blue, and purple) maize. Crop Sci. 2013, 53, 1248–1255. [Google Scholar] [CrossRef]
- Menkir, A.; Liu, W.; White, W.S.; Maziya-Dixon, B.; Rocheford, T. Carotenoid diversity in tropical-adapted yellow maize inbred lines. Food Chem. 2008, 109, 521–529. [Google Scholar] [CrossRef]
- Sandoya, G.; Butrón, A.; Santiago, R.; Alvarez, A.; Malvar, R.A. Indirect response to selection for improving resistance to the Mediterranean corn borer (Sesamia nonagrioides Lef) in maize. Euphytica 2010, 176, 231–237. [Google Scholar] [CrossRef][Green Version]
- Lamkey, C. Selection and Genetic Drift in North American Maize. Ph.D. Thesis, University of Nebraska, Lincoln, Nebraska, 2014. [Google Scholar]
- Rodríguez, V.M.; Soengas, P.; Landa, A.; Ordás, A.; Revilla, P. Effects of selection for color intensity on antioxidant capacity in maize (Zea mays L.). Euphytica 2013, 193, 339–345. [Google Scholar] [CrossRef][Green Version]
- Chen, S.M.; Coe, E.H. Control of anthocyanin synthesis by the C locus in maize. Biochem. Genet. 1977, 15, 333–346. [Google Scholar] [CrossRef]
- Coe, E.H. Anthocyanin genetics. In The Maize Handbook; Freeling, M., Walbot, V., Eds.; Springer: New York, NY, USA, 1994; pp. 279–281. [Google Scholar]
- Styles, E.D.; Ceska, O. Pericarp flavonoids in genetic strains strains of Zea mays. Maydica 1989, 34, 227–237. [Google Scholar]
- Dar, Z.A.; Lone, A.A.; Alaie, B.A.; Ali, G.; Gazal, A.; Gulzar, S.; Yousuf, N. Correlation studies in temperate maize (Zea mays L.) inbred lines. Plant Arch. 2015, 15, 1191–1194. [Google Scholar]
- Tiwari, D.T.; Tripathi, S.R.; Tripathi, M.P.; Khatri, N.; Bastola, B.R. Genetic variability and correlation coefficients of major traits in early maturing rice under rainfed lowland environments of Nepal. Adv. Agric. 2019, 1–9. [Google Scholar] [CrossRef]
- Sowmy, H.H.; Brunda, S.M.; Shinde, D.G.; Gowda, V.; Kamatar, M.Y. Estimation of correlation coefficients and path for yield traits in grain mold tolerant f3 progenies of sorghum. Int. J. Sci. Res. 2013, 4, 1420–1424. [Google Scholar]
- Govindaraj, M.; Selvi, B.; Rajarathinam, S. Correlation studies for grain yield components and nutritional quality traits in pearl millet (Pennisetum glaucum (L.) R. Br.) Germplasm. World, J. Agric. Sci. 2009, 5, 686–689. [Google Scholar]
- Pairochteerakul, P.; Jothityangkoon, D.; Ketthaisong, D.; Simla, S.; Lertrat, K.; Suriharn, B. Seed germination in relation to total sugar and starch in endosperm mutant of sweet corn genotypes. Agronomy 2018, 8, 299. [Google Scholar] [CrossRef]
- Bello, O.B.; Abdulmaliq, S.Y.; Ige, S.A.; Mahamood, J.; Oluleye, F.; Azeez, M.A.; Afolabi, M.S. Evaluation of early and late/intermediate maize varieties for grain yield potential and adaptation to a southern guinea savanna agro-ecology of Nigeria. Int. J. Plant Res. 2012, 2, 14–21. [Google Scholar] [CrossRef]
- Grzybowski, M.; Adamczyk, J.; Jończyk, M.; Sobkowiak, A.; Szczepanik, J.; Frankiewicz, K.; Fronk, J.; Sowiński, P. Increased photosensitivity at early growth as a possible mechanism of maize adaptation to cold springs. J. Exp. Bot. 2019, 70, 2887–2904. [Google Scholar] [CrossRef]
- Manjeru, P. The Influence of Abiotic Stress on CIMMYT Provitamin a Elite Maize Germplasm. Ph.D. Thesis, University of the Free State, Bloemfontein, South Africa, 2017. [Google Scholar]
- Sangoi, L. Understanding plant density effects on maize growth and development: An important issue to maximize grain yield. Cienc. Rural 2000, 31, 159–168. [Google Scholar] [CrossRef]
- Onasanya, R.O.; Aiyelari, O.P.; Onasanya, A.; Oikeh, S.; Nwilene, F.E.; Oyelakin, O.O. Growth and yield response of maize (Zea mays L.) to different rates of nitrogen and phosphorus fertilizers in southern Nigeria. World J. Agric. Sci. 2009, 5, 400–407. [Google Scholar]
- Immanuel, R.; Thiruppathi, M.; Sudhagar Rao, G.B.; Saravanaperumal, M.; Nambi, J. Soil moisture, crop growth and yield of maize as influenced by Albizia saman agroforestry system. IJRAR 2019, 6, 327–334. [Google Scholar]
- Chandler, K.; Lipka, A.E.; Owens, B.F.; Li, H.; Buckler, E.S.; Rocheford, T.; Gore, M.A. Genetic analysis of visually scored orange kernel color in maize. Crop Sci. 2012, 53, 189–200. [Google Scholar] [CrossRef]
- Owens, B.F.; Mathew, D.; Diepenbrock, C.H.; Tiede, T.; Wu, D.; Mateos-Hernandez, M.; Gore, M.A.; Rocheford, T. Genome-wide association study and pathway-level analysis of kernel color in maize. G3 2019, 9, 1945–1955. [Google Scholar] [CrossRef] [PubMed]
- Khoo, H.E.; Azlan, A.; Tang, S.T.; Lim, S.M. Anthocyanidins and anthocyanins: Colored pigments as food, pharmaceutical ingredients, and the potential health benefits. Food Nutr. Res. 2017, 6, 1–21. [Google Scholar] [CrossRef] [PubMed]
- Lin, D.; Xiao, M.; Zhao, J.; Li, Z.; Xing, B.; Li, X.; Kong, M.; Li, L.; Zhang, Q.; Liu, Y.; et al. An overview of plant phenolic compounds and their importance in human nutrition and management of type 2 diabetes. Molecules 2016, 21, 1374. [Google Scholar] [CrossRef]
- Siyuan, S.; Tong, L.; Liu, R. Corn phytochemicals and their health benefits. Food Sci. Hum. Wellness 2018, 7, 185–195. [Google Scholar] [CrossRef]


| Line | Pedigree | Color | Source | ||
|---|---|---|---|---|---|
| Kernel | Husk | Cob | |||
| Female | |||||
| Pacific339 | orange | green | white | PS | |
| NSX | orange | green | white | NSFCRC | |
| NS3 | orange | green | white | NSFCRC | |
| Male | |||||
| PF1 | AB/PF | purple | purple | purple | PBRCSA |
| PF2 | TB/KND10//PF | white | purple | purple | PBRCSA |
| PF3 | TL/PF//KND10 | yellow | purple | purple | PBRCSA |
| PF4 | DKA/PF//KND | purple | purple | purple | PBRCSA |
| PF5 | WSTS/PF//KND | white | purple | purple | PBRCSA |
| Environment | Location | Season | Latitude | Longitude | Altitude (m) | Soil Texture | Average Temperature (°C) |
|---|---|---|---|---|---|---|---|
| E1 | Khon Kaen | Dry 2017/2018 | 16°28′11.24” N | 102°48′49.46 E | 120 | Sandy loam | 19.1 |
| E2 | Rainy 2018 | 27.7 | |||||
| E3 | Uthai Thani | Dry 2017/2018 | 15°22′57.77” N | 100° 4′42.54” E | 20 | Clay loam | 26.6 |
| E4 | Rainy 2018 | 29.7 |
| SOV | df | Grain Yield | Husk Mass | Cob Mass | Anthesis Day | Plant Height | Ear Height | TAY | |
|---|---|---|---|---|---|---|---|---|---|
| Husk | Cob | ||||||||
| Environment (E) | 3 | 4807,326 ** | 1,304,911 ** | 767,987 ** | 417.6 ** | 17,188 ** | 10,297 ** | 261.9 ** | 235.4 ** |
| (9.9) | (63.8) | (56.7) | (66.7) | (60.6) | (58.4) | (5.0) | (17.0) | ||
| Error (a) | 8 | 187,251 | 5007 | 6332 | 0.4 | 423 | 124 | 0.5 | 0.3 |
| (1.0) | (0.7) | (1.2) | (0.2) | (4.0) | (1.9) | (0.0) | (0.1) | ||
| Population (P) | 4 | 4,442,353 ** | 27,888 ** | 4032ns | 4.4 ** | 633 ** | 755 ** | 10.5 ** | 10.1 ** |
| (12.2) | (1.8) | (0.4) | (0.9) | (3.0) | (5.7) | (0.0) | (1.0) | ||
| E × P | 12 | 1,227,452 ** | 32,021 ** | 7265ns | 3.4 ** | 134* | 98 ** | 3.0 ** | 3.2 ** |
| (10.1) | (6.3) | (2.1) | (2.2) | (1.9) | (2.2) | (0.0) | (1.0) | ||
| Error (b) | 32 | 315,902 | 3573 | 6297 | 0.7 | 54 | 34 | 0.6 | 0.3 |
| (6.9) | (1.9) | (5.0) | (1.2) | (2.0) | (2.1) | (0.1) | (0.2) | ||
| Cycle (C) | 4 | 2,407,467 ** | 34,362 ** | 23,619 ** | 94.5 ** | 761 ** | 1247 ** | 3114.9 ** | 580.4 ** |
| (6.6) | (2.2) | (2.3) | (20.1) | (3.6) | (9.4) | (88.0) | (57.0) | ||
| E × C | 12 | 755,443 ** | 12,801 ** | 16,269 ** | 6.1 ** | 301 ** | 203 ** | 46.9 ** | 58.3 ** |
| (6.2) | (2.5) | (4.8) | (3.9) | (4.2) | (4.6) | (4.0) | (17.0) | ||
| P × C | 16 | 486,361 * | 10,016 ** | 5131ns | 0.5ns | 221 ** | 90 ** | 3.6 ** | 4.7 ** |
| (5.3) | (2.6) | (2.0) | (0.4) | (4.2) | (2.7) | (0.0) | (1.0) | ||
| E × P × C | 48 | 402,421 * | 7887 ** | 4764ns | 0.4ns | 66 ** | 30ns | 2.0 ** | 1.9 ** |
| (13.2) | (6.2) | (5.6) | (0.9) | (3.7) | (2.7) | (0.0) | (2.0) | ||
| Pooled error (c) | 160 | 261,380 | 4623 | 5028 | 0.4 | 69 | 34 | 0.6 | 0.3 |
| (28.6) | (12.1) | (19.8) | (3.4) | (12.9) | (10.3) | (0.7) | (1.0) | ||
| CV (a)1 | 6.2 | 8.3 | 8.7 | 1.2 | 10.9 | 11.7 | 8.6 | 14.3 | |
| CV (b) 1 | 8.1 | 7.0 | 8.7 | 1.5 | 3.9 | 6.1 | 9.7 | 12.3 | |
| CV (c) 1 | 7.3 | 8.0 | 7.8 | 1.2 | 4.4 | 6.1 | 9.4 | 12.3 | |
| SOV | df | Husk | Cob | ||||||
|---|---|---|---|---|---|---|---|---|---|
| TAC | TPC | DPPH | TEAC | TAC | TPC | DPPH | TEAC | ||
| Environment (E) | 3 | 224,274 ** | 440,534 ** | 174,023 ** | 2,262,768 ** | 1,483,875 ** | 179,389 ** | 1292 ** | 2,517,996 ** |
| (0.4) | (0.7) | (10.5) | (4.7) | (12.4) | (0.8) | (0.3) | (10.6) | ||
| Error (a) | 8 | 1257 | 2564 | 26 | 1094 | 720 | 792 | 28 | 2577 |
| (0.0) | (0.0) | (0.0) | (0.0) | (0.0) | (0.0) | (0.0) | (0.0) | ||
| Population (P) | 4 | 55,357 ** | 133,723 ** | 1512 ** | 165,909 ** | 103,969 ** | 211,480 ** | 417 ** | 91,273 ** |
| (0.1) | (0.3) | (0.1) | (0.5) | (1.2) | (1.3) | (0.1) | (0.5) | ||
| ExP | 12 | 29,413 ** | 34,349 ** | 581 ** | 18,513 ** | 35,550 ** | 60,721 ** | 600 ** | 23,256 ** |
| (0.2) | (0.2) | (0.1) | (0.2) | (1.2) | (1.1) | (0.6) | (0.4) | ||
| Error (b) | 32 | 662 | 1154 | 15 | 944 | 234 | 1309 | 31 | 1141 |
| (0.0) | (0.0) | (0.0) | (0.0) | (0.0) | (0.1) | (0.1) | (0.1) | ||
| Cycle (C) | 4 | 39,180,000 ** | 46,300,000 ** | 1,048,430 ** | 32,890,000 ** | 5,970,024 ** | 13,570,000 ** | 274,538 ** | 14,200,000 ** |
| (98.1) | (96.6) | (84.7) | (91.6) | (66.3) | (82.2) | (93.5) | (80.0) | ||
| ExC | 12 | 52,823 ** | 122,870 ** | 14,594 ** | 2,170,888 ** | 425,840 ** | 461,858 ** | 2662 ** | 384,372 ** |
| (0.4) | (0.8) | (3.5) | (1.8) | (14.2) | (8.4) | (2.7) | (6.5) | ||
| PxC | 16 | 24,714 ** | 53,517 ** | 728 ** | 30,065 ** | 47,058 ** | 85,369 ** | 238 ** | 26,893 ** |
| (0.2) | (0.4) | (0.2) | (0.3) | (2.1) | (2.1) | (0.3) | (0.6) | ||
| ExPxC | 48 | 12,199 ** | 35,064 ** | 715 ** | 21,193 ** | 19,106 ** | 53,219 ** | 487 ** | 14,603 ** |
| (0.4) | (0.9) | (0.7) | (0.7) | (2.5) | (3.9) | (2.0) | (1.0) | ||
| Pooled error (c) | 160 | 810 | 1205 | 20 | 648 | 345 | 1004 | 23 | 1029 |
| (0.1) | (0.1) | (0.1) | (0.1) | (0.2) | (0.2) | (0.3) | (0.2) | ||
| CV (a)1 | 3.8 | 4.5 | 2.9 | 3.8 | 6.3 | 3.5 | 4.8 | 7.1 | |
| CV (b) 1 | 2.7 | 3.0 | 2.1 | 3.5 | 3.6 | 4.5 | 5.0 | 4.7 | |
| CV (c) 1 | 3.0 | 3.1 | 2.5 | 2.9 | 4.3 | 3.9 | 4.4 | 4.5 | |
| Population | Cycle | Grain Yield 2 | Husk Mass | Cob Mass | Anthesis Day | Plant Height | Ear Height | TAY 3 | |
|---|---|---|---|---|---|---|---|---|---|
| (kg ha−1) | (kg ha−1) | (kg ha−1) | (DAP) | (cm) | (cm) | Husk | Cob | ||
| A | C0 | 7112bc 1 | 840d–h | 897a–d | 56b | 186.6c–g | 98.0d–f | 1.0l | 0.9j |
| C1 | 7571a | 842d–h | 921a–c | 55de | 182.8e–h | 95.7e–i | 2.6k | 1.8hi | |
| C2 | 7588a | 859b–f | 897a–d | 54fg | 185.6d–h | 93.8g–k | 5.6g | 3.3f | |
| C3 | 7050bc | 860b–f | 943ab | 54gh | 184.3e–h | 91.8i–k | 13.8d | 4.8e | |
| C4 | 7069bc | 868b–e | 947ab | 53kl | 188.1b–e | 94.0f–k | 17.5b | 8.2b | |
| ∆C | −43 | 28 | 50 | −3 | 1.5 | −4.0 | 16.4 | 7.3 | |
| b | −61ns | 7 ** | 12ns | −1 ** | 0.5ns | -1.2ns | 4.4 ** | 1.8 ** | |
| r | 0.35ns | 0.96 ** | 0.80ns | 0.99 ** | 0.35ns | 0.81ns | 0.97 ** | 0.97 ** | |
| B | C0 | 7236ab | 869b–e | 911a–c | 56b | 192.2a–c | 97.0d–h | 0.9l | 0.9j |
| C1 | 7616a | 909ab | 931a–c | 55cd | 186.9c–f | 95.1f–i | 2.9jk | 1.7i | |
| C2 | 7230ab | 847c–f | 882cd | 54fg | 181.1f–h | 84.0l | 5.2gh | 2.7g | |
| C3 | 6815cd | 871b–e | 897a–d | 53hij | 179.3h | 80.5l | 13.6d | 4.7e | |
| C4 | 6946b–d | 901a–c | 950ab | 53l | 191.8a–d | 96.0e–j | 18.3a | 7.9b | |
| ∆C | 290 | 32 | 39 | −3 | −0.3 | −1.0 | 17.4 | 7.1 | |
| b | −138ns | 3ns | 4ns | −1 ** | −0.8ns | −1.7ns | 4.6 ** | 1.7 ** | |
| r | 0.71ns | 0.16ns | 0.25ns | 0.99 ** | 0.22ns | 0.34ns | 0.97 ** | 0.96 ** | |
| C | C0 | 6373e | 802gh | 883cd | 56a | 197.3a | 99.9b–e | 0.8l | 1.1j |
| C1 | 6945b–d | 874b–e | 907a–d | 55bc | 195.3a | 103.0a–c | 3.9i | 2.1h | |
| C2 | 6572de | 834e–h | 923a–c | 54ef | 180.1gh | 89.3k | 4.9h | 3.4f | |
| C3 | 6289e | 809f–h | 918a–c | 54f–h | 187.6b–f | 90.3jk | 12.4e | 6.6d | |
| C4 | 6787cd | 873b–e | 913a–c | 53j–l | 187.4b–f | 97.0d–h | 17.4b | 7.9b | |
| ∆C | 414 | 72 | 31 | −3 | −9.9 | −2.9 | 16.5 | 6.8 | |
| b | 17ns | 8ns | 7ns | −1 ** | −2.8ns | −1.9ns | 4.2 ** | 1.8 ** | |
| r | 0.10ns | 0.36ns | 0.72ns | 0.99 ** | 0.63ns | 0.49ns | 0.97 ** | 0.98 ** | |
| D | C0 | 7046bc | 791h | 851d | 57a | 182.6e–h | 101.1a–d | 1.1l | 0.8j |
| C1 | 6864b–d | 842d–h | 911abc | 55bc | 195.1a | 98.6c–f | 3.4ij | 1.5i | |
| C2 | 6961b–d | 794gh | 908a–d | 54ef | 186.0c–g | 93.6g–k | 4.8h | 3.4f | |
| C3 | 6266e | 825e–h | 901a–d | 54f–h | 181.3f–h | 92.3h–k | 13.2d | 7.5c | |
| C4 | 7008bc | 905ab | 953a | 53i–k | 185.5d–h | 95.3e–i | 17.7b | 10.1a | |
| ∆C | −38 | 114 | 102 | −4 | 2.9 | −5.8 | 16.6 | 9.2 | |
| b | −67ns | 21ns | 19ns | −1 ** | −0.8ns | −1.8ns | 4.3 ** | 2.4 ** | |
| r | 0.33ns | 0.72ns | 0.85ns | 0.97 ** | 0.23ns | 0.78ns | 0.96 ** | 0.97 ** | |
| E | C0 | 6965bcd | 822e–h | 923a–c | 57a | 197.3a | 103.5ab | 1.0l | 0.9j |
| C1 | 6949bcd | 847c–g | 951a | 55bc | 197.0a | 105.4a | 3.4ij | 2.1h | |
| C2 | 6994bcd | 873b–e | 902a–d | 54ef | 186.1c–g | 94.2f–j | 6.6f | 2.7g | |
| C3 | 6834bcd | 942a | 892b–d | 54g–i | 192.0a–d | 97.4d–g | 15.1c | 6.4d | |
| C4 | 7135bc | 893a–d | 955a | 53j–l | 193.6ab | 101.6a–d | 18.6a | 8.2b | |
| ∆C | 170 | 71 | 33 | −4 | −3.7 | −1.9 | 17.6 | 7.3 | |
| b | 23ns | 24ns | 1ns | −1 ** | −1.2ns | −1.2ns | 4.7 ** | 1.9 ** | |
| r | 0.33ns | 0.82ns | 0.04ns | 0.99 ** | 0.43ns | 0.41ns | 0.98 ** | 1.0 ** | |
| Check var. | KND | 6882 | 809 | 976 | 45 | 195.8 | 97.5 | 1.6 | 4.9 |
| KGW | 6858 | 711 | 890 | 48 | 201.0 | 95.1 | 1.4 | 2.0 | |
| P339 | 10,871 | 1537 | 1216 | 60 | 188.2 | 102.9 | 0.1 | 0.0 | |
| Population | Cycle | Husk | Cob | ||||||
|---|---|---|---|---|---|---|---|---|---|
| TAC | TPC | DPPH | TEAC | TAC | TPC | DPPH | TEAC | ||
| A | C0 | 123.6no 1 | 179.0p | 37.7op | 171.0p | 96.6n | 256.0q | 36.6kl | 141.5p |
| C1 | 308.4m | 484.3m | 94.8m | 334.4n | 196.6k | 435.1n | 52.7j | 357.8k | |
| C2 | 643.6i | 896.7h | 129.6h | 554.7k | 355.1g | 714.4i | 91.7g | 583.7h | |
| C3 | 1601.5e | 1812.1d | 307.1e | 1266.8i | 504.2f | 1002.5h | 157.2d | 1009.5e | |
| C4 | 1984.8c | 2337.3b | 344.7c | 1893.1c | 826.8b | 1594.3b | 191.1b | 1320.2c | |
| ∆C | 1861.2 | 2158.3 | 307.0 | 1722.1 | 730.2 | 1338.3 | 154.6 | 1178.7 | |
| b | 501.6 ** | 564.4 ** | 82.6 ** | 437.7 ** | 176.8 ** | 324.4 ** | 41.4 ** | 300.9 ** | |
| r | 0.97 ** | 0.98 ** | 0.97 ** | 0.96 ** | 1.00 ** | 0.97 ** | 0.98 ** | 0.99 ** | |
| B | C0 | 109.4o | 210.1o | 40.2o | 166.9p | 93.1n | 262.3q | 33.8l | 189.1o |
| C1 | 321.9m | 471.3m | 98.6kl | 303.0o | 180.6l | 504.5m | 53.3j | 357.8k | |
| C2 | 601.4j | 647.7j | 116.4j | 555.8k | 312.1h | 593.6l | 102.0e | 502.7i | |
| C3 | 1546.4f | 1781.0ef | 284.4g | 1273.2i | 515.0f | 987.1h | 157.3d | 976.7f | |
| C4 | 2016.5b | 2248.2c | 325.0d | 1826.4e | 806.1c | 1264.8d | 203.3a | 1313.5c | |
| ∆C | 1907.1 | 2038.1 | 284.8 | 1659.5 | 713.0 | 1002.5 | 169.5 | 1124.4 | |
| b | 503.9 ** | 538.6 * | 75.5 ** | 428.9 ** | 176.0 ** | 248.8 ** | 44.3 ** | 286.8 ** | |
| r | 0.97 ** | 0.96 ** | 0.96 ** | 0.96 ** | 0.97 ** | 0.98 ** | 0.99 ** | 0.98 ** | |
| C | C0 | 102.2o | 212.5o | 35.8p | 172.3p | 118.9m | 315.7p | 38.4k | 216.8mn |
| C1 | 441.6k | 675.6j | 99.0k | 384.0m | 235.1j | 596.6l | 59.2hi | 444.8j | |
| C2 | 583.5j | 750.3i | 123.6i | 518.9l | 356.5g | 727.4i | 105.5e | 637.0g | |
| C3 | 1522.8g | 1760.1f | 281.2g | 1306.3h | 694.1e | 1127.4f | 165.2c | 1022.8e | |
| C4 | 1972.0c | 2342.4b | 351.5b | 1854.6d | 827.1b | 1443.6c | 189.6b | 1327.5c | |
| ∆C | 1869.8 | 2129.9 | 315.6 | 1682.3 | 708.2 | 1127.9 | 151.2 | 1110.7 | |
| b | 482.1 ** | 534.4 ** | 81.3 ** | 428.7 * | 187.5 ** | 278.7 ** | 40.9 ** | 279.9 ** | |
| r | 0.97 ** | 0.97 ** | 0.97 ** | 0.96 ** | 0.98 ** | 0.99 ** | 0.99 ** | 0.99 ** | |
| D | C0 | 144.8n | 260.1n | 40.5o | 167.1p | 97.7n | 358.1o | 39.8k | 238.4m |
| C1 | 394.4l | 554.2l | 95.4lm | 338.0n | 169.2l | 499.7m | 56.0ij | 378.0k | |
| C2 | 584.4j | 736.8i | 116.6j | 530.8l | 363.4g | 635.6k | 97.5f | 589.7h | |
| C3 | 1588.4e | 1792.9de | 296.7f | 1387.7g | 782.5d | 1177.9e | 166.1c | 1092.0d | |
| C4 | 1944.7d | 2266.3c | 344.5s | 1957.5b | 1018.2a | 1728.8a | 201.3a | 1531.6a | |
| ∆C | 1799.9 | 2006.2 | 304.0 | 1790.4 | 920.5 | 1370.7 | 161.5 | 1293.2 | |
| b | 479.4 ** | 525.1 ** | 81.3 ** | 463.1 * | 245.4 ** | 342.0 * | 43.3 ** | 330.0 ** | |
| r | 0.96 ** | 0.96 ** | 0.97 ** | 0.96 ** | 0.97 ** | 0.95* | 0.98 ** | 0.97 ** | |
| E | C0 | 121.0o | 277.9n | 48.1n | 172.3p | 101.1n | 298.0p | 36.7kl | 201.8no |
| C1 | 406.6l | 590.1k | 93.7m | 391.6m | 224.7j | 502.8m | 60.7h | 328.9l | |
| C2 | 752.1h | 972.7g | 130.6h | 648.2j | 297.2 i | 670.3j | 105.8e | 582.6h | |
| C3 | 1600.0e | 1799.4de | 296.2f | 1489.5f | 685.5e | 1045.2g | 165.1c | 1086.2d | |
| C4 | 2088.7a | 2371.6a | 362.3a | 2090.2a | 831.4b | 1425.8c | 191.6b | 1397.5b | |
| ∆C | 1967.7 | 2093.7 | 314.2 | 1917.9 | 730.3 | 1127.8 | 154.9 | 1195.7 | |
| b | 512.9 ** | 539.7 ** | 83.1 ** | 493.4 ** | 192.1 ** | 279.8 ** | 41.4 ** | 314.9 ** | |
| r | 0.98 ** | 0.98 ** | 0.97 ** | 0.97 ** | 0.97 ** | 0.98 ** | 0.99 ** | 0.98 ** | |
| Check var. | KND | 192.8 | 335.9 | 50.1 | 229.1 | 494.4 | 987.6 | 130.9 | 981.0 |
| KGW | 177.8 | 313.6 | 46.4 | 205.7 | 208.7 | 440.8 | 86.8 | 564.5 | |
| P339 | 6.0 | 34.9 | 14.8 | 40.9 | 3.6 | 87.9 | 13.0 | 99.1 | |
| Parameter | Total Anthocyanin Yield (TAY) | |
|---|---|---|
| Husk | Cob | |
| Grain yield | −0.28 ns | −0.35 ns |
| Husk Mass | −0.03 ns | −0.12 ns |
| Cob Mass | −0.04 ns | −0.03 ns |
| Days to anthesis | −0.24 ns | −0.44 * |
| Plant height | −0.24 ns | −0.18 ns |
| Ear height | −0.31 ns | −0.27 ns |
| Husk | ||
| TAC | 1.00 ** | 0.94 ** |
| TPC | 1.00 ** | 0.94 ** |
| DPPH | 0.99 ** | 0.93 ** |
| TEAC | 0.99 ** | 0.95 ** |
| Cob | ||
| TAC | 0.94 ** | 1.00 ** |
| TPC | 0.93 ** | 0.99 ** |
| DPPH | 0.94 ** | 0.97 ** |
| TEAC | 0.93 ** | 0.98 ** |
© 2020 by the authors. Licensee MDPI, Basel, Switzerland. This article is an open access article distributed under the terms and conditions of the Creative Commons Attribution (CC BY) license (http://creativecommons.org/licenses/by/4.0/).
Share and Cite
Khamphasan, P.; Lomthaisong, K.; Harakotr, B.; Scott, M.P.; Lertrat, K.; Suriharn, B. Effects of Mass Selection on Husk and Cob Color in Five Purple Field Corn Populations Segregating for Purple Husks. Agriculture 2020, 10, 311. https://doi.org/10.3390/agriculture10080311
Khamphasan P, Lomthaisong K, Harakotr B, Scott MP, Lertrat K, Suriharn B. Effects of Mass Selection on Husk and Cob Color in Five Purple Field Corn Populations Segregating for Purple Husks. Agriculture. 2020; 10(8):311. https://doi.org/10.3390/agriculture10080311
Chicago/Turabian StyleKhamphasan, Ponsawan, Khomsorn Lomthaisong, Bhornchai Harakotr, Marvin Paul Scott, Kamol Lertrat, and Bhalang Suriharn. 2020. "Effects of Mass Selection on Husk and Cob Color in Five Purple Field Corn Populations Segregating for Purple Husks" Agriculture 10, no. 8: 311. https://doi.org/10.3390/agriculture10080311
APA StyleKhamphasan, P., Lomthaisong, K., Harakotr, B., Scott, M. P., Lertrat, K., & Suriharn, B. (2020). Effects of Mass Selection on Husk and Cob Color in Five Purple Field Corn Populations Segregating for Purple Husks. Agriculture, 10(8), 311. https://doi.org/10.3390/agriculture10080311