Article

Effect of Water Quality and Date Palm Biochar on Evaporation and Specific Hydrological Characteristics of Sandy Soil

by
Arafat Alkhasha
,
Abdulrasoul Al-Omran
* and
Abdulaziz G. Alghamdi
Soil Science Department, King Saud University, P.O. Box 2460, Riyadh 11451, Saudi Arabia
*
Author to whom correspondence should be addressed.
Agriculture 2020, 10(7), 300; https://doi.org/10.3390/agriculture10070300
Submission received: 17 June 2020 / Revised: 10 July 2020 / Accepted: 14 July 2020 / Published: 15 July 2020
(This article belongs to the Special Issue Effects of Biochar and Compost Amendments on Soil Fertility)

Abstract

:
Experiments were conducted in a soil laboratory using transparent columns (5 and 40 cm in diameter and length, respectively) to evaluate the effects of water quality (i.e., fresh or saline water) with the addition of biochar on soil moisture characteristics. Soil and biochar were gently combined and added into the top 10 cm of each column at a rate of 2%, 4%, 6%, and 8% (w/w). The results show a decrease in cumulative evaporation by 29.27%, 16.47%, 14.17%, and 14.61% with freshwater, and by 21.24%, 12.22%, 21.08%, and 12.67% with saline water for B1, B2, B3, and B4, respectively, compared with unamended soil (B1, B2, B3 and B4 represent the treatments with the biochar rate of 2, 4, 6, and 8%, respectively). Cumulative infiltration was reduced by 34.38%, 43.37%, 58.89%, and 57.07% with freshwater, and by 30.18%, 44.38%, 54.44%, and 49.11% with saline water for B1, B2, B3, and B4, respectively. The infiltration rate was reduced by 32.73%, 42.17%, 57.82%, and 56.85% with freshwater, and 42.09%, 54.61%, 62.68%, and 58.41% with saline water for T1, T2, T3, and T4, respectively, compared with the control. The saturated hydraulic conductivity of B1 decreased significantly by 92.8% and 67.72% with fresh and saline water, respectively. Biochar, as a soil conditioner, could be used in arid conditions with fresh and saline water to enhance the hydrological properties of sandy soils.

1. Introduction

The lack of sufficient freshwater resources in arid regions is becoming a serious problem for sustainable agriculture and, ultimately, meeting human food demands [1,2]. The use of saline or brackish water for irrigation may help meet crops’ water requirements [3,4]. Using saline water for irrigation may lead to a redistribution of salts and a reduction in cumulative infiltration, cumulative evaporation, and hydraulic conductivity [5].
Agbede et al. [6] reported that the application of biochar to sandy soil resulted in an improvement in the soil’s physical properties, such as a decrease in bulk density and an increase in the porosity and moisture content. Chen et al [7] reported that the ability of biochar to decrease the soil hydraulic conductivity and suppress evaporation from soil is evident. They revealed that water retention in soils depends on the properties of the biochar used, as well as particle size and application rate. In most cases, an increase in the application rate of biochar resulted in an increase in soil water content under saturation and field capacity, and a reduction in the evaporation rate in dry conditions. She et al. [8] studied the use of biochar as a soil amendment using saline and non-saline water. They revealed that the addition of biochar improved the soil’s physical properties as it decreased bulk density and increased soil water content at field capacity and permanent wilting point, even at a low use rate of biochar. Wang et al. [9] concluded that the application of biochar enhances the soil’s physical properties, such as increasing soil water content and effectively decreasing soil evaporation. Agbna et al. [10] concluded that the application of biochar significant changed bulk density, in addition to a pH decrease of 27%, which increased tomato yield.
Zhang et al. [11] reported that the effect of the application of biochar to sandy soil was more obvious on hydro-properties such as the retained water content in soil layers. They also reported suppressed evaporation and a decrease in hydraulic conductivity. Ibrahim et al. [12] reported that applying biochar at a dosage of 15 g kg−1 (21.9 t ha−1) to soil at depths of 4–5 cm caused a decrease in waterfront and saturated hydraulic conductivity of sandy loam soils, and an increase in soil water content. Xu et al. [13] reported that water evaporation from soil was effectively reduced by biochar amendments at low rates (5%), whereas applications at a higher rate (15%) increased the evaporation rate. Biochar has been increasingly used to improve saline soils [14] and is known to have a positive effect on soil hydrological processes [15]. Nonetheless, only few studies reported the effects of biochar on the physical properties of soil when using brackish or saline water. Consequently, we aimed to evaluate the effects of water quality (i.e., fresh or saline water) with the addition of biochar on soil moisture characteristics in sandy soils in arid conditions.

2. Materials and Methods

The samples of soil were collected from the research farm of the College of Food and Agriculture Science, Riyadh, Saudi Arabia, King Saud University (KSU, 24°44′13.4″ N, 46°37′06.7″ E). Soil was prepared by drying and sieved using 2 mm sieve. The chemicals characteristics were determined according to standard methodology. Saturated soil paste extract was prepared and electrical conductivity (ECe) was determined using an electrical conductivity meter (test kit model 1500-20, Cole and Parmer, Vernon Hills, IL, USA) at 25 °C. Some cations were measured by titration with (EDTA). Na+ and K+ were determined by flame apparatus (Corning 400, Corning Inc., New York, NY, USA). CO3−2 and HCO3 were determined by titration with acid H2SO4, Cl was determined by titration with silver nitrate, and SO4−2 was determined using the turbidity method. The chemical properties are displayed in Table 1. Physical characteristics of the soil are detailed in Table 2.

2.1. Soil Amendment (Biochar)

Biochar for use as a soil amendment was produced using residuals of date palm that were exposed to sunlight and then separated into small pieces (5–10 cm). The date palm residuals were tightly packed into a cylinder of stainless steel with a volume 0.157 m3. The cylinder was tightly closed and subjected to the temperature of a pyrolysis process, 450 ± 10 °C. The pyrolysis was performed in very low oxygen conditions for 4 h. The properties of the biochar are presented in detail in Table 3, and when mixed with fresh or saline water in Table 4.

2.2. Intermittent Evaporation

Soil columns, clear plastic columns with a volume of 785.4 cm3, were used in this study and were closed off using filter papers and gauze fabric at the bottom. Each column was packed with 883.57 g of soil to 30 cm. Treated biochar (Table 4) was combined with soil and added to the top 10 cm of each column. Columns were located vertically on a wooden holder inside the laboratory; the temperature of the laboratory room was 22 ± 2 °C. We added 25 mL of freshwater (EC 0.73 dS m−1) or saline water (3.6 dS m−1) to the soil columns at every cycle (1 week), with five cycles and three replicates for each treatments. Cumulative evaporation (C.E) was measured daily by weighing every soil column. At the end of the five cycles, each column was divided into 10 sections: four 2.5 cm sections from the top (10 cm) layer of the column and six 5 cm sections from the remainder (30 cm) of the column.

2.3. Experiment of Infiltration

Infiltration was measured by a mini disk infiltrometer with a water capacity of 100 cm3 (model M11, 0.5 cm suction; Decagon Devices, Pullman, WA, USA). The disk infiltrometer was placed in water before use to verify saturation and avoiding interaction with air. The disk infiltrometer was in full contact with the soil surface before we began taking measurements. The volume of water infiltrated was recorded every 30 s to calculate cumulative infiltration based on the Philip equation, shown in Equations (1) and (2):
I = S t ½ +A t,
S ( θ s θ i ) L t 1 2 ,
where I is the cumulative infiltration (cm), S is the sorptivity (cm∙min−0.5), A is a constant related to hydraulic conductivity (cm min−1), t is time (min), θ s saturated water content (cm3 cm3), θ i is the initial water content (cm3 cm−3), and L is the thickness of uniformly wetted soil (cm). The infiltration rate (i) was established by Equation (3):
i = ½ S t −½ +A.

2.4. Hydraulic Conductivity

The saturated hydraulic conductivity (Ks) was determined by recording the volume of outflowing in certain periods using a constant head method. The measurement of hydraulic conductivity of saturated soils in the laboratory was based on Darcy’s equation, and used Equation (4):
K s = V   L A t ( L + h )
where Ks is the saturated hydraulic conductivity, V is the volume of water that exits the bottom of the soil column (mL), L is the length of soil column (cm), A is the cross-sectional area of the soil column (cm−2), t is time (s), and h is the constant head of water (cm).

2.5. Statistical Analysis

All samples were replicated three times, and data were analyzed using a one-way ANOVA. Statistical analysis was conducted by using SPSS (version 18, SPSS Inc., Chicago, IL, USA). The least significant difference (LSD at p < 0.05) test was applied.

3. Results and Discussion

3.1. Intermittent Evaporation
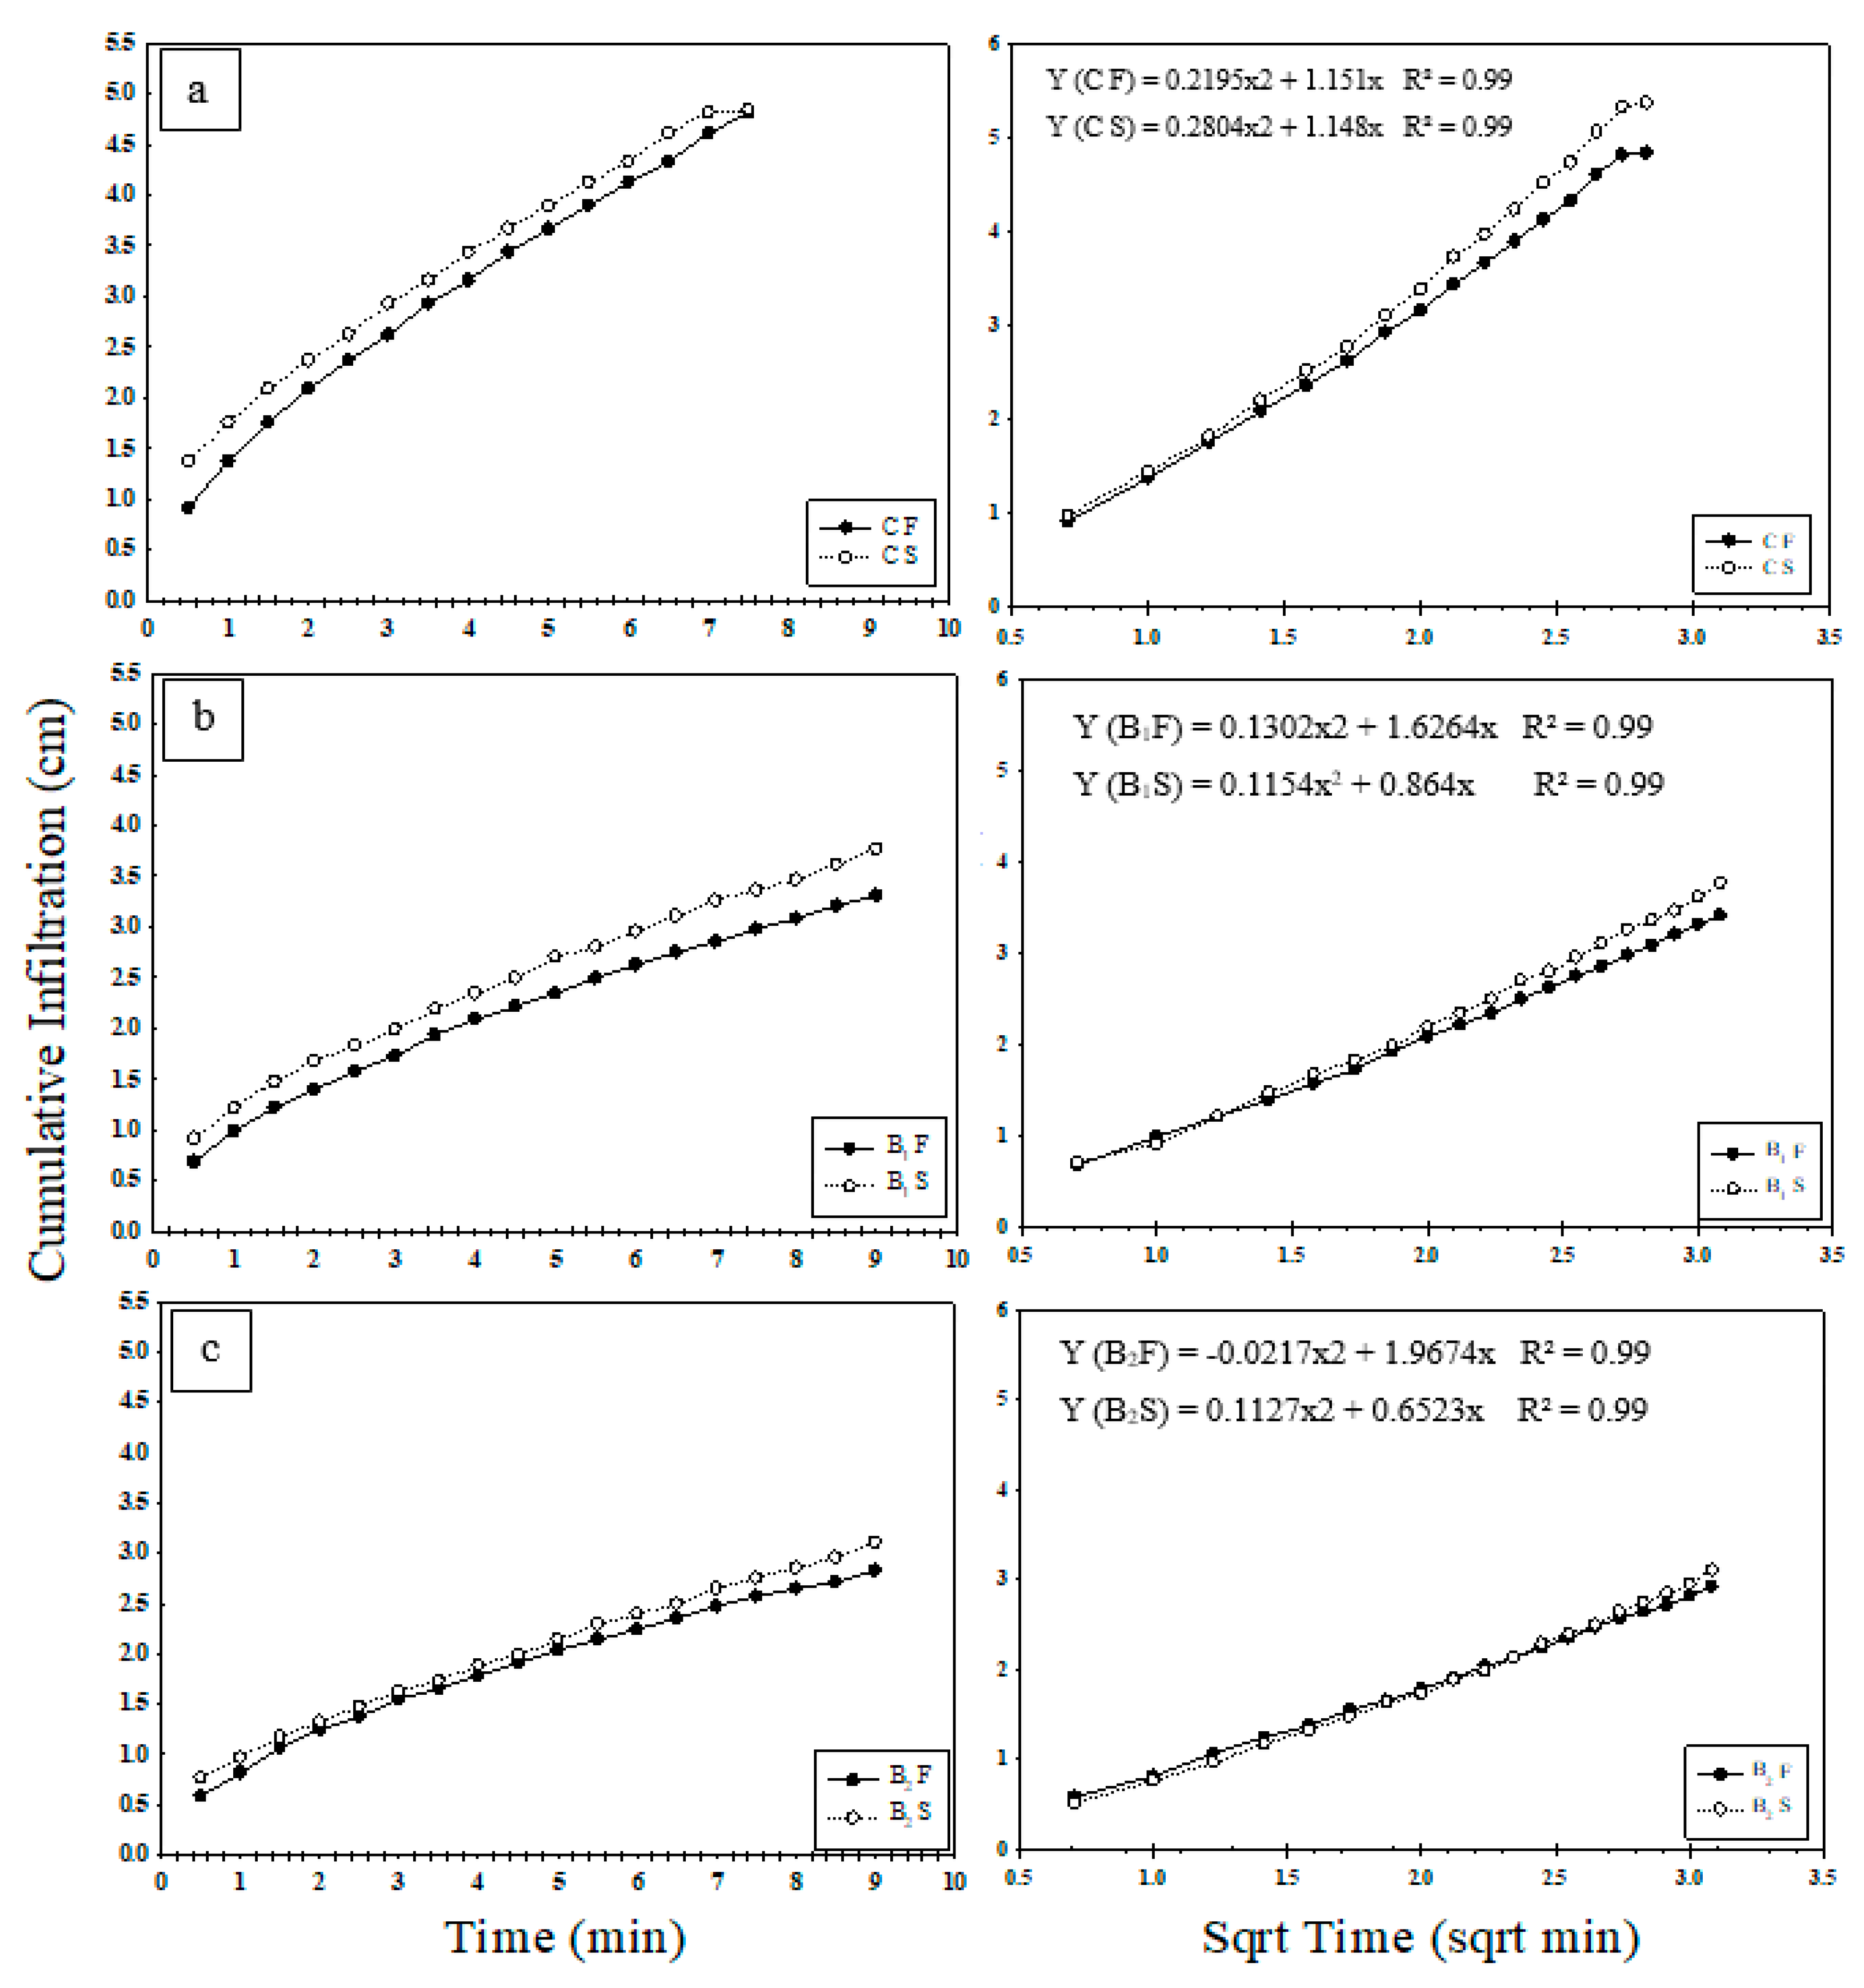
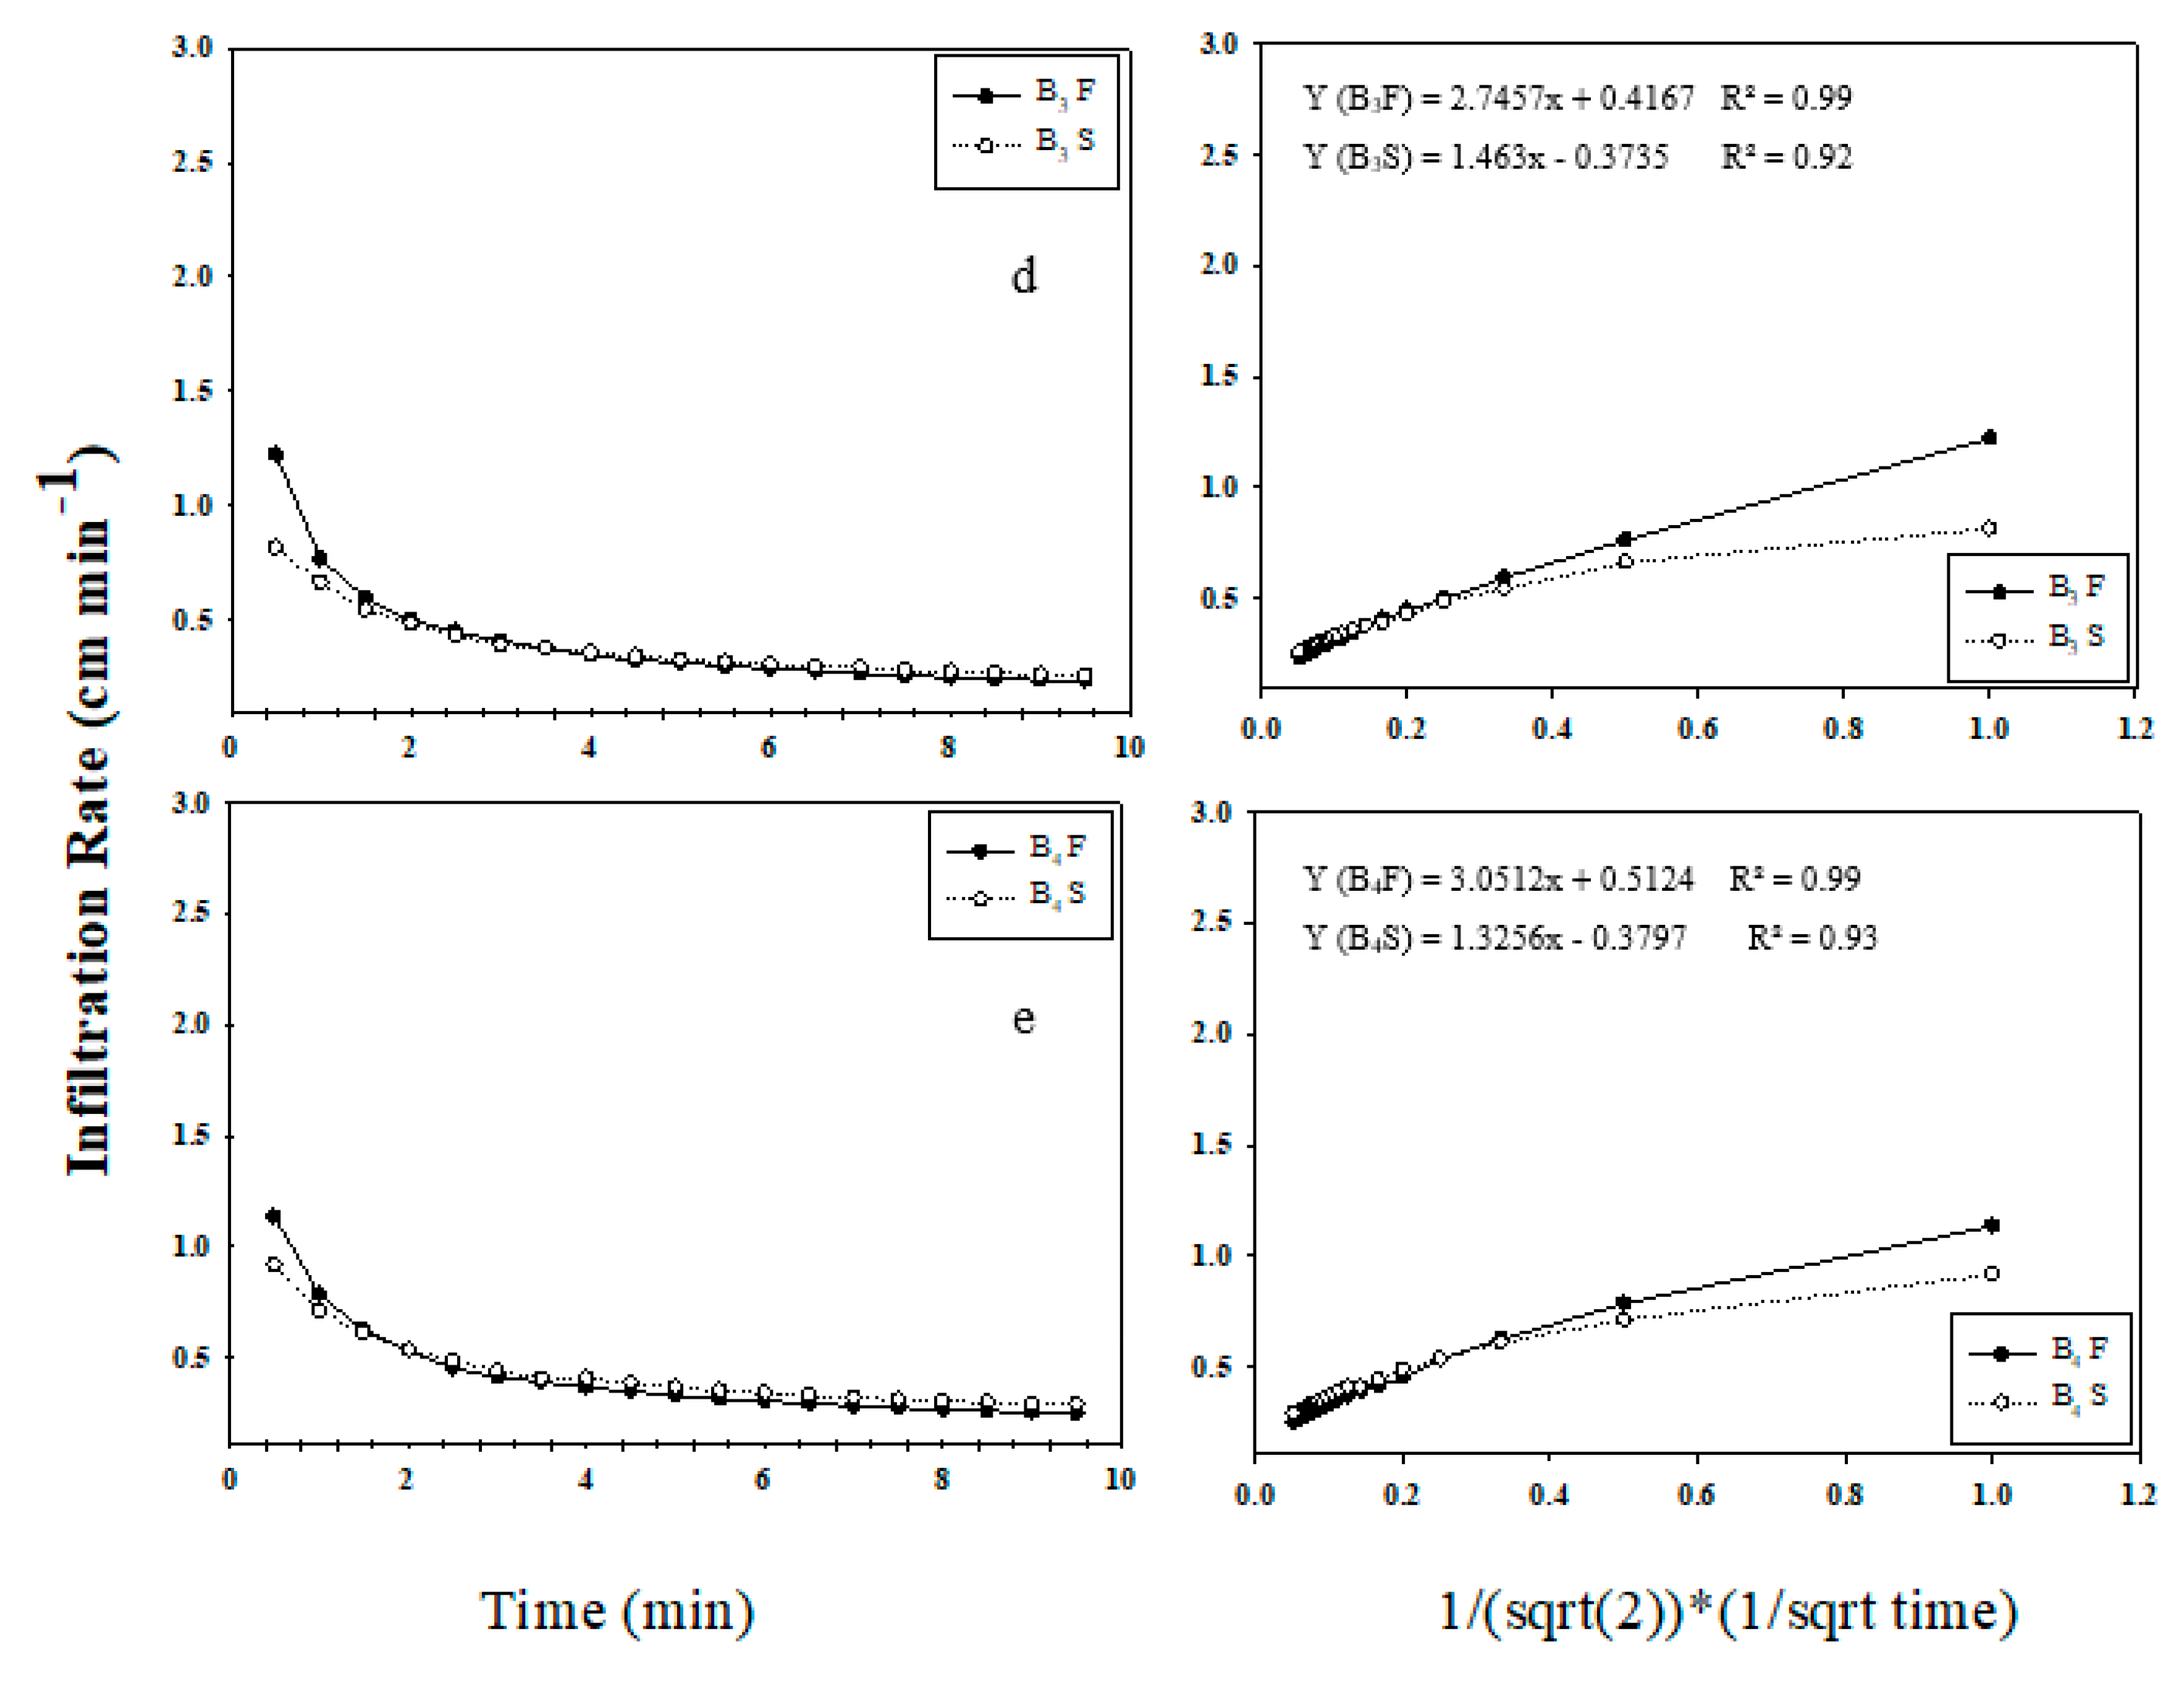
Table 5 shows the results of cumulative evaporation and water retained from the fresh and saline water treatments after five wetting and drying periods. Cumulative added water to each soil column during all cycles was 63.69 mm. The quantity of water retained after the experiments varied between 7.98 and 23.6 mm for freshwater and 10.09 and 23.1 mm for saline water. The application of the soil amendment (biochar) significantly decreased evaporation during the period of the experiment, and the cumulative evaporation (C.E) at the end of the five cycles was reduced by 29.27%, 16.47%, 14.17%, and 14.61% for B1, B2, B3, and B4, respectively, using freshwater, compared with unamended soil. Application of biochar at a rate of 2% (B1) created a lower C.E than other rates of biochar treatment. Increasing the biochar application rate to 8% led to greatly increased C.E. This may be due to the micro-sized particles in biochar closing the macropores of the soil, causing water to accumulate on the top of column before evaporating from the surface. This trend was also observed with saline water for all biochar treatments, where C.E decreased by 21.24%, 12.22%, 21.08%, and 12.67% for B1, B2, B3, and B4, respectively, compared with unamended soil. The decrease in C.E at the end of the five wetting and drying cycles with added biochar was more evident for columns irrigated with saline water than freshwater, which may be related to the concentration of salt in the saline, because salt restricts the movement of water. The decrease of water is observable in Figure 1. The highest C.E and lowest water retention were observed in the control with both fresh and saline water.
The results demonstrated that using biochar as a soil amendment in sandy-textured soil lowers the evaporation under laboratory conditions. The addition of biochar could improve the capacity of soil to retain water, resulting in higher suppression of water. This finding is consistent with other reports on the addition of biochar [16,17,18]. Ibrahim et al. [12] reported that cumulative evaporation was reduced by 13.3–21.2% for soil that was treated with Conocarpus residual as biochar, and the quantity of water conserved increased by 6.3%. Conversely, the C.E decreased on average across all cycles for columns with saline water by 10.93%, 5.57%, 20.63%, and 8.47% for the control, B2, B3, and B4, respectively, when compared with their freshwater counterparts. The C.E for B1 was slightly higher with freshwater than the saline water. The results indicated that, overall, the use of biochar as a soil amendment material for coarse soil could have a positive effect on water conservation in an arid region.

3.2. Infiltration

Figure 2a–e illustrate cumulative infiltration (C.I; cm) for sandy soil as influenced by biochar application with both fresh and saline water. The C.I decreased with increasing biochar application rates. The percentage decrease for freshwater was by 34.38%, 43.37%, 58.89%, and 57.07% for B1, B2, B3, and B4, respectively, compared with the control. The C.I for saline water was reduced by 30.18%, 44.38%, 54.44%, and 49.11% for B1, B2, B3, and B4, respectively, compared with the control. The impact on infiltration rate is illustrated in Figure 3a–e, which show a decrease with freshwater by 32.73%, 42.17%, 57.82%, and 56.85% for B1, B2, B3, and B4, respectively, compared with the control. The infiltration rate reductions for saline water were 42.09%, 54.61%, 62.68%, and 58.41%, for B1, B2, B3, and B4, respectively, compared with the control. These results indicated that the application of biochar could restrict (conserve) water movement in soil. Thus, soil amended with biochar needed more time to advance in the columns as the application rate increased from 2% to 8%. Decreased infiltration rates were observed for columns with higher quantities of biochar (6% and 8%). This could be due to a fine particle aggregate of biochar within the soil pores, which blocked them and decreased infiltration [16,19,20]. As such, the addition of biochar to coarse-textured soil was found to reduce water loss by deep percolation and maintain soil moisture, increasing water availability to plants [12,21].

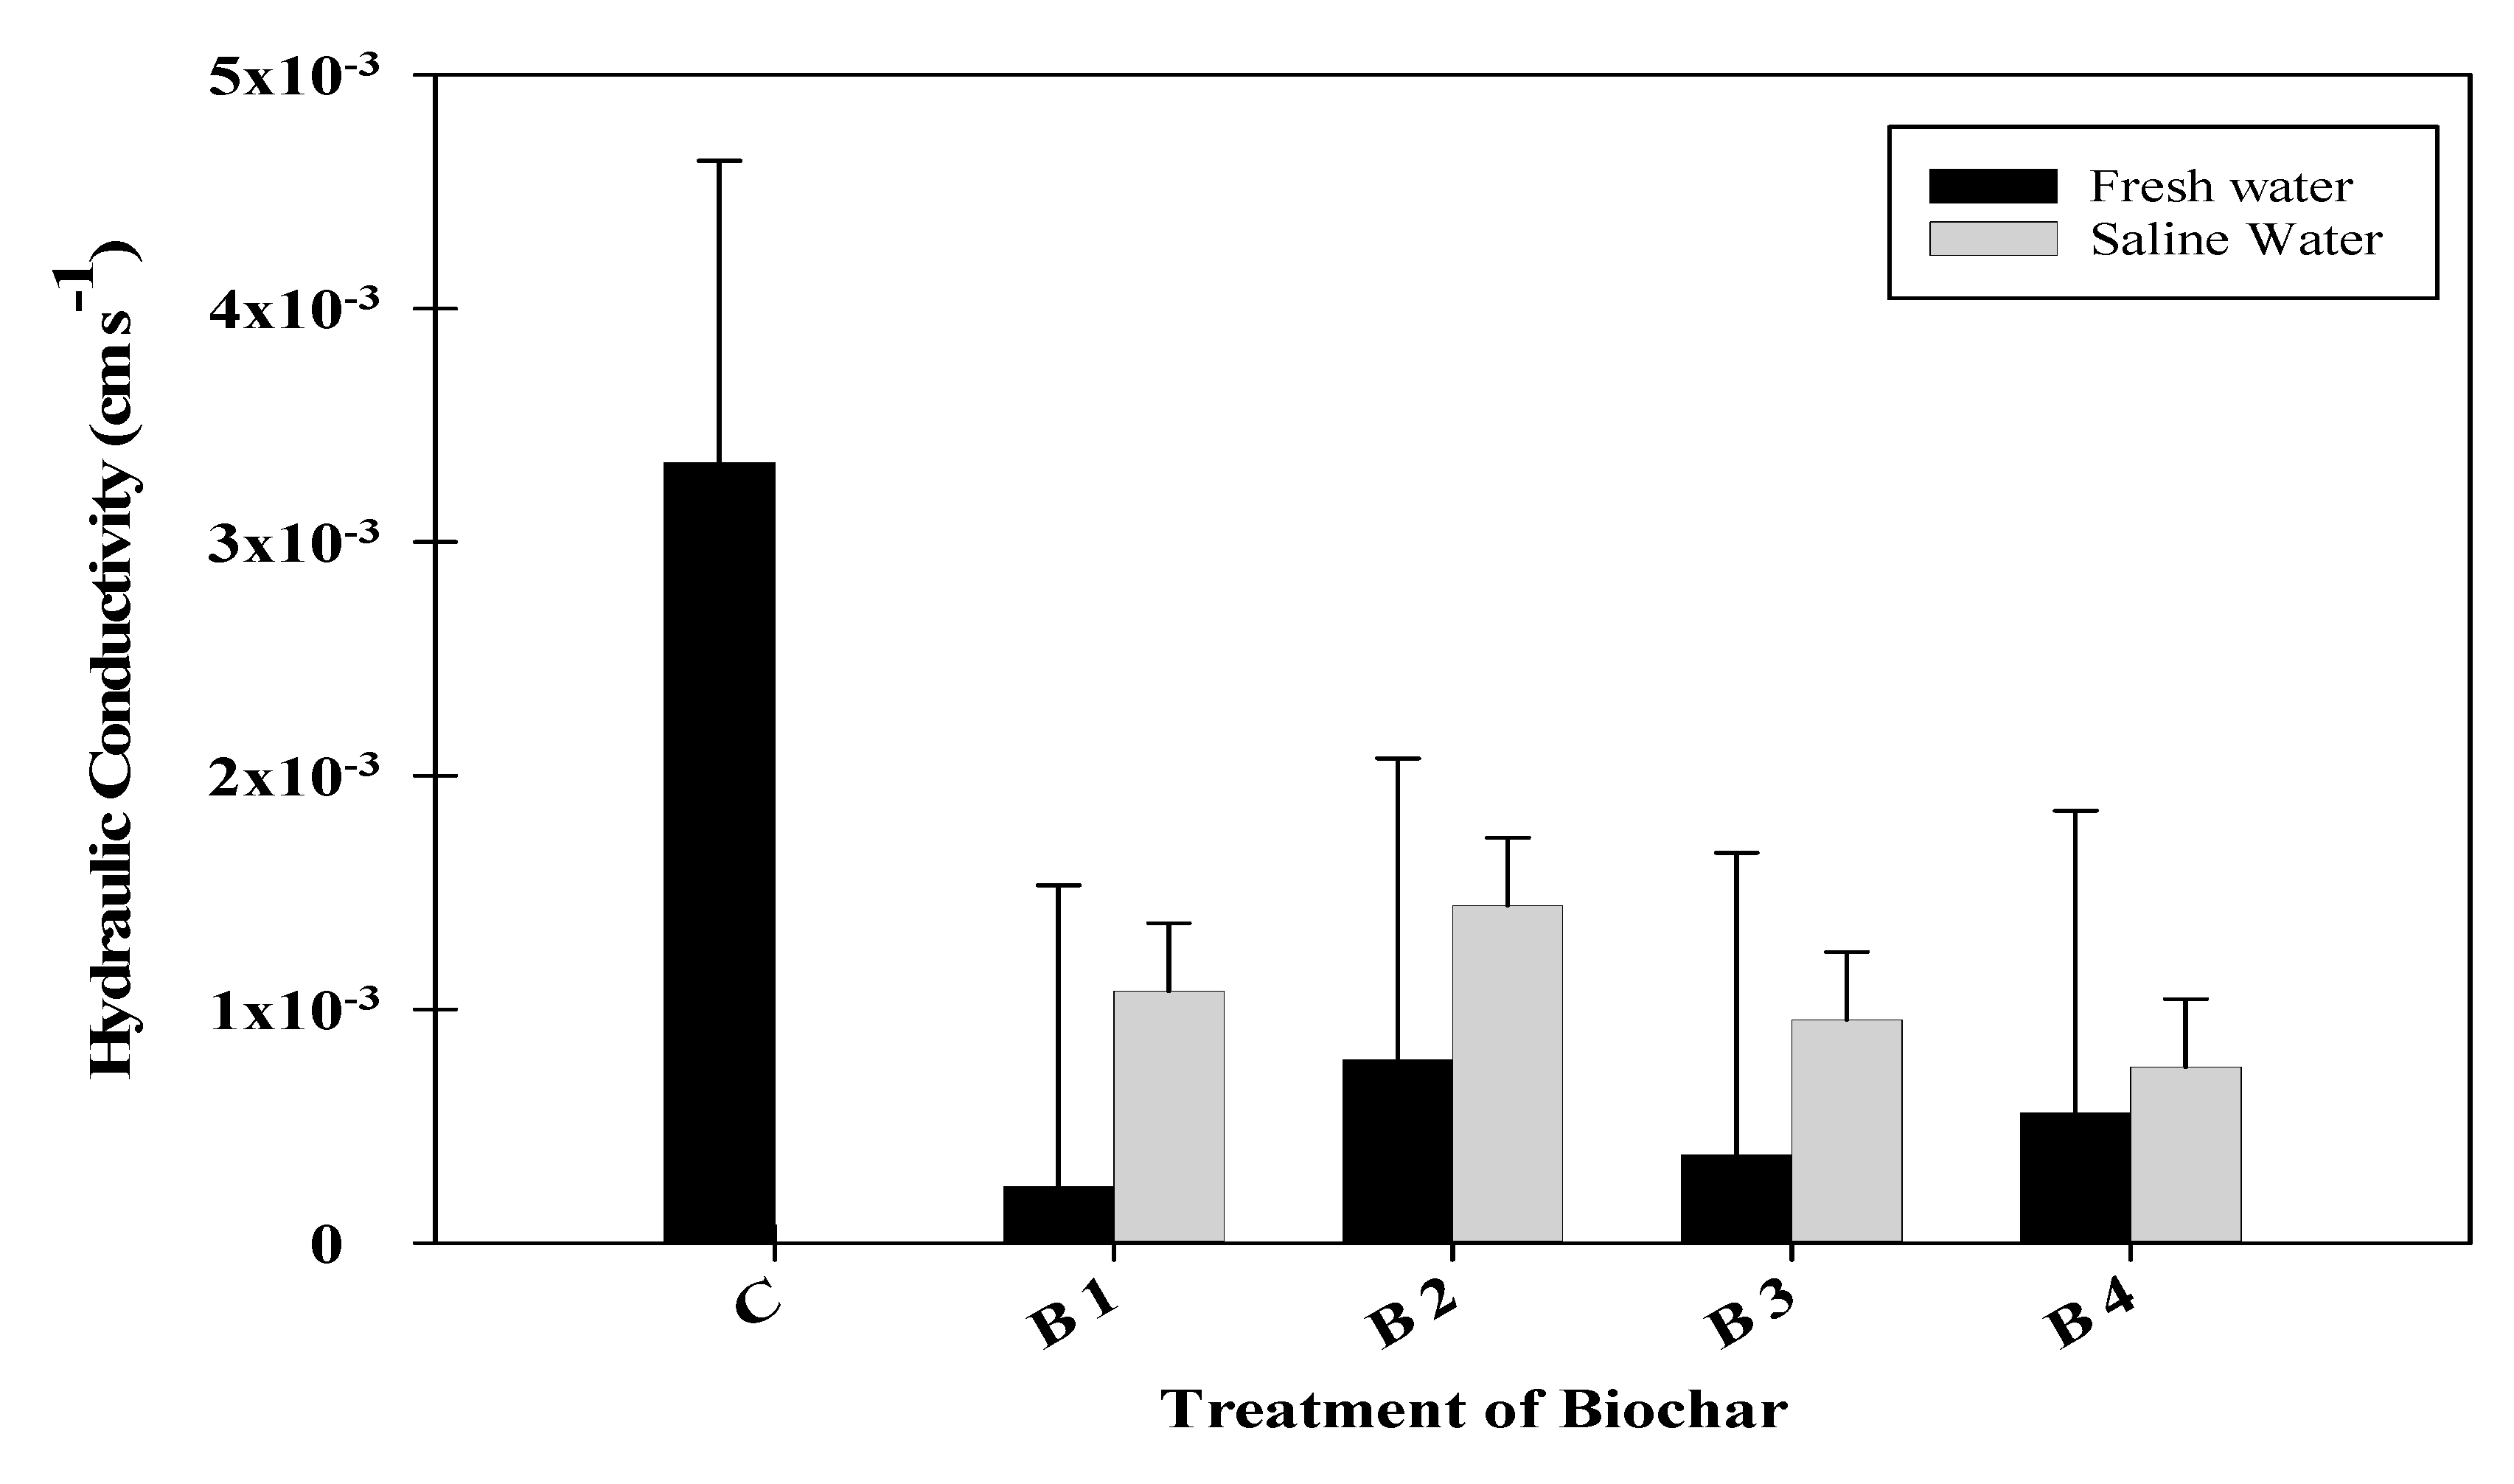
3.3. Saturated Hydraulic Conductivity

The combination of biochar with both fresh and saline water resulted in a decrease in saturated hydraulic conductivity, compared with unamended soil. This decrease was more apparent when freshwater was used as source of irrigation for all doses of biochar. Figure 4 shows saturated hydraulic conductivity (Ks). Hydraulic conductivity decreased significantly, by 92.8%, for B1 with freshwater, compared with the control. However, it was reduced by 67.72% for B1 with saline water irrigation. In addition, Ks decreased by 76.59%, 88.67%, and 83.30% for B2, B3, and B4, respectively, compared with unamended soil. The Ks decreased with saline water irrigation by 56.79%, 71.41%, and 77.44% for B2, B3, and B4, respectively, compared with the control. In general, Ks reduced greatly with biochar-amended soil. This may be related to the blocking of large pores by fine particles of the biochar [22]. Hydraulic conductivity increased with saline water more than freshwater because the salt concentration resulted in increased viscosity and mass density of the solution [23]. Our results are consistent with past results [24], which concluded that adding biochar to soil decreases Ks for sandy loams and organic soils by 92% and 67%, respectively. Ks was found to increase by 328% for clay soils [17,25,26].

4. Conclusions

Soil column experiments were conducted to investigate the impact of date palm biochar on intermittent evaporation, hydraulic conductivity (Ks), cumulative infiltration, and infiltration rate. The results displayed that C.E reduced by 18.63% with freshwater and by 16.8% with saline water, on average, compared with the unamended soil. C.I and infiltration rates were reduced by 48.42% with freshwater and by 44.52% with saline water, on average. Infiltration rates decreased for treatments with both types of water. There was evidence of decreasing Ks in soil column B1 (20 g kg−1) for both water types, but this decrease was more pronounced with freshwater.

Author Contributions

Data collection, A.A., analysis, A.A.-O. and A.G.A., writing—original draft preparation, A.A., writing—review and editing, A.A.-O., resources, A.G.A., supervision, A.A.-O. All authors have read and agreed to the published version of the manuscript.

Funding

This research received no external funding.

Acknowledgments

The authors sincerely thank King Saud University, Deanship of Scientific Research, College of Food and Agricultural Sciences Research Centre for supporting this work. The authors also thank the Deanship of Scientific Research and RSSU at King Saud University for their technical support.

Conflicts of Interest

The authors declare no conflicts of interest.

References

  1. Qadir, M.; Oster, J.D. Crop and irrigation management strategies for saline-sodic soils and waters aimed at environmentally sustainable agriculture. Sci. Tot. Environ. 2004, 323, 1–19. [Google Scholar] [CrossRef] [PubMed]
  2. Chartzoulakis, K.S. Salinity and olive: Growth, salt tolerance, photosynthesis and yield. Agric. Water Manag. 2005, 78, 108–121. [Google Scholar] [CrossRef]
  3. Kang, Y.; Chen, M.; Wan, S. Effects of drip irrigation with saline water on waxy maize (Zea mays L. var. ceratina Kulesh) in North China Plain. Agric. Water Manag. 2010, 97, 1303–1309. [Google Scholar] [CrossRef]
  4. Li, C.; Lei, J.; Zhao, Y.; Xu, X.; Li, S. Effect of saline water irrigation on soil development and plant growth in the Taklimakan Desert Highway shelterbelt. Soil Tillage Res. 2015, 146, 99–107. [Google Scholar] [CrossRef]
  5. Ju, Z.; Du, Z.; Guo, K.; Liu, X. Irrigation with freezing saline water for 6 years alters salt ion distribution within soil aggregates. J. Soil Sediment. 2019, 19, 97–105. [Google Scholar] [CrossRef]
  6. Agbede, T.M.; Odoja, A.S.; Bayode, L.N.; Omotehinse, P.O.; Adepehin, I. Effects of biochar and poultry manure on soil properties, growth, yield and quality of cocoyam (Xanthosoma sagittifolium Schott) grown in sandy soil. Commun. Soil Sci. Plant Anal. 2020, 51, 932–947. [Google Scholar] [CrossRef]
  7. Chen, C.; Wang, R.; Shang, J.; Liu, K.; Irshad, M.K.; Hu, K.; Arthur, E. Effect of biochar application on hydraulic properties of sandy soil under dry and wet conditions. Vadose Zone J. 2018, 17, 180101. [Google Scholar] [CrossRef] [Green Version]
  8. She, D.; Sun, X.; Gamareldawla, A.H.D.; Nazar, E.A.; Hu, W.; Edith, K.; Yu, S. Benefits of soil biochar amendments to tomato growth under saline water irrigation. Sci. Rep. 2018, 8, 14743. [Google Scholar] [CrossRef]
  9. Wang, T.; Stewart, C.E.; Sun, C.; Wang, Y.; Zheng, J. Effects of biochar addition on evaporation in the five typical Loess Plateau soils. Catena 2018, 162, 29–39. [Google Scholar] [CrossRef]
  10. Agbna, H.D.; Ali, G.; Albashir, E.; Mohammed, M.; Bakir, M.; Osman, A.; Elshaikh, A. Effect of biochar on some soil properties and tomato growth under saline water conditions. Int. J. Sci. Eng. Res. 2017, 8, 24–28. [Google Scholar]
  11. Zhang, J.; Chen, Q.; You, C. Biochar effect on water evaporation and hydraulic conductivity in sandy soil. Pedosphere 2016, 26, 265–272. [Google Scholar] [CrossRef]
  12. Ibrahim, A.; Usman, A.R.A.; Al-Wabel, M.I.; Nadeem, M.; Ok, Y.S.; Al-Omran, A. Effects of conocarpus biochar on hydraulic properties of calcareous sandy soil: Influence of particle size and application depth. Arch. Agron. Soil Sci. 2017, 63, 185–197. [Google Scholar] [CrossRef]
  13. Xu, J.; Niu, W.Q.; Zhang, M.Z.; Li, Y.; Lyu, W.; Li, K.Y.; Liang, B.H. Effect of biochar addition on soil evaporation. J. Appl. Ecol. 2016, 27, 3505–3513. [Google Scholar]
  14. Saifullah, D.S.; Naeem, A.; Rengel, Z.; Naidu, R. Biochar application for the remediation of salt-affected soils: Challenges and opportunities. Sci. Total Environ. 2018, 625, 320–335. [Google Scholar] [CrossRef]
  15. Sun, J.; Yang, R.; Li, W.; Pan, Y.; Zheng, M.; Zhang, Z. Effect of biochar amendment on water infiltration in a coastal saline soil. J. Soil Sediments 2018, 18, 3271–3279. [Google Scholar] [CrossRef]
  16. Al-Omran, A.; Ibrahim, A.; Alharbi, A. Evaluating the impact of combined application of biochar and compost on hydro-physical properties of loamy sand soil. Commun. Soil Sci. Plant Anal. 2019, 50, 2442–2456. [Google Scholar] [CrossRef]
  17. Herath, H.M.S.K.; Camps-Arbestain, M.; Hedley, M. Effect of biochar on soil physical properties in two contrasting soils: An Alfisol and an Andisol. Geoderma 2013, 209, 188–197. [Google Scholar] [CrossRef]
  18. Ibrahim, H.M.; Al-Wabel, M.I.; Usman, A.R.; Al-Omran, A. Effect of Conocarpus biochar application on the hydraulic properties of a sandy loam soil. Soil Sci. 2013, 178, 165–173. [Google Scholar] [CrossRef]
  19. Mukherjee, A.; Lal, R.; Zimmerman, A.R. Effects of biochar and other amendments on the physical properties and greenhouse gas emissions of an artificially degraded soil. Sci. Total Environ. 2014, 487, 26–36. [Google Scholar] [CrossRef]
  20. George, C.; Wagner, M.; Kücke, M.; Rillig, M.C. Divergent consequences of hydrochar in the plant–soil system: Arbuscular mycorrhiza, nodulation, plant growth and soil aggregation effects. Appl. Soil Ecol. 2012, 59, 68–72. [Google Scholar] [CrossRef]
  21. Busscher, H.J.; Rinastiti, M.; Siswomihardjo, W.; van der Mei, H.C. Biofilm formation on dental restorative and implant materials. J. Dent. Res. 2010, 89, 657–665. [Google Scholar] [CrossRef] [PubMed]
  22. Jačka, L.; Trakal, L.; Ouředníček, P.; Pohořelý, M.; Šípek, V. Biochar presence in soil significantly decreased saturated hydraulic conductivity due to swelling. Soil Tillage Res. 2018, 184, 181–185. [Google Scholar] [CrossRef]
  23. Fatahi, B.; Khabbaz, M.H.; Basack, S. Effects of salinity and sand content on liquid limit and hydraulic conductivity. Aust. Geomech. J. 2011, 46, 67–76. [Google Scholar]
  24. Villagra-Mendoza, K.; Horn, R. Effect of biochar addition on hydraulic functions of two textural soils. Geoderma 2018, 326, 88–95. [Google Scholar] [CrossRef]
  25. Barnes, R.T.; Gallagher, M.E.; Masiello, C.A.; Liu, Z.; Dugan, B. Biochar-induced changes in soil hydraulic conductivity and dissolved nutrient fluxes constrained by laboratory experiments. PLoS ONE 2014, 9, e108340. [Google Scholar] [CrossRef] [PubMed] [Green Version]
  26. Brockhoff, S.R.; Christians, N.E.; Killorn, R.J.; Horton, R.; Davis, D.D. Physical and mineral-nutrition properties of sand-based turfgrass root zones amended with biochar. Agron. J. 2010, 102, 1627–1631. [Google Scholar] [CrossRef]
Figure 1. Effect of biochar application on C.E. C denotes the control soil and B denotes the soil with biochar 1, 2, 3, and 4 application rates. F and S denote fresh and saline water, respectively.
Agriculture 10 00300 g001
Figure 2. (ae) Effects of soil conditioners(biochar) applications on C.I. C denotes the control soil and B denotes the soil with biochar application rates of 1, 2, 3, and 4. F and S denote fresh and saline water, respectively.
Agriculture 10 00300 g002aAgriculture 10 00300 g002b
Figure 3. (ae) Effect of soil conditioners (biochar) application on infiltration rate. C denotes the control soil and B denotes the soil with biochar application rates of 1, 2, 3, and 4. F and S denote fresh and saline water, respectively.
Agriculture 10 00300 g003aAgriculture 10 00300 g003b
Figure 4. Effect of biochar application on hydraulic conductivity.
Agriculture 10 00300 g004
Table 1. Chemicals properties of the soil and water.
Depth (cm)pHECe (dS m1)Cations (mEq L1)Anions (mEq L1)SAR
Ca+2Mg+2Na+K+CO3−2HCO3Cl
0–307.462.8114.59.152.781.8850.11518.87.950.795
30–607.441.978.456.23.510.970.05713.056.851.26
Freshwater 7.10.94.22.47.30.13027.24.02
Saline water 7.523.62.82.232.040.2902.8631.2920.26
ECe—Electrical conductivity of soil paste extract, SAR—Sodium adsorption ratio.
Table 2. Physical properties of the soil used in the experiment.
Depth (cm)Bulk Density (g cm−3)Field Capacity (%)Wilting Point (%)Hydraulic Conductivity (cm Day−1)Texture
0–151.6114.493.51105.12Loamy sand
15–301.6413.21.99501.2Sand
Table 3. Physical and chemical properties of the biochar.
ParameterValueUnitsParameterValueUnits
pH8.92-K0.87%
Electrical conductivity
(1:25)
3.96dS m−1Ca5.63%
Organic matter (OM)30.32%C/N ratio250:1-
Organic carbon (OC)60%Moisture3.53%
H3.44%Mobile material22.82%
N0.24%Ash25.7%
P0.22%Resident material47.95%
Surface area237.8m2 g−1Bulk density0.33g cm−3
Table 4. Soil column treatments using fresh or saline water.
No.TreatmentApplication Rate
1B12% (20 g kg−1)
2B24% (40 g kg−1)
3B36% (60 g kg−1)
4B48% (80 g kg−1)
Additional to the control, replications were R1, R2, and R3.
Table 5. Evaporation and water retention after wetting and drying cycles for fresh and saline water treatments.
Water QualityTreatmentAdded Water (mm)Evaporation (mm)Cumulative Evaporation (mm)Water Retained (mm)Recovery (%)
Week 1Week 2Week 3Week 4Week 5
FreshwaterControl63.695.998.812.4513.8313.8354.97.9898.72
B163.694.366.899.69.638.3638.8323.698.02
B263.695.047.5611.0211.910.3345.8616.698.06
B363.694.77.4610.9512.1711.8547.1215.698.47
B463.695.357.9111.0512.1810.3946.8815.898.41
LSD(0.05)-0.2890.2890.0340.5770.1881.760.275-
Saline waterControl63.695.348.2510.2911.7813.8349.4910.0993.54
B163.694.416.297.128.2212.9438.9823.197.46
B263.695.448.089.1910.4010.3343.4418.997.88
B363.695.516.678.117.5511.2239.0622.5396.68
B463.695.457.248.1510.0112.3743.2219.1697.91
LSD(0.05)-0.1510.1710.1910.6590.0461.960.319-

