Article

RobHortic: A Field Robot to Detect Pests and Diseases in Horticultural Crops by Proximal Sensing

1
Centro de Agroingeniería, Instituto Valenciano de Investigaciones Agrarias (IVIA), 7–46113 Valencia, Spain
2
Centro de Protección Vegetal y Biotecnología, Instituto Valenciano de Investigaciones Agrarias (IVIA), 7–46113 Valencia, Spain
3
Departamento de Ingeniería Gráfica, Universitat Politècnica de València (UPV). Camino de Vera, 46022 Valencia, Spain
*
Author to whom correspondence should be addressed.
Agriculture 2020, 10(7), 276; https://doi.org/10.3390/agriculture10070276
Submission received: 2 June 2020 / Revised: 1 July 2020 / Accepted: 3 July 2020 / Published: 7 July 2020

Abstract

:
RobHortic is a remote-controlled field robot that has been developed for inspecting the presence of pests and diseases in horticultural crops using proximal sensing. The robot is equipped with colour, multispectral, and hyperspectral (400–1000 nm) cameras, located looking at the ground (towards the plants). To prevent the negative influence of direct sunlight, the scene was illuminated by four halogen lamps and protected from natural light using a tarp. A GNSS (Global Navigation Satellite System) was used to geolocate the images of the field. All sensors were connected to an on-board industrial computer. The software developed specifically for this application captured the signal from an encoder, which was connected to the motor, to synchronise the acquisition of the images with the advance of the robot. Upon receiving the signal, the cameras are triggered, and the captured images are stored along with the GNSS data. The robot has been developed and tested over three campaigns in carrot fields for the detection of plants infected with ‘Candidatus Liberibacter solanacearum’. The first two years were spent creating and tuning the robot and sensors, and data capture and geolocation were tested. In the third year, tests were carried out to detect asymptomatic infected plants. As a reference, plants were analysed by molecular analysis using a specific real-time Polymerase Chain Reaction (PCR), to determine the presence of the target bacterium and compare the results with the data obtained by the robot. Both laboratory and field tests were done. The highest match was obtained using Partial Least Squares-Discriminant Analysis PLS-DA, with a 66.4% detection rate for images obtained in the laboratory and 59.8% for images obtained in the field.

1. Introduction

‘Candidatus Liberibacter solanacearum’ (CaLsol) is a bacterium limited to the phloem of plants and haemolymph of insect vectors that is associated with zebra chip disease in potato and vegetal disorders in Apiaceae [1]. Although transmission of the disease occurs mainly by psyllid insect vectors, it can also occur by grafts or seeds [2,3]. In Europe, this pest is causing damage mainly in carrot crops, but also in potatoes, celery, parsnips, parsley, or fennel [4]. In Spain, the damage is caused mainly in carrot crops.
The most commonly associated symptoms in affected plants are wrinkled leaves, generalised chlorosis, purple discolouration, and stunted root growth. However, the symptoms can be confused with those caused by other bacterial pathogens, such as ‘Candidatus Phytoplasma asteris’ or Spiroplasma citri [5]. In some cases, while the roots are affected, the aerial part of the plant remains asymptomatic, making visual detection difficult. Therefore, frequent sampling and laboratory analysis are necessary to determine the presence of the bacterial pathogen in the plants, which is laborious and expensive for large areas of the crop.
The use of remote spectral sensors to monitor crops can help in this regard to study large areas of land with high resolution to detect plant diseases [6]. These techniques can be performed at different scales, depending on the area to be monitored and the spatial and spectral resolution needed [7]. On a large scale, the use of spectral data provided by satellites has been used for several decades, offering a large amount of spectral information but with little spatial resolution. On the other hand, unmanned aerial vehicles (UAVs) are becoming increasingly popular for rapid crop-level monitoring at any time. At the plant and leaf levels, spectral information can be gathered at high spatio-temporal resolution using manual sensors or mounted on agricultural vehicles [8] or fleets of autonomous robots [9].
Autonomous robot navigation in orchards and in the open field is challenging because it relies on guidance systems that must be very accurate in changing, unstructured environments, and very different crops and production systems. [10]. Navigation of robots on rough and uneven terrain or in different weather conditions makes the navigation of agricultural robots even more challenging [11], which means that the navigation algorithms have to adapt to identify specific features of the target crop [12].
Ladybird is a fairly advanced farm robot capable of performing various inspections and mapping tasks using laser and hyperspectral scanning. It moves autonomously by following Global Navigation Satellite System (GNSS) waypoints corrected by real-time kinematic (RTK) and 4G [13]. Shrimp [14] is a flexible general-purpose robotic data collection platform equipped with different types of cameras and radio detection and ranging (RADAR) and Laser Imaging Detection and Ranging (LiDAR) sensors. However, many of the developments have been made for vineyards due to the added value of the crop, the homogeneity of the terrain, and the ease of mechanising this crop. VineRobot [15] is also an autonomous robot capable of moving around vineyards using stereoscopic imaging. VinBot [16] is another all-terrain robot equipped with sensors for image acquisition and three-dimensional (3D) data collection in vineyards. GRAPE [17] is a ground robot also designed to monitor vineyards and estimate plant health.
When the robot must work in different crops or growth phases, autonomous navigation becomes more difficult. For example, in carrot crops, the crop rows are well identified at the beginning of the season when the plants are young, but as the plants grow, they mix and the rows are no longer clear, making autonomous driving difficult. In these cases, teleoperation is a good alternative, like the case of XF-ROVIM, a remotely driven sensing robot to inspect olive crops [18]. Adamides et al. [19] developed a robot that was remotely operated for spraying purposes, while another similar scouting teleoperated robot was used by Kurtser et al. [20] for yield estimation in grapes using a red, green, blue, depth (RGB-D) sensor. On the other hand, Blasco et al. [21] presented one of the first agricultural robots aimed at weed detection and eradication. This work aims to create a field robot equipped with spectral sensors as a new tool for monitoring horticultural crops and early detection of diseases. It has been applied to the detection of asymptomatic carrot plants infected with CaLsol.

2. Materials and Methods

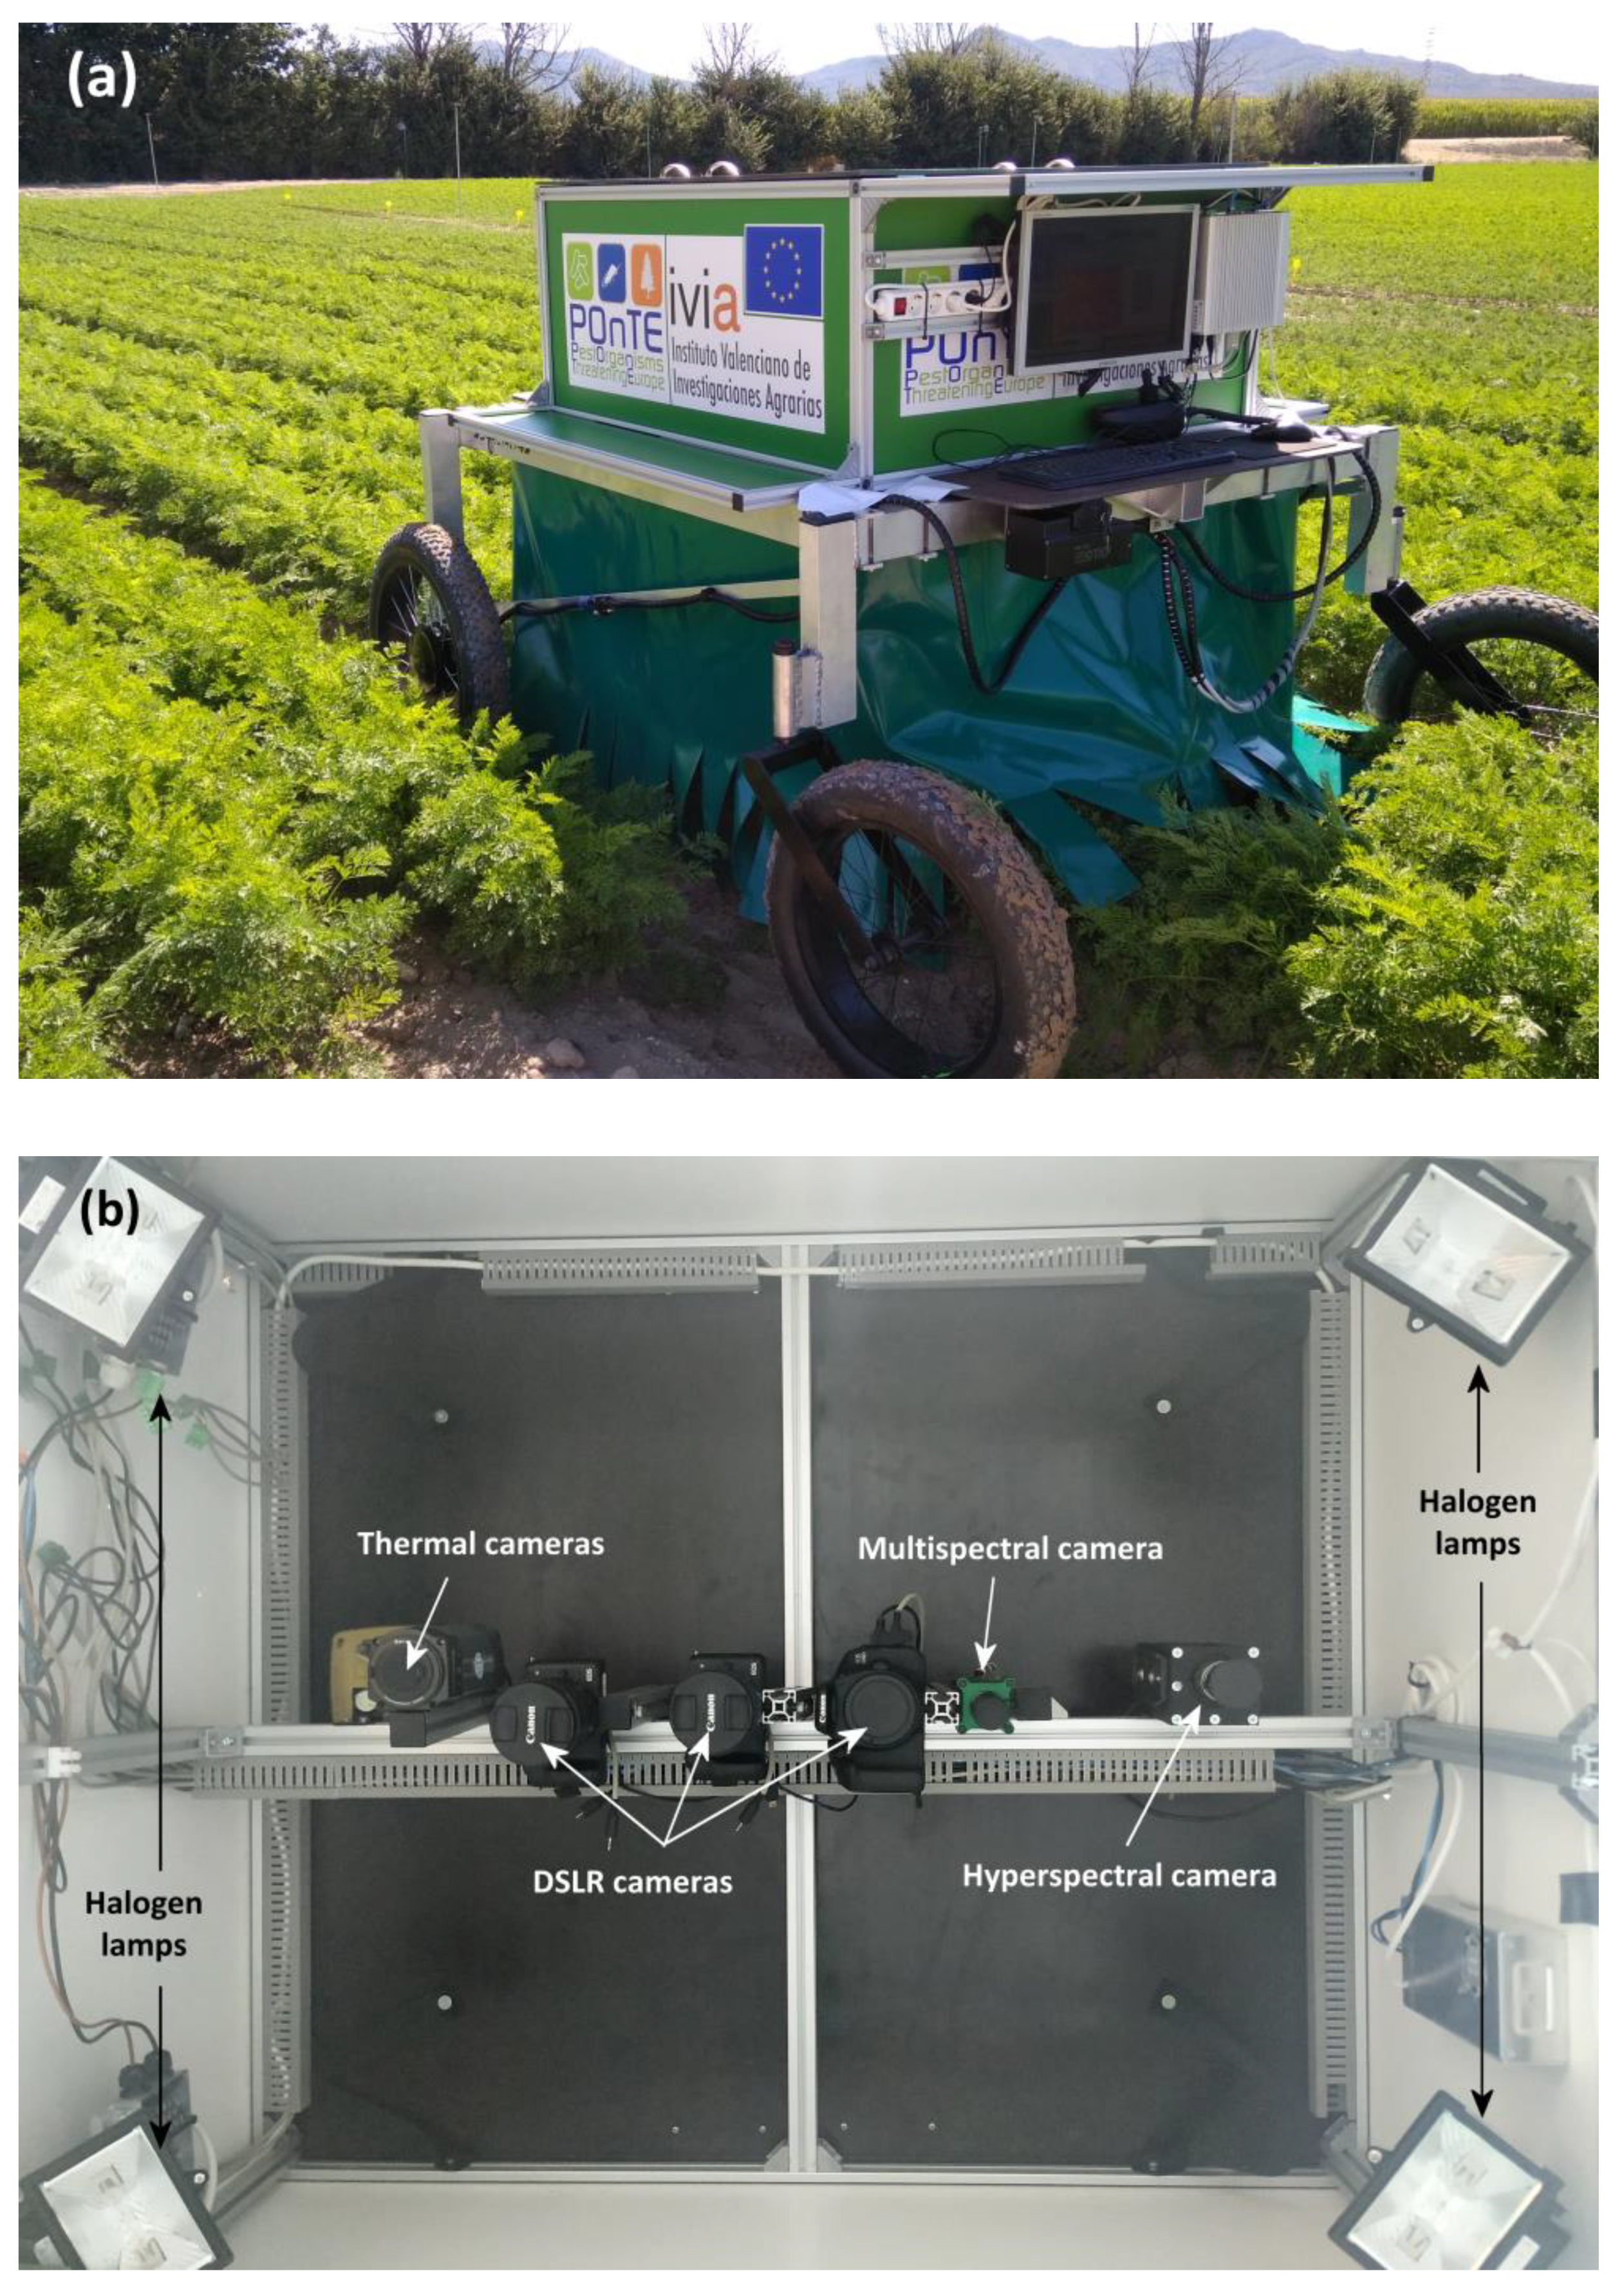
2.1. Robotic Platform and Onboard Equipment
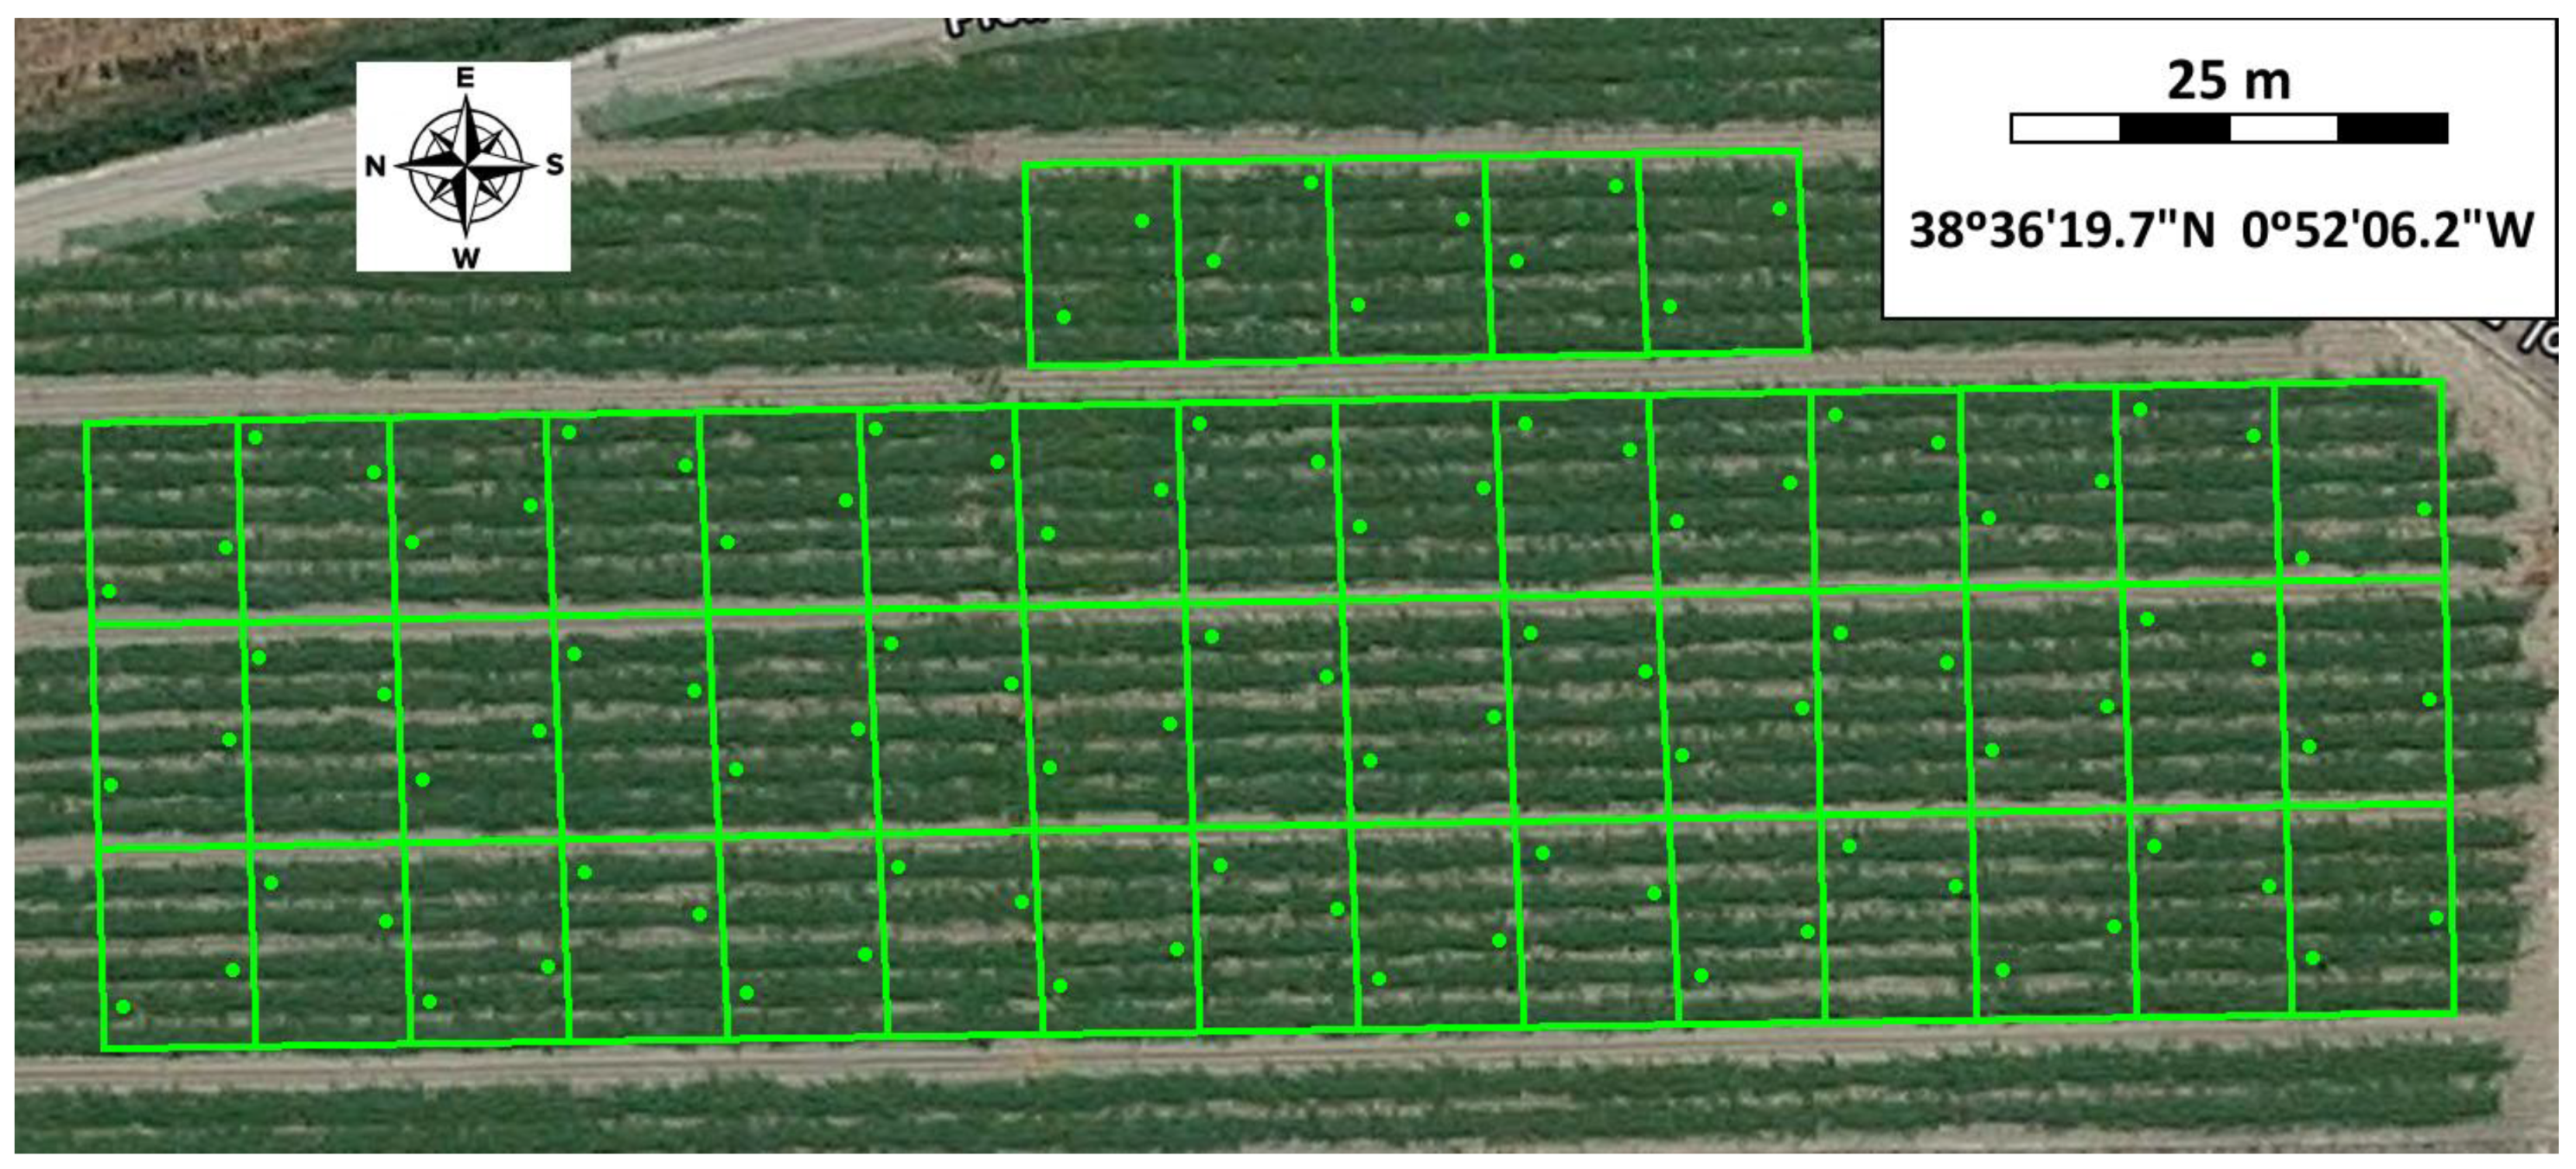
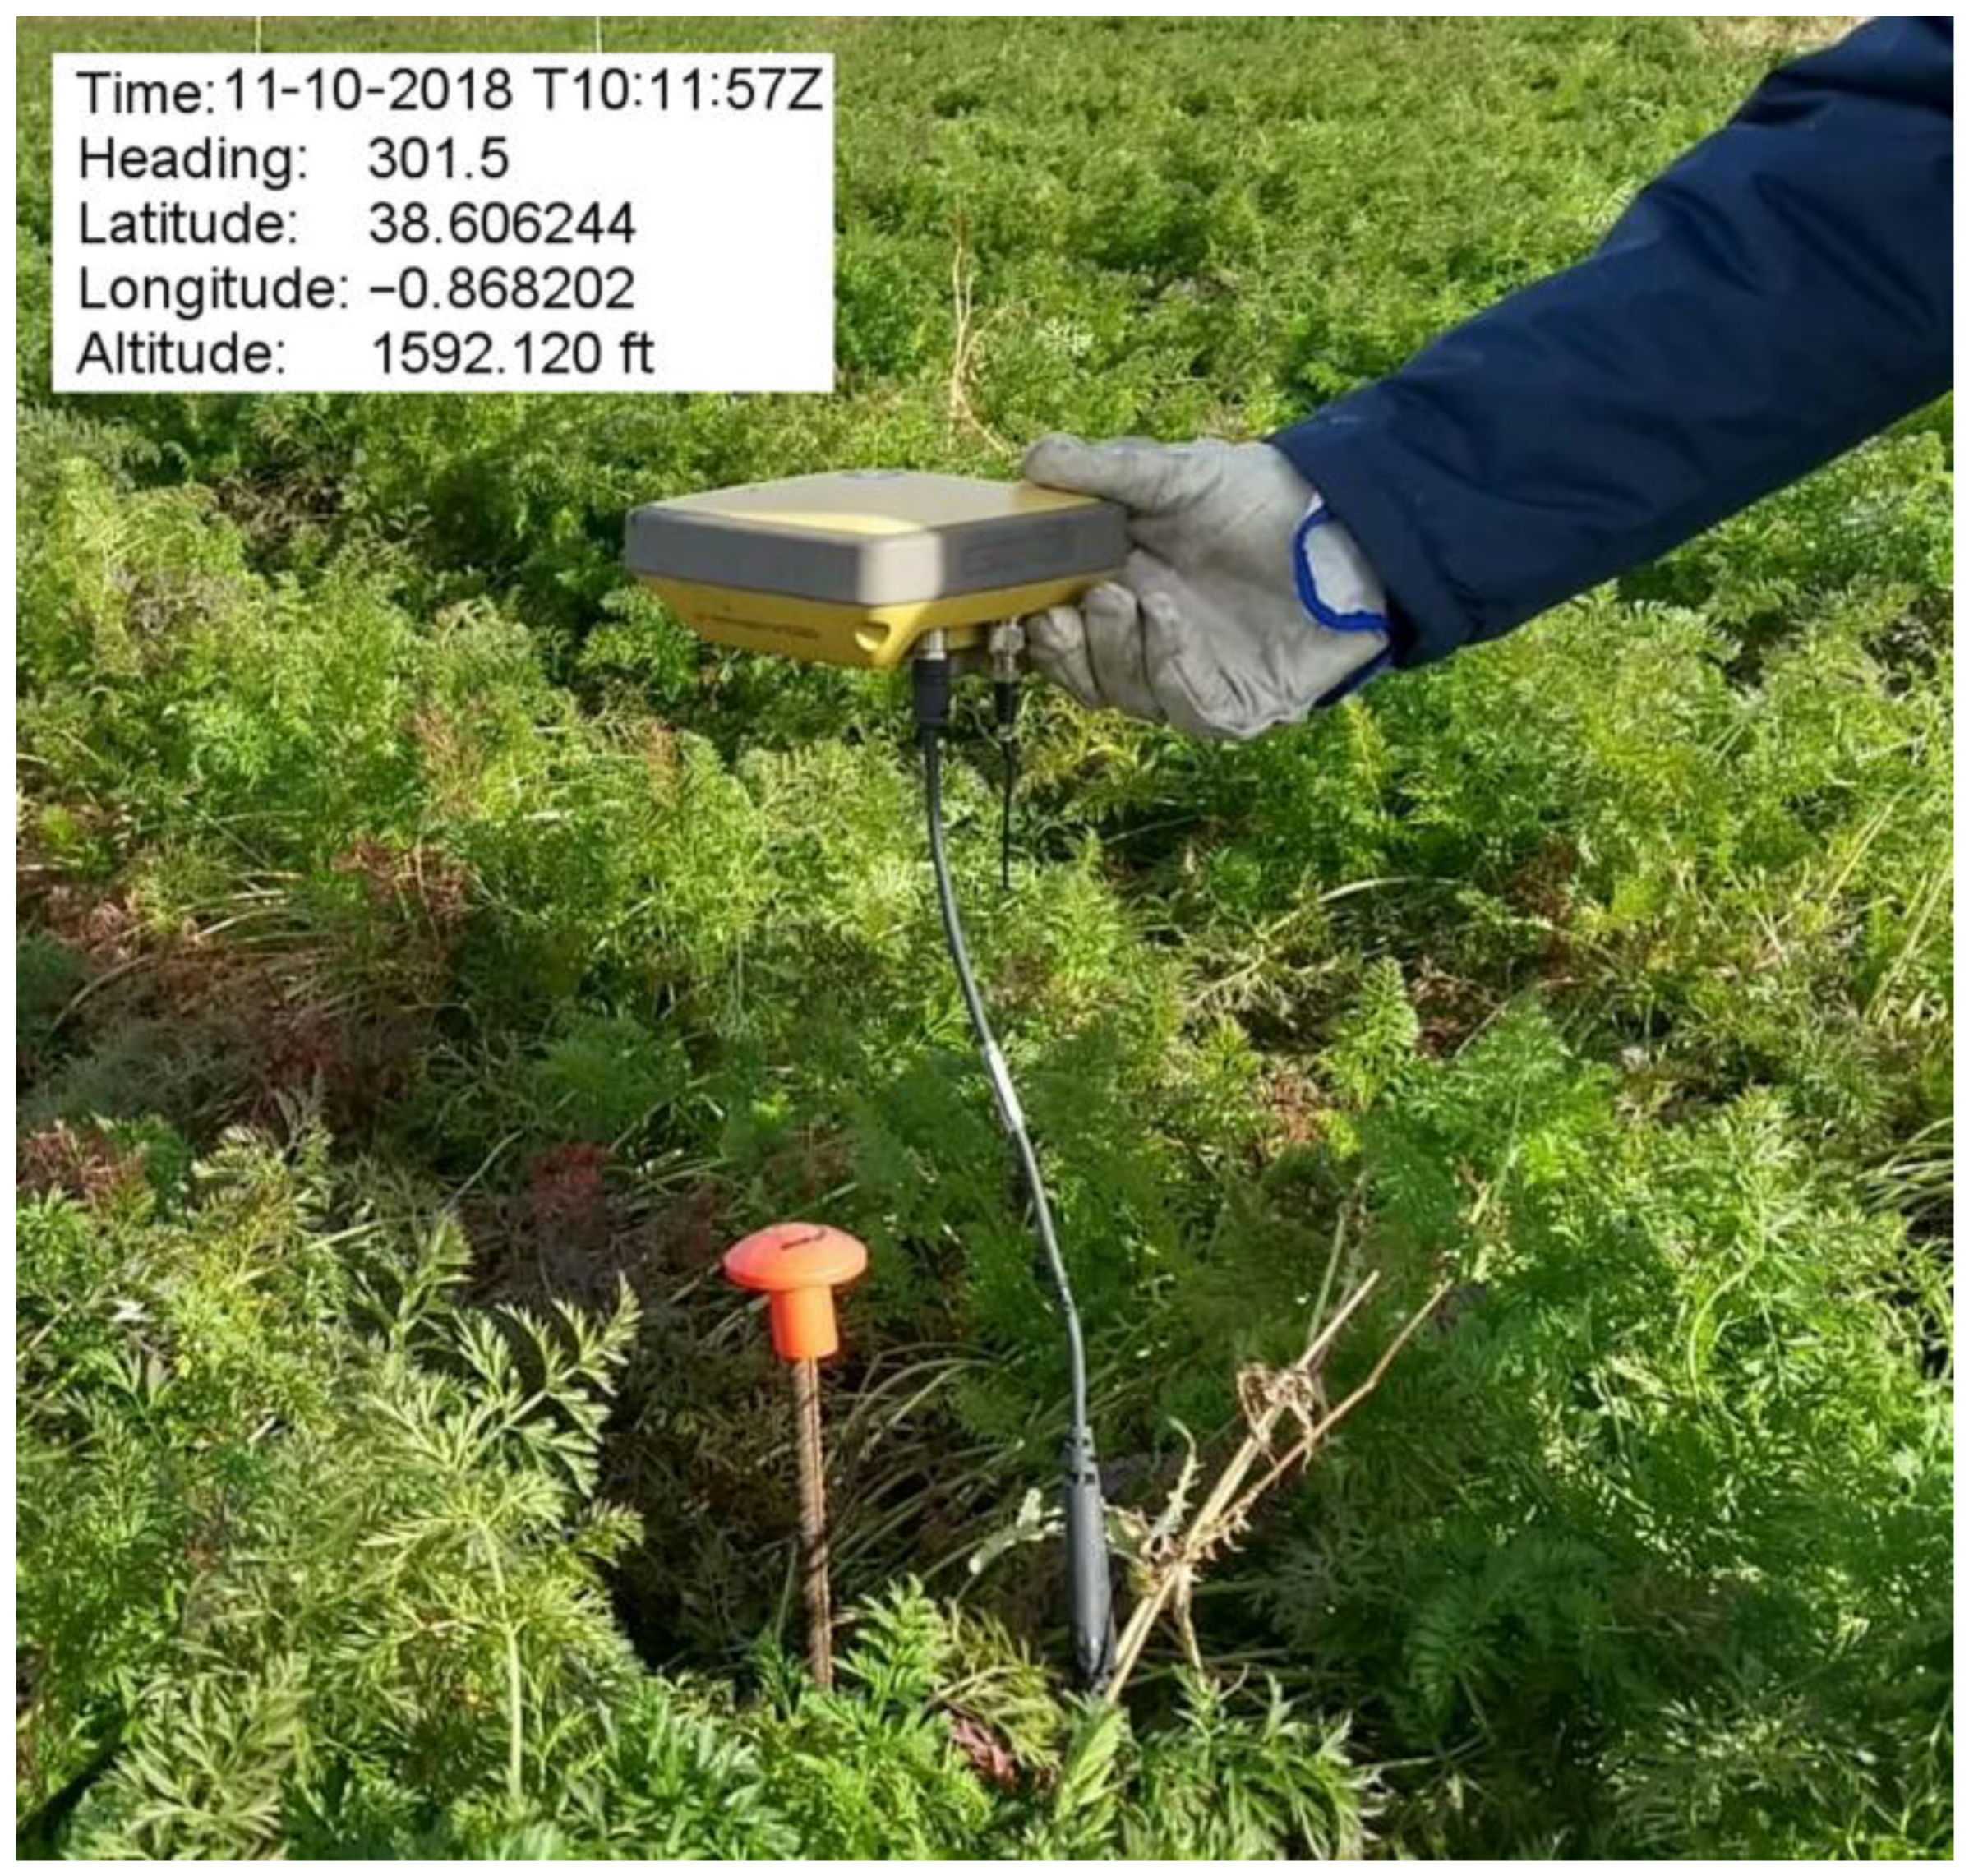
RobHortic consists of a frame with four fat-bike wheels that can absorb the irregularities of the terrain. The front wheels are fixed and the two rear wheels are smaller and they can rotate freely. This frame has a telescopic structure so that the width can vary between 100 and 200 cm to adapt the robot to work in crop rows of different widths. In this framework, a closed structure is incorporated, which contains the cameras facing the ground, sensors, and the control computer (i7-3610QE, 16 GB DDR3 1600 MHz SDRAM, 4 USB3 ports, 2 GigE ports and two ports RS-232/422/485, 1 Tb SSD). A tarp surrounds the underside of the robot to prevent changes in the scene illumination due to the variable ambient light. Then, four 100 W halogen spotlights, powered by a 2000 W inverter generator set, illuminate the scene captured by the images in the spectral range of the sensors. Two 24 V 250 W direct current (DC) motors have been adapted to the wheel axles. The motors are powered by a 24 V 10 Ah lithium battery, which is charged when the power generator is on to increase the range of the robot. The robot is remotely controlled through a wireless radio-controller that includes forward and reverse buttons, a slide potentiometer to regulate and set the speed, and a joystick to control turning. A control board installed in the robot serves as a master in the radio frequency communication system. Every 50 ms, the control board sends a data request to the remote control, which acts as a slave to the system. The control board also monitors the speed of each wheel, the average speed, the total distance travelled, the battery level, and the number of pulses generated by an encoder coupled to each motor, which serves to measure the distance travelled and trigger the cameras. A proportional-integral-derivative (PID) controller was implemented in the board to ensure a constant speed in a straight line.
The sensors mounted on RobHortic include a multispectral camera (CMS-V, Silios Technologies, France) capable of capturing eight monochromatic images at 558, 589, 623, 656, 699, 732, 769, and 801 nm, three DSLR (Digital Single Lens Reflex) cameras (EOS 600D, Canon Inc, Japan), two of them modified to capture images in near-infrared (NIR) from 400 to 1000 nm, and blue normalised difference vegetation index (BNDVI), respectively. In this later camera, the red filter was replaced by another to capture NIR. Thus, the BNDVI is estimated using the blue and NIR channels [22]. Also, a hyperspectral imaging system (InSpectral-VNIR, Infaimon SL, Spain) composed of an imaging spectrograph and a line-scan camera that is sensitive in the 410 to 1130 nm range. A total of 133 bands were acquired with this camera. The camera allowed a higher spectral resolution, but this was chosen to ensure that no images were lost due to the storage speed. The robot also incorporated a thermal camera (A320, FLIR systems, Wilsonville, Oregon, USA), but the images could not be used due to the blurring introduced by the advance of the robot. These images were therefore discarded and not included in the experiments. The redundant use of multispectral and hyperspectral cameras is justified because the performance and suitability of each one in this problem was unknown at the beginning, so it was decided to test all of them.
The DSLR cameras allowed images of the crop to be captured with a resolution of 0.5 mm/pixel, the multispectral camera could obtain images with a spatial resolution of 2.5 mm/pixel, and the hyperspectral did the same with a spatial resolution of 0.75 mm/pixel. All the cameras were located at the same distance from the soil (90 cm) and the differences in the resolution are given to the features of each camera. They were configured to capture images synchronised with the advance of the vehicle at a rate of about one image per metre, with integration times of less than 4 m/s to avoid moving or blurry images. A software application was developed to control image acquisition. This software runs in the control computer, which reads the pulses from the encoder, triggers the cameras, and stores the images. Besides, a GNSS receiver (Hiper SR, TOPCON Corp., Tokio, Japan) with RTK correction was installed in the vehicle, allowing geolocation with an accuracy of around 3 cm to be able to identify the plants in the images.

2.2. Field Tests

Field tests were performed in 2016, 2017, and 2018. The first two years were mainly spent developing the robot, improving the software, and setting up the sensors in a real environment, while the assays in 2018 were aimed at collecting and analysing the crop data. Each year, a different test field was used depending on availability since they were commercial crops of carrots cv ‘Soprano F1′, and every year, the fields change the crop. The fields were selected by technicians from the Cooperativa Agrícola Villena [23] located in Villena (Alicante, Spain), with an area between 0.5 and 2 Ha. In all cases, the crop was arranged in rows with a width of around 1 m, each containing three ridges. Images of the testing fields are shown in Figure 1. The sowing of the plots took place at the end of May and the carrots were harvested in November. Six inspections of the testing fields were carried out each year with the robot, one every month during the crop cycle from sowing to harvesting (June–November) to observe the evolution of the plants during their growth and to detect the infection as early as possible. Tests were normally done in the morning between 11 a.m. to 2 p.m. During the tests, the robot advanced at a speed of about 1 m/s, capturing images with all cameras every 80 cm (approximately). The images were stored in the SSD (solid-state drive) of the computer and later processed.
In the last campaign, a visible red mark was placed on 100 reference plants chosen at random in the fields (Figure 1) and accurately geolocated to later identify the plants in the images (Figure 2). The field was divided into plots to ensure an even distribution of these plants in the field. Only plants not showing any external symptoms associated with the disease were selected for reference. They were collected separately after being monitored by the robot, tagged, and taken to the laboratory to undergo detailed optical and molecular analysis to serve as a reference for the field tests.

2.3. Laboratory Tests
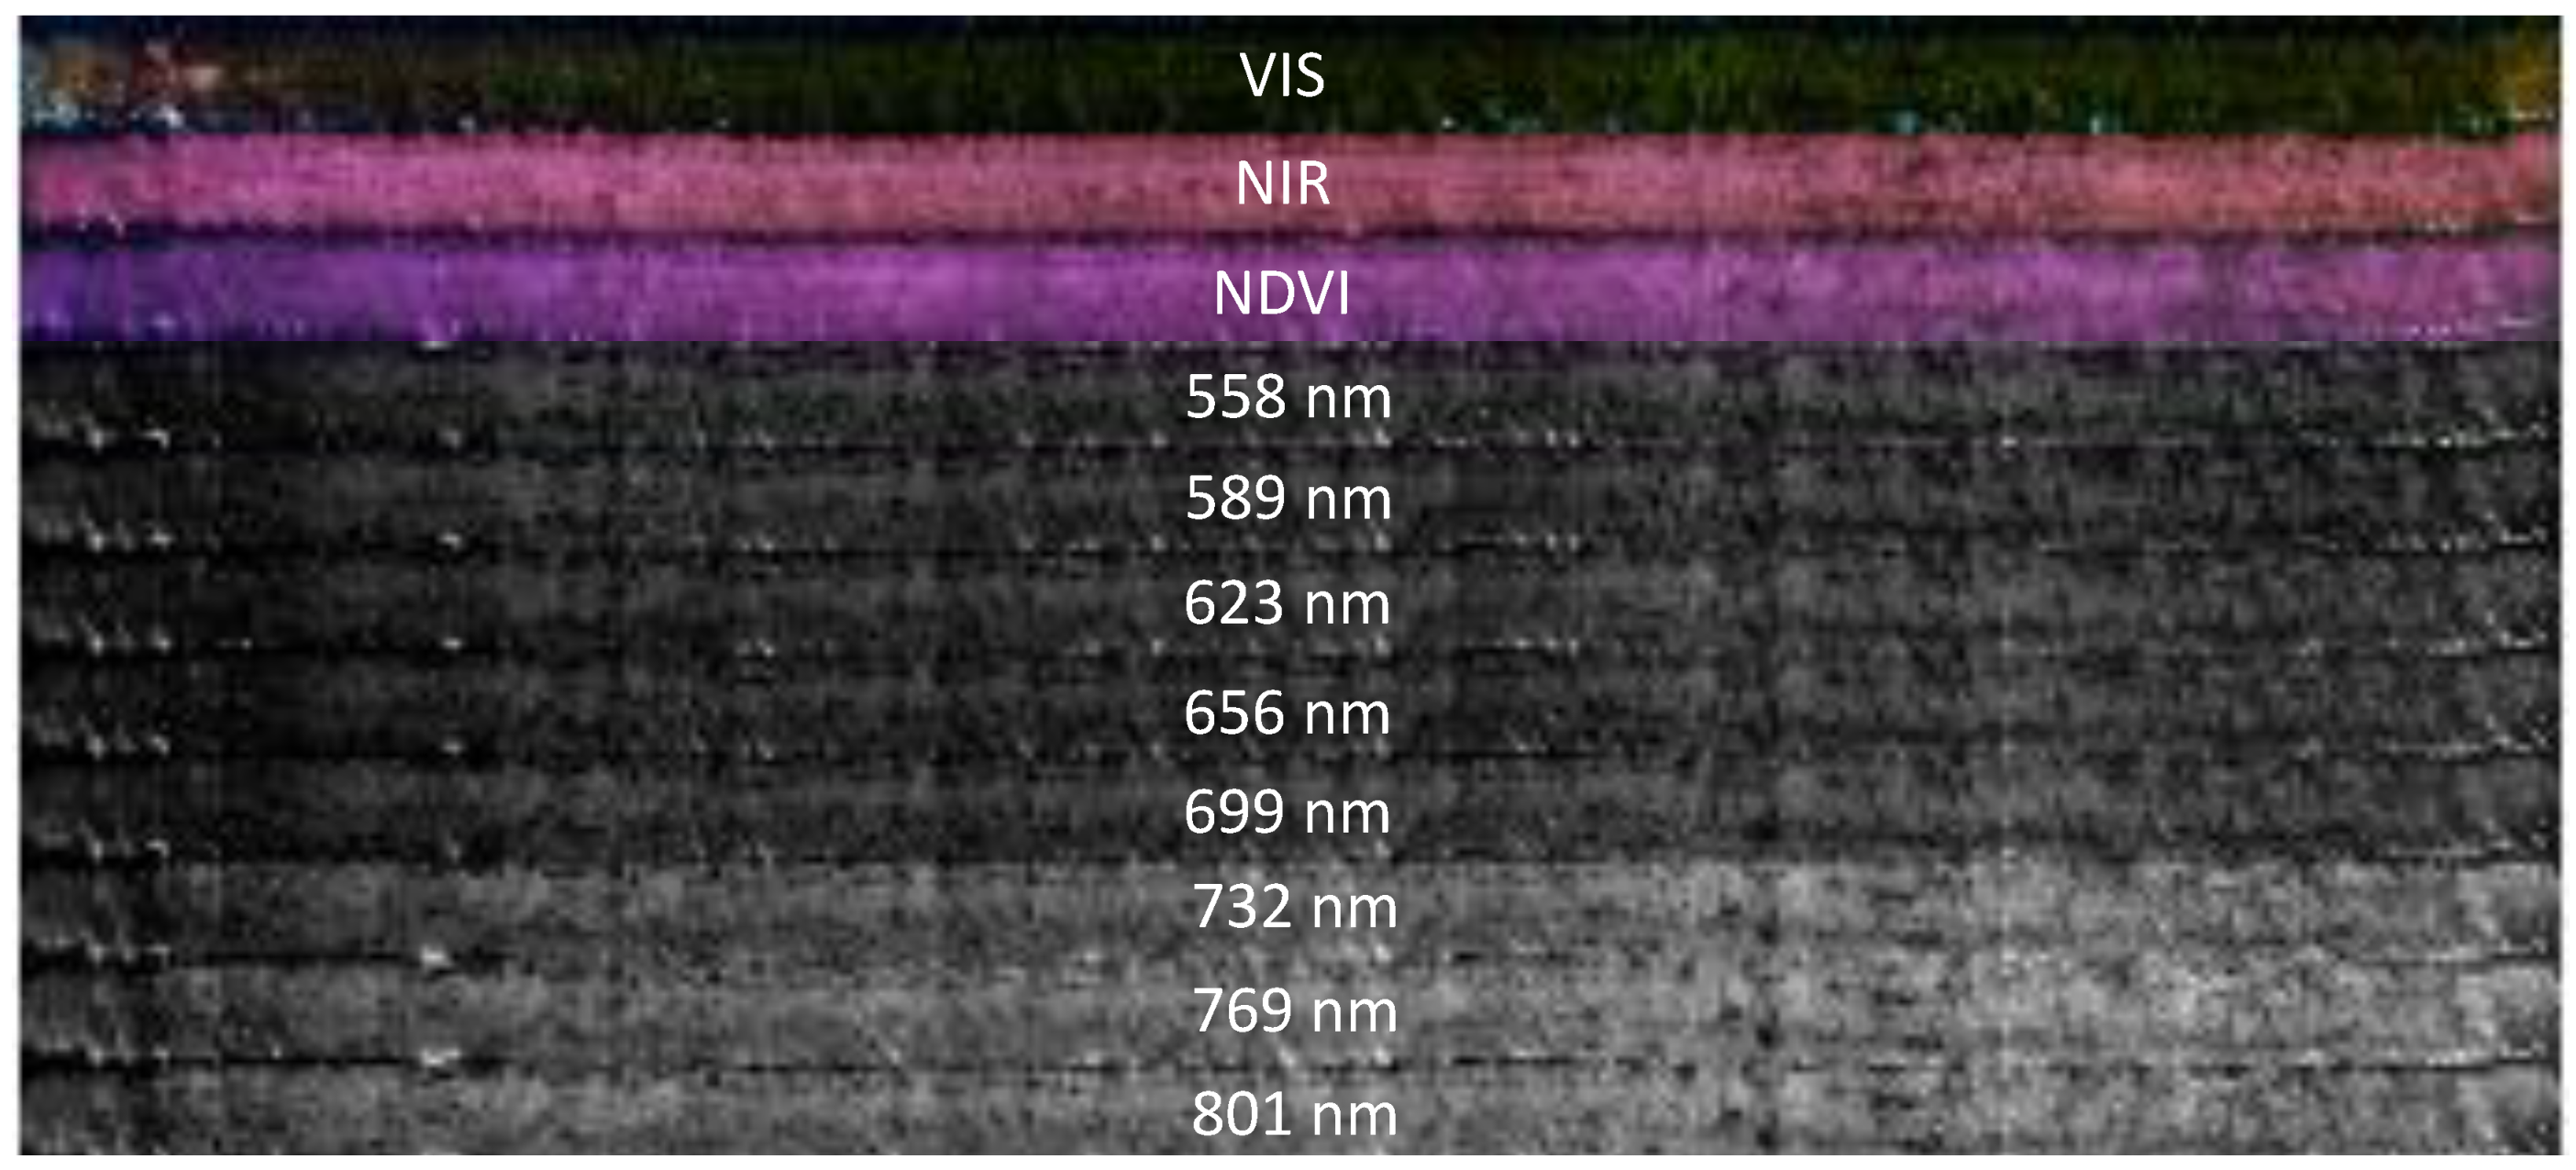
At the end of each session, the plants marked in the field were taken to the laboratory to carry out exhaustive analyses under controlled conditions with non-destructive methods and later molecular analysis to check for the presence or absence of the target bacterium. High-quality images were captured using the same DLSR cameras installed in the robot, with a size of 3456 × 2304 pixels and a resolution of 0.08 mm/pixel. The samples were placed at a distance of 20 cm from the camera inside an inspection hood. The scene was lit using the same lamps as those installed on the robot. In addition, ultraviolet (UV) illumination was used to obtain UV-induced fluorescence images. Hyperspectral images (450 and 1040 nm) of the plants were also obtained using a camera (CoolSNAP ES, Photometrics, AZ, USA) coupled to two liquid crystal tunable filters (LCTF) (Varispec VIS-07 and NIR-07, Cambridge Research and Instrumentation Inc., MA, USA). The camera was configured to acquire images every 10 nm with a size of 1392 × 1040 pixels and a spatial resolution of 0.14 mm/pixel. Thus, 60-band hypercubes were obtained. Images were corrected using white (Spectralon 99%, Labsphere, Inc, NH, USA) and dark references to correct for the influence of emission spectrum of the lamps, the sensitivity of the camera sensor, and the sensitivity of the LCTFs.
Also, to check whether other wavelengths could be useful in the early detection of infection, two spectrometers covering the ranges 200 to 1100 nm (AvaSpec-ULS2048-USB2, Avantes, Inc., Apeldoorn, The Netherlands) and 900 to 1700 nm (AvaSpec-NIR256-1.7, Avantes, Inc., Apeldoorn, The Netherlands) were used. The raw spectra obtained were normalised by dividing each variable by its standard deviation. In this way, the spectral intensities were rescaled to a common range, allowing us to compare the acquired spectra using different equipment with different resolutions.
The 100 marked plants collected in the last survey were stored under refrigerated conditions and analysed using all the equipment described above. Later, molecular analyses were carried out. First, deoxyribonucleic acid (DNA) extraction from leaves was performed using the cetyl trimethylammonium bromide (CTAB) method [25]; then, DNA was analysed by real-time Polymerase Chain Reaction (PCR) protocol with two sets of specific primers and probes [26,27] for detection of CaLsol. According to the results, these plants would be used for reference in the creation of statistical models. Samples were also analysed for the universal detection of ‘Candidatus Phytoplasma’ [28] and Spiroplasma citri [29]. After the molecular analysis of the plants, knowing which plants were positive and negative for CaLsol, the spectra were randomly partitioned into two sets for calibration and validation, including plants of the two classes. The plants were randomly separated into two sets. The first included 70% of the plants and was used to build the model that was validated using 10-fold cross-validation (CV). The remaining 30% was used as an independent test set. In the case of hyperspectral images, a binary mask was used to separate the plants from the background using the 600 nm wavelength, which showed high contrast. The average reflectance spectrum of each plant was determined by averaging the relative reflectance spectra of all pixels included in the plant region.

2.4. Data Analysis

Spectral data and reference values (positive or negative) were organised in matrices, where the rows were the spectra obtained from the plants and the columns were the variables. Variables X were wavelengths, the number of which differed depending on whether they were collected using the hyperspectral or spectrometric system. Partial Least Squares-Discriminant Analysis (PLS-DA) was used to classify plants as healthy or infected. The average spectrum of each plant was filtered using Savitzky-Golay (SG) smoothing to eliminate additive and multiplicative effects. The resulting spectrum was then normalised by the mean centre. A 10-fold CV was used to obtain the optimal number of latent variables (LV), as well as an estimate of the error rate of the models [30]. The results of the PLS-DA models were expressed as a percentage of correct classification for the calibration (using CV) and test sets. The models were statistically validated using sensitivity, specificity, class error, and accuracy, following Equations 1 to 4 [31].
Sensitivity   =   TP TP + FN
Specificity   =   TN TN + FP
Class   error   = 1 ( Sensitivity + Specificity 2 )
Accuracy   ( % ) = TP + TN TP + TN + FP + FN × 100
where TP and TN are true positive (infected correctly detected) and true negative (healthy plants correctly detected), respectively. FP and FN mean false positive (healthy plants detected as infected) and false negative (infected plants detected as healthy), respectively. The analyses were performed with MATLAB R2015a (Natick, MA, USA).
Other classification techniques were tested alternatively to PLS-DA, trying to increase the detection of infection obtained. These techniques were linear and quadratic discriminant analysis (LDA and QDA), and support vector machine (SVM) [32].

3. Results and Discussion

3.1. Robotic Platform Developed

RobHortic (Figure 3) operated correctly during all test campaigns, capturing data from the test fields with all the sensors. During the two first testing campaigns, aspects such as the speed of advance, the robustness of the motors, the duration of the batteries, the distance and reliability of the control, the robustness of the communications, the synchronisation of the sensors with the advance, the adequacy of the sensors to obtain plant data, and the data storage rate necessary to determine the capture rate were tested. The robot was programmed to advance at a speed of 1 m/s, capturing images approximately every 80 cm. The GNSS ran in the free mode at 25 Hz. As the robot was programmed to move at a speed of 1 m/s, the location was captured approximately every 40 mm. The association between an image and the GNSS information was performed using a timestamp inserted in the data streams captured with a time resolution of one millisecond that contained both the timing and the GNSS data. This strategy allowed to associate the GNSS data with the image captured at a particular time. The total cost of the robot materials, excluding the sensors and electronics that were manufactured in the laboratory to adapt them to this application, was less than €5000, with the motors and chassis being the most expensive parts. This makes RobHortic an affordable, flexible, and adaptable alternative for crop inspection or testing sensor aimed to this purpose.
During these tests, the multispectral images were used to calculate vegetation indices, to create maps of the fields. The images captured consecutively were first stitched to form the rows using the stitching software. Later, the rows were joined to complete the map of the field. Images of different wavelengths captured by the multispectral camera were used to obtain the vegetation indices of the field tests. Figure 4 shows a single row of the field captured in the different wavelengths.
From the images of the field captured at these wavelengths, it was possible to create maps of vegetation indices. As an example, Figure 5 shows an NDVI map with a detail of the resolution. This NDVI map was created using the 801 and 656 nm images following the equation NDVI = (R801 − R656)/(R801 + R656), Rx being the reflectance at wavelength x. However, these indexes resulted ineffective for detection of CaLsol in the 100 reference plants since no differences were found between sound and infected plants.
RobHortic can be adapted to different crop conditions and states, as its design allows it to be made wider and its remote operation gives it the flexibility to move in different environments. In addition, it can carry a large payload, which makes it relatively easy to add or change new sensors. About other scouting robots for crop surveillance, in many cases, they have been developed for particular crops, are more expensive, or they are presented as a black box, giving little information about the design, construction, functionalities, and cost of the prototypes. BoniRob (Robert Bosch Start-up GmbH, Renningen, Germany), is a multi-purpose robot developed for different applications in precision agriculture. The structure is similar to RobHortic with a more robust and industrial design, but also a much higher cost. On the other hand, the sensor is limited to a multispectral RGB-D camera and different equipment to obtain structural information, such as a Kinect camera or a LiDAR [33]. AgriRobot is a teleoperated robotic sprayer driven by a farmer, who receives data from the robot’s sensors and cameras [19] in a display device and interacts with the robot using a screen or a Head Mounted Display, a standard PC keyboard, or a PS3 gamepad. This makes direct eye contact with the robot in the field unnecessary but requires the use of a computer by the user, and signs in the field to make the driving easier. XF-ROVIM is another example of a teleoperated robot created to perform an inspection of olive trees. In this case, the cameras are facing to one side of the robot instead of the ground and hence cannot be used for vegetable crops [18].

3.2. Results in Detection of CaLsol

In the first tests carried out in 2016, the molecular analysis by real-time PCR showed that 12% of the plants were healthy, 6% were infected by CaLsol, 7% were infected by ‘Ca. Phytoplasma’ sp., and 75% were infected by both pathogenic organisms. In 2017, infection by CaLsol affected 99% of the samples collected. In 2018, the prevalence of CaLsol in the test fields was around 80%. However, there were no external symptoms of the infection in any of the cases.
Figure 6 shows three bands of the hyperspectral image of an infected plant captured in the laboratory. The results of the analysis of hyperspectral images using the PLS-DA model set are shown in Table 1 for the CV and test sets. Sensitivity values of 0.75 and 0.62 were determined for positive and negative plants respectively, the accuracy of classification of infected plants being about 68% with an error of 0.32 in the CV set using six LVs. However, worse results were achieved for the validation set, with a success rate of 66.4%. The classification results achieved using LDA, QDA, and SVM are shown in Table 2, although they were similar to those achieved using PLS-DA. These results correspond to the analysis of the data collected in the last surveys of 2018.
Table 3 shows the predictive ability for the validation sets using the data collected by the spectroscopic system. Since two spectrometers were used, models were constructed using them separately and joining them to achieve a single complete spectrum. The results that were objectified by PLS-DA were similar for the two spectral ranges. LDA models were less accurate even with a higher number of LVs. The optimal number of LVs was chosen according to the lowest root-mean-square error (RMSE) obtained by cross-validation (RMSECV). Although the best results were achieved using the full spectrum captured by the two spectrometers in the whole range studied (200–1800 nm), the most decisive information was found using the UV-VIS-NIR information (200–1100 nm).
Although detection was possible in 67.3% of the cases using spectroscopy and 66.4% using hyperspectral imaging at the most (both using the test set), these results were achieved under laboratory conditions where the illumination was controlled. The hyperspectral images obtained by RobHortic during the surveys from the plants marked in the field were analysed using the same multivariate statistical methods as in the laboratory analyses. However, for these images obtained in the field during real monitoring, the best results of the correct detection of the infected plants was 59.8% using PLS-DA in the test set, which is promising taking into account the complexity of the challenge but still not enough to state that this particular infection can be detected using the techniques studied in this work. Several different causes could explain the relatively low detection results, including (i) the absence of visual symptoms that may indicate that CaLsol affects plants in different ways, or the diversity of symptoms that may be associated with this organism, (ii) the co-infection of CaLsol with other pathogens, as most plants infected with CaLsol were also infected with ‘Ca. Phytoplasma’ sp. and other bacterial species and viruses (data not shown), which can mask the effect of CaLsol, (iii) the fact that, in non-advanced stages of the disease, the distribution of the pathogenic bacteria in the infected plant is not homogeneous, so in a single plant, the bacteria can be present only in some leaves while others remain non-infected, making detection by optical or molecular means difficult to accomplish, (iv) artefacts introduced by the movement of the robot when capturing the images, or (v) simply that these techniques are not sensitive enough to detect the infection in very early stages of the disease. It should be noted that all the analyses were carried out in plants that did not show any external symptoms of the disease. These results are promising but more work is necessary, especially on the creation of more powerful predicting models, for instance, using deep learning techniques like those used in Reference [34] to detect viruses in potatoes.
In addition, it is also important to mention that the robotic platform developed in this work can be adapted to different types of fields and crops. A new thermal camera (A65, FLIR Systems, Wilsonville, Oregon, USA) and a LiDAR (LMS111, Sick AG, Waldkirch, Germany) have been installed after these experiments. A new hyperspectral camera sensitive up to 1700 nm is also planned to be installed for the next evolution of the robot. As the integration of new types of sensors is simple, the robot could serve as a crop monitoring station for different vegetable crops. The next steps in the development will also include the installation of solar panels to supply energy for the sensors and the implementation of autonomous navigation, but maintaining remote control as an alternative guidance system for cases in which the autonomous guidance cannot perform properly. The integration of all the software is planned under the Robot Operating System (ROS) that is a collection of frameworks for robot software development that provides standard services, such as hardware abstraction, low-level device control, implementation of commonly-used functionality, passing messages between processes, and maintaining packages [35].

4. Conclusions

A teleoperated field robot has been developed allowing different types of sensors to be carried onboard to monitor horticultural crops using remote sensing techniques under controlled lighting conditions. The resolution of the multispectral sensors allows field maps to be obtained with a spatial resolution of between 1 and 2.5 mm per pixel, which is much higher than those obtained with sensors on drones, and thus, allows analysis at the leaf level. Due to the spectral information provided by the sensors, it is possible to create maps of different spectral indices. All the information collected from the crop has been geographically referenced thanks to a GNSS receiver with RTK correction that allows the accuracy of about 3 cm in the creation of maps.
Trials were carried out in commercial carrot fields for three years, the first two served to develop the robot and the last one to carry out CaLsol detection tests. Asymptomatic plants that were selected in the field were analysed with molecular techniques to determine the presence of the target bacterium. To establish the effectiveness of optical sensors in detecting infection, models based on PLS-DA, LDA, QDA, and SVM were performed using the results of molecular analyses and plant spectra. The tests were carried out on hyperspectral images obtained in the laboratory and the field by the robot, with PLS-DA being the best model with detection levels 67.3% and 66.4% in the laboratory using spectroscopy and hyperspectral imaging respectively, and 59.8% in the field.

Author Contributions

Conceptualization, J.B.; Data curation, S.C.; Formal analysis, E.M.-N. and S.B.; Investigation, E.M.-N.; Methodology, N.A.; Project administration, J.B.; Resources, J.B.; Software, S.C.; Supervision, S.C. and N.A.; Visualization, S.C.; Writing—original draft, J.B.; Writing—review & editing, S.C., E.M.-N., N.A. and S.B. All authors have read and agreed to the published version of the manuscript.

Funding

This work was partially supported by funding from the European Union’s Horizon 2020 research and innovation programme under grant agreement No. 635646 POnTE (Pest Organisms Threatening Europe).

Acknowledgments

The authors are grateful to Cooperativa Agrícola Villena (http://www.agricolavillena.es) for providing the testing fields, knowledge, and technical support. Thanks to the Engineers Santiago López, Enrique Aguilar, and Vicente Alegre for their contribution to the electronics and programming of RobHortic, and Inmaculada Navarro for her contribution to the molecular analyses for the detection of CaLsol and the other pathogens.

Conflicts of Interest

The authors declare no conflict of interest.

References

  1. EPPO. Candidatus Liberibacter solanacearum. EPPO Bull. 2020, 50, 49–68. [Google Scholar]
  2. Antolinez, C.A.; Fereres, A.; Moreno, A. Risk assessment of ‘Candidatus Liberibacter solanacearum’ transmission by the psyllids Bactericera trigonica and B. tremblayi from Apiaceae crops to potato. Sci. Rep. 2017, 7, 45534. [Google Scholar]
  3. Bertolini, E.; Teresani, G.R.; Loiseau, M.; Tanaka, F.A.O.; Barbé, S.; Martínez, C.; Gentit, P.; López, M.M.; Cambra, M. Transmission of ‘Candidatus Liberibacter solanacearum’ in carrot seeds. Plant Pathol. 2015, 64, 276–285. [Google Scholar] [CrossRef]
  4. Antolínez, C.A.; Moreno, A.; Appezzato-da-Gloria, B.; Fereres, A. Characterization of the electrical penetration graphs of the psyllid Bactericera trigonica on carrots. Entomol. Exp. Appl. 2017, 163, 127–139. [Google Scholar]
  5. Nissinen, A.I.; Haapalainen, M.; Jauhiainen, L.; Lindman, M.; Pirhonen, M. Different symptoms in carrots caused by male and female carrot psyllid feeding and infection by ‘Candidatus Liberibacter solanacearum’. Plant Pathol. 2014, 63, 812–820. [Google Scholar] [CrossRef]
  6. Zarco-Tejada, P.J.; Camino, C.; Beck, P.S.A.; Calderon, R.; Hornero, A.; Hernández-Clemente, R.; Kattenborn, T.; Montes-Borrego, M.; Susca, L.; Morelli, M.; et al. Pre-visual symptoms of Xylella fastidiosa infection revealed in spectral plant-trait alterations. Nat. Plants 2018, 4, 432–439. [Google Scholar] [CrossRef] [PubMed]
  7. Martinelli, F.; Scalenghe, R.; Davino, S.; Panno, S.; Scuderi, G.; Ruisi, P.; Villa, P.; Stroppiana, D.; Boschetti, M.; Goulart, L.R.; et al. Advanced methods of plant disease detection. A review. Agron. Sustain. Dev. 2014, 35, 1–25. [Google Scholar] [CrossRef] [Green Version]
  8. Vicent, A.; Blasco, J. When prevention fails. Towards more efficient strategies for plant disease eradication. New Phytol. 2017, 214, 905–908. [Google Scholar] [CrossRef] [PubMed] [Green Version]
  9. Gonzalez-de-Santos, P.; Ribeiro, A.; Fernandez-Quintanilla, C.; Lopez-Granados, F.; Brandstoetter, M.; Tomic, S.; Pedrazzi, S.; Peruzzi, A.; Pajares, G.; Kaplanis, G.; et al. Fleets of robots for environmentally-safe pest control in agriculture. Precis. Agric. 2017, 18, 574–614. [Google Scholar]
  10. Bac, C.W.; van Henten, E.J.; Hemming, J.; Edan, Y. Harvesting Robots for High-value Crops: State-of-the-art Review and Challenges Ahead. J. Field Robot. 2014, 31, 888–911. [Google Scholar] [CrossRef]
  11. Edan, Y. Design of an autonomous agricultural robot. Appl. Intell. 1995, 5, 41–50. [Google Scholar] [CrossRef]
  12. Hiremath, S.A.; Van der Heijden, G.W.A.M.; Van Evert, F.K.; Stein, A.; Ter Braak, C.J.F. Laser range finder model for autonomous navigation of a robot in a maize field using a particle filter. Comput. Electron. Agric. 2014, 100, 41–50. [Google Scholar] [CrossRef]
  13. Bender, A.; Whelan, B.; Sukkarieh, S. A high-resolution, multimodal data set for agricultural robotics: A Ladybird’s-eye view of Brassica. J. Field Robot. 2020, 37, 73–96. [Google Scholar] [CrossRef]
  14. Stein, M.; Bargoti, S.; Underwood, J. Image based mango fruit detection, localisation and yield estimation using multiple view geometry. Sensors 2016, 16, 1915. [Google Scholar] [CrossRef] [PubMed]
  15. Diago, M.P.; Rovira-Más, F.; Saiz-Rubio, V.; Faenzi, E.; Evain, S.; Ben Ghozlen, N.; Labails, S.; Stoll, M.; Scheidweiler, M.; Millot, C.; et al. The “eyes” of the VineRobot: Non-destructive and autonomous vineyard monitoring on-the-go. In Proceedings of the 62nd German Winegrowers’ Congress, Stuttgart, Germany, 27–30 November 2016. [Google Scholar]
  16. Lopes, C.M.; Graça, J.; Sastre, J.; Reyes, M.; Guzmán, R.; Braga, R.; Monteiro, A.; Pinto, P.A. Vineyard yield estimation by VINBOT robot-preliminary results with the white variety Viosinho. In Proceedings of the 11th International Terroir Congress, McMinnville, OR, USA, 10–14 July 2016; Jones, G., Doran, N., Eds.; Southern Oregon University: Ashland, OR, USA, 2016; pp. 458–463. [Google Scholar]
  17. Roure, F.; Moreno, G.; Soler, M.; Faconti, D.; Serrano, D.; Astolfi, P.; Bardaro, G.; Gabrielli, A.; Bascetta, L.; Matteucci, M. GRAPE: Ground Robot for vineyArd Monitoring and ProtEction. Third Iberian Robotics Conference. Adv. Intell. Syst. Comput. 2017, 693, 249–260. [Google Scholar]
  18. Rey, B.; Aleixos, N.; Cubero, S.; Blasco, J. XF-ROVIM. A field robot to detect olive trees infected by Xylella fastidiosa using proximal sensing. Remote Sens. 2019, 11, 221. [Google Scholar] [CrossRef] [Green Version]
  19. Adamides, G.; Katsanos, C.; Parmet, Y.; Christou, G.; Xenos, M.; Hadzilacos, T.; Edan, Y. HRI usability evaluation of interaction modes for a teleoperated agricultural robotic sprayer. Appl. Ergon. 2017, 62, 237–246. [Google Scholar] [CrossRef]
  20. Kurtser, P.; Ringdahl, O.; Rotstein, N.; Berenstein, R.; Edan, Y. In-Field Grape Cluster Size Assessment for Vine Yield Estimation Using a Mobile Robot and a Consumer Level RGB-D Camera. IEEE Robot. Autom. Lett. 2020, 5, 2030–2037. [Google Scholar] [CrossRef]
  21. Blasco, J.; Aleixos, N.; Roger, J.M.; Rabatel, G.; Moltó, E. Robotic weed control using machine vision. Biosyst. Eng. 2002, 83, 149–157. [Google Scholar] [CrossRef]
  22. Matsumura, K. Unmanned Aerial Vehicle (UAV) for fertilizar management in grassland in Hokkaido, Japan. In Unmanned Aerial Vehicle: Applications in Agriculture and Environment 2020; Avtar, R., Watanabe, T., Eds.; Springer Nature Switzerland AG: Cham, Switzerland, 2020; ISBN 978-3-030.271-56-5. [Google Scholar]
  23. Cooperativa Agrícola de Villena. Available online: http://www.agricolavillena.es (accessed on 6 July 2020).
  24. Goolge Maps. Available online: https://www.google.com/maps/place/03400+Villena,+Alicante/@38.6056364,-0.8684742,358a,35y,90h/data=!3m1!1e3!4m5!3m4!1s0xd63df76534191cb:0x76613d2e79c91d2e!8m2!3d38.6318196!4d-0.8612206 (accessed on 6 July 2020).
  25. Murray, M.G.; Thompson, W.F. Rapid isolation of high molecular weight plant DNA. Nucleic Acids Res. 1980, 8, 4321–4325. [Google Scholar] [CrossRef] [Green Version]
  26. Li, W.; Abad, J.A.; French-Monar, R.D.; Rascoe, J.; Wen, A.; Gudmestad, N.C.; Secor, G.A.; Lee, I.M.; Duan, Y.; Levy, L. Multiplex real-time PCR for detection, identification and quantification of ‘Candidatus Liberibacter solanacearum’ in potato plants with zebra chip. J. Microbiol. Methods 2009, 78, 59–65. [Google Scholar] [CrossRef] [Green Version]
  27. Teresani, G.R.; Bertolini, E.; Alfaro-Fernández, A.; Martínez, C.; Tanaka, F.A.; Kitajima, E.W.; Roselló, M.; Sanjuán, S.; Ferrándiz, J.C.; López, M.M.; et al. Association of ‘Candidatus Liberibacter solanacearum’ with a vegetative disorder of celery in Spain and development of a real-time PCR method for its detection. Phytopathology 2014, 104, 804–811. [Google Scholar] [CrossRef] [PubMed] [Green Version]
  28. Hren, M.; Boben, J.; Rotter, A.; Kralj, P.; Gruden, K.; Ravnikar, M. Real-time PCR detection systems for Flavescence dorée and Bois noir phytoplasmas in grapevine: Comparison with conventional PCR detection and application in diagnostics. Plant Pathol. 2007, 56, 785–796. [Google Scholar] [CrossRef]
  29. Alfaro-Fernández, A.; Ibañez, I.; Bertolini, E.; Hernández-Llopis, D.; Cambra, M.; Font, M.I. Transmission of Spiroplasma citri in carrot seeds and development of a real-time PCR for its detection. J. Plant Pathol. 2017, 99, 371–379. [Google Scholar]
  30. Munera, S.; Aleixos, N.; Besada, C.; Gómez-Sanchís, J.; Salvador, A.; Cubero, S.; Talens, P.; Blasco, J. Discrimination of astringent and deastringed hard ‘Rojo Brillante’ persimmon fruit using a sensory threshold by means of hyperspectral imaging. J. Food Eng. 2019, 263, 173–180. [Google Scholar] [CrossRef]
  31. Munera, S.; Amigo, J.M.; Aleixos, N.; Talens, P.; Cubero, S.; Blasco, J. Potential of VIS-NIR hyperspectral imaging and chemometric methods to identify similar cultivars of nectarine. Food Control 2018, 86, 1–10. [Google Scholar]
  32. Dutta, M.K.; Sengar, N.; Minhas, N.; Sarkar, B.; Goon, A.; Banerjee, K. Image processing based classification of grapes after pesticide exposure. LWT-Food Sci. Technol. 2016, 72, 368–376. [Google Scholar] [CrossRef]
  33. Chebrolu, N.; Lottes, P.; Schaefer, A.; Winterhalter, W.; Burgard, W.; Stachniss, C. Agricultural robot dataset for plant classification, localization and mapping on sugar beet fields. Int. J. Robot. Res. 2019, 36, 1045–1052. [Google Scholar] [CrossRef] [Green Version]
  34. Polder, G.; Blok, P.M.; Hendrik, A.C.V.; van der Wolf, J.M.; Kamp, J. Potato Virus Y Detection in Seed Potatoes Using Deep Learning on Hyperspectral Images. Front. Plant Sci. 2019, 10, 209. [Google Scholar] [CrossRef] [Green Version]
  35. Vasudevan, A.; Kumar, D.A.; Bhuvaneswari, N.S. Precision farming using unmanned aerial and ground vehicles. In Proceedings of the 2016 IEEE Technological Innovations in ICT for Agriculture and Rural Development (TIAR), Chennai, India, 15–16 July 2016; pp. 146–150. [Google Scholar] [CrossRef]
Figure 1. View of the testing field used for validation in the 2018 campaign in Villena, Alicante (Spain). The spots show the distribution of the reference plants. Images captured from Google Maps [24].
Agriculture 10 00276 g001
Figure 2. Marking of carrot plants in the test field for further reference and analysis.
Agriculture 10 00276 g002
Figure 3. A remotely-driven RobHortic operating in a carrot field. (a) the external appearance of the robot. (b): inside from the plant point of view.
Agriculture 10 00276 g003
Figure 4. The image of one of the rows of the crop captured in visible (VIS), near infrared (NIR), normalized difference vegetation index (NDVI) and different spectral bands using the Silios camera.
Agriculture 10 00276 g004
Figure 5. Normalised difference vegetation index (NDVI) map of the carrot field showing a detail of the high spatial resolution.
Agriculture 10 00276 g005
Figure 6. Images of an infected (Calsol-positive) carrot plant captured at 420, 700, and 970 nm, respectively.
Agriculture 10 00276 g006
Table 1. Plant discrimination (positive or negative for CaLsol) using hyperspectral imaging under laboratory conditions.
VLVSetClassSensitivitySpecificityErrorAccuracy (%)
606Cross-Validation+0.750.620.3268.4
0.620.75
Test set+0.750.590.4366.4
0.590.75
V = Variables; LV = Latent variables; ‘+’ = Positive for CaLsol; ‘−’ = Negative for CaLsol.
Table 2. Classification accuracy of the test set (as %) using linear and quadratic discriminant analysis (LDA and QDA), and support vector machine (SVM) (cross-validation) on hyperspectral images under laboratory conditions.
LDAQDASVM
ClassPositiveNegativePositiveNegativePositiveNegative
Positive60.439.661.438.661.838.2
Negative31.868.231.069.030.670.4
Table 3. Success rate using Partial Least Squares-Discriminant Analysi (PLS-DA), LDA, and spectrometric data.
Methods Success Rate (%)
LVPositiveNegative
PLS-DAFull spectrum562.272.4
UV-VIS-NIR661.869.4
NIR856.259.2
LDAFull spectrum1462.270.2
UV-VIS-NIR1261.268.8
NIR555.4 58.4
LV = Latent variables; UV = Ultraviolet; VIS= Visible; NIR= Near Inrared.

