Article

Influence of Cover Crop, Tillage, and Crop Rotation Management on Soil Nutrients

by
Samuel I. Haruna
1,* and
Nsalambi V. Nkongolo
2,3
1
School of Agriculture, College of Basic and Applied Sciences, Middle Tennessee State University, Murfreesboro, TN 37127, USA
2
School of Science, Navajo Technical University, Lower point Road, State Hwy 371, Crownpoint, NM 87313, USA
3
Instiut Facultaire des Sciences Agronomiques (IFA) de Yangambi, Kisangani BP 1232, Democratic Republic of Congo
*
Author to whom correspondence should be addressed.
Agriculture 2020, 10(6), 225; https://doi.org/10.3390/agriculture10060225
Submission received: 15 May 2020 / Revised: 4 June 2020 / Accepted: 8 June 2020 / Published: 11 June 2020

Abstract

:
Cover cropping, tillage and crop rotation management can influence soil nutrient availability and crop yield through changes in soil physical, chemical and biological processes. The objective of this study was to evaluate the influence of three years of cover crop, tillage, and crop rotation on selected soil nutrients. Twenty-four plots each of corn (Zea mays) and soybean (Glycine max) were established on a 4.05 ha field and arranged in a three-factor factorial design. The three factors (treatments) were two methods of tillage (no-tillage (NT) vs. moldboard plow [conventional] tillage (CT)), two types of cover crop (no cover crop (NC) vs. cover crop (CC)) and four typess of rotation (continuous corn, continuous soybean, corn/soybean and soybean/corn). Soil samples were taken each year at four different depths in each plot; 0–10 cm, 10–20 cm, 20–40 cm and 40–60 cm, and analyzed for soil nutrients: calcium (Ca), magnesium (Mg), nitrogen (NO3 and NH4), potassium (K), phosphorus (P), sulfur (S), sodium (Na), iron (Fe), manganese (Mn) and copper (Cu). The results in the first year showed that CT increased NO3-N availability by 40% compared with NT. In the second year, NH4-N was 8% lower under CC compared with NC management. In the third year, P was 12% greater under CC management compared with NC management. Thus, CC can enhance crop production systems by increasing P availability and scavenging excess NH4-N from the soil, but longer-term studies are needed to evaluate long-term effects.

1. Introduction

Large scale and aggressive tillage practices caused dramatic declines in soil productivity during the 20th century [1]. The removal of vegetative cover and the use of tillage equipment that mixes and disturbs the soil environment are the main causes of soil degradation [2]. For many decades, tillage has been the preferred method of soil preparation for planting, organic matter and fertilizer incorporation, accelerating soil warming and increasing soil aeration [3]. As a result of increased aeration and residue mixing encouraged by tillage, Reference [4] reported that the nutrient uptake by plants is generally greater with conventional tillage compared with no tillage. They also argue that no-till (NT) encourages physical and chemical stratification, causing more localization of nutrients near the surface. On the contrary, Reference [5] showed that tillage encouraged large losses of organic C (SOC) and N from the surface layer. Conventional tillage management has been shown to increase N concentration and bulk density of the surface soil, as a result of heavy equipment traffic, compared to the decrease noticed under conservation till management [6,7].
In a study by [8], they reported that, after 9 years, the mean amount of total N in the top 30 cm depth declined under conventional and reduced tillage practices but not under no-till practice. They reported that in the top 30 cm, soil under NT management had 290 kg N ha−1 more than under conventional tillage (CT) management, with most of it in the top 10 cm of the soil. Similarly, Reference [9] conducted an experiment on a poorly drained silty clay loam soil, to evaluate the effects that various tillage systems had on total nitrogen. After 24 years, they observed that the effects of tillage systems on N concentrations were restricted to the top 50 cm of the soil, and that, on an equivalent soil mass basis, total N storage under NT practice was significantly higher (40 kg/ha) than under CT practice.
Crop rotations with legumes and cover crops have been reported to influence soil nutrient status. For example, references Omay et al. (1997) [10] and Sainju et al. (2003) [11] demonstrated that legumes can add both organic matter and N to the soil and this can increase soil fertility. Nitrogen fertilization can also increase SOC by increasing crop biomass production and the amount of residue returned to the soil [12]. Therefore, crop rotations and nitrogen fertilization can influence SOC sequestration in tilled and non-tilled soils, due to the differences in the mineralization rates of crop residues and soil organic matter.
As a result of the mobility of certain nutrients, there have been concerns about leaching and water pollution. This can be exacerbated under management practices that influence soil porosity and water infiltration [13,14,15]. Non-leguminous cover crops can reduce nitrogen loss by scavenging the excess nitrogen in the soil. Tilman et al. (2002) [16] estimated that only 30–40% of applied nitrogen and about 45% of phosphorous is taken up by crops. Wyland et al. (1996) [17] reported a 65–70% reduction in nitrate leaching from cover crop plots compared with fallow during winter. They attributed this to the scavenging ability of cover crops.
There have been extensive studies on the influence of tillage and cover crops on soil nutrients [18,19,20,21]. However, there are gaps in the understanding of the effects of a combination of soil management practices on soil nutrients, especially in central Missouri. Therefore, our specific objective was to determine the effect of the interaction between tillage, crop rotation and cover crop on soil nutrients. As a result of the increased soil aeration and mixing through tillage and cover crop residue return to the soil, we hypothesize that a combination of cover crops, tillage and crop rotation will increase soil nutrient availability.

2. Materials and Methods

2.1. Site Description and Experimental Design

The study was conducted at Lincoln University of Missouri’s Freeman farm in Jefferson City. Its geographic coordinates are 38°58′16″ N latitude and 92°10′53″, with an elevation of 166 m above sea level and a slope of 2%. The soil type is a Waldron silt loam (fine, smectitic, calcareous, mesic Aeric Fluvaquents). The site has a fine sub-angular blocky structure in the Ap horizon at the 0–20 cm depth. The Ap horizon is underlain by C1 (20–35 cm), C2 (35–43 cm), Cg1 (43–71 cm), Cg2 (71–101 cm) and Cg3 (101–152 cm) horizons, all of a similar structure. Prior to the beginning of this study in 2011, the site was under a 50-year moldboard plow tillage with corn (Zea mays) and soybean (Glycine max) rotation. The mean annual precipitation between 2011 and 2013 (years of study) was 990.6 mm, with the months of May and August usually receiving the highest (1270 mm) and lowest (838.2 mm) precipitations, respectively. However, 2012 was a particularly dry year, with 752.09 mm precipitation. Some baseline physical and chemical properties are shown in Table 1.
The experiment was a randomized complete block design on a 4.05 ha field arranged in a 3-factor factorial design with three replicates (a total of forty-eight plots). Each of the plots measured 12.2 m × 21.3 m. The three factors (treatments) were two methods of tillage (no-tillage (NT) vs. moldboard plow tillage (CT)), two methods of cover crops (cover crop (CC) vs. no-cover crop (NC)) and four types of rotation (continuous corn, continuous soybean, corn/soybean and soybean/corn rotations). Twenty-four plots were under CT, while twenty-four plots were under NT. Furthermore, twenty-four plots were under CC management, and twenty-four plots were under NC management. Twelve plots each were under continuous corn, continuous soybean, corn/soybean rotation and soybean/corn rotation. These rotations were established in the first year but their effects were only analyzed during the second and third years, due to the time of soil sample collection. The depth of CT was from the soil surface to a depth of 15 cm. The soil was tilled every year during April or May. The CC was cereal rye (Secale cereale). Cover crop was planted in 12 plots of each corn and soybean during September or October each year. The CC were overseeded at a rate of about 359 kg ha−1. They were terminated using a 4.15 kg ha−1 acid equivalent of glyphosate (N-phosphonomethyl glycine). Corn was planted at a rate of 26 kg ha−1, while soybean was planted at a rate of 405,000 seed/ha. All corn and soybean plots received 26 kg N ha−1, 67 kg P, and 67 kg K ha−1. However, the corn plots received an additional 202 kg N ha−1 from urea. These fertilization rates were determined based on the recommendations of [22]. More information about the study site can be found in [23]. Please note that, due to the differences in N application rates for the crops, N was not compared between rotations.

2.2. Soil Sampling and Analysis

Each year, soil samples were collected from the crop rows in the middle of each plot, between corn or soybean plants. These points were chosen due to the very low human and equipment traffic. From each of the 48 plots, soil samples were taken using cylindrical cores at four different depths; 0–10 cm, 10–20, 20–40 and 40–60 cm. All soil samples were taken 1 to 4 days after tillage each year. The samples were air dried for 72 h, crushed and then sieved using a 2-mm sieve. They were analyzed for their macro- and micronutrient content. Soil properties analyzed were chosen to reflect macro- and micro-nutrients of importance, per the recommendations of [22]. Soil pH was measured by potentiometry using an electronic pH meter [26]. Soil organic matter was measured by combustion (loss on ignition at 360 °C) [27]. Nitrate concentration was determined using the nitrate electrode method [28]. Sulfate (SO4) concentration was determined using the turbidimetric procedure in a spectrophotometer [29]. Available potassium (K), Calcium (Ca), magnesium (Mg), iron (Fe), manganese (Mn) and copper (Cu) were determined using Melich-3 [30]. Available P was measured using the Bray I method [31].

2.3. Statistical Analysis

Statistical analysis was carried out using Minitab version 16.2. A test of the variance homogeneity within different treatments was conducted using the Anderson-Darling test at p = 0.05, to evaluate the variability in the measurement. The results showed that the data was normally distributed. Tukey comparison was conducted with respect to moments and coefficient of variation (CV) at the four sampled depths for each of the plots. Analysis of variance was also conducted by year. The fixed factors were cover crops, tillage and crop rotation. Year and depth were treated as random factors. Given that the CC was planted at the end of the first year (2011), and that its effects could be assessed only in the second (2012) and third (2013) years, the analysis of variance used a two factors (tillage and depth of sampling) factorial design in 2011, and a four factors (depth of sampling, tillage, cover crop, crop rotation) factorial design in 2012 and 2013. Statistical differences were declared to occur at p ≤ 0.05.

3. Results

The results from the first year of study are shown in Table 2. During the first year of study, the only treatment studied was tillage. There was no significant interaction between tillage and depth of sampling. However, there was a main effect of tillage on some macro- and micro-nutrients (Table 2). Nitrate-nitrogen (NO3-N) levels were about 40% greater under CT management compared with NT. Furthermore, P and Fe were about 25% and 4%, respectively, greater in CT plots compared with NT plots. The most abundant essential nutrient on the field was Ca, while Mn was the most abundant micronutrient on the field. Depth of sampling was not significant for any of the nutrients studied. However, most macro-nutrients were numerically greater in the 0–10 cm depth, while micro nutrients were numerically greater in the 10–20 cm depth (Table 2).
The effects of tillage, cover crop and crop rotation on soil nutrients were assessed in the second year of study (2012) by conducting a four factors (tillage, cover crop, crop rotation, depth of sampling) factorial analysis of variance with three way interactions. Table 3 shows the results from the second year of the study. Significant interactions include crop rotation × tillage interaction and crop rotation × tillage × depth of sampling interaction for NH4-N, and cover crop × crop rotation × tillage interaction for Fe (Table 3). Iron (Fe) was greatest under CT with CC and a continuous soybean monoculture.
Apart from these interactions, there were significant main effects of tillage, crop rotation and cover crop on soil nutrients. For example, tillage significantly affected P and S. Tilling the soil caused a 14% and 15% increase in P and S, respectively.
Planting CC is a way to improve soil productivity and reduce nutrient leaching [18]. Results from the current study show that planting cereal rye CC reduced Ca, Mg, NH4-N and Cu by 5%, 8%, 8% and 7%, respectively, compared with NC (Table 3). Depth of sampling was also found to be significant for all nutrients studied (Table 3) and also for soil pH [7]. Please see the discussion session for more detailed explanation of these results.
Soil nutrients responded differently to management practices in the third year, compared with the first two years. The results of the third year of study is showed in Table 4. A four factors factorial analysis of variance with three-way interaction was used to asses these effects. Most of the significant interactions noticed in the second year did not persist into the third year of this study. However, some of these interactions persisted (for example crop rotation × tillage interaction for NH4-N) at different significant levels.
Soil pH significantly affects nutrient availability. Generally, the pH of the experimental field was moderately acidic to neutral (6.6–7.1) after three years of management [7]. Cover crop × crop rotation interaction shows that Ca was greatest under NC with corn/soybean rotation, and lowest under CC with corn/soybean rotation. Crop rotation × tillage interaction on Ca is shown in Figure 1, and it suggests that NT with most of the rotation cycles had the potential for the increased abundance of soil Ca. However, NT with crop rotation had the greatest amount of Ca. The results showed that Ca was significantly lower in continuous soybean plots. Soil Ca was about 9% lower under CC management, compared with NC management (Table 4).
The interaction between crop rotation and tillage was significant for Mg, and it showed that Mg was greatest with NT and soybean/corn rotation and lowest with CT and a soybean monoculture. Tillage improved soil Mg by about 6% compared with no-till management. Soybean/corn rotation had significantly greater Mg, compared with the other rotation managements. Results also show 11% more Mg with NC management compared with CC management (Table 4).
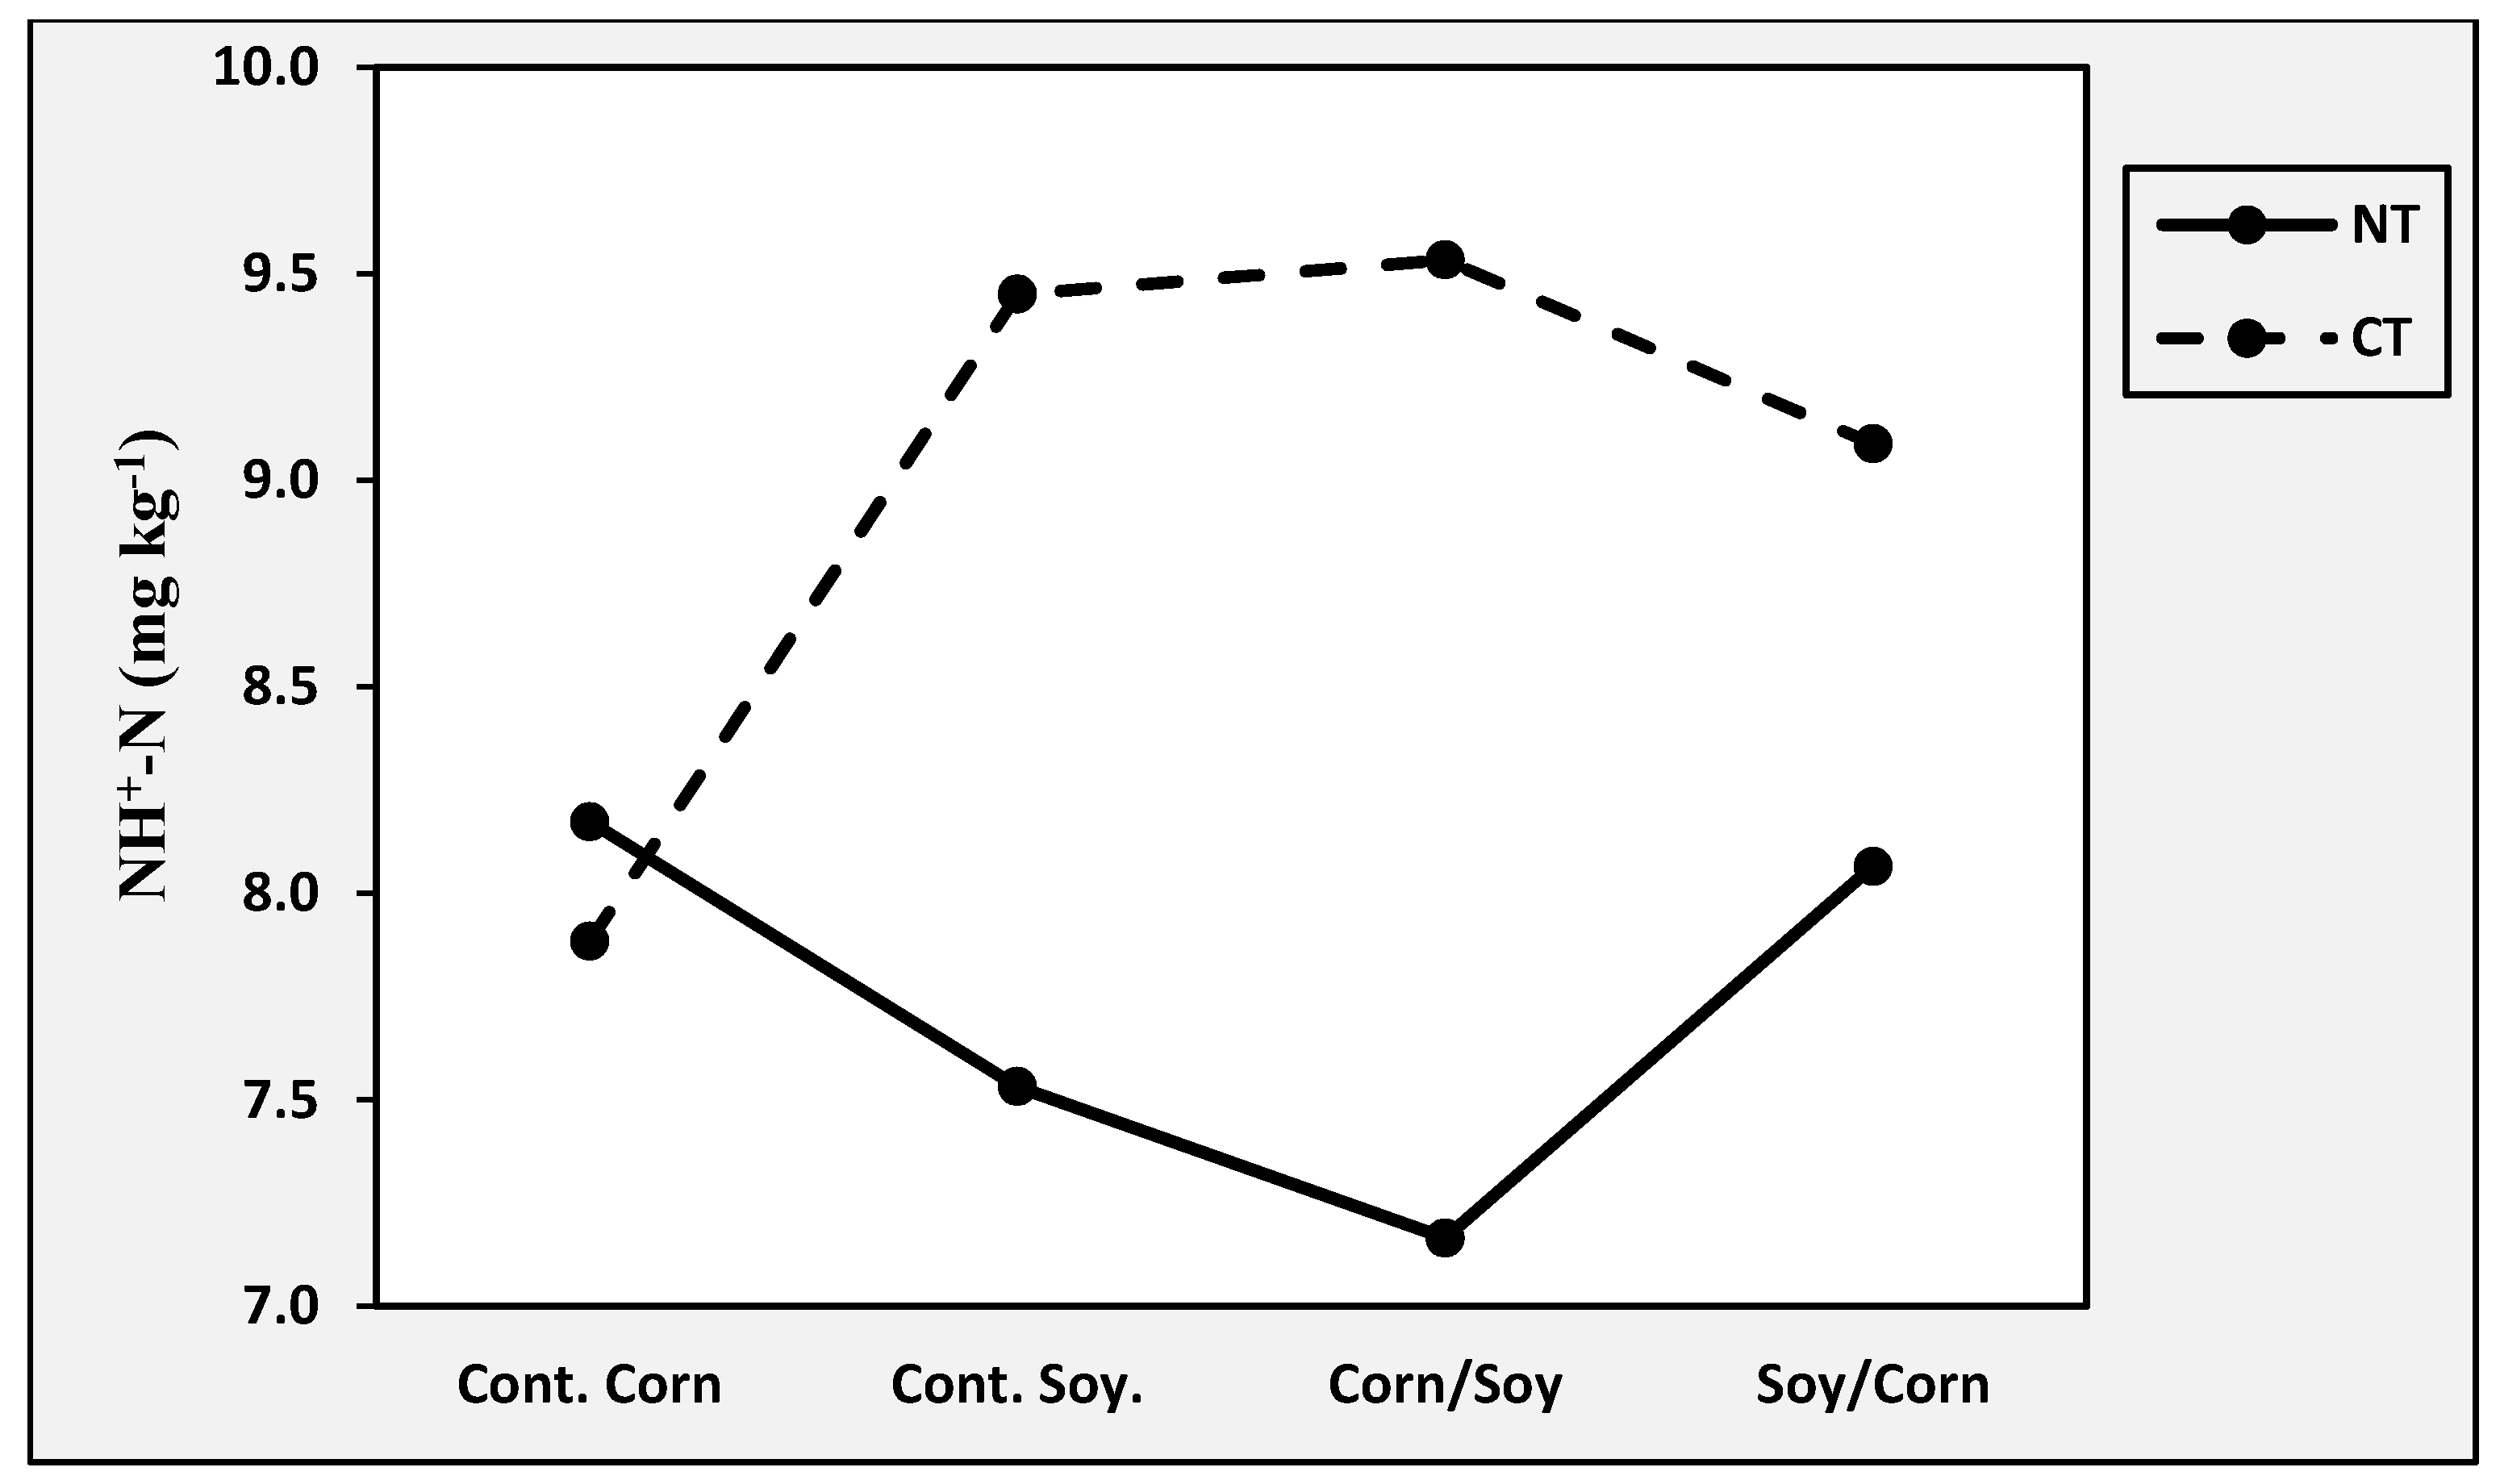
Soil NO3-N was only significantly affected by depth of sampling. It was greatest in the upper 10 cm of the soil and lowest in the 40–60 cm depth. Crop rotation × tillage interaction was significant for NH4-N and it is shown in Figure 2. Soil NH4-N was highest under a combination of CT and corn/soybean rotation. Cover crop × tillage × depth of sampling interaction showed that NH4-N was greatest in the 40–60 cm depth of NC plots with CT and lowest in 10–20 cm depth of NC plots with NT.
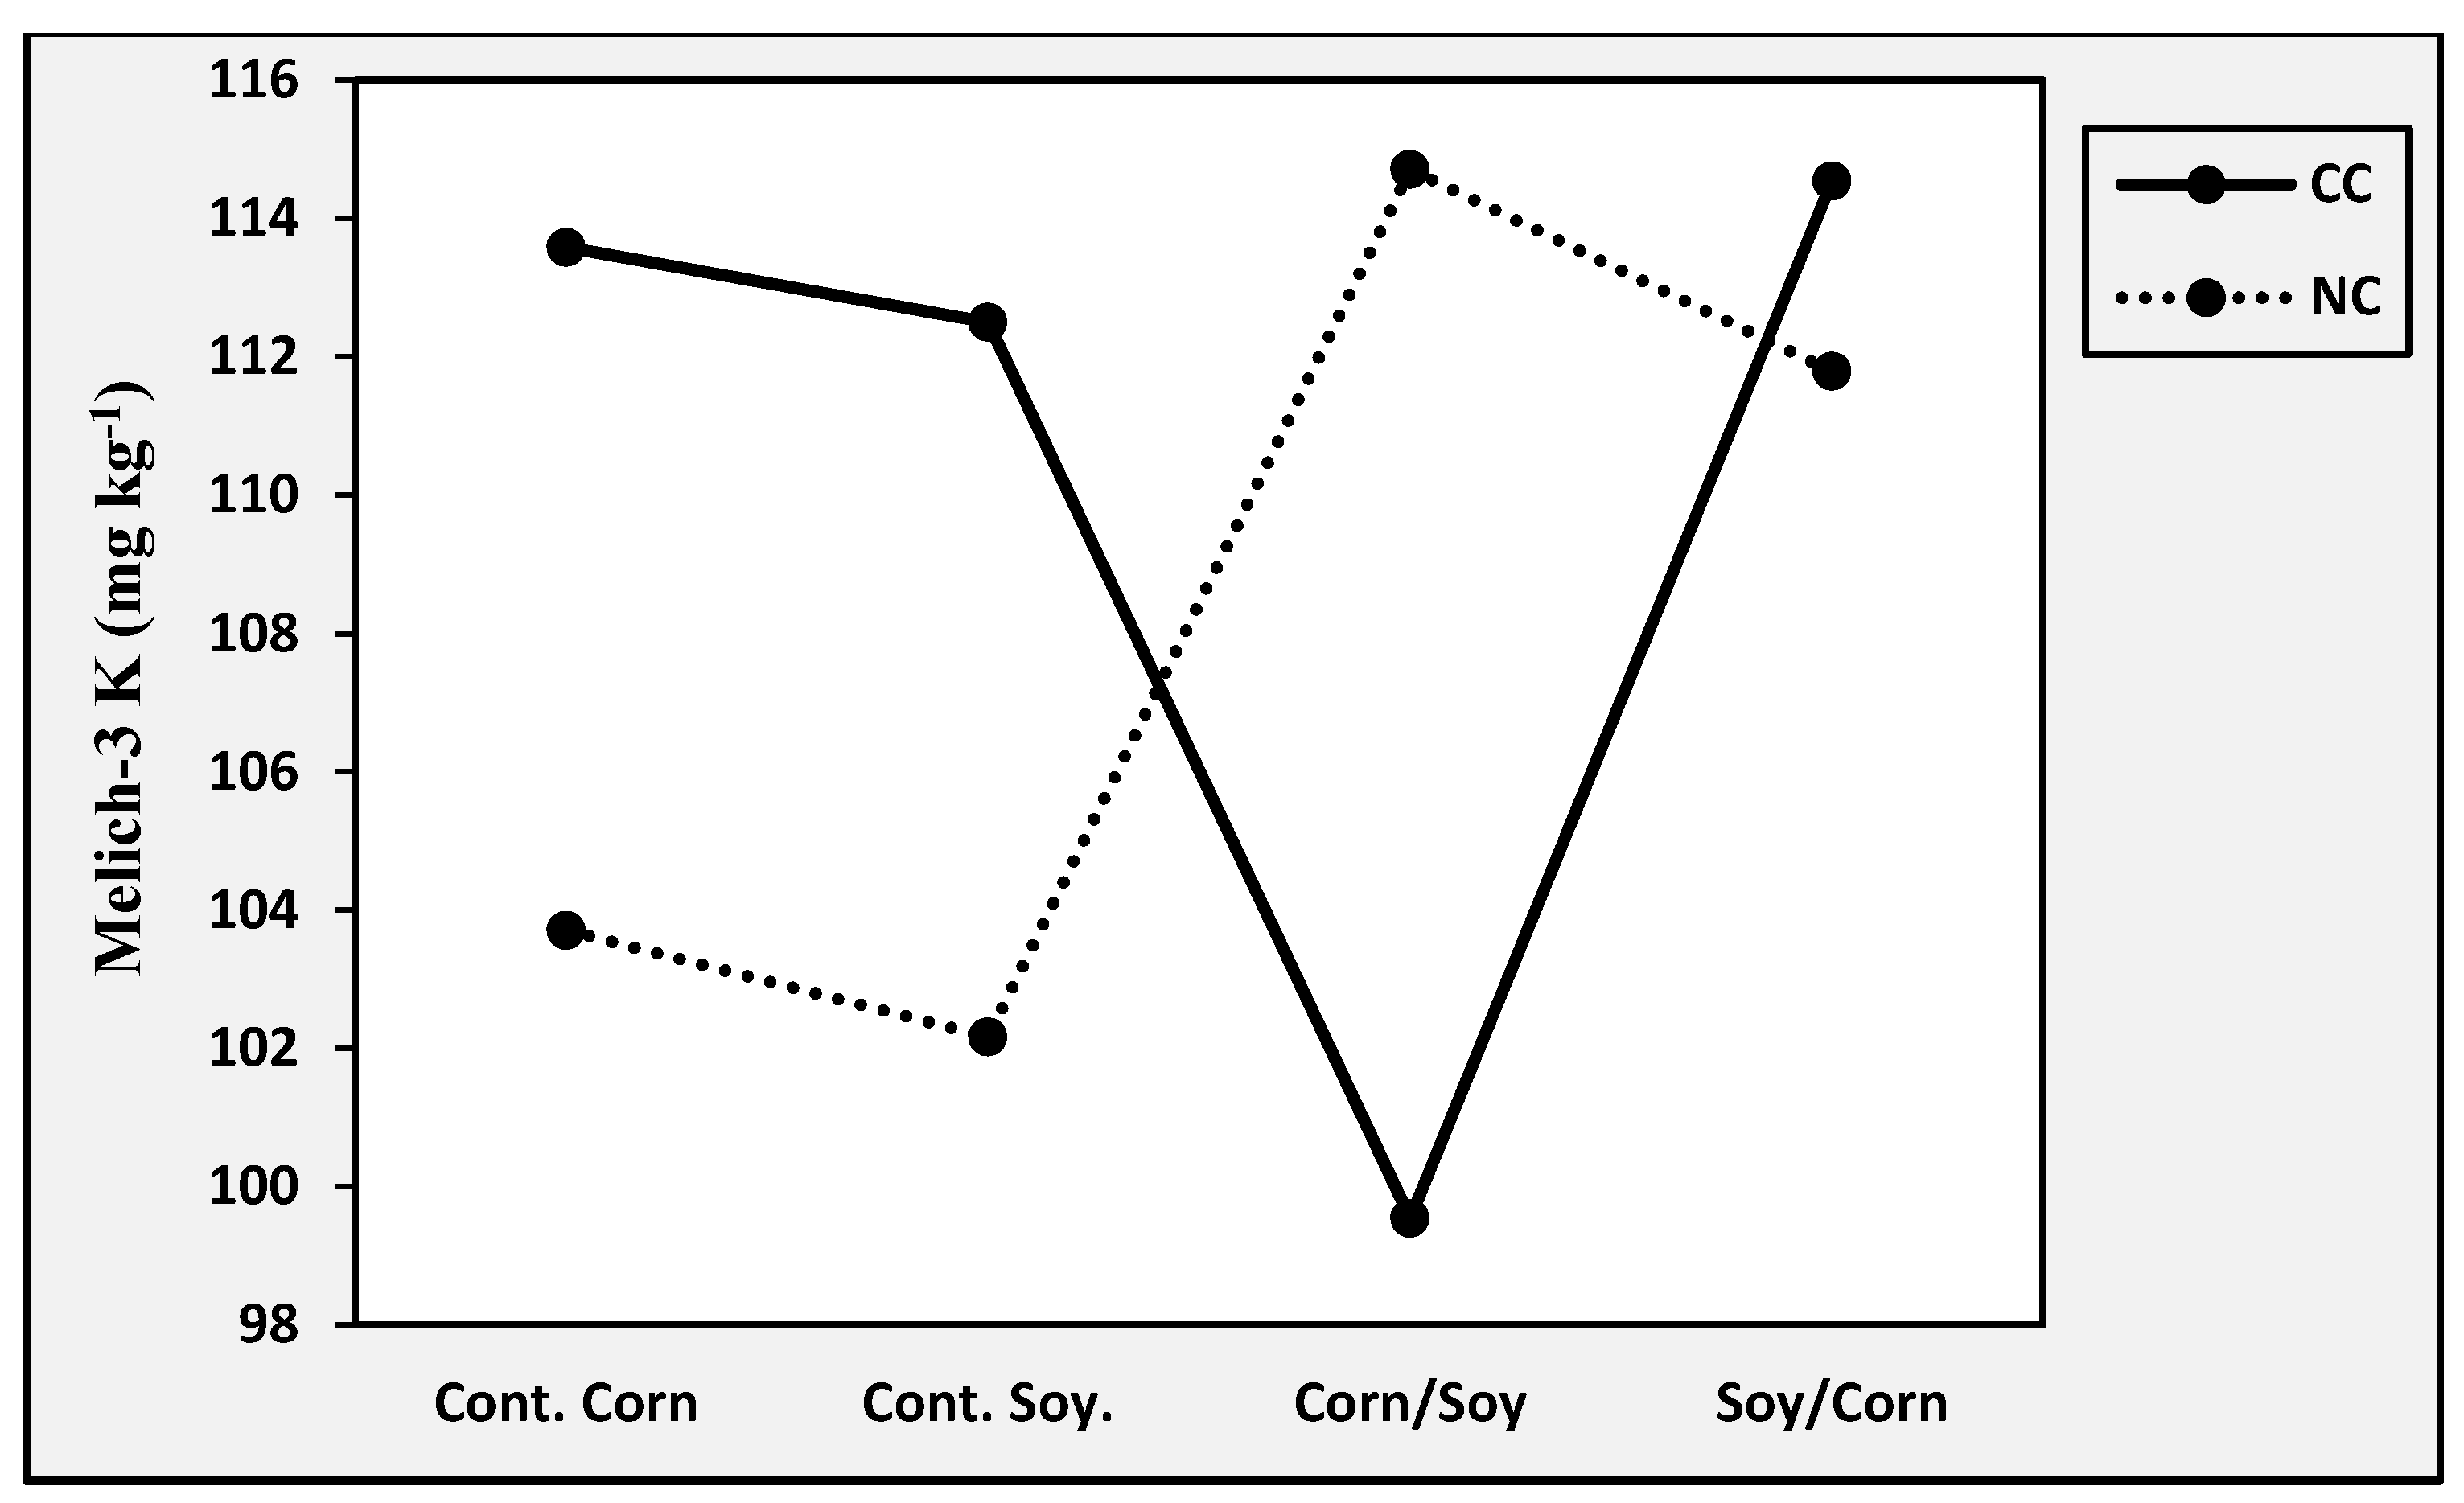
Figure 3 shows the significant effect of cover crop × crop rotation interaction on K. Soil K was highest under a combination of NC and corn/soybean rotation. The availability levels of K under this management were also very similar to that under a combination of CC with a combination of soybean/corn rotation (Figure 3). Crop rotation × tillage interaction showed that K was significantly at its greatest with NT and soybean/corn rotation, compared with the same sequence under CT. The interaction between cover crop, crop rotation and tillage showed that K was greatest under a management combination of CC, continuous soybean and CT and lowest under a management combination of CC, continuous soybean and NT. Soil K was significantly greater in the upper 10 cm and reduced with an increase in sample depth. This will favor plant uptake.
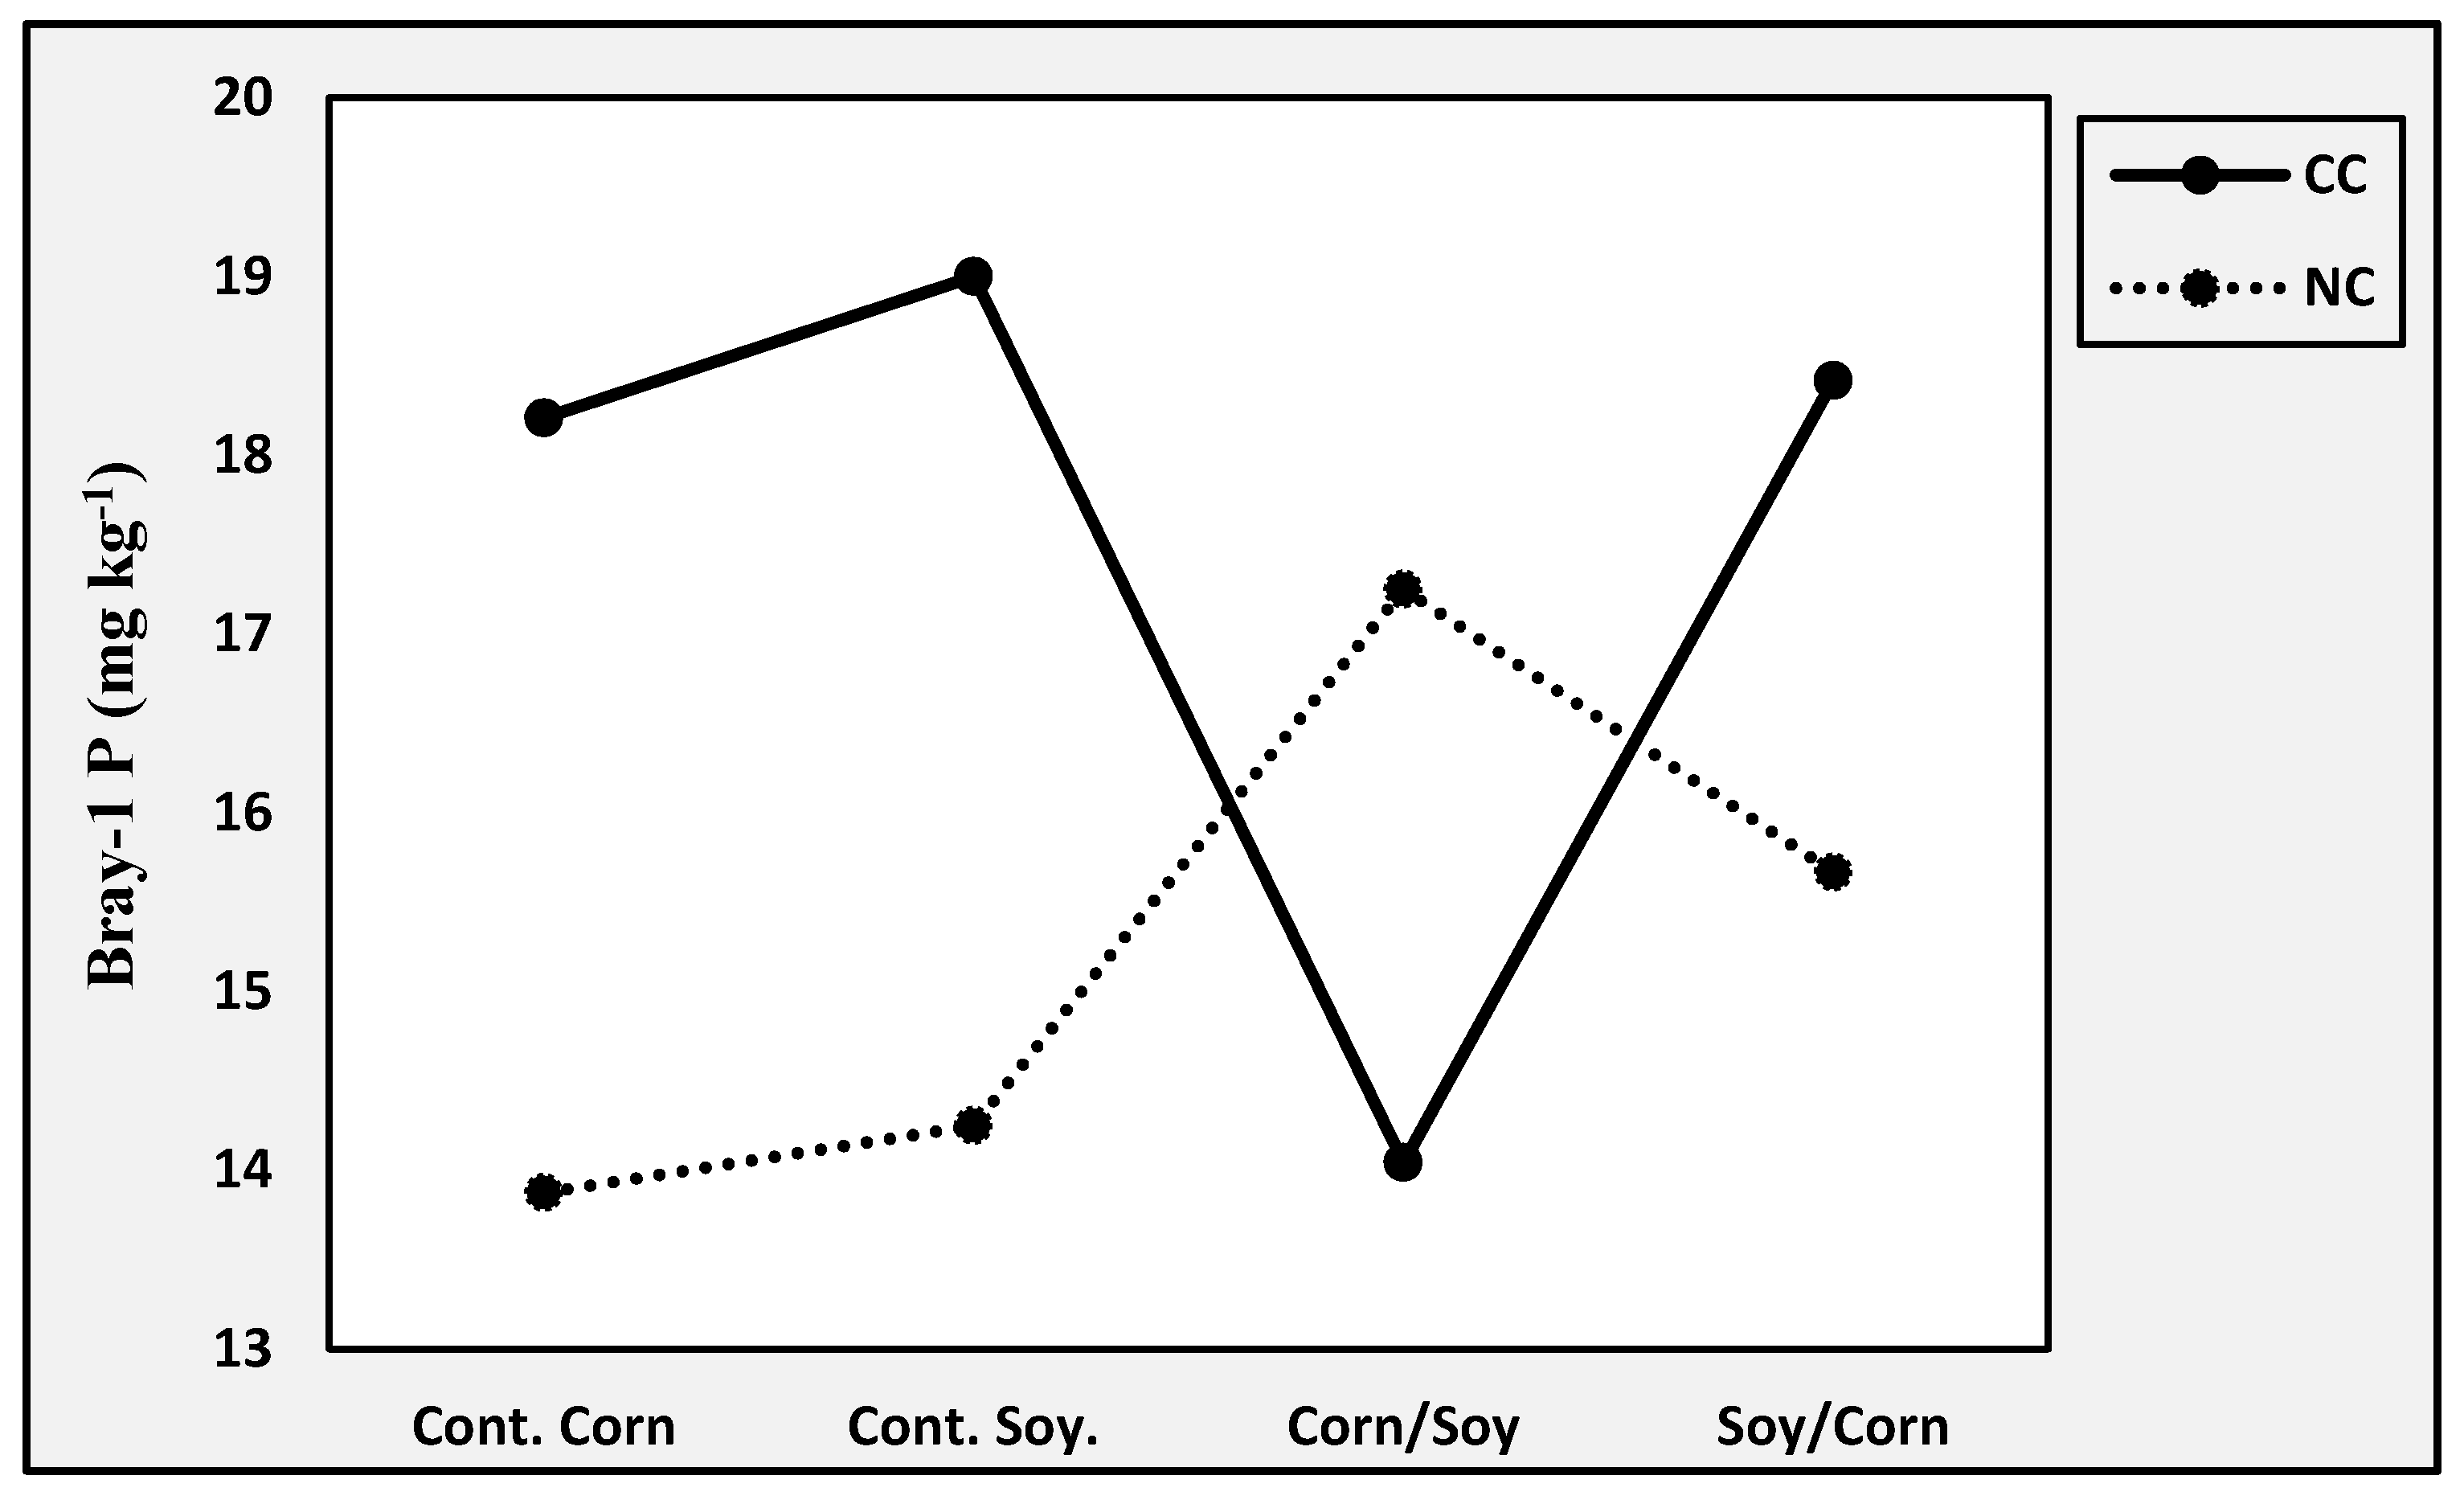
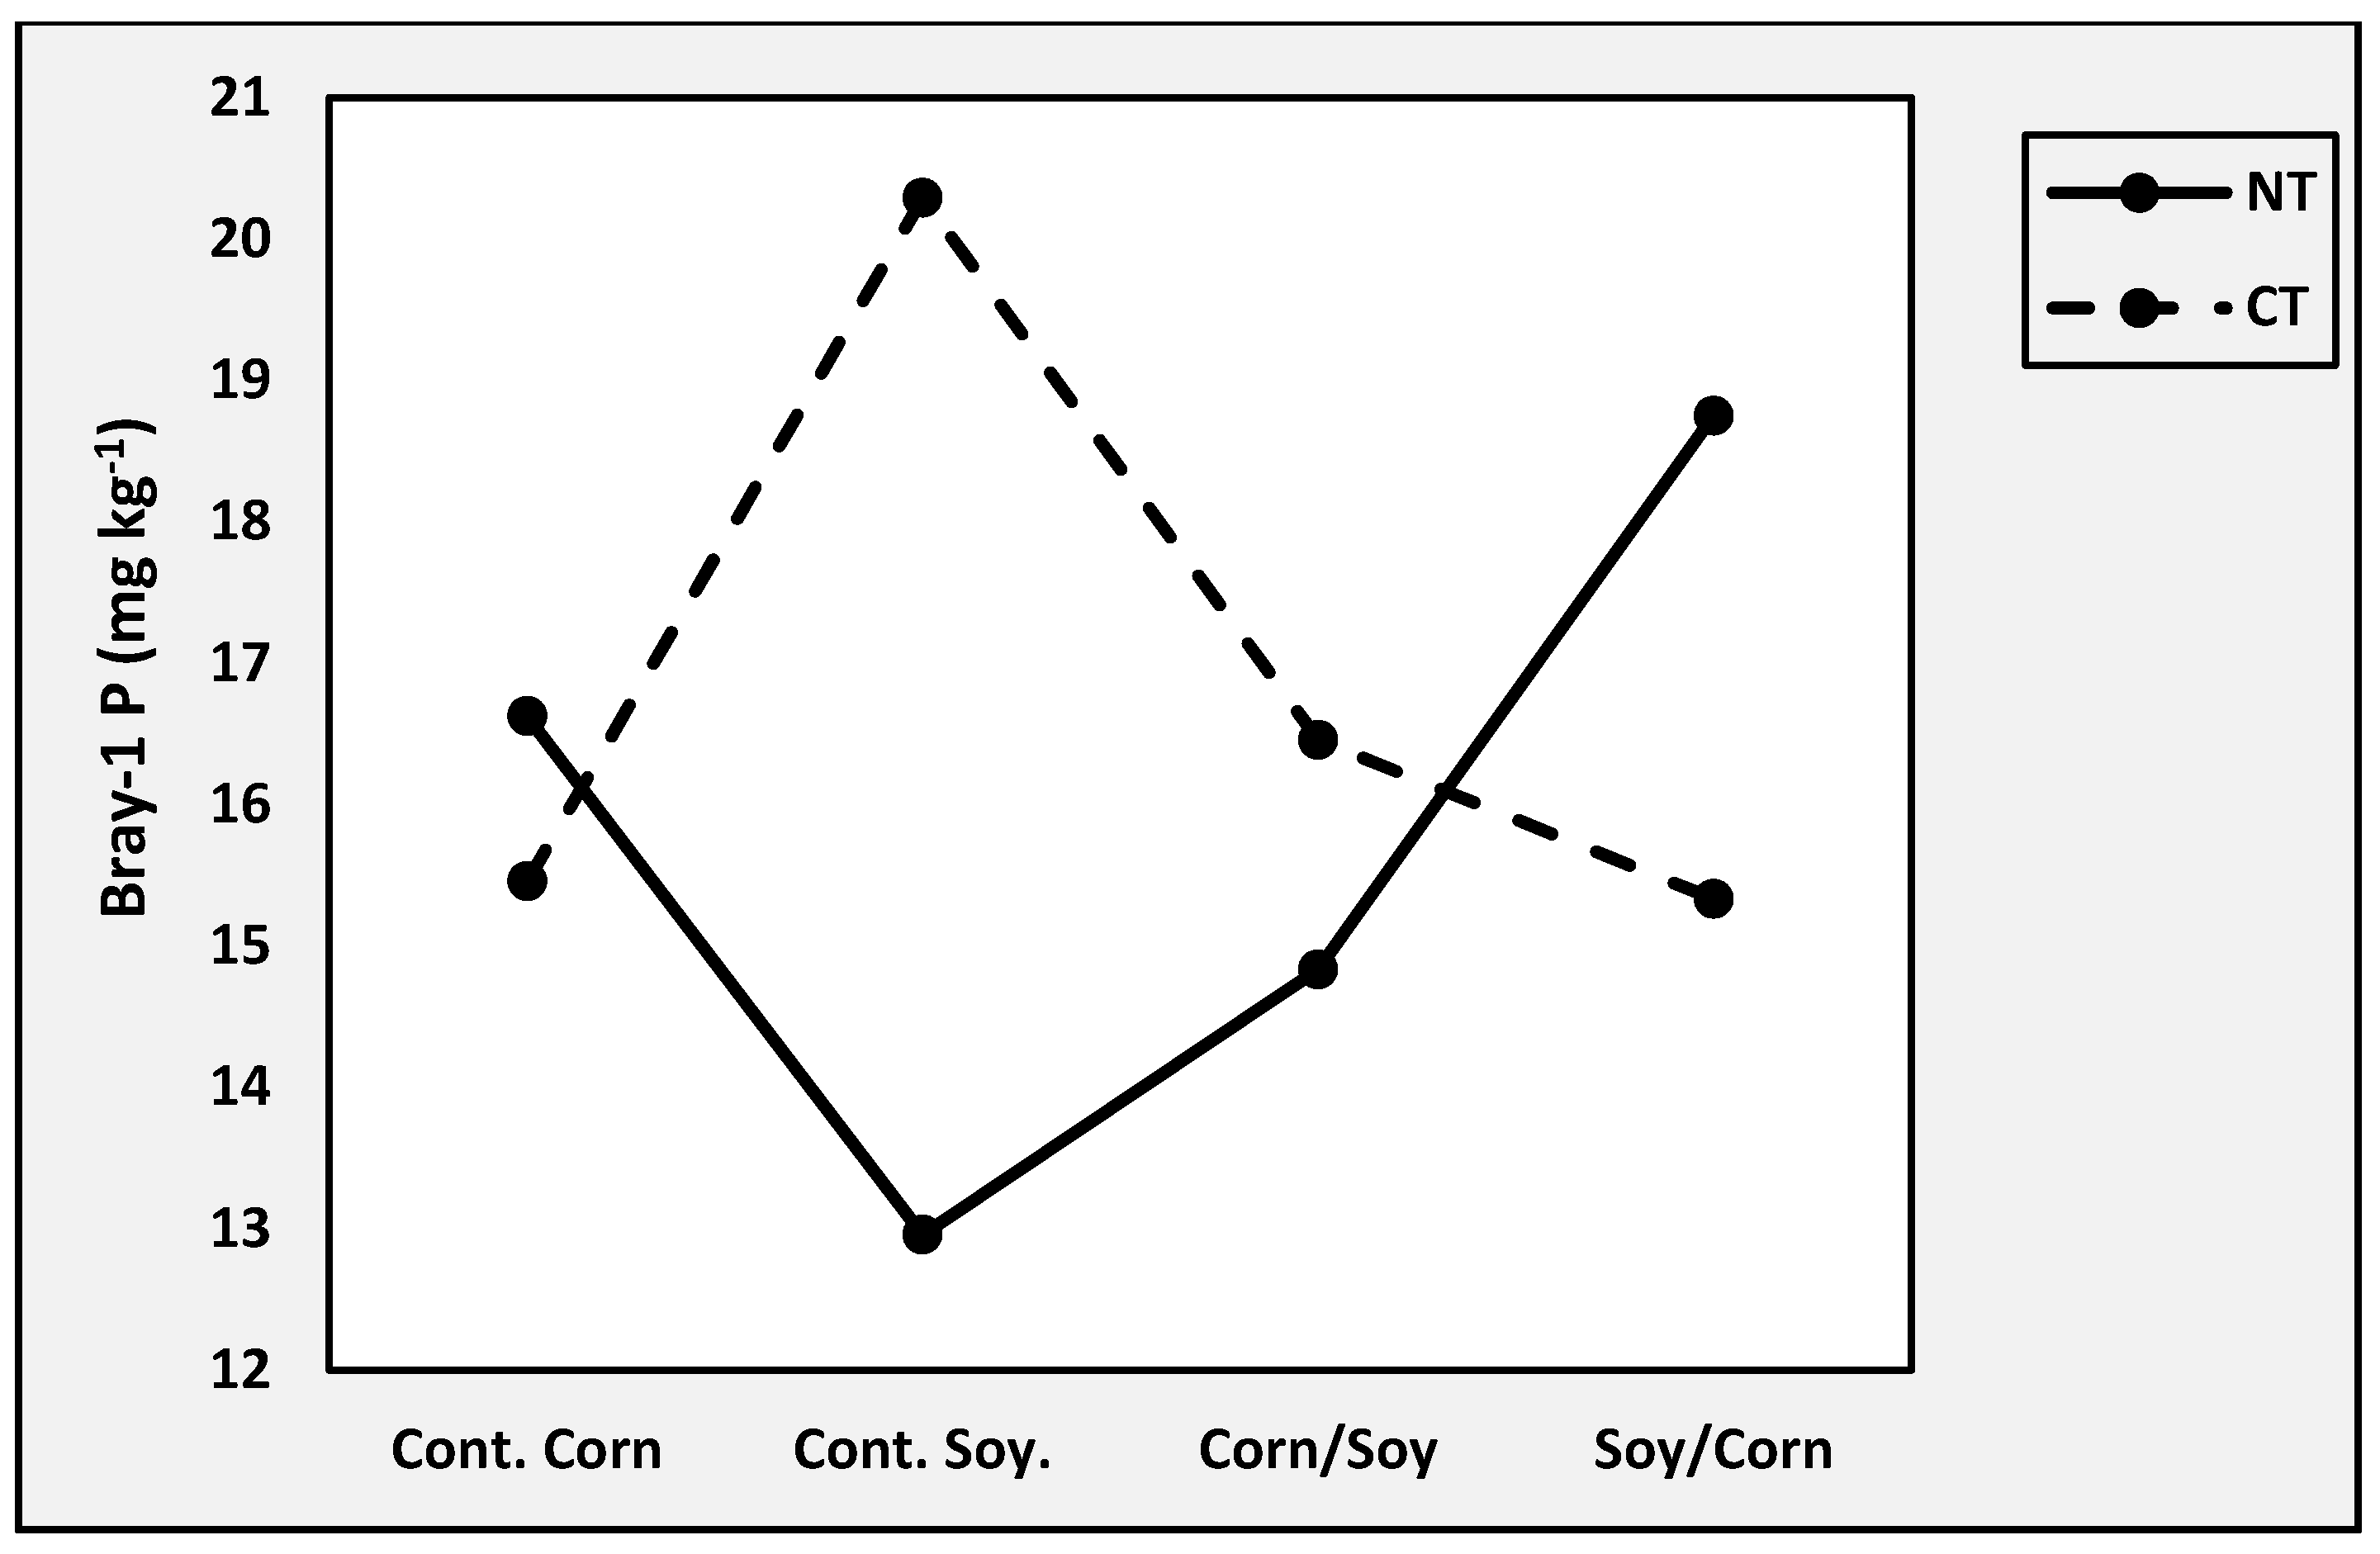
Cover crop × crop rotation interaction and crop rotation × tillage interaction for soil P are shown in Figure 4 and Figure 5, respectively. The interaction between cover crop, crop rotation and tillage show that P was greatest with a management combination of CC, continuous soybean and CT and lowest with a management combination of CC, continuous soybean and NT. Soil P was 12% greater with CC management, compared with NC (Table 4).
The current efforts to reduce the human impact on the climate may lead to SO4 deficiency in the soil, especially in areas that rely on atmospheric inputs. The current study found cover crop × crop rotation interaction, crop rotation × tillage interaction and cover crop × crop rotation × tillage interaction to be significant for soil S (SO4) (Table 4). Soil S was greatest for the cover crop × crop rotation interaction, under a combination of NC and corn/soybean rotation, and least under a combination of NC and continuous corn rotation. For the crop rotation × tillage interaction, S was greatest under the NT management of corn/soybean rotation and least under the NT management of continuous soybean. The interaction between cover crop, crop rotation and tillage showed that a combination of NC, NT with corn/soybean rotation enhanced S, compared to all other management combinations. Soil S was greatest in the upper 10 cm of the soil, and reduced with an increase in soil depth.
Sodium (Na) was only significantly affected by depth of sampling and it was greatest in the upper 10 cm of soil and least in the 20–40 cm depth. Soil Fe and Mn were significantly affected by cover crop and tillage, respectively. Cover crop enhanced soil Fe by 4% compared with NC, while NT improved soil Mn by 9% compared with CT. Both Fe and Mn were greatest in the 10–20 cm depth. In contrast, soil Cu was greatest in the 40–60 cm depth.

4. Discussion

Details of select soil physical and chemical properties during this study can be found in [7,23], respectively. Since the study site was under a 50-year moldboard plow prior to the establishment of the current study, the lack of significant depth effect on soil nutrients could be due to homogenization caused by tillage, especially within the top 20 cm of the soil. The 40% greater NO3-N noticed under CT management compared with NT management in the first year of study could be an environmental problem, under certain conditions. Haruna and Nkongolo (2015) [23] reported slightly more total pore spaces under tillage management, compared with no-till management at the same site. This suggests that, since NO3-N is not adsorbed by most soil colloids and tends to remain within the soil solution, tilling the soil may lead to NO3-N loss from fields into streams with both surface and subsurface runoff. However, this scenario can be mitigated through the timely application of NO3-N. Furthermore, NT can reduce NO3-N loss by reducing NO3-N mineralization from soil organic matter (SOM).
During the first year of study, P was about 25% greater under CT compared with NT. Conversely, Reference [32] reported that total P was greater under NT compared with CT. The contrast between these studies may be due to the time of soil sample collection or site variability. During the current study, soil samples were collected during the spring months, when microbial activity is generally greater than during the fall period, when soil samples were collected during the study conducted by [32]. Thus, by tilling the soil, anaerobic conditions are reduced, porosity is increased [15,23,33], and this can increase microbial activity and P mineralization [34]. Phosphorus mineralization from organic matter may have resulted in the higher P under CT, compared with the NT management noticed in the current study.
During the second year of this study, NH4-N was greatest when the field was under CT management with a monoculture of continuous corn, compared with any other management for the crop rotation × tillage interaction (Table 3). Crop rotation × tillage × depth of sampling interaction showed that NH4-N was greatest in the 0–10 cm depth of tilled plots planted to continuous corn. The interactions reported above suggest that corn residue burial through tillage can further enhance the availability of NH4-N. However, this may only occur under a corn monoculture, as demonstrated in the current study.
There were also main effects of CC on soil nutrients in the second year of study. The lower Ca, Mg, NH4-N and Cu under CC management suggest that the loss of these nutrients from the soil can be greatly reduced. These nutrients can be recycled and made available during the next growing cycle, through the incorporation of the CC residues into the soil. Results also show that CC was able to reduce the susceptibility of NH4-N runoff by about 8% (Table 3). Other researchers, e.g., [21,35,36,37], have also reported similar findings.
During the third year of study, depth of sampling was found to be significant for soil pH with the soil being more acidic in the upper 10 cm of the soil (see [7]). This suggests that, without mixing the soil through tillage, the combined effects of nitrogen oxidation, residue decomposition and rainfall are concentrated in the upper 10 cm of the soil.
Calcium and Mg are two of the most abundant cations in most soils [38]. They have a major influence on various ecosystems in their exchangeable and weatherable form, by counteracting soil and water acidification. The lower Ca under continuous soybean management may have resulted for the greater uptake of this nutrient by dicots, as compared to monocots. Results from the current study showed an inverse relationship between Ca and Mg and soil depth (Table 4). This may be because most plant available Ca and Mg are weathered from minerals like dolomite, biotite and hornblende [38].
Soil NH4-N was 14% greater under CT management, compared with NT management (Table 4), probably due to increased urea mineralization. Tillage has been reported to aerate the soil [23], increase water evaporation and soil temperature [39]. These conditions can have a positive influence on urea mineralization. This contrasts with the results of [40,41,42], who all reported significant loss of NH4-N with tillage. Soil NH4-N was significantly greater at the deeper depths of sampling (Table 4).
Climate variability has necessitated adaptation of agriculture to suit the changing climate, and this includes nutrient management, especially during droughts. As an essential macronutrient, K helps regulate stomatal opening [38], which may be beneficial for crop production during drier growing seasons. The results of the interaction between crop rotation × tillage show that NT and soybean/corn rotation can improve K availability. This contrasts with the results of [43], which reported higher potassium availability under corn-wheat and corn-wheat-soybean rotations under CT. However, the result on K in the current study is similar to the findings of [44].
Table 4 shows that CC improved P by 12%, compared with NC management. The reason for the lower P from NC management could be that P loss is mostly in the particulate form, which is lost with soil sediments. Cover crops have been reported to reduce sediment loss [45]. P is an essential nutrient and the global decline in its native occurrence, so farmers and managers rely on synthetic fertilizers for P input. Results from the current study suggest that CC can reduce the out-of-pocket cost of fertilizers to farmers. Generally, micronutrients were slightly greater under NT management. Franzluebbers and Hons (1996) [41] reported similar findings.
Soil Ca and Mg levels decreased from the first year of study to the third year of study. This trend was true, regardless of management. For example, under NT management, Ca levels were 5% greater in 2011 compared with 2012, and 16% greater in 2011 compared with 2013. Furthermore, under CC management, Mg levels were 13% greater in 2012, compared with 2013. However, NO3-N did not follow this trend. Nitrate-nitrogen reduced from 2011 to 2012, but increased from 2012 to 2013. This is presumed to be due to CC management. Under NC management, NO3-N levels were 30% greater in 2013, compared with 2012. Under CC management, NO3-N levels were 32% greater in 2013 compared with 2012. Cereal rye CC was established, in the current study, after soil sample collection in 2011 and so its effects were felt in 2012. The results show that CC was able to scavenge NO3-N in 2012, and return some of the NO3-N to the soil in 2013 with CC residue return
One important finding from the current study is the complexity of the interacting factors that influence nutrient availability. This complexity is made more difficult by their unpredictability over the three years of study. For example, most interaction effects were not consistent for any nutrient throughout the study. This means that these interaction effects are very difficult to predict. Further studies are needed on possible ways of predicting interaction effects. This will greatly increase the ability to predict the sustainability and profitability of current crop production systems.

5. Conclusions

This study was conducted to evaluate the effects of tillage, cover crop and crop rotation on soil nutrients for three years on a silt-loam soil in central Missouri. The results show that, during the first year, CT improved P by 25%, compared with NT. This was probably due to higher P mineralization due to increased aeration. During the second year of this study, the results show that NH4--N was greatest when the field was tilled with a monoculture of continuous corn, compared with any other treatment for the interaction between tillage and crop rotation. During the third year of the study, the cover crop × crop rotation × tillage interaction shows that P was greatest with a combination of CC, continuous soybean and CT managements. In general, soil nutrients responded differently to tillage, cover crop and crop rotation, thus disputing our hypothesis.

Author Contributions

Conceptualization, N.V.N.; Formal analysis, S.I.H.; Funding acquisition, N.V.N.; Investigation, S.I.H.; Writing—original draft, S.I.H.; Writing—review & editing, N.V.N. and S.I.H. All authors have read and agreed to the published version of the manuscript.

Funding

This research was funded by USDA-NIFA Award No. 2011-68002-30190. The APC was funded by Middle Tennessee State University.

Conflicts of Interest

The authors declare no conflict of interest.

References

  1. Lal, R.; Kimble, J.M. Conservation tillage for carbon sequestration. Nutr. Cycl. Agroecosyst. 1997, 49, 243–253. [Google Scholar] [CrossRef]
  2. Bindraban, P.S.; van der Velde, M.; Ye, L.; van den Berg, M.; Materchera, S.; Kiba, D.I.; Tamene, L.; Ragnarsdottir, K.V.; Jongschaap, R.; Hoogmoed, M.; et al. Assessing the impact of soil degradation on food production. Curr. Opin. Environ. Sustain. 2012, 4, 478–488. [Google Scholar] [CrossRef]
  3. Llewellyn, R.S.; D’Emden, F.H.; Kuehne, G. Extensive use of no-tillage in grain growing regions of Australia. Field Crop. Res. 2012, 132, 204–212. [Google Scholar] [CrossRef]
  4. Hendrix, P.F.; Parmelee, R.W.; Crossley, D.A., Jr.; Coleman, D.C.; Odum, E.P.; Groffman, P.M. Detritus food webs in conventional and no-tillage agroecosystems. BioScience 1986, 36, 374–380. [Google Scholar] [CrossRef]
  5. Prinsloo, M.A.; Wiltshire, G.H.; du Preez, C.C. Loss of nitrogen fertility and its restoration in some Orange Free State soils. S. Afr. J. Plant Soil 1990, 7, 55–61. [Google Scholar] [CrossRef]
  6. Christopher, S.F.; Lal, R. Nitrogen management affects carbon sequestration in North American cropland soils. Crit. Rev. Plant Sci. 2007, 26, 45–64. [Google Scholar] [CrossRef]
  7. Haruna, S.I.; Nkongolo, N.V. Tillage, cover crop and crop rotation effects on selected soil chemical properties. Sustainability 2019, 11, 2770. [Google Scholar] [CrossRef] [Green Version]
  8. Thomas, G.A.; Dalal, R.C.; Standley, J. No-till effects on organic matter, pH, cation exchange capacity and nutrient distribution in a Luvisol in the semi-arid subtropics. Soil Tillage Res. 2007, 94, 295–304. [Google Scholar] [CrossRef]
  9. Omonode, R.A.; Gal, A.; Stott, D.E.; Abney, T.S.; Vyn, T.J. Short-term versus continuous chisel and no-till effects on soil carbon and nitrogen. Soil Sci. Soc. Am. J. 2006, 70, 419–428. [Google Scholar] [CrossRef] [Green Version]
  10. Omay, A.B.; Rice, C.W.; Maddux, L.D.; Gordon, W.B. Changes in soil microbial and chemical properties under long-term crop rotation and fertilization. Soil Sci. Soc. Am. J. 1997, 61, 1672–1680. [Google Scholar] [CrossRef]
  11. Sainju, U.M.; Whitehead, W.F.; Singh, B.P. Agricultural management practices to sustain crop yields and improve soil and environmental qualities. Sci. World J. 2003, 3, 768–789. [Google Scholar] [CrossRef] [Green Version]
  12. Gregorich, E.G.; Liang, B.C.; Ellert, B.H.; Drury, C.F. Fertilization effects on soil organic matter turnover and corn residue c storage. Soil Sci. Soc. Am. J. 1996, 60, 472–487. [Google Scholar] [CrossRef]
  13. Zaibon, S.; Anderson, S.H.; Thompson, A.L.; Kitchen, N.R.; Gantzer, C.J.; Haruna, S.I. Soil water infiltration affected by topsoil thickness in a row crop and switchgrass production systems. Geoderma 2017, 286, 46–53. [Google Scholar] [CrossRef]
  14. Cercioglu, M.; Anderson, S.H.; Udawatta, R.P.; Haruna, S.I. Effects of cover crop and biofuel crop management on computed tomography-measured pore paramters. Geoderma 2018, 319, 80–88. [Google Scholar] [CrossRef]
  15. Haruna, S.I.; Nkongolo, N.V.; Anderson, S.H.; Eivazi, F.; Zaibon, S. In situ infiltration as influenced by cover crop and tillage management. J. Soil Water Conserv. 2018, 73, 164–172. [Google Scholar] [CrossRef]
  16. Tilman, D.; Cassman, K.G.; Matson, P.A.; Naylor, R.; Polasky, S. Agricultural sustainability and intensive production practices. Nature 2002, 418, 671–677. [Google Scholar] [CrossRef]
  17. Wyland, L.J.; Jackson, L.E.; Chaney, W.E.; Klonsky, K.; Koike, S.T.; Kimple, B. Winter cover crops in a vegetable cropping system: Impacts on nitrate leaching, soil water, crop yield, pests and management costs. Agric. Ecosyst. Environ. 1996, 59, 1–17. [Google Scholar] [CrossRef]
  18. Dabney, S.M.; Delgado, J.A.; Reeves, D.W. Using winter cover crops to improve soil and water quality. Commun. Soil Sci. Plant Anal. 2001, 32, 1221–1250. [Google Scholar] [CrossRef]
  19. Reddy, K.N.; Zablotowicz, R.M.; Locke, M.A.; Koger, C.H. Cover crop, tillage, and herbicide effects on weeds, soil properties, microbial populations, and soybean yield. Weed Sci. 2003, 51, 987–994. [Google Scholar] [CrossRef]
  20. Gomez, J.A.; Guzman, M.G.; Giraldez, J.V.; Fereres, E. The influence of cover crops and tillage on water and sediment yield, and on nutrient, and organic matter losses in an olive orchard on a sandy loam soil. Soil Tillage Res. 2009, 106, 137–144. [Google Scholar] [CrossRef] [Green Version]
  21. Abdollahi, L.; Munkholm, L.J. Tillage systems and cover crop effects on soil quality: I. Chemical, mechanical, and biological properties. Soil Sci. Soc. Am. J. 2014, 78, 262–270. [Google Scholar] [CrossRef]
  22. Kladivko, E.J.; Helmers, M.J.; Abendroth, L.J.; Herzmann, D.; Lal, R.; Castellano, M.J.; Mueller, D.S.; Sawyer, J.E.; Anex, R.P.; Arritt, R.W.; et al. Standard research protocols enable transdisciplinary research of climate variation impacts in corn production systems. J. Soil Water Conserv. 2014, 69, 532–542. [Google Scholar] [CrossRef] [Green Version]
  23. Haruna, S.I.; Nkongolo, N.V. Effects of tillage, rotation and cover crop on the physical properties of a silt-loam soil. Int. Agrophys. 2015, 29, 137–145. [Google Scholar] [CrossRef]
  24. Haruna, S.I.; Nkongolo, N.V. Variability of soil physical properties in a clay-loam soil and its implication on soil management practices. Int Sch Res Notices. 2013, 2013, 1–8. [Google Scholar] [CrossRef] [Green Version]
  25. Haruna, S.I.; Nkongolo, N.V. Spatial and fractal characterization of soil chemical properties and nutrients across depths in a clay-loam soil. Commun Soil Sci Plant Anal. 2014, 45, 2305–2318. [Google Scholar] [CrossRef]
  26. Peters, J.B.; Nathan, N.V.; Laboski, C.A.M. pH and lime requirement. In Recommended Chemical Soil Test Procedures for the North Central Region; Missouri Agricultural Experiment Station SB 1001: Columbia, MO, USA, 2015; pp. 16–22. [Google Scholar]
  27. Schulte, E.E.; Hopkins, B.G. Estimation of soil organic matter by weight Loss-On Ignition. In Soil Organic Matter: Analysis and Interpretation; Magdoff, F.R., Tabatabai, M.A., Hanlon, E.A., Jr., Eds.; Special Publication NO. 46 Soil Science Society of America: Madison, WI, USA, 1996; pp. 21–32. [Google Scholar]
  28. Gelderman, R.H.; Beegle, D. Nitrate-nitrogen. In Recommended Chemical Soil Test Procedures for the North Central Region; Missouri Agricultural Experiment Station SB 1001: Columbia, MO, USA, 2015; pp. 23–26. [Google Scholar]
  29. Franzen, D.W. Sulfate-sulfur. In Recommended Chemical Soil Test Procedures for the North Central Region; Missouri Agricultural Experiment Station SB 1001: Columbia, MO, USA, 2015; pp. 39–44. [Google Scholar]
  30. Mehlich, A. Mehlich-3 soil test extractant: A modification of Mehlich-2 extractant. Commun. Soil Sci. Plant Anal. 1984, 15, 1409–1416. [Google Scholar] [CrossRef]
  31. Bray, R.H.; Kurtz, L.T. Determination of total, organic and available forms of phosphorus in soils. Soil Sci. 1945, 59, 39–45. [Google Scholar] [CrossRef]
  32. Weil, R.R.; Benedetto, P.W.; Sikora, L.J.; Bandel, V.A. Influence of tillage practices on phosphorus distribution and forms in three Ultisols. Soil Sci. Soc. Am. J. 1988, 80, 503–509. [Google Scholar] [CrossRef]
  33. Haruna, S.I.; Anderson, S.H.; Nkongolo, N.V.; Zaibon, S. Soil hydraulic properties: Influence of tillage and cover crops. Pedosphere 2018, 28, 430–442. [Google Scholar] [CrossRef]
  34. Spohn, M.; Kuzyakov, Y. Phosphorus mineralization can be driven by microbial need for carbon. Soil Biol. Biochem. 2013, 61, 69–75. [Google Scholar] [CrossRef]
  35. McCracken, D.V.; Smith, M.S.; Grove, J.H.; Blevins, R.L.; MacKown, C.T. Nitrate Leaching as Influenced by Cover Cropping and Nitrogen Source. Soil Sci. Soc. Am. J. 1994, 58, 1476–1490. [Google Scholar] [CrossRef]
  36. Jordan, J.L.; Morgan, S.L.; Elnagheeb, A.H. An Economic Analysis of Cover Crop Use in Georgia to Protect Groundwater Quality; Research Bulletin #419; University of Georgia, College of Agriculture and Environmental Sciences: Athens, GA, USA, 1994; Volume 13. [Google Scholar]
  37. Tonitto, C.; David, M.B.; Drinkwater, L.E. Replacing bare fallows with cover crops in fertilizer-intensive cropping systems: A meta-analysis of crop yield and N dynamics. Agric. Ecosyst. Environ. 2006, 112, 58–72. [Google Scholar] [CrossRef]
  38. Brady, N.C.; Weil, R.R. The Nature and Properties of Soils, 14th ed.; Prentice-Hall Inc.: Upper Saddle River, NJ, USA, 2008. [Google Scholar]
  39. Fabrizzi, K.P.; Garcia, F.O.; Costa, J.L.; Picone, L.I. Soil water dynamics, physical properties and corn and wheat responses to minimum and no-tillage systems in the southern Pampas of Argentina. Soil Tillage Res. 2015, 81, 57–69. [Google Scholar] [CrossRef]
  40. Franzluebbers, A.J.; Hons, F.M.; Zuberer, D.A. Tillage and crop effects on seasonal soil carbon and nitrogen dynamics. Soil Sci. Soc. Am. J. 1995, 59, 1618–1630. [Google Scholar] [CrossRef]
  41. Franzluebbers, A.J.; Hons, F.M. Soil-profile distribution of primary and secondary plant-available nutrients under conventional and no tillage. Soil Tillage Res. 1996, 39, 229–239. [Google Scholar] [CrossRef]
  42. Martin-Rueda, I.; Muñoz-Guerra, L.M.; Yunta, F.; Esteban, E.; Tenorio, J.L.; Lucena, J.J. Tillage and crop rotation effects on barley yield and soil nutrients on a Calciortidic Haploxeralf. Soil Tillage Res. 2007, 92, 1–9. [Google Scholar] [CrossRef]
  43. Edwards, J.H.; Wood, C.W.; Thurlow, D.L.; Ruf, M.E. Tillage and crop rotation effects on fertility status of a Hapludult soil. Soil Sci. Soc. Am. J. 1992, 56, 1577–1589. [Google Scholar] [CrossRef]
  44. Sharpley, A.N.; Smith, S.J. Effects of cover crops on surface water quality. In Cover Crops for Clean Water; Hargrove, W.I., Ed.; Soil and Water Conservation Society: Ankeny, IA, USA, 1991; pp. 41–49. [Google Scholar]
  45. Zhu, J.C.; Gantzer, C.J.; Anderson, S.H.; Alberts, E.E.; Beuselinck, P.R. Runoff, soil, and dissolved nutrient losses from no-till soybean with winter cover crops. Soil Sci. Soc. Am. J. 1989, 53, 1210–1218. [Google Scholar] [CrossRef]
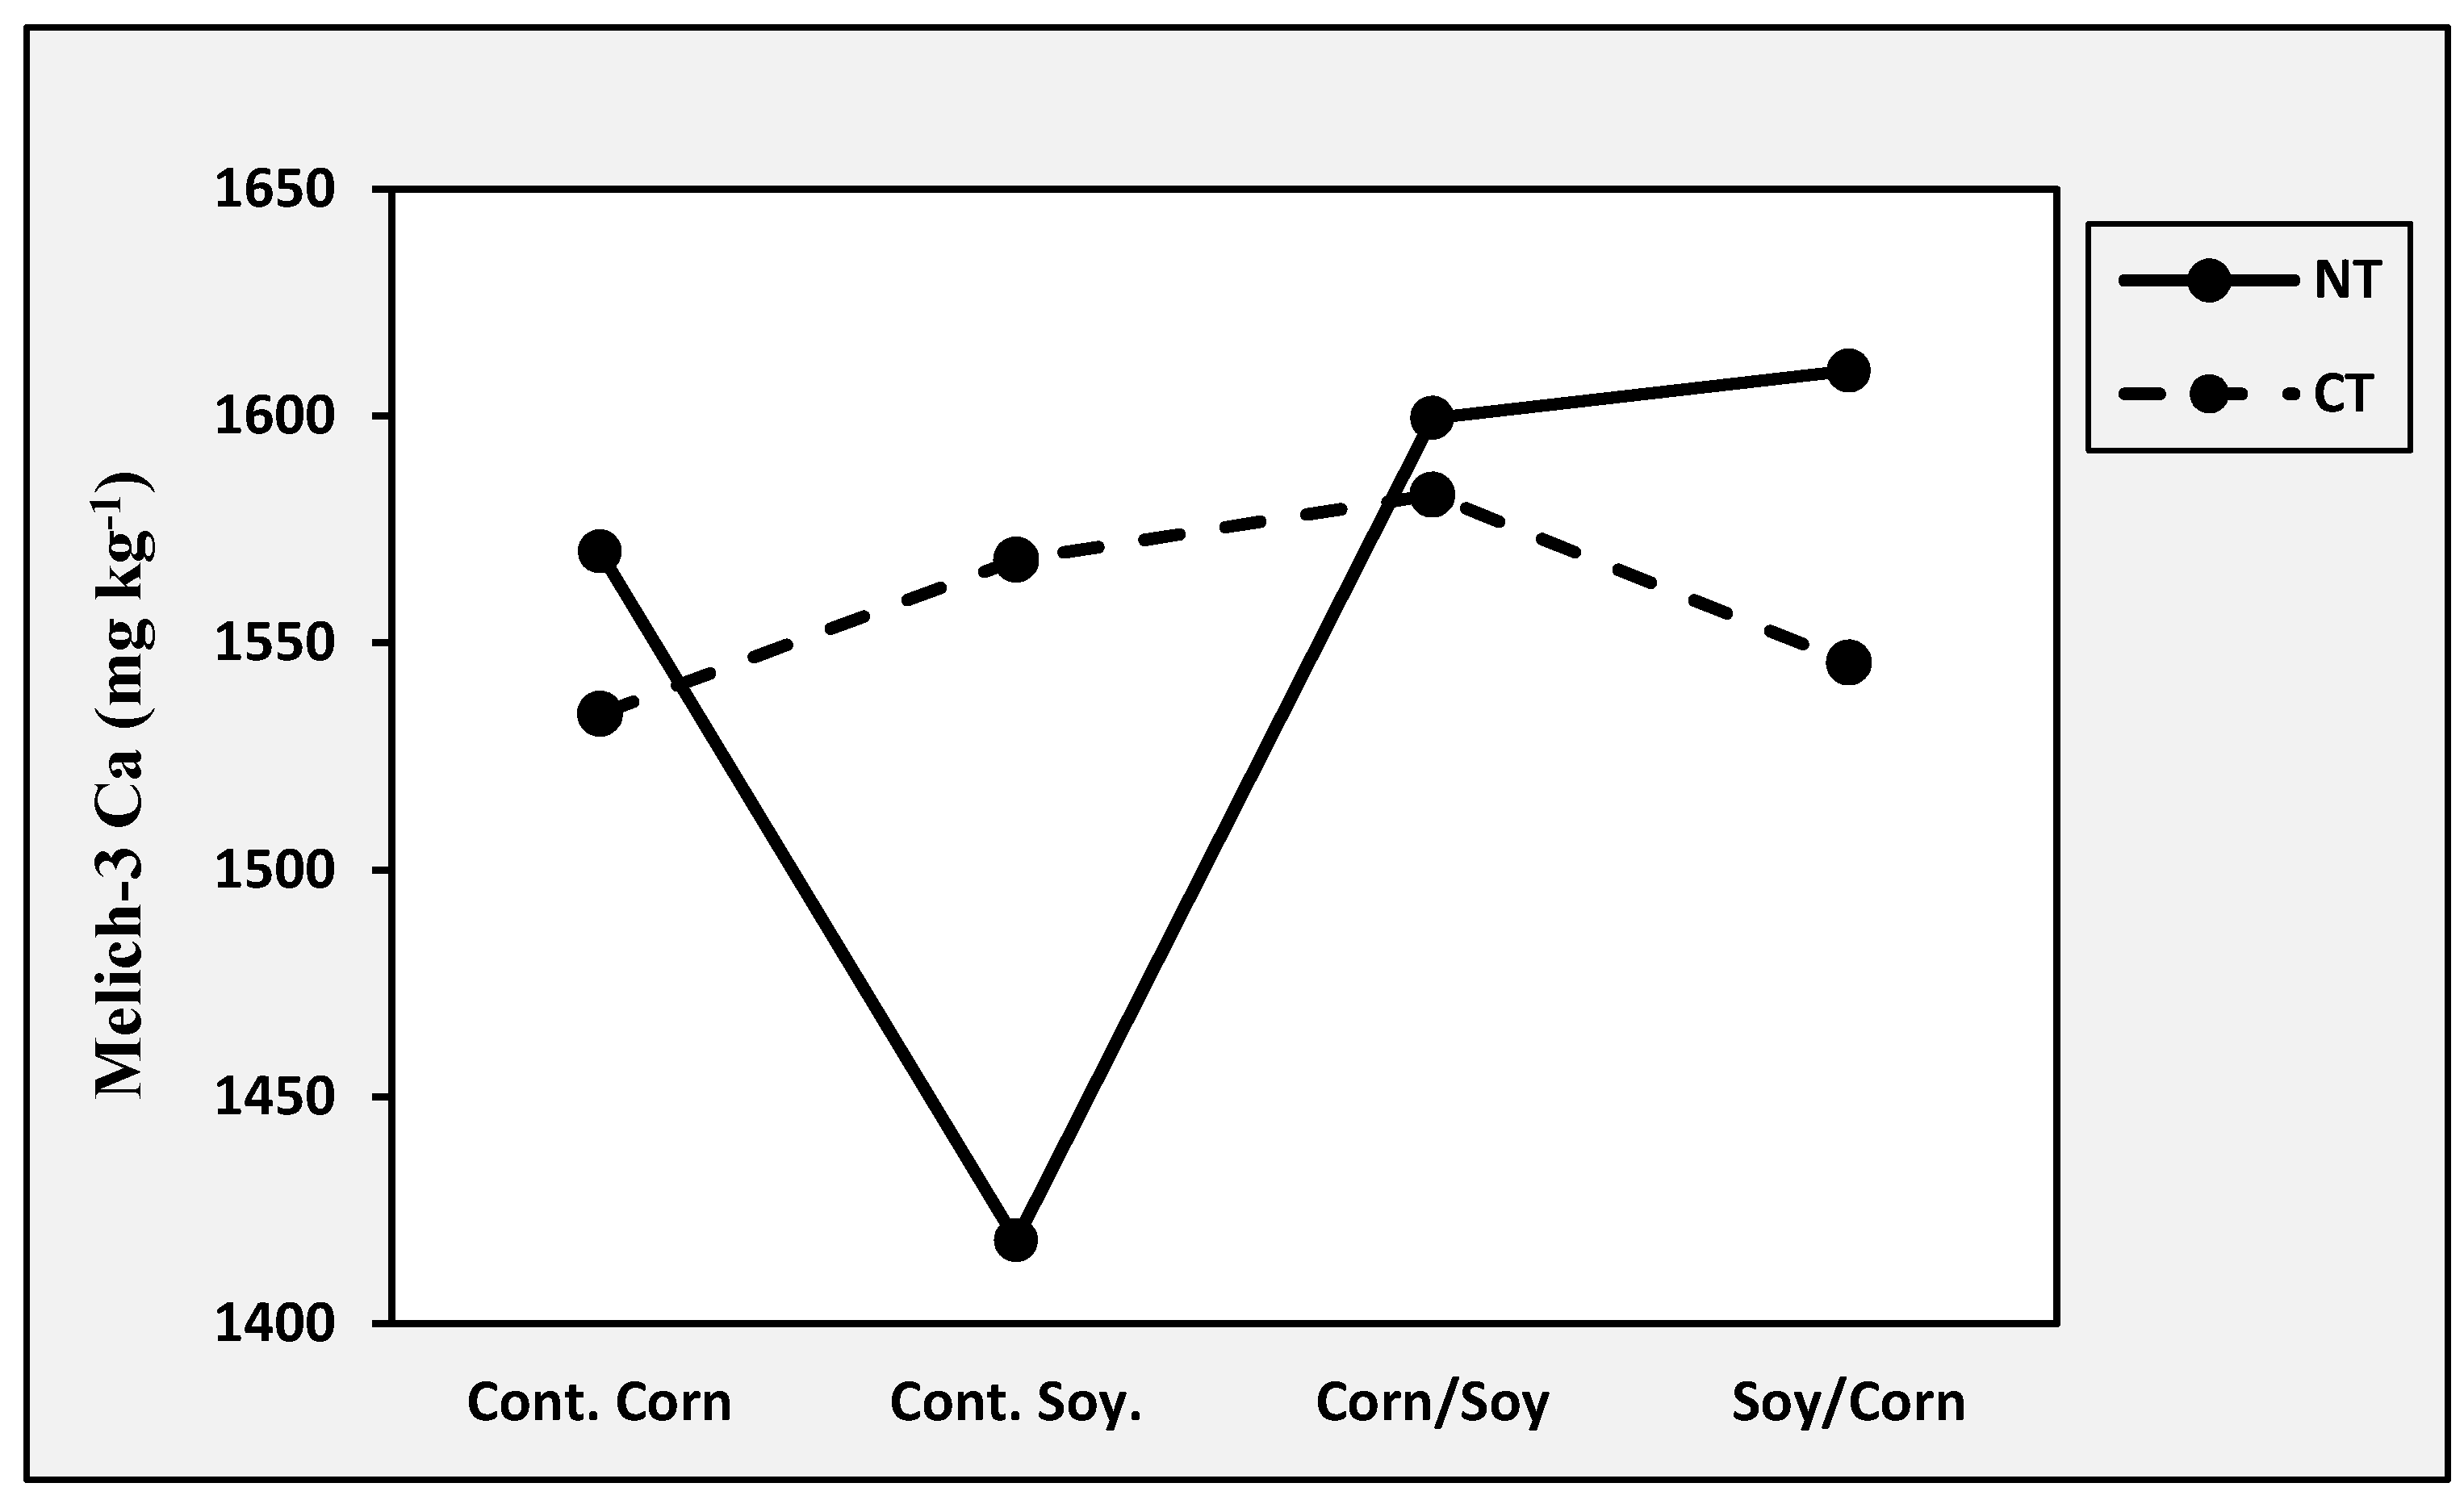
Figure 1. Effects of crop rotation × tillage interaction on Melich-3 Ca in 2013. Please note: NT = no-tillage; CT = conventional (moldboard) tillage.
Agriculture 10 00225 g001
Figure 2. Effects of crop rotation × tillage interaction on NH4-N in 2013. Please note that NT = no tillage; CT = conventional (moldboard plow).
Agriculture 10 00225 g002
Figure 3. Effects of crop rotation × cover crop interaction on Melich-3 K in 2013. Please note that CC = cover crop; NC = no cover crop.
Agriculture 10 00225 g003
Figure 4. Effects of cover crop × crop rotation on Bray 1 P in 2013. Please note that CC = cover crop; NC = no cover crop.
Agriculture 10 00225 g004
Figure 5. Effects of crop rotation × tillage interaction on Bray 1 P in 2013. Please note that NT = no tillage; CT = conventional (moldboard plow).
Agriculture 10 00225 g005
Table 1. Baseline soil physical and chemical properties at the study site.
Mean Values of Soil Physical and Chemical Properties
Depth (cm)BD (g cm−3)VWC (cm3 cm−3)TPS (cm3 cm−3)pHOM (g kg−1)CEC (cmolc kg−1)
0–101.240.280.516.7116.6014.57
10–201.470.310.426.8016.6015.09
20–401.200.300.536.7916.5013.88
40–601.180.320.546.8516.8014.53
BD: bulk density; VWC: volumetric water content; TPS: total pore spaces; OM: organic matter; CEC: cation exchange capacity (adapted from Haruna and Nkongolo 2013; 2014 [24,25]
Table 2. Effects of tillage and depth of sampling on selected soil nutrients in 2011.
TreatmentsCa (mg kg−1)Mg (mg kg−1)NO3 (mg kg−1)NH4 (mg kg−1)K (mg kg−1)P (mg kg−1)S (mg kg−1)Na (mg kg−1)Fe (mg kg−1)Mn (mg kg−1)Cu (mg kg−1)
Tillage (TL)---------------------------------------------------------------------------------Means--------------------------------------------------------------------------------
No-Till1851.10a391.06a8.22b5.77a124.05a16.97b9.39a30.49a158.57b166.33a2.66a
Conventional Tillage1945.90a397.32a13.59a5.33a127.20a22.58a9.68a31.55a165.57a160.91a2.64a
Depth of Sampling (DS)
0–10 cm1863.10a391.42a14.27a5.50a131.67a21.21a9.77a31.00a158.67a159.60a2.61a
10–20 cm1990.20a411.94a9.47a5.39a128.19a19.71a9.38a30.46a166.83a170.21a2.74a
20–40 cm1812.60a373.06a11.50a5.61a128.38a21.15a9.60a30.19a163.54a163.25a2.55a
40–60 cm1928.00a400.35a8.38a5.72a114.27a16.83a9.38a30.44a158.92a161.42a2.72a
Analysis of Variance
Sources of VariationdfCaMgNO3NH4KPSNaFeMnCu
Blocks2--------------------------------------------------------------------------p-values-----------------------------------------------------------------------------------
TL10.05570.60950.00410.11790.52440.00020.21250.30380.01710.20620.6961
DS30.06420.14930.12020.85960.06430.11730.56290.41870.12820.31650.1941
Interactions
TL × DS30.32740.84830.34450.61640.77560.57320.94030.96690.84510.85070.6315
Error 1821164247184.7163.293.76931167.9106.272.609150.953386.63878.500.2373
Total191
Means followed by different alphabet in the same treatment and depth of sampling are statistically significant at the 0.05 probability level. NO3: Nitrate; NH4: Ammonium; S: Sulphur; P: Phosphorous; Ca: Calcium; Mg: Magnesium; K: Potassium; Na: Sodium; Mn: Manganese; Cu: Copper; Fe: Iron. Please note: Ca, Mg, K, Fe, Mn and Cu are Melich-3 measurements. NO3-N was measured by steam microdistillation. SO4 was determined by tubidimetry. P is Bray 1.
Table 3. Effects of tillage, crop rotation, cover crop and depth of sampling on selected soil nutrients in 2012.
TreatmentsCa (mg kg−1)Mg (mg kg−1)NO3 (mg kg−1)NH4 (mg kg−1)K (mg kg−1)P (mg kg−1)S (mg kg−1)Na (mg kg−1)Fe (mg kg−1)Mn (mg kg−1)Cu (mg kg−1)
Tillage (TL)---------------------------------------------------------------------------------Means---------------------------------------------------------------------------------------
No-Till1766.71a364.09a6.90a10.91a102.70a16.79b8.26b33.67a161.41a138.92a2.36a
Conventional Tillage1738.43a378.86a7.19a11.03a106.51a19.52a9.70a36.99a164.06a133.69a2.32a
Crop Rotation (CR)
Continuous corn1753.20a378.38a7.3211.72101.44a16.23a9.17a36.88a158.27a139.17a2.32a
Continuous soybean1728.70a359.15a6.839.9100.77a17.96a9.60a38.38a166.19a134.65a2.31a
Corn-soybean rotation1734.51a358.52a6.7811.02106.23a18.96a8.60a33.79a166.02a133.48a2.30a
Soybean-corn rotation1793.74a389.88a7.2511.23109.98a19.48a8.54a32.27a160.46a137.92a2.44a
Cover crop (CC)
No-Rye1801.00a386.40a7.17a11.41a106.73a17.80a9.08a36.65a164.79a138.79a2.42a
Rye1704.00b356.56b6.93a10.53b102.48a18.51a8.88a34.01a160.68a133.81a2.26b
Depth of Sampling (DS)
0–10 cm1624.20b324.88c14.70a12.98a139.79a33.27a10.75a34.04b181.50a145.58ab2.00c
10–20 cm1629.40b341.00bc6.12b11.55ab92.38b13.83b8.50b31.58c174.69a149.25a2.22b
20–40 cm1709.60b368.29b4.33bc10.16bc88.27b13.08b8.69b35.92b148.00b130.46bc2.35b
40–60 cm2046.90a451.75a3.03c9.19c97.98b12.44b7.98b39.77a146.75b119.92c2.79a
Analysis of Variance
Sources of VariationdfCaMgNO3NH4KPSNaFeMnCu
Blocks2--------------------------------------------------------------------------p-values-------------------------------------------------------------------------------------
TL10.49360.16040.68820.77650.27380.03850.00590.30150.51080.24980.4482
CR30.67800.09700.92990.01460.20260.31160.41550.51880.40310.78890.2103
CC10.02010.00500.74230.03200.22280.58840.68590.41220.30890.27310.0021
DS30.00000.00000.00000.00000.00000.00000.00000.00120.00000.00000.0000
Interactions
CC × CR × TL30.08460.15850.78160.78270.18850.13030.21030.65040.04250.58370.4213
CR × TL × DS90.99360.95260.32860.04960.43300.30770.64180.85840.93030.98940.9729
Lack of fit31
Error 135816355256.024.7107.7910577.9081.8212.681492.71778.90982.680.1348
Total191
Means followed by different alphabet in the same treatment and depth of sampling are statistically significant at the 0.05 probability level. NO3: Nitrate; NH4: Ammonium; S: Sulphur; P: Phosphorous; Ca: Calcium; Mg: Magnesium; K: Potassium; Na: Sodium; Mn: Manganese; Cu: Copper; Fe: Iron. Please note: Ca, Mg, K, Fe, Mn and Cu are Melich-3 measurements. NO3-N was measured by steam microdistillation. SO4 was determined by tubidimetry. P is Bray 1.
Table 4. Effects of tillage, crop rotation, cover crop and depth of sampling on selected soil nutrients in 2013.
TreatmentsCa (mg kg−1)Mg (mg kg−1)NO3 (mg kg−1)NH4 (mg kg−1)K (mg kg−1)P (mg kg−1)S (mg kg−1)Na (mg kg−1)Fe (mg kg−1)Mn (mg kg−1)Cu (mg kg−1)
Tillage (TL)---------------------------------------------------------------------------------Means-------------------------------------------------------------------------
No-Till1549.53a342.47b11.21a7.73b107.36a15.79a4.95a16.64a179.64a193.16a2.651a
Conventional Tillage1557.81a363.18a9.17a8.99a110.77a16.89a4.84a16.33a179.31a175.30b2.483a
Crop Rotation (CR)
Continuous corn1552.30a347.40ab11.558.03108.65a16.04a4.75a16.79a179.50a182.33a2.42a
Continuous soybean1493.40b336.77b9.858.49107.33a16.63a4.94a15.98a179.13a185.27a2.80a
Corn-soybean rotation1591.21a353.33ab10.908.35107.13a15.65a5.04a16.69a180.42a182.96a2.59a
Soybean-corn rotation1577.94a373.79a8.448.58113.17a17.04a4.85a16.48a178.85a186.35a2.46a
Cover Crop (CC)
No-Rye1623.70a373.94a10.18a8.68a108.09a15.26b4.85a16.48a175.65b182.92a2.51a
Rye1483.70b331.71b10.20a8.04a110.04a17.42a4.94a16.49a183.30a185.54a2.63a
Depth of Sampling
0–10 cm1454.70b318.85c15.07a6.80b130.69a22.17a5.48a15.06b184.73a190.17a2.18b
10–20 cm1471.60b335.29bc7.94b5.06c103.44b14.31b4.88b16.10ab186.31a196.19a2.38b
20–40 cm1598.10a361.52b11.17ab10.74a103.10b13.83b4.60b17.25a171.63b184.73ab2.60ab
40–60 cm1690.30a395.63a6.57b10.84a99.04b15.04b4.63b17.52a175.23b165.83b3.13a
Analysis of Variance
Sources of VariationdfCaMgNO3NH4KPSNaFeMnCu
Blocks2--------------------------------------------------------------------------p-values------------------------------------------------------------------------
Tillage TL10.75580.00510.20460.00040.16100.24310.21210.58470.89710.00120.3686
CR30.05020.00440.54180.69720.25900.72580.08870.73270.97340.94600.4793
CC10.00000.00000.99040.06610.42160.02240.31760.98500.00260.62760.5239
DS30.00000.00000.00120.00000.00000.00000.00000.00720.00000.00080.0031
Interactions
CC × CR30.01290.92690.35860.04290.00070.01070.01050.20590.37160.14870.3780
CR × TL30.02310.00730.91800.04080.00000.00060.00000.28740.43380.39690.4790
CC × CR × TL30.24760.18050.31610.23930.00020.02070.00370.05510.17880.50050.2876
CC × TL × DS30.50480.44060.53580.00260.35550.67620.55850.69130.70550.97050.1961
Lack of fit42
Error126340542532.4122.705.809280.2041.7480.331114.586298.291398.31.6749
Total191
Means followed by different alphabet in the same treatment and depth of sampling are statistically significant at the 0.05 probability level. NO3: Nitrate; NH4: Ammonium; S: Sulphur; P: Phosphorous; Ca: Calcium; Mg: Magnesium; K: Potassium; Na: Sodium; Mn: Manganese; Cu: Copper; Fe: Iron. Please note: Ca, Mg, K, Fe, Mn and Cu are Melich-3 measurements. NO3-N was measured by steam microdistillation. SO4 was determined by tubidimetry. P is Bray 1.