Best Crop Rotation Selection with GIS-AHP Technique Using Soil Nutrient Variability


Abstract
1. Introduction
2. Methodology
2.1. Study Area
2.2. Soil Sampling and Analysis
2.3. Statistical Analysis
2.4. Semivariograms Analysis
2.5. Interpolation Analyses for Suitability
2.6. Weightage Analysis in Analytical Hierarchy Process (AHP)
2.7. Yield Mapping
3. Results and Discussion
3.1. Soil Sample Analysis
3.2. AHP Weightage Estimation
3.3. Kharif Crop Suitability Analysis
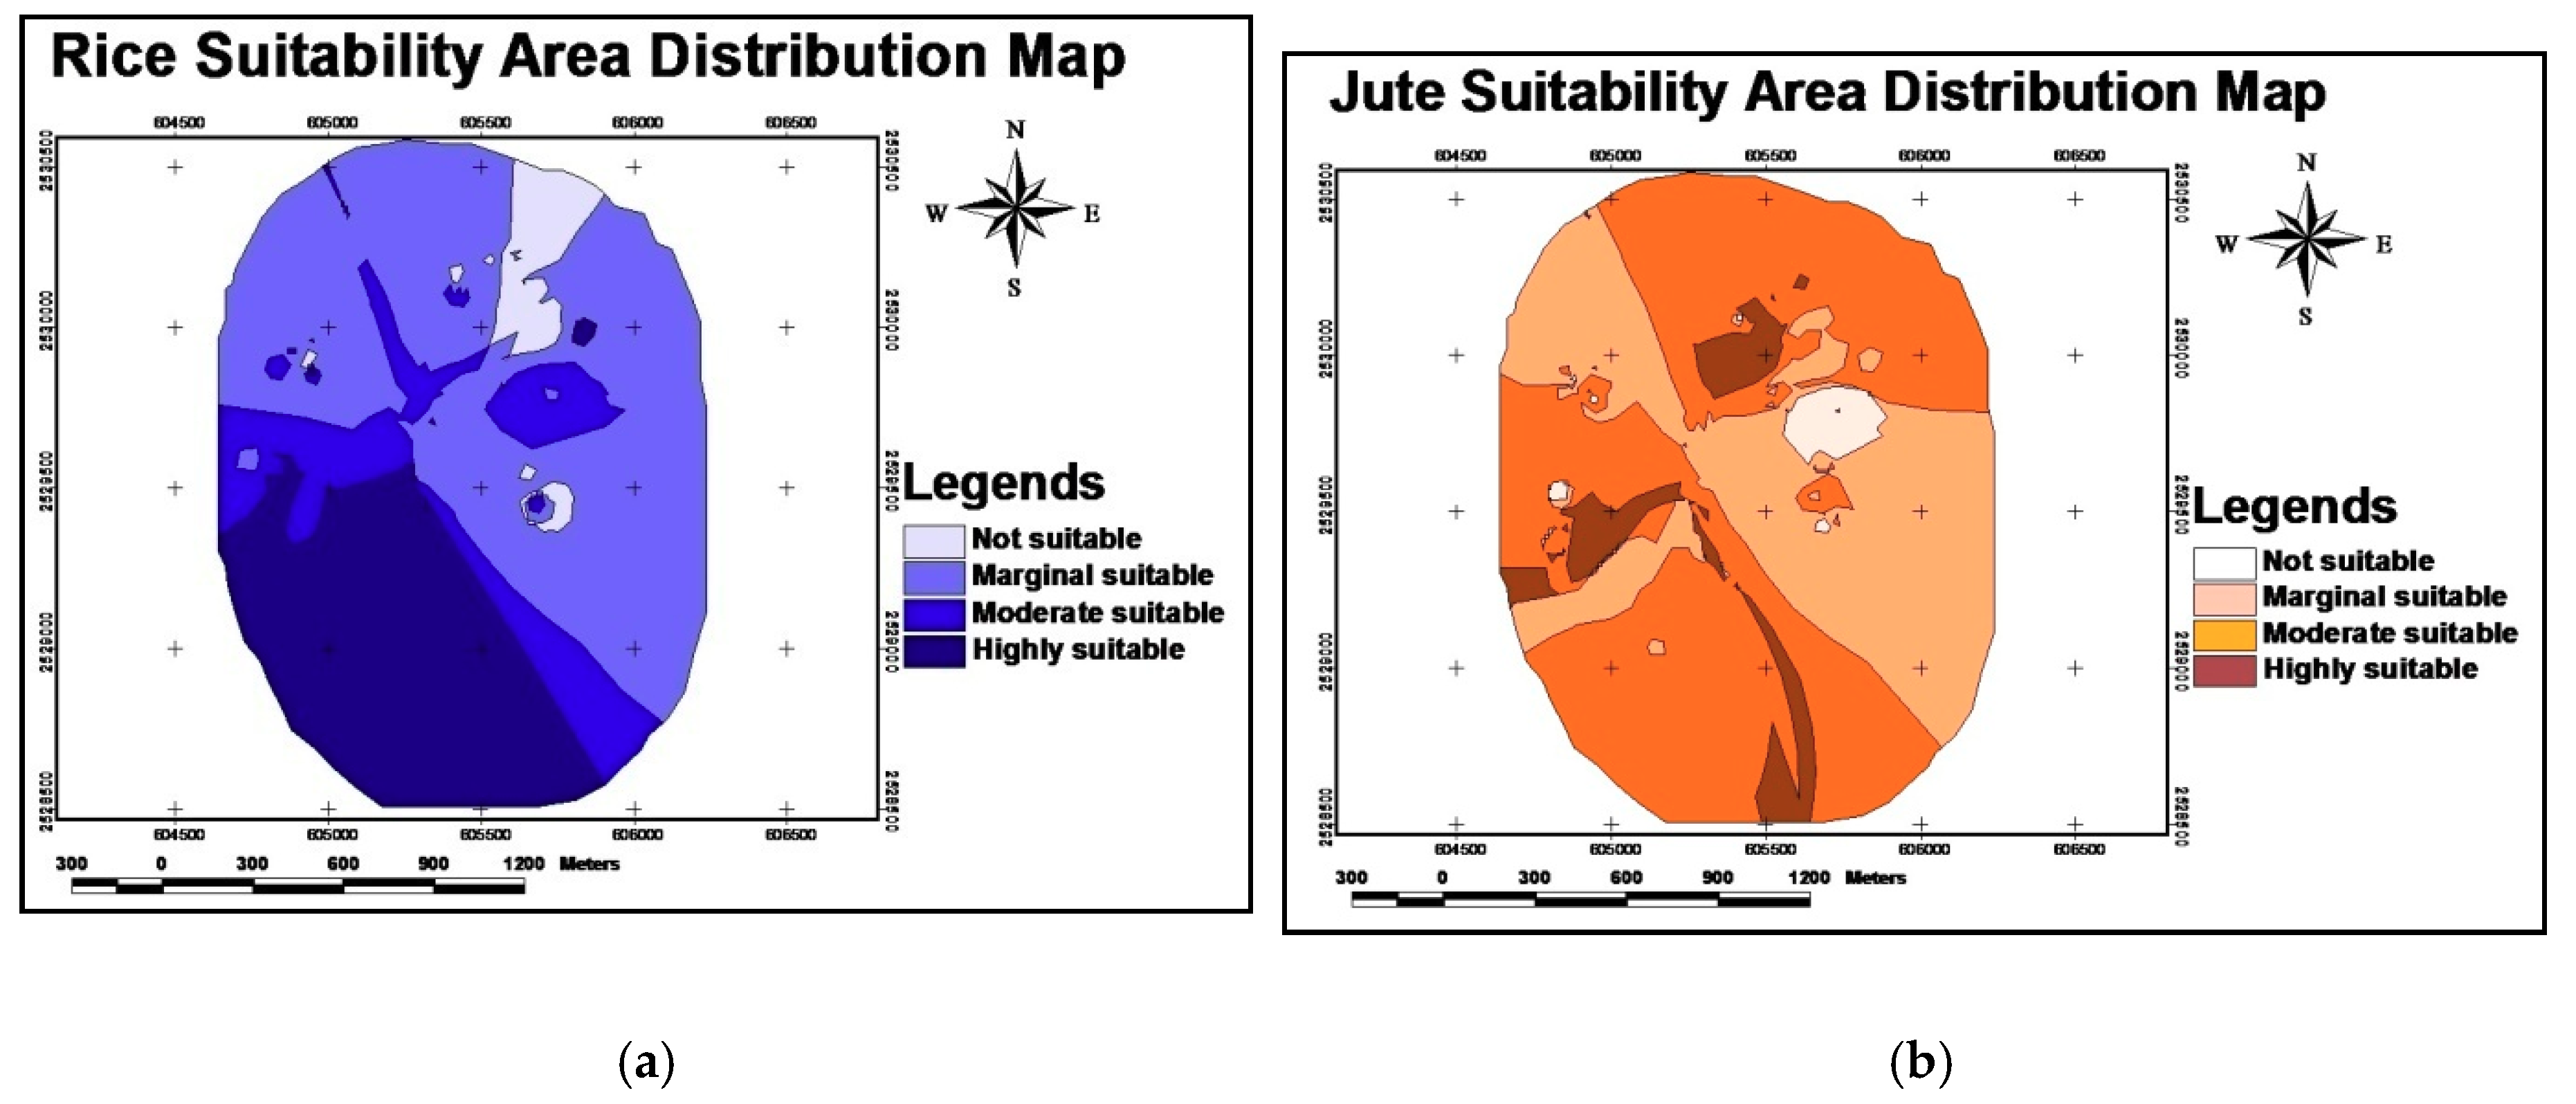
3.3.1. Rice
3.3.2. Jute
3.4. Rabi Crop Suitability Analysis
3.4.1. Potato
3.4.2. Lentil
3.5. Crop Yield Mapping and Validation
3.6. Crop Rotations
3.7. Crop Recommendation
4. Discussion
5. Conclusions
Author Contributions
Funding
Acknowledgments
Conflicts of Interest
References
- IBEF Report. Culturally Artistic, Indian Brand Equity Foundation: West Bengal, India. 2017. Available online: https://www.ibef.org/download/West-Bengal-July-2017.pdf (accessed on 10 April 2020).
- Sarkar, D. Study on growth of major cereals in West Bengal. Econ. Aff. 2014, 60, 161–167. [Google Scholar] [CrossRef]
- Roy, S. Farm distress: Why the potato isn’t hot in Bengal this season. Business line-The Hindu, 8 January 2018. [Google Scholar]
- Ghosal, S. West Bengal to produce 10% higher potatoes this year. Economic Times, 10 January 2020. [Google Scholar]
- FAO. A Frame Work for Land Suitability Study for Irrigated Agriculture; FAO: Rome, Italy, 1993. [Google Scholar]
- Bontikes, T.S.; Keulen, H.V. Modelling the dynamics of agricultural development at farm and regional level. Agric. Syst. 2003, 76, 379–396. [Google Scholar] [CrossRef]
- Casasnovas, M.J.; Martin-Monetero, A.; Casterad, M.A. Mapping multi-year cropping patterns in small irrigation districts from time series analysis of Landsat TM images. Eur. J. Agron. 2005, 23, 159–169. [Google Scholar] [CrossRef]
- Jamil, M.; Sajjad, H. Deriving cropping system efficiency pattern using remote sensing and GIS: A case study of Bijnor district, India. Int. J. Adv. Remote Sens. GIS Geogr. 2016, 4, 27–40. [Google Scholar]
- Khahro, S.H.; Matori, A.N.; Chandio, I.A.; Talpur, M.A.H. Land suitability analysis for installing new petrol filling stations using GIS. Procedia Eng. 2014, 77, 28–36. [Google Scholar] [CrossRef]
- Singha, C.; Swain, K.C. Land Suitability Evaluation Criteria for Agricultural crop selection: A Review. Agric. Rev. 2016, 37, 125–132. [Google Scholar] [CrossRef]
- Kuria, D.; Ngari, D.; Withaka, E. Using geographic information systems (GIS) to determine land suitability for rice crop growing in the Tana delta. J. Geogr. Reg. Plan. 2011, 4, 525–532. [Google Scholar]
- Feizizadeh, B.; Jankowski, P.; Blaschke, T. A GIS based spatially explicit sensitivity and uncertainty analysis approach for multicriteria decision analysis. Comput. Geosci. 2014, 64, 81–95. [Google Scholar] [CrossRef]
- Montgomery, B.; Dragićević, S.; Dujmović, J.; Schmidt, M. A GIS-based Logic Scoring of Preference method for evaluation of land capability and suitability for agriculture. Comput. Electron. Agric. 2016, 124, 340–353. [Google Scholar] [CrossRef]
- Collins, M.G.; Steiner, F.R.; Rushman, M.J. Landuse suitability analysis in the United States: Historical development and promising technological achievements. Environ. Manag. 2001, 28, 611–621. [Google Scholar] [CrossRef]
- Mendas, A.; Delali, A. Integration of multi-criteria decision analysis in GIS to develop land suitability for agriculture: Application to durum wheat cultivation in the region of Mleta in Algeria. Comput. Electron. Agric. 2012, 83, 117–126. [Google Scholar] [CrossRef]
- Zolekar, R.B.; Bhagat, V.S. Multi-criteria land suitability analysis for agriculture in hilly zone: Remote sensing and GIS approach. Comput. Electron. Agric. 2015, 118, 300–321. [Google Scholar] [CrossRef]
- Yalew, S.G.; van Griensven, A.; van der Zaag, P. AgriSuit: A web-based GIS-MCDA framework for agricultural land suitability assessment. Comput. Electron. Agric. 2016, 128, 1–8. [Google Scholar] [CrossRef]
- Swain, K.C.; Jayasuriya, H.P.W.; Salokhe, V.M. Low altitude remote sensing (LARS): A potential substitution to satellite based remotes sensing for precision agriculture adoption in fragmented and diversified farming conditions. Agric. Eng. Int. CIGR Ej. 2009, 9, 1–16. [Google Scholar]
- Saaty, T.L. The Analytic Hierarchy Process: Planning, Priority Setting, Resource Allocation; McGraw-Hill International: New York, NY, USA, 1980. [Google Scholar]
- Nefeslioglu, H.A.; Sezer, E.A.; Gokceoglu, C.; Ayas, Z. A modified analytical hierarchy process (M-AHP) approach for decision support systems in natural hazard assessments. Comput. Geosci. 2013, 59, 1–8. [Google Scholar] [CrossRef]
- Zabihi, H.; Ahmad, A.; Vogeler, I.; Said, M.N.; Golmohammadi, M.; Golein, B.; Nilashi, M. Land suitability procedure for sustainable citrus planning using the application of the analytical network process approach and GIS. Comput. Electron. Agric. 2015, 117, 114–126. [Google Scholar] [CrossRef]
- Mishra, A.K.; Deep, S.; Choudhary, A. Identification of suitable sites for organic farming using AHP & GIS. Egypt. J. Remote Sens. Space Sci. 2015, 18, 181–193. [Google Scholar]
- Akinci, H.; Ozalp, A.Y.; Turgut, B. Agriculture land use suitability analysis using GIS and AHP technique. Comput. Electron. Agric. 2013, 97, 71–82. [Google Scholar] [CrossRef]
- Zhang, J.; Su, Y.; Wu, J.; Liang, H. GIS based land suitability assessment for tobacco production using AHP and fuzzy set in Shandong province of China. Comput. Electron. Agric. 2015, 114, 202–211. [Google Scholar] [CrossRef]
- Boroushaki, S.; Malczewski, J. Implementing an extension of the analytical hierarchy process using ordered weighted averaging operators with fuzzy quantifiers in ArcGIS. Comput. Geosci. 2008, 34, 399–410. [Google Scholar] [CrossRef]
- Hamzeh, S.; Mokarram, M.; Haratian, A.; Bartholomeus, H.; Ligtenberg, A.; Bregt, A.K. Feature Selection as a Time and Cost-Saving Approach for Land Suitability Classification (Case Study of Shavur Plain, Iran). Agriculture 2016, 6, 52. [Google Scholar] [CrossRef]
- Jayasinghe, S.L.; Kumar, L.; Sandamali, J. Assessment of Potential Land Suitability for Tea (Camellia sinensis(L.) O. Kuntze) in Sri Lanka Using a GIS-Based Multi-Criteria Approach. Agriculture 2019, 9, 148. [Google Scholar] [CrossRef]
- Fekadu, E.; Negese, A. GIS assisted suitability analysis for wheat and barley crops through AHP approach at Yikalo sub-watershed, Ethiopia. Cogent Food Agric. 2020, 6, 1743623. [Google Scholar] [CrossRef]
- Perveen, F.; Nagasawa, R.; Chongo, D.; Cherif, O.; Ahmed, A. Land Suitability Analysis for Rice Crop using Remote Sensing and GIS Technology. Jpn. Agric. Syst. Soc. 2017, 23, 283–295. [Google Scholar]
- Widiatmaka. Integrated use of GIS, AHP and remote sensing in land use planning for tropical high altitude vegetable crops. J. Appl. Hortic. 2016, 18, 87–99. [Google Scholar] [CrossRef]
- Kahsay, A.; Haile, M.; Gebresamuel, G.; Mohammed, M. Land suitability analysis for sorghum crop production in northern semi-arid Ethiopia: Application of GIS-based fuzzy AHP approach. Cogent Food Agric. 2018, 4, 1507184. [Google Scholar] [CrossRef]
- Kumar, N.; Singh, S.K.; Mishra, V.N.; Obi Reddy, G.P.; Bajpai, R.K.; Saxena, R.R. Soil suitability evaluation for cotton using analytical hierarchic process. Int. J. Chem. Stud. 2018, 6, 1570–1576. [Google Scholar]
- NBBS and LUP. Soil Series of West Bengal; NBSS Publ. No. 89, NBSS and LUP (ICAR): Nagpur, India, 2001; pp. 38–40. [Google Scholar]
- Soil Survey Division Staff. Soil Survey Manual (Indian Print); Hb. No. IS; USDA: Washington, DC, USA, 2000.
- Halder, J.C. Land Suitability Assessment for Crop Cultivation by Using Remote Sensing and GIS. J. Geogr. Geol. 2013, 5, 65–74. [Google Scholar] [CrossRef]
- Dwivedi, R.; Srivastva, P.C. Effect of zinc sulphate application and the cyclic incorporation of cereal straw on yields, the tissue concentration and uptake of Zn by crops and availability of Zn in soil under rice-wheat rotation. Int. J. Recycl. Org. Waste Agric. 2014, 3, 53. [Google Scholar] [CrossRef]
- Joshi, D.; Srivastava, P.C.; Rama Dwivedi, R.; Pachauri, S.P. Chemical speciation of Zn in acidic soils: Suitable soil extractant for assessing Zn availability to maize (Zea mays L.). Chem. Speciat. Bioavailab. 2014, 26, 148–157. [Google Scholar] [CrossRef]
- Jackson, M.L. Soil Chemical Analysis; Prentice Hall of India Pvt. Ltd: New Delhi, India, 1973. [Google Scholar]
- Piper, C.S. Soils and Plant Analysis; The University of Adelaide: Adelaide, Australia, 1942. [Google Scholar]
- USDA. Agricultural Research Service, Soil Texture Classification; Department of Biological System Engineering, Washington State University: Washington, DC, USA, 1980.
- Lund, A.; Lund, M. Laerd Statistics: Descriptive and Inferential Statistics. 2018. Available online: https://statistics.laerd.com/ (accessed on 15 May 2020).
- Olea, R.A. TheSemivariogram. In Geostatistics for Engineers and Earth Scientists; Springer: Boston, MA, USA, 1999. [Google Scholar]
- Cressie, N.; Zimmerman, D.L. On the stability of the geostatistical method. Math. Geol. 1992, 24, 45–59. [Google Scholar] [CrossRef]
- Goulard, M.; Voltz, M. Linear coregionalization model: Tools for estimation and choice of cross-variogram matrix. Math. Geol. 1992, 24, 269–286. [Google Scholar] [CrossRef]
- Granados, F.L.; Jurado-Exposito, M.; Atenciano, S.; Garcia-Ferrer, A.; De la Orden, M.S.; Garcia-Torres, L. Spatial Variability of Agricultural Soil Parameters in Southern Spain. Plant Soil 2002, 246, 97–105. [Google Scholar] [CrossRef]
- Cambardella, C.A.; Moorman, T.B.; Novak, J.M.; Parkin, T.B.; Karlen, D.L.; Turco, R.F.; Konopka, A.E. Field-Scale Variability of Soil Properties in Central Iowa Soils. J. Soil Sci. Soc.Am. 1994, 58, 1501–1511. [Google Scholar] [CrossRef]
- Diggle, P.J.; Ribeiro, P.J., Jr. Bayesian inference in Gaussian model-based geostatistics. Geogr. Environ. Model. 2002, 6, 129–146. [Google Scholar] [CrossRef]
- Webster, R.; Oliver, M.A. Geostatistics for Environmental Scientists; John Wiley and Sons: Brisbane, Australia, 2001. [Google Scholar]
- Kritikos, T.R.H.; Davies, T.R.H. GIS-based multi-criteria decision analysis for landslide susceptibility mapping at northern Evia, Greece. Z. Dtsch.Ges.Geowiss. 2011, 162, 421–434. [Google Scholar] [CrossRef]
- Pramanik, M.K. Site suitability analysis for agricultural land use of Darjeeling district using AHP and GIS techniques. Model. Earth Syst. Environ. 2016, 2, 1–22. [Google Scholar] [CrossRef]
- Saaty, T.L. A scaling method for priorities in hierarchical structures. J. Math. Psychol. 1977, 15, 57–68. [Google Scholar] [CrossRef]
- Saaty, T.L.; Vargas, L.G. Prediction, Projection and Forecasting; Kluwer: Boston, MA, USA, 1991. [Google Scholar]
- Prakash, N.T. Land Suitability Analysis for Agricultural Crops: A Fuzzy Multicriteria Decision Making Approach. Master’s Thesis, International Institute for Geo Information Science and Earth Observation Enschede, Enschede, The Netherlands, 2003; pp. 1–57. [Google Scholar]
- Dengiz, O.; Zyazici, M.A.; Saglam, M. Multi-criteria assessment and geostatistical approach for determination of rice growing suitability sites in Gokirmak catchment. Paddy Water Environ. 2013, 13, 1–10. [Google Scholar] [CrossRef]
- Mongkolsawat, C.; Paiboonsak, S. GIS–Based Land Evaluation for Combining Economic Crops as a Model for Agricultural Land Use Planning. 2015. Available online: https://www.researchgate.net/publication/242162621 (accessed on 30 March 2018).
- Samanta, S.; Pal, B.; Pal, D.K. Land suitability analysis for rice cultivation based on multi-criteria decision approach through GIS in, Morobe Province, Papua New Guinea. Int. J. Sci. Emerg. Technol. 2011, 2, 12–20. [Google Scholar]
- NBBS & LUP. Soil Resources of Tamil Nadu for Land Use Planning; Detailed Report Bangalore Centre, NBSS Publication: Bangalore, India, 1990. [Google Scholar]
- Vinay, L. Characterization and Classification of Soil Resource of Bhanapur Microwatershed (Koppal District) for Land Evaluation. Ph.D. Thesis, University of Agricultural Sciences, Dharwad, India, 2007. [Google Scholar]
- Mulla, D.J.; McBratney, A.B. Soil spatial variability. In Handbook of Soil Science; Sumner, M.E., Ed.; CRS Press: Boca Raton, FL, USA, 2000; pp. 321–352. [Google Scholar]
- Yan-bing, T. Comparison of semivariogram models for Kriging monthly rainfall in eastern China. J. ZhejUni-SCI A 2002, 3, 584–590. [Google Scholar] [CrossRef]
- Kasa, S.R.; Bhattacharya, S.; Rajan, V. Gaussian Mixture Copulas for High-Dimensional Clustering and Dependency-based Subtyping. Bioinformatics 2019, 36, 621–628. [Google Scholar] [CrossRef] [PubMed]
- Aimrun, W.; Amin, M.S.M.; Ezrin, M.H.; Mastura, M. Paddy soil properties and yield characteristics based on apparent electrical conductivity zone delineation for a humid tropical rice farm. Afr. J. Agric. Res. 2011, 6, 5339–5350. [Google Scholar]
- Ahamed, T.R.N.; Rao, K.G.; Murthy, J.S.R. GIS-based fuzzy membership model for crop-land suitability analysis. Agric. Syst. 2000, 63, 75–95. [Google Scholar] [CrossRef]
- Aggelopoulou, A.D.; Bochtis, D.; Fountas, S.; Swain, K.C.; Gemtos, T.A.; Nanos, G.D. Yield prediction in apple orchards based on image processing. Precis. Agric. 2010, 12, 448–456. [Google Scholar] [CrossRef]
- Swain, K.C.; Thomson, S.J.; Jayasuriya, H.P.W. Adoption of an unmanned helicopter for low-altitude remote sensing to estimate yield and total biomass of a rice crop. Trans. ASABE 2010, 53, 21–27. [Google Scholar] [CrossRef]
- Mustafa, A.A.; Singh, M.; Sahoo, R.N.; Ahmed, N.; Khanna, M.; Sarangi, A.; Mishra, A.K. Land Suitability Analysis for Different Crops: A Multi Criteria Decision Making Approach using Remote Sensing and GIS. Researcher 2011, 3, 61–84. [Google Scholar]
- Marraccini, E.; Gotor, A.; Scheurer, O.; Leclercq, C. An Innovative Land Suitability Method to Assess the Potential for the Introduction of a New Crop at a Regional Level. Agronomy 2020, 10, 330. [Google Scholar] [CrossRef]


| Soil Parameters | Unit | Crop Type | Highly Suitable (S1) | Moderate Suitable (S2) | Marginal Suitable (S3) | Not Suitable (N) |
|---|---|---|---|---|---|---|
| Soil pH | Reaction | rice | 6–7.5 | 7.5–8; 4.5–6 | 8–8.5; 4–4.5 | >8.5; <4.0 |
| jute | 6.5–7.5 | 5.0–6.5 | 4.5–5.0 | <4.5 | ||
| potato | 6–7 | 5.0–6.0; 7.0–7.5 | 4.5–5;7.5–8.0 | <4.5; >8.0 | ||
| lentil | 6.0–7.5 | 7.5–8.0; 5.5–6 | 8–8.5;4.5–5.5 | >8.5; <4.5 | ||
| Available nitrogen (N) | ppm | rice | >30 | 20–30 | 10–20 | <10 |
| jute | >45 | 30–45 | 15–30 | <15 | ||
| potato | >55 | 35–55 | 20–35 | <20 | ||
| lentil | >7.5 | 5.0–7.5 | 2.5–5.0 | <2.5 | ||
| Available phosphorous (P) | ppm | rice | >50 | 25–50 | 10–25 | <10 |
| jute | >8 | 5–8 | 2–5 | <2 | ||
| potato | >11 | 8–11 | 5–8 | <5 | ||
| lentil | >11 | 8–11 | 5–8 | <5 | ||
| Available potassium (K) | ppm | rice | >60 | 45–60 | 30–45 | <30 |
| jute | >30 | 20–30 | 10–20 | <10 | ||
| potato | >55 | 35–55 | 15–35 | <15 | ||
| lentil | >5 | 10–15 | 5–10 | <5 | ||
| Organic carbon (OC) | % | rice | >1.0 | 0.66–1.0 | 0.33–0.66 | <0.33 |
| jute | >1.0 | 0.66–1.0 | 0.33–0.66 | <0.33 | ||
| potato | >0.7 | 0.5–0.7 | 0.3–0.5 | <0.3 | ||
| lentil | >1.5 | 1.0–1.5 | 0.5-1.0 | <0.5 | ||
| Electrical conductivity (EC) | (dS/m) | rice | 0.0–3.0 | 3.0–4.0 | 4.0–5.0 | >5.0 |
| jute | <1.0 | 1.0–2.0 | 2.0–5.0 | >5.0 | ||
| potato | <4 | 4–6 | 6–8 | >8 | ||
| lentil | 0–1.0 | 1.0–1.5 | 1.5–2.0 | >2.0 | ||
| Available zinc (Zn) | ppm | rice | >1.5 | 1.0–1.5 | 0.5–1.0 | <0.5 |
| jute | >3 | 2–3 | 1–2 | <1 | ||
| potato | >1.2 | 0.8–1.2 | 0.4–0.8 | <0.4 | ||
| lentil | >1.0 | 0.8–1.0 | 0.5–0.8 | <0.5 | ||
| Soil texture (ST) | Class | rice | Clay, silty clay, silty clay loam | Sandy clay, loam, silt loam, clay loam | Sandy clay loam, sandy loams, silt | Loamy sands, sands |
| jute | Loam, silty loam, sandy clay loam | Silty clay, silty clay loam, clay | Sandy loam, clay >60% | Sand | ||
| potato | Sandy loams, sandy clay loam | Sandy Clay, silt clay loam, silt loam, clay loam | Clay, silt | Fine sand, loamy sand | ||
| lentil | Loam, silty loam, sandy clay loam | Silty clay, silty clay loam, clay | Sandy loam, clay >60% | Sand |
| N | 1 | 2 | 3 | 4 | 5 | 6 | 7 | 8 | 9 | 10 | 11 | 12 | 13 | 14 | 15 |
| R.I. | 0.00 | 0.00 | 0.58 | 0.90 | 1.12 | 1.24 | 1.32 | 1.41 | 1.45 | 1.49 | 1.51 | 1.54 | 1.56 | 1.56 | 1.59 |
| pH | log pH | EC (ds/m) | Log EC (ds/m) | OC (%) | N (ppm) | P (ppm) | K (ppm) | Zn (ppm) | Sand (%) | Silt (%) | Clay (%) | |
|---|---|---|---|---|---|---|---|---|---|---|---|---|
| Mean | 4.87 | 1.57 | 0.56 | −0.70 | 0.54 | 27.9 | 197.1 | 76.93 | 2.23 | 42.64 | 18.2 | 39.2 |
| SD | 0.57 | 0.11 | 0.31 | 0.53 | 0.18 | 8.72 | 60.8 | 29.64 | 0.62 | 13.75 | 5.57 | 9.48 |
| Skewness | 1.14 | 0.92 | 1.66 | −0.40 | 0.01 | 0.96 | −1.64 | 0.58 | 0.42 | −0.59 | 0.27 | 0.77 |
| Kurtosis | 0.40 | 2.94 | 3.92 | 4.07 | 0.36 | 2.23 | 1.07 | −0.06 | −0.25 | −0.42 | −1.7 | 0.30 |
| Minimum | 4.11 | 1.41 | 0.10 | −2.30 | 0.13 | 10.04 | 35.07 | 25.90 | 1.16 | 11.7 | 10.0 | 22.3 |
| Maximum | 6.33 | 1.84 | 1.73 | 0.54 | 0.95 | 55.2 | 231.6 | 150.73 | 3.88 | 66.4 | 28.7 | 63.6 |
| CV (%) | 11.69 | 54.37 | 33.1 | 31.3 | 30.84 | 38.5 | 28.0 | 32.2 | 30.7 | 24.2 |
| Parameters | Model | C0 | C1 | C0 + C1 | A0 | DSD (%) | SD | Estimated Error | |||
|---|---|---|---|---|---|---|---|---|---|---|---|
| MSE | ASE | RMSE | RMSSE | ||||||||
| Log pH | Exponential | 0.064 | 0.086 | 0.149 | 459 | 42.54 | M | −0.01 | 0.32 | 0.34 | 1.05 |
| LogEC(ds/m) | Exponential | 0.043 | 0.065 | 0.107 | 1088.9 | 39.68 | M | −0.001 | 0.24 | 0.27 | 1.12 |
| OC (%) | Exponential | 0.006 | 0.018 | 0.024 | 542.4 | 24.99 | S | −0.005 | 0.11 | 0.12 | 1.09 |
| N (ppm) | Gaussian | 66.147 | 16.636 | 82.783 | 804.0 | 79.90 | W | −0.002 | 9.08 | 10.07 | 1.10 |
| P (ppm) | Gaussian | 4.939 | 4939.8 | 4944.73 | 53.58 | 0.099 | S | −0.10 | 106.9 | 79.57 | 0.92 |
| K (ppm) | Exponential | 442.1 | 770.1 | 1212.33 | 578.5 | 36.47 | M | −0.05 | 30.79 | 29.35 | 1.02 |
| Zn (ppm) | Exponential | 0.118 | 0.396 | 0.514 | 734.5 | 22.98 | S | 0.04 | 0.48 | 0.47 | 0.98 |
| Sand (%) | Exponential | 20.79 | 170.7 | 191.553 | 846.6 | 10.85 | S | −0.01 | 7.65 | 7.80 | 1.02 |
| Silt (%) | Exponential | 7.405 | 24.83 | 32.238 | 633.2 | 22.97 | S | −0.003 | 4.23 | 3.99 | 0.98 |
| Clay (%) | Exponential | 16.53 | 72.87 | 89.413 | 931.4 | 18.49 | S | −0.02 | 6.07 | 5.71 | 1.08 |
| ST | pH | EC | OC | N | P | K | Zn | Weightage | |
|---|---|---|---|---|---|---|---|---|---|
| ST | 1 | 2 | 3 | 3 | 5 | 7 | 7 | 9 | 0.311 |
| pH | 0.5 | 1 | 2 | 2 | 5 | 7 | 7 | 8 | 0.227 |
| EC | 0.333 | 0.5 | 1 | 2 | 4 | 6 | 6 | 7 | 0.171 |
| OC | 0.333 | 0.5 | 0.5 | 1 | 3 | 4 | 4 | 6 | 0.122 |
| N | 0.2 | 0.2 | 0.25 | 0.333 | 1 | 3 | 3 | 5 | 0.07 |
| P | 0.142 | 0.142 | 0.167 | 0.25 | 0.333 | 1 | 2 | 4 | 0.043 |
| K | 0.142 | 0.142 | 0.167 | 0.25 | 0.333 | 0.5 | 1 | 4 | 0.037 |
| Zn | 0.111 | 0.125 | 0.142 | 0.167 | 0.2 | 0.25 | 0.25 | 1 | 0.019 |
| pH | ST | N | Zn | OC | EC | P | K | Weightage | |
|---|---|---|---|---|---|---|---|---|---|
| pH | 1 | 2 | 3 | 4 | 5 | 5 | 6 | 7 | 0.317 |
| ST | 0.5 | 1 | 2 | 3 | 4 | 4 | 5 | 6 | 0.218 |
| N | 0.333 | 0.5 | 1 | 2 | 4 | 4 | 5 | 5 | 0.165 |
| Zn | 0.25 | 0.333 | 0.5 | 1 | 2 | 2 | 4 | 5 | 0.105 |
| OC | 0.2 | 0.25 | 0.25 | 0.5 | 1 | 1 | 3 | 5 | 0.072 |
| EC | 0.2 | 0.25 | 0.25 | 0.5 | 1 | 1 | 2 | 3 | 0.06 |
| P | 0.167 | 0.2 | 0.2 | 0.25 | 0.333 | 0.5 | 1 | 2 | 0.037 |
| K | 0.142 | 0.167 | 0.2 | 0.2 | 0.2 | 0.333 | 0.5 | 1 | 0.026 |
| K | ST | N | pH | OC | EC | P | Zn | Weightage | |
|---|---|---|---|---|---|---|---|---|---|
| K | 1 | 2 | 3 | 4 | 5 | 6 | 7 | 8 | 0.326 |
| ST | 0.5 | 1 | 2 | 3 | 4 | 4 | 6 | 6 | 0.217 |
| N | 0.333 | 0.5 | 1 | 2 | 3 | 3 | 5 | 6 | 0.15 |
| pH | 0.25 | 0.333 | 0.5 | 1 | 3 | 3 | 5 | 5 | 0.119 |
| OC | 0.2 | 0.25 | 0.333 | 0.333 | 1 | 2 | 4 | 4 | 0.075 |
| EC | 0.167 | 0.25 | 0.333 | 0.333 | 0.5 | 1 | 3 | 3 | 0.056 |
| P | 0.142 | 0.167 | 0.2 | 0.2 | 0.25 | 0.333 | 1 | 2 | 0.032 |
| Zn | 0.125 | 0.167 | 0.167 | 0.2 | 0.25 | 0.333 | 0.5 | 1 | 0.025 |
| ST | pH | Zn | EC | OC | P | K | N | Weightage | |
|---|---|---|---|---|---|---|---|---|---|
| ST | 1 | 2 | 3 | 5 | 6 | 7 | 8 | 8 | 0.345 |
| pH | 0.5 | 1 | 2 | 3 | 3 | 5 | 7 | 8 | 0.218 |
| Zn | 0.333 | 0.5 | 1 | 2 | 3 | 4 | 5 | 7 | 0.153 |
| EC | 0.2 | 0.333 | 0.5 | 1 | 2 | 3 | 5 | 6 | 0.107 |
| OC | 0.167 | 0.333 | 0.333 | 0.5 | 1 | 2 | 4 | 5 | 0.077 |
| P | 0.142 | 0.2 | 0.25 | 0.333 | 0.5 | 1 | 2 | 3 | 0.046 |
| K | 0.125 | 0.142 | 0.2 | 0.2 | 0.25 | 0.5 | 1 | 3 | 0.033 |
| N | 0.125 | 0.125 | 0.142 | 0.167 | 0.2 | 0.333 | 0.333 | 1 | 0.021 |
| Class | Description | Kharif (% of Area) | Rabi (% of Area) | ||
|---|---|---|---|---|---|
| Rice | Jute | Potato | Lentil | ||
| S1 | Highly suitable | 29.2 | 6.5 | 21.3 | 12.4 |
| S2 | Moderate suitable | 15.1 | 56.0 | 67.3 | 54.6 |
| S3 | Marginal suitable | 51.2 | 35.4 | 11.3 | 30.0 |
| N | Not suitable | 4.5 | 2.1 | 0.1 | 3.0 |
| Sl. No. | Description | Area (ha) | (% of Area) | Current Crop | Recommended Crop |
|---|---|---|---|---|---|
| Kharif crop | |||||
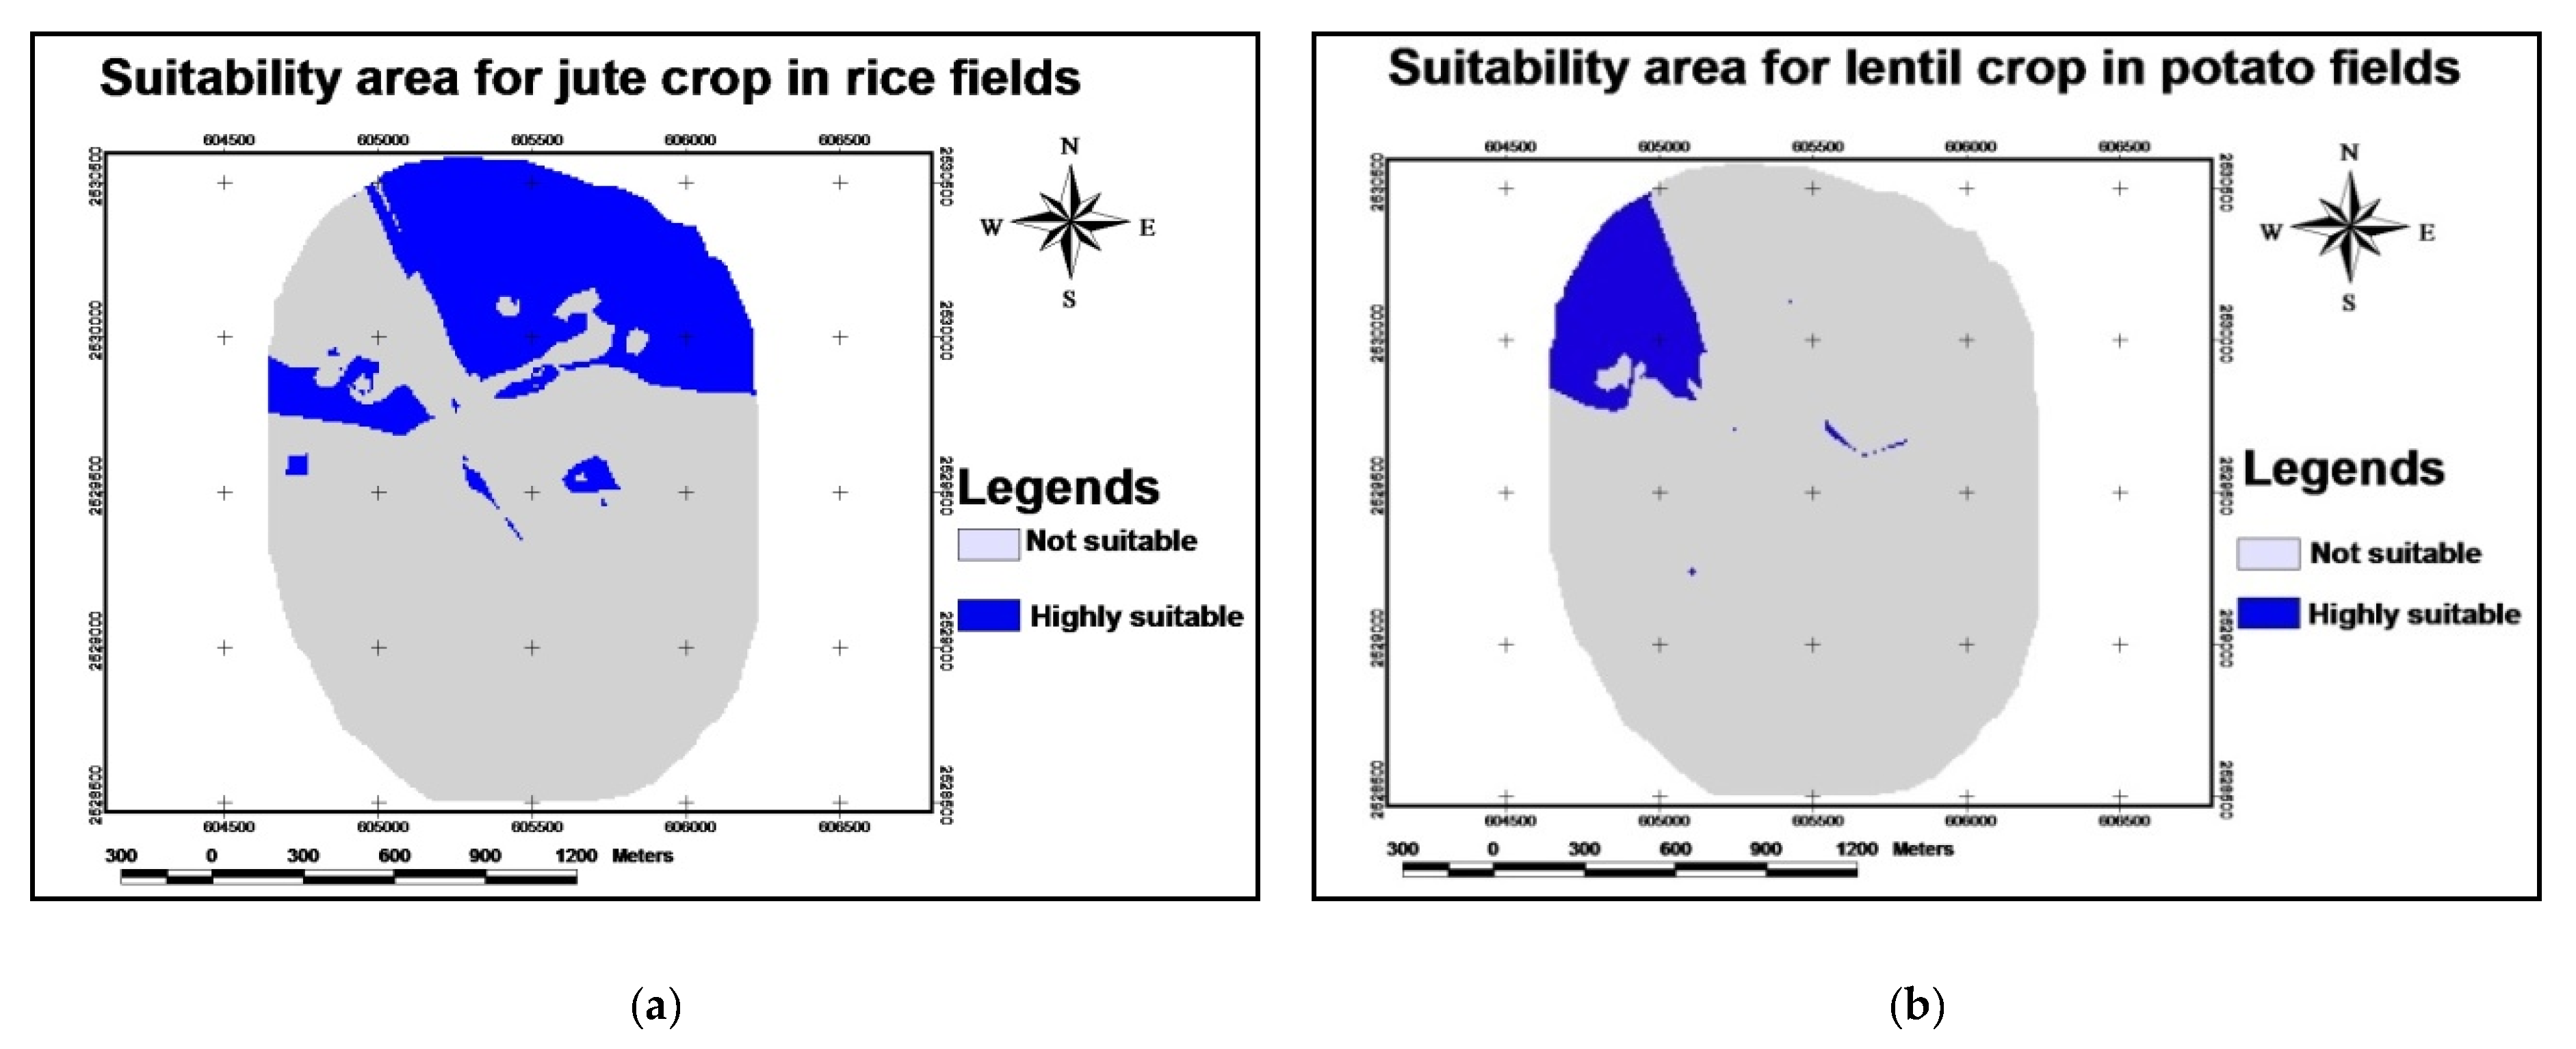
| I | Highly suitable | 217 | 75 | Rice | Rice |
| II | Not suitable | 74 | 25 | Rice | Jute |
| Rabi crop | |||||
| III | Highly suitable | 267 | 92 | Potato | Potato |
| IV | Not suitable | 24 | 8 | Potato | Lentil |
© 2020 by the authors. Licensee MDPI, Basel, Switzerland. This article is an open access article distributed under the terms and conditions of the Creative Commons Attribution (CC BY) license (http://creativecommons.org/licenses/by/4.0/).
Share and Cite
Singha, C.; Swain, K.C.; Swain, S.K. Best Crop Rotation Selection with GIS-AHP Technique Using Soil Nutrient Variability. Agriculture 2020, 10, 213. https://doi.org/10.3390/agriculture10060213
Singha C, Swain KC, Swain SK. Best Crop Rotation Selection with GIS-AHP Technique Using Soil Nutrient Variability. Agriculture. 2020; 10(6):213. https://doi.org/10.3390/agriculture10060213
Chicago/Turabian StyleSingha, Chiranjit, Kishore Chandra Swain, and Sanjay Kumar Swain. 2020. "Best Crop Rotation Selection with GIS-AHP Technique Using Soil Nutrient Variability" Agriculture 10, no. 6: 213. https://doi.org/10.3390/agriculture10060213
APA StyleSingha, C., Swain, K. C., & Swain, S. K. (2020). Best Crop Rotation Selection with GIS-AHP Technique Using Soil Nutrient Variability. Agriculture, 10(6), 213. https://doi.org/10.3390/agriculture10060213