Article

Leaf Characteristics at Recovery Stage Affect Seed Oil and Protein Content Under the Interactive Effects of Nitrogen and Waterlogging in Rapeseed

1
MOA Key Laboratory of Crop Ecophysiology and Farming System in the Middle Reaches of the Yangtze River, College of Plant Science and Technology, Huazhong Agricultural University, Wuhan 430070, China
2
Oil Crops Research Institute of Chinese Academy of Agricultural Sciences, Wuhan 430070, China
3
Haimen Municipal Guidance Station for Crop Cultivation and Technology, Haimen 226100, China
4
College of Agriculture, Jinhua Polytechnic, Jinhua 321007, China
*
Author to whom correspondence should be addressed.
Agriculture 2020, 10(6), 207; https://doi.org/10.3390/agriculture10060207
Submission received: 23 April 2020 / Revised: 22 May 2020 / Accepted: 2 June 2020 / Published: 6 June 2020
(This article belongs to the Section Crop Production)

Abstract

:
Four nitrogen rates (0, 90, 180, and 270 kg ha−1) were applied to the waterlogging-tolerant variety ZS 9 and the sensitive variety GH01. Seedlings with five leaves were waterlogged for 0 (control) or 10 days to investigate the effects of nitrogen on the quality of waterlogged rapeseed. Compared with controls, the seed oil content of waterlogged rapeseed increased slightly in GH01 and significantly in ZS 9 with nitrogen application, which can be explained by the following. (1) after waterlogging, the biomass distribution in roots and leaves of ZS 9 decreased, which alleviated physiological water shortage. Conversely, biomass distribution in roots of GH01 increased, which was not synchronized with the leaf biomass change. (2) After waterlogging at 90–270 kg N ha−1, the leaf number at bolting and flowering was increased in ZS 9 but decreased in GH01 compared with the control. The decrease in leaf area and SPAD value were greater for GH01 after waterlogging, which limited photosynthesis. (3) The leaf soluble protein at bolting was highest in ZS 9 and lowest in GH01. The sensitive variety showed poor growth. The inhibition of seed protein synthesis resulted in an increase in the oil content of waterlogged rapeseed with nitrogen. The seed oil of the waterlogging-tolerant variety was most significantly negatively correlated with leaf soluble protein content at the flowering stage, while the protein content showed the opposite correlation. The seed oil of the waterlogging-sensitive variety was most significantly negatively correlated with the number of leaves at the bolting and flowering stage, while the seed protein content had opposite correlations.

1. Introduction

Rapeseed (Brassica napus L.) is the world’s second largest oil crop after soybeans [1]. China is one of the main producers of rapeseed, with a large planting area accounting for about 30% of the worldwide area. Rapeseed oil also represents the largest production of edible vegetable oil in China. The Yangtze River basin is an advantageous region for producing rapeseed in China. However, the main planting mode of water and drought rotation, coupled with the wet and rainy spring of the region [2], causes rapeseed at the seedling and flowering stages to be easily waterlogged, becoming a major natural disaster that restricts the production of rapeseed [3,4]. Outside China, global climate change is causing heavy rainfall to be common in Europe and North America, corresponding to the more frequent occurrence of waterlogging [5]. Hence, waterlogging has become a major natural disaster that restricts the production of rapeseed globally.
The development of crop reproductive growth requires substances and energy stored in nutrient organs [6]. Thus, environmental stresses affecting vegetative growth can affect seed yield and quality [7]. In cereals, tolerance to waterlogging is related to the duration of the waterlogging event, the crop development stage in which waterlogging occurs, and the sensitivity of the genotype. de San Celedonio et al. [8] identified that the time around anthesis was the most susceptible period to waterlogging in wheat and barley. Arduini et al. [9] showed that of the two cultivars, one (cv. Blasco) was tolerant to waterlogging and the other (cv. Aquilante) was sensitive, thus confirming that there are high genotypic differences in terms of tolerance to waterlogging in wheat. In rapeseed, Xu et al. [10] found that the oil content of seeds was not obviously changed after waterlogging at the initial flowering stage, while oil production significantly decreased. Boem et al. [11] also found that the effect of waterlogging on oil content was not significant; however, the protein content increased. Other studies have shown that oil content increases from 42% to 45%, while protein content decreases after waterlogging at the bolting and flowering stages [12]. Compared with the reproductive stage, rapeseed in the vegetative growth stage is more sensitive to waterlogging [10,12]. Thus, the effect of waterlogging on the seed quality of rapeseed is inconsistent, differing with the duration of the waterlogging event, the crop development stage in which waterlogging occurs, and the sensitivity of genotype.
When soil is flooded, soil gas exchange is severely obstructed [13]. Free oxygen (O2) is rapidly depleted and CO2 accumulates [14]. Root metabolism is converted from aerobic to anaerobic, and ATP synthesis is severely obstructed [15], which hinders the absorption of water and nutrients by the root, and inhibits growth of the aboveground parts [16]. Stomatal closure, chlorophyll degradation, and photosynthetic inhibition eventually lead to premature leaf senescence [17]. Nitrogen fertilizer is the main cultivation method for regulating crop growth, and it plays an important role in the regulation of crop growth after abiotic stress. Meyer et al. [18] suggested that, after short-term waterlogging, high N (as NO3) increases the accumulation of biomass in corn plants compared to low N. Nitrogen fertilizer plays an active role in improving the growth, yield and protein quality of waterlogged feed crops, and there is a positive linear correlation between the content of coarse protein per plant and nitrogen application rate [19]. Increased nitrogen fertilizer increases yield and protein content of wheat and barley after short-term waterlogging [20]. However, Zhang et al. [21] found no improvement in rice growth following NO3 treatment under hypoxia conditions. Ashraf et al. [22] studied the effects of the interaction between nitrous nitrogen fertilizer and waterlogging at the seedling stage on corn growth. The results showed that the wet weight of aboveground parts, leaf area, leaf water potential, and chlorophyll a and b decreased more under higher-nitrogen conditions, indicating that supplementation with NO3 had a negative impact on waterlogged corn. Under waterlogging conditions, too much nitrogen reduces soil redox potential [23], most likely because excessive NO3 results in NH4 accumulation, which, when accumulated to a certain extent, inhibits plant growth and causes metabolic toxicity [24]. Therefore, when using nitrogen fertilizer to regulate the growth of waterlogged crops in order to alleviate the loss of yield and poor quality caused by waterlogging, nitrogen application needs to be considered to avoid negative effects.
With increased demands for rapeseed oil and requirements for improved quality, the goal of rapeseed cultivation has changed from high-yield to high-quality production. The oil content and protein content are the basic quality indices for rapeseed. The leaf area and photosynthesis at flowering stage are directly related to seed yield and oil content. After removal of the leaves, seed yield and oil content decrease [25]. The carbon and nitrogen contents of the leaves are key indicators of the physiological status of the leaf, and they are also the two main organic categories; their metabolism is closely related and they are regulated by each other [26]. Soluble sugar is the main carbohydrate and can be transported into the seed, where it is the main carbon source for fat metabolism of seeds in rapeseed [27]. Soluble protein is the main nitrogen compound of the leaf. After bolting, the N reuse of the leaf can effectively meet the seed development, affecting yield and quality [28]. We therefore speculate that the characteristics of leaves and carbon and nitrogen metabolism are the key factors affecting the seed oil and protein content of rapeseed.
In summary, current research on waterlogging and nitrogen fertilizer regulation focuses more on cereals crops such as wheat, corn, barley. Previous research on the effects of waterlogging on rapeseed has focused on evaluation of waterlogging tolerance of different rapeseed varieties by seed yield [4,10], or the regulatory role of plant growth regulators during flooding [29,30]. The aim of this study was to analyze the effect of different nitrogen application rates and waterlogging, applied during seedling stages, on seed oil content and protein content of rapeseed varieties with different tolerance to waterlogging, and their relationships with leaf characteristics were also clarified.

2. Materials and Methods

2.1. Plant Cultivation

A pot experiment was conducted at the experimental site of Huazhong Agricultural University in 2016–2017. A split-plot experiment was performed with two varieties as the main plot, four nitrogen application amounts as the split plots, and two waterlogging days as split-split plots. The rapeseed varieties ZS 9 (waterlogging-tolerant variety) and GH01 (sensitive variety) previously selected by Zou et al. [31] were used. The two verities had opposing gene expression patterns but also had the different ability to regulate genes with the same expression patterns in response to waterlogging stress. Rapeseed was sowed on October 6th in pots (30 cm in diameter × 40 cm in height) filled with 15 kg of well-mixed soil, which was collected from the 0–30 cm soil layer at the experimental station (organic matter was 11.62 mg g−1 and available N, P and K were 41.27, 39.92 and 138.30 mg kg−1 of soil, respectively). Seedlings were thinned at the three-leaf stage, and one plant was kept in each pot. Four different N application rates were applied: 0, 90, 180, and 270 kg ha−1 (0, 0.25, 0.50 and 0.75 g pot−1), respectively. N fertilizer (provided by urea) was applied as base fertilizer, seedling fertilizer and bolting fertilizer at a ratio of 6:2:2. Applications of P2O5 (provided by calcium per phosphate) and K2O (provided by potassium chloride) were used at 150 kg ha−1 (0.42 g pot−1) as base fertilizers. Borax was applied at a rate of 15 kg ha−1 (0.042 g pot−1) as a one-time application. Waterlogging was applied at the seedling stage (five leaves, BBCH 15) [32] for 0 days (WL0) and 10 days (WL10) for each N application rate. The waterlogging treatment maintained 2 cm of visible water on the surface of the root collar of rapeseed seedlings. Each treatment was conducted in three replicates with 40 pots in one replicate. Other management followed conventional methods.

2.2. Measured Indicators and Methods

Twelve representative plants were sampled from each treatment at the seedling stage (23 days after the end of waterlogging, BBCH 19), the bolting stage (54 days after waterlogging, BBCH 32) and the flowering stage (79 days after waterlogging, BBCH 63), with three replicates. Whole plants were removed from pots by water flushing and rinsed with distilled water to clean. Six plants were randomly selected from each treatment to calculate the biomass. The leaves from the other six plants were stored in a freezer at −80 °C for measurement of physiological indicators.

2.2.1. Seed Quality

Five grams of the seeds was collected from the main stem of the mature plant, with three replicates. Near-infrared spectroscopy was used to determine the oil content and protein content of rapeseed.

2.2.2. Agronomic Traits

Biomass accumulation and distribution: each plant was separated into different organs. The root was cut off from the cotyledon nodes. Dry weight was determined by oven drying at 65 °C to constant weight. The biomass accumulation and distribution were then calculated.
The total leaf number included all the fallen and unfallen leaves from the first leaf scar of the root to the last unfolded leaf. The leaf area of a single plant was measured using a LI-3100C AREA METER leaf area scanner (LICOR, Lincoln, NE, USA). SPAD values of five plants were measured in each replicate using a SPAD-502plus chlorophyll meter, with three measurement points on the bottom three leaves of each plant, then a mean value was determined.

2.2.3. Soluble Sugar Content

Soluble sugar content was determined by Anthrone colorimetry. Fresh leaves (0.50 g) were weighed and extracted in boiling water for 30 min (twice). The extracted solution was filtered into a 25-mL-capacity bottle, and then 0.5 mL was transferred into a test tube with 1.5 mL distilled water, 0.5 mL onion ketone ethyl acetate and 5 mL concentrated sulfuric acid. The solutions were mixed thoroughly and placed in a boiling water bath for 1 min. The absorbance was measured at a wavelength of 630 nm.
Soluble sugar content (mg g−1) = [(m × VT × N)/(m0 × Vs × 106)] × 100
In this equation, m is the amount of sugar (µg) found from the standard curve; VT is the total volume of the extracted solution (mL); Vs is the sample volume taken for measurement (mL); N is the dilution factor; 106 is 1 g = 106 µg; and m0 is the sample mass (g).

2.2.4. Soluble Protein Content

Soluble protein was determined with the Coomassie Blue staining method. Fresh leaves (0.1 g) were weighed and ground with 5 mL distilled water into a homogenate, which was centrifuged at 1300× g for 10 min. The supernatant (0.2 mL) was transferred to a test tube with 5 mL Coomassie Blue G-250 solution. After being mixed thoroughly, this was allowed to sit for 2 min before colorimetric analysis at 595 nm. The absorbance value was determined and the protein content was found using a standard curve. Calculation equation:
Protein content in the sample (mg g−1) = C × VT/(VS × WF × 1000)
In this equation, C is the value from the standard curve (ug); VT is the total volume of the extracted solution (mL); VS is the sample volume taken for measurement (mL); and WF is the sample wet weight (g).

2.3. Data Analysis

Data processing was conducted using Microsoft Excel 2013 and SPSS 21.0 for the Windows software package (SPSS Inc., Chicago, IL, USA). Figures were generated using the Microsoft Excel 2013 software program. All results were subjected to analysis of variance separately for different sampling dates. To evaluate the effect of waterlogging on leaf characteristics and seed oil and quality, data were arranged in a split-split plot design with varieties allocated as main plots, nitrogen application rates as subplots, and waterlogging days as sub-subplots. Three replicates were used. An LSD test was applied to assess the differences between treatments at a significant level of 5%. Linear regression analyses were used to determine the relationships between the measured parameters.

3. Results

3.1. Seed Quality

With increasing nitrogen application rate, the seed oil content decreased. The effects of waterlogging on oil content varied among different nitrogen application rates. The seed oil content of the two varieties increased after waterlogging with nitrogen application, compared to that of plants without waterlogging. However, this increase decreased gradually with increase in the nitrogen application rate. The seed oil content of ZS 9 increased by 34.7% and 23.6%, while that of GH01 increased by 7.7% and 5.7% after waterlogging, with nitrogen application rates of 90 and 180 kg ha−1. The oil content showed a slight decrease, but was not statistically significant after waterlogging without nitrogen application (Figure 1A).
With increasing nitrogen application rate, the seed protein content first increased and then decreased, reaching its highest with a nitrogen application rate of 180 kg ha−1. Waterlogging effects on protein content varied among different nitrogen application rates and varieties. After waterlogging, the seed protein of GH 01 decreased with a nitrogen application rate of 180–270 kg ha−1, while that of ZS 9 slightly increased, but was not statistically significant (Figure 1B).

3.2. Biomass Accumulation and Distribution

Compared with the plants without waterlogging, the biomass of waterlogged rapeseed significantly decreased at the seedling and bolting stages, and greater decline was found with increasing nitrogen application rate and the sensitive variety GH01. With nitrogen application, the biomass accumulation of waterlogged rapeseed was higher than that of the control at the flowering and maturation stages, with the maximum increase seen with nitrogen application rates of 90 kg ha−1 and 180 kg ha−1 for ZS 9 and 180 kg ha−1 and 270 kg ha−1 for GH01 (Table 1).
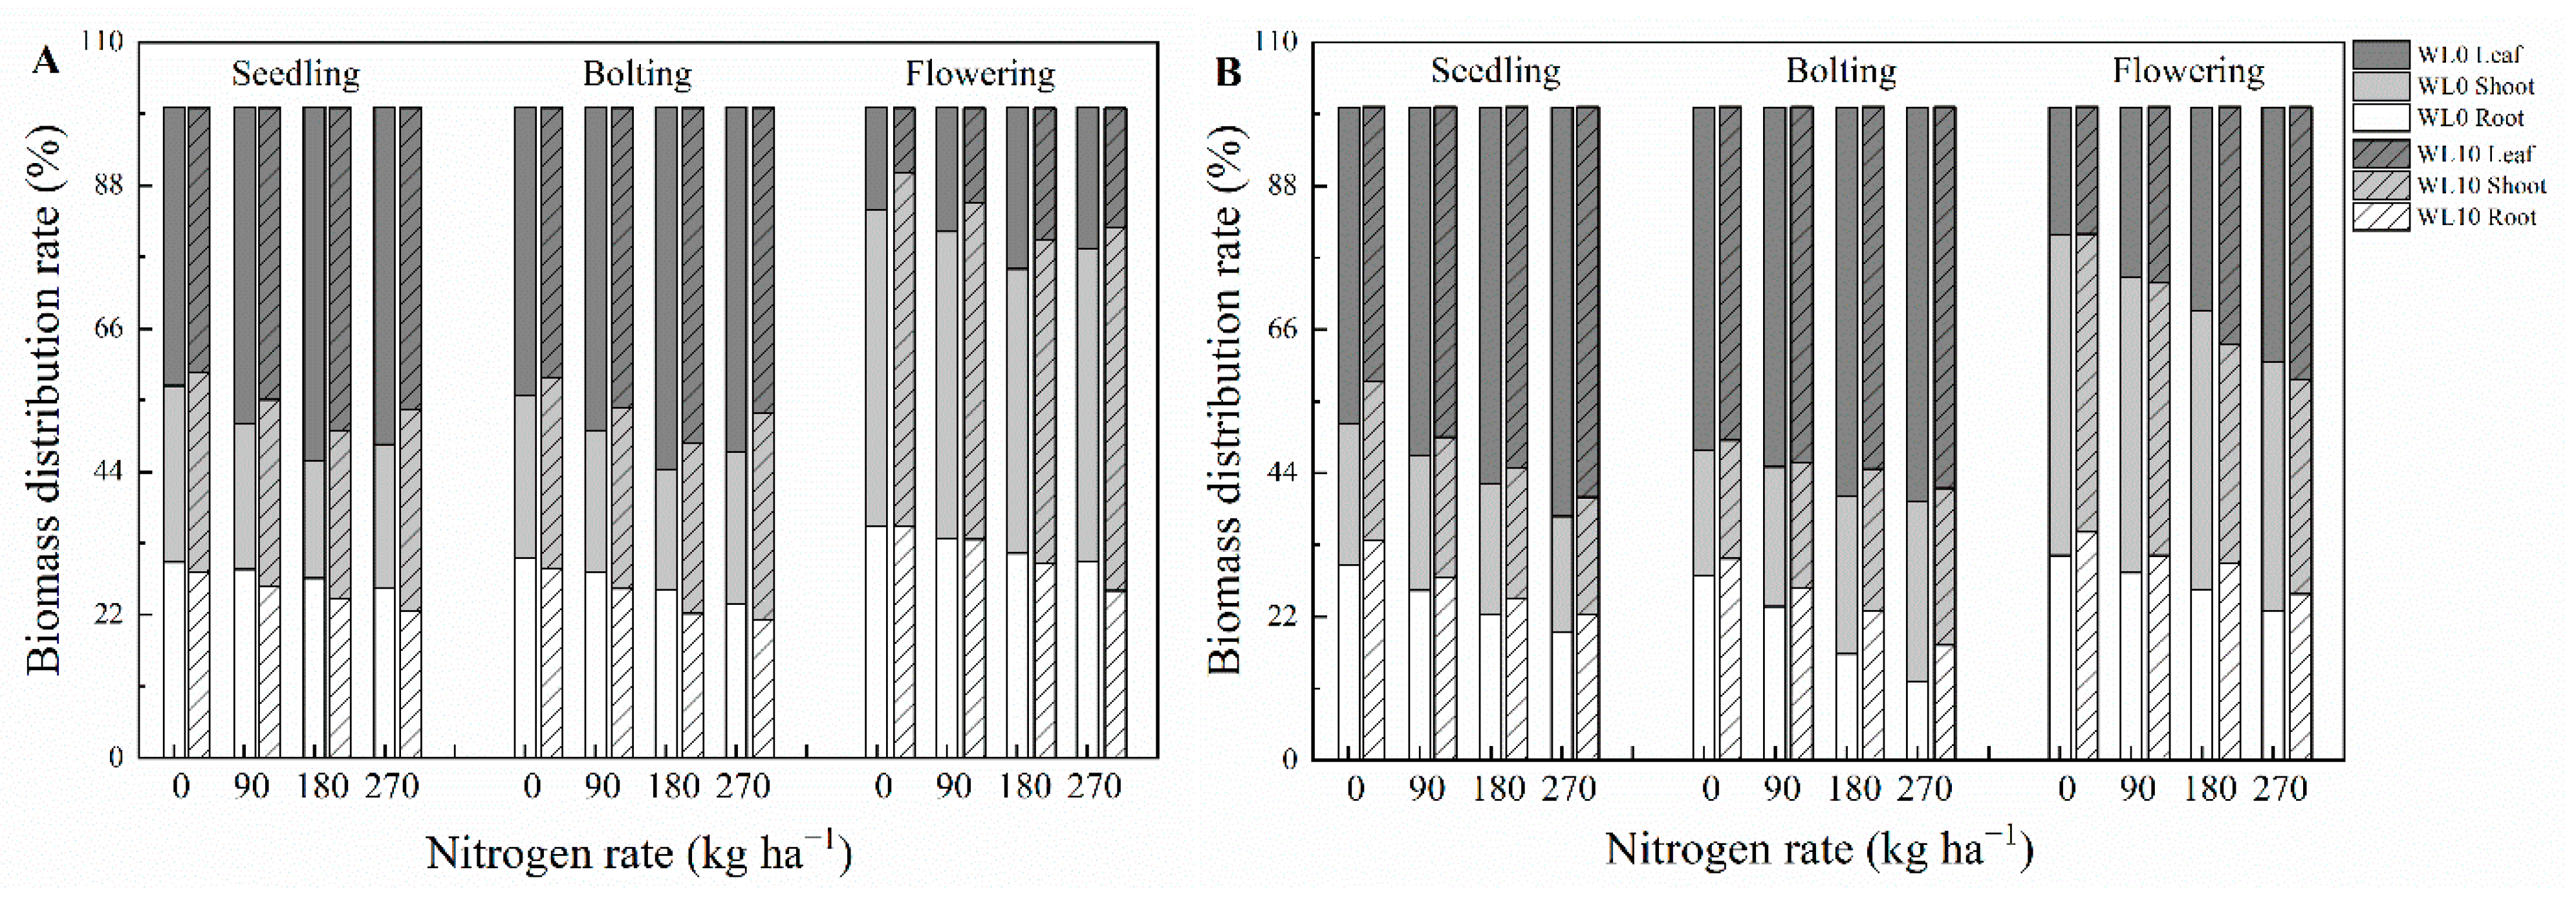
With the increase in nitrogen application rate, especially from 90 kg ha−1 to 270 kg ha−1, the biomass distribution rate in roots was significantly reduced while that in leaf was significantly increased. Biomass distribution in leaves of ZS 9 increased with increasing nitrogen application rate and then decreased, with a peak value at 180 kg ha−1, while that of GH01 increased with the increase in nitrogen application rate, with a peak value at 270 kg ha−1. After waterlogging, biomass distribution in the roots and leaves of ZS 9 decreased, while the biomass distribution in stems increased. In GH01, the biomass distribution in roots at seedling, bolting and flowering stages and in leaves at flowering stages increased, while the biomass distribution in stems at bolting and flowering stages and in leaves at seedling and bolting stages decreased, with the largest variance at 180 kg ha−1 (Figure 2).
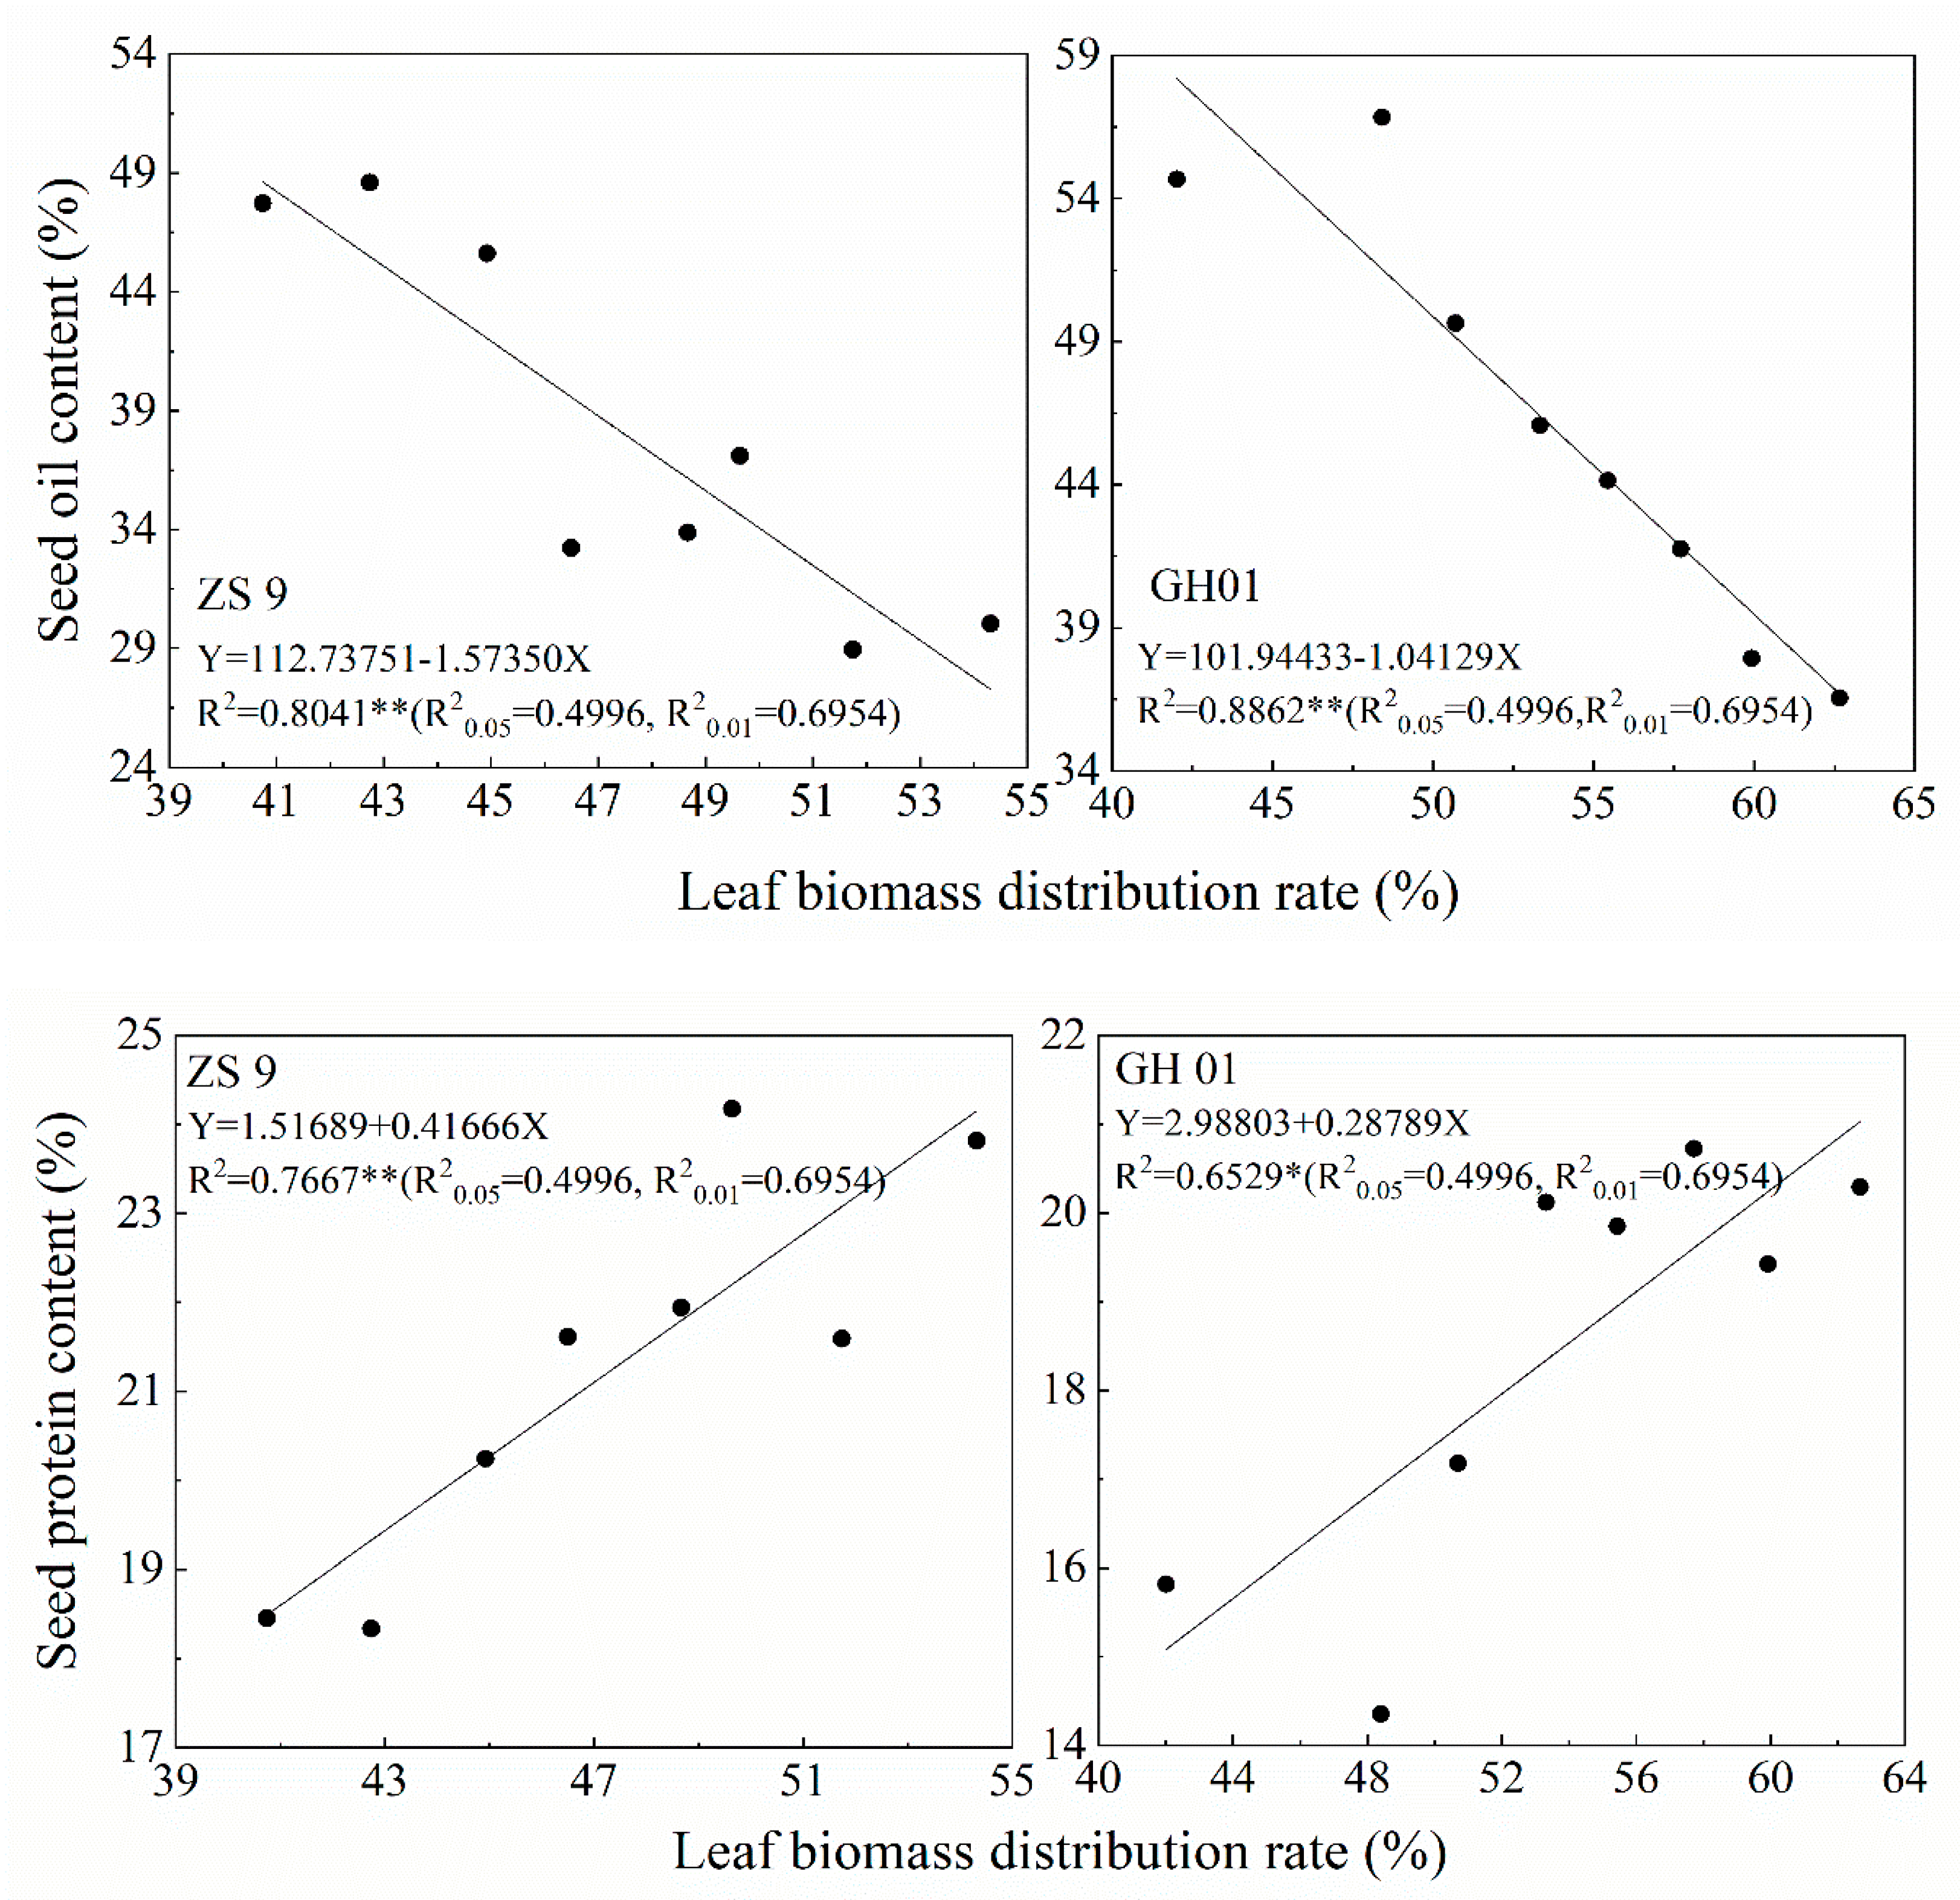
Correlation analysis showed that the biomass distribution in leaves exhibited the highest correlation with the seed oil and protein content at the maturation stage: the biomass distribution rate in leaves showed a very significant negative correlation with the seed oil content. However, it showed a very significant positive correlation with the seed protein content, which was consistent between varieties (Figure 3).

3.3. Leaf Characteristics

3.3.1. Number of Leaves, Leaf Area and SPAD

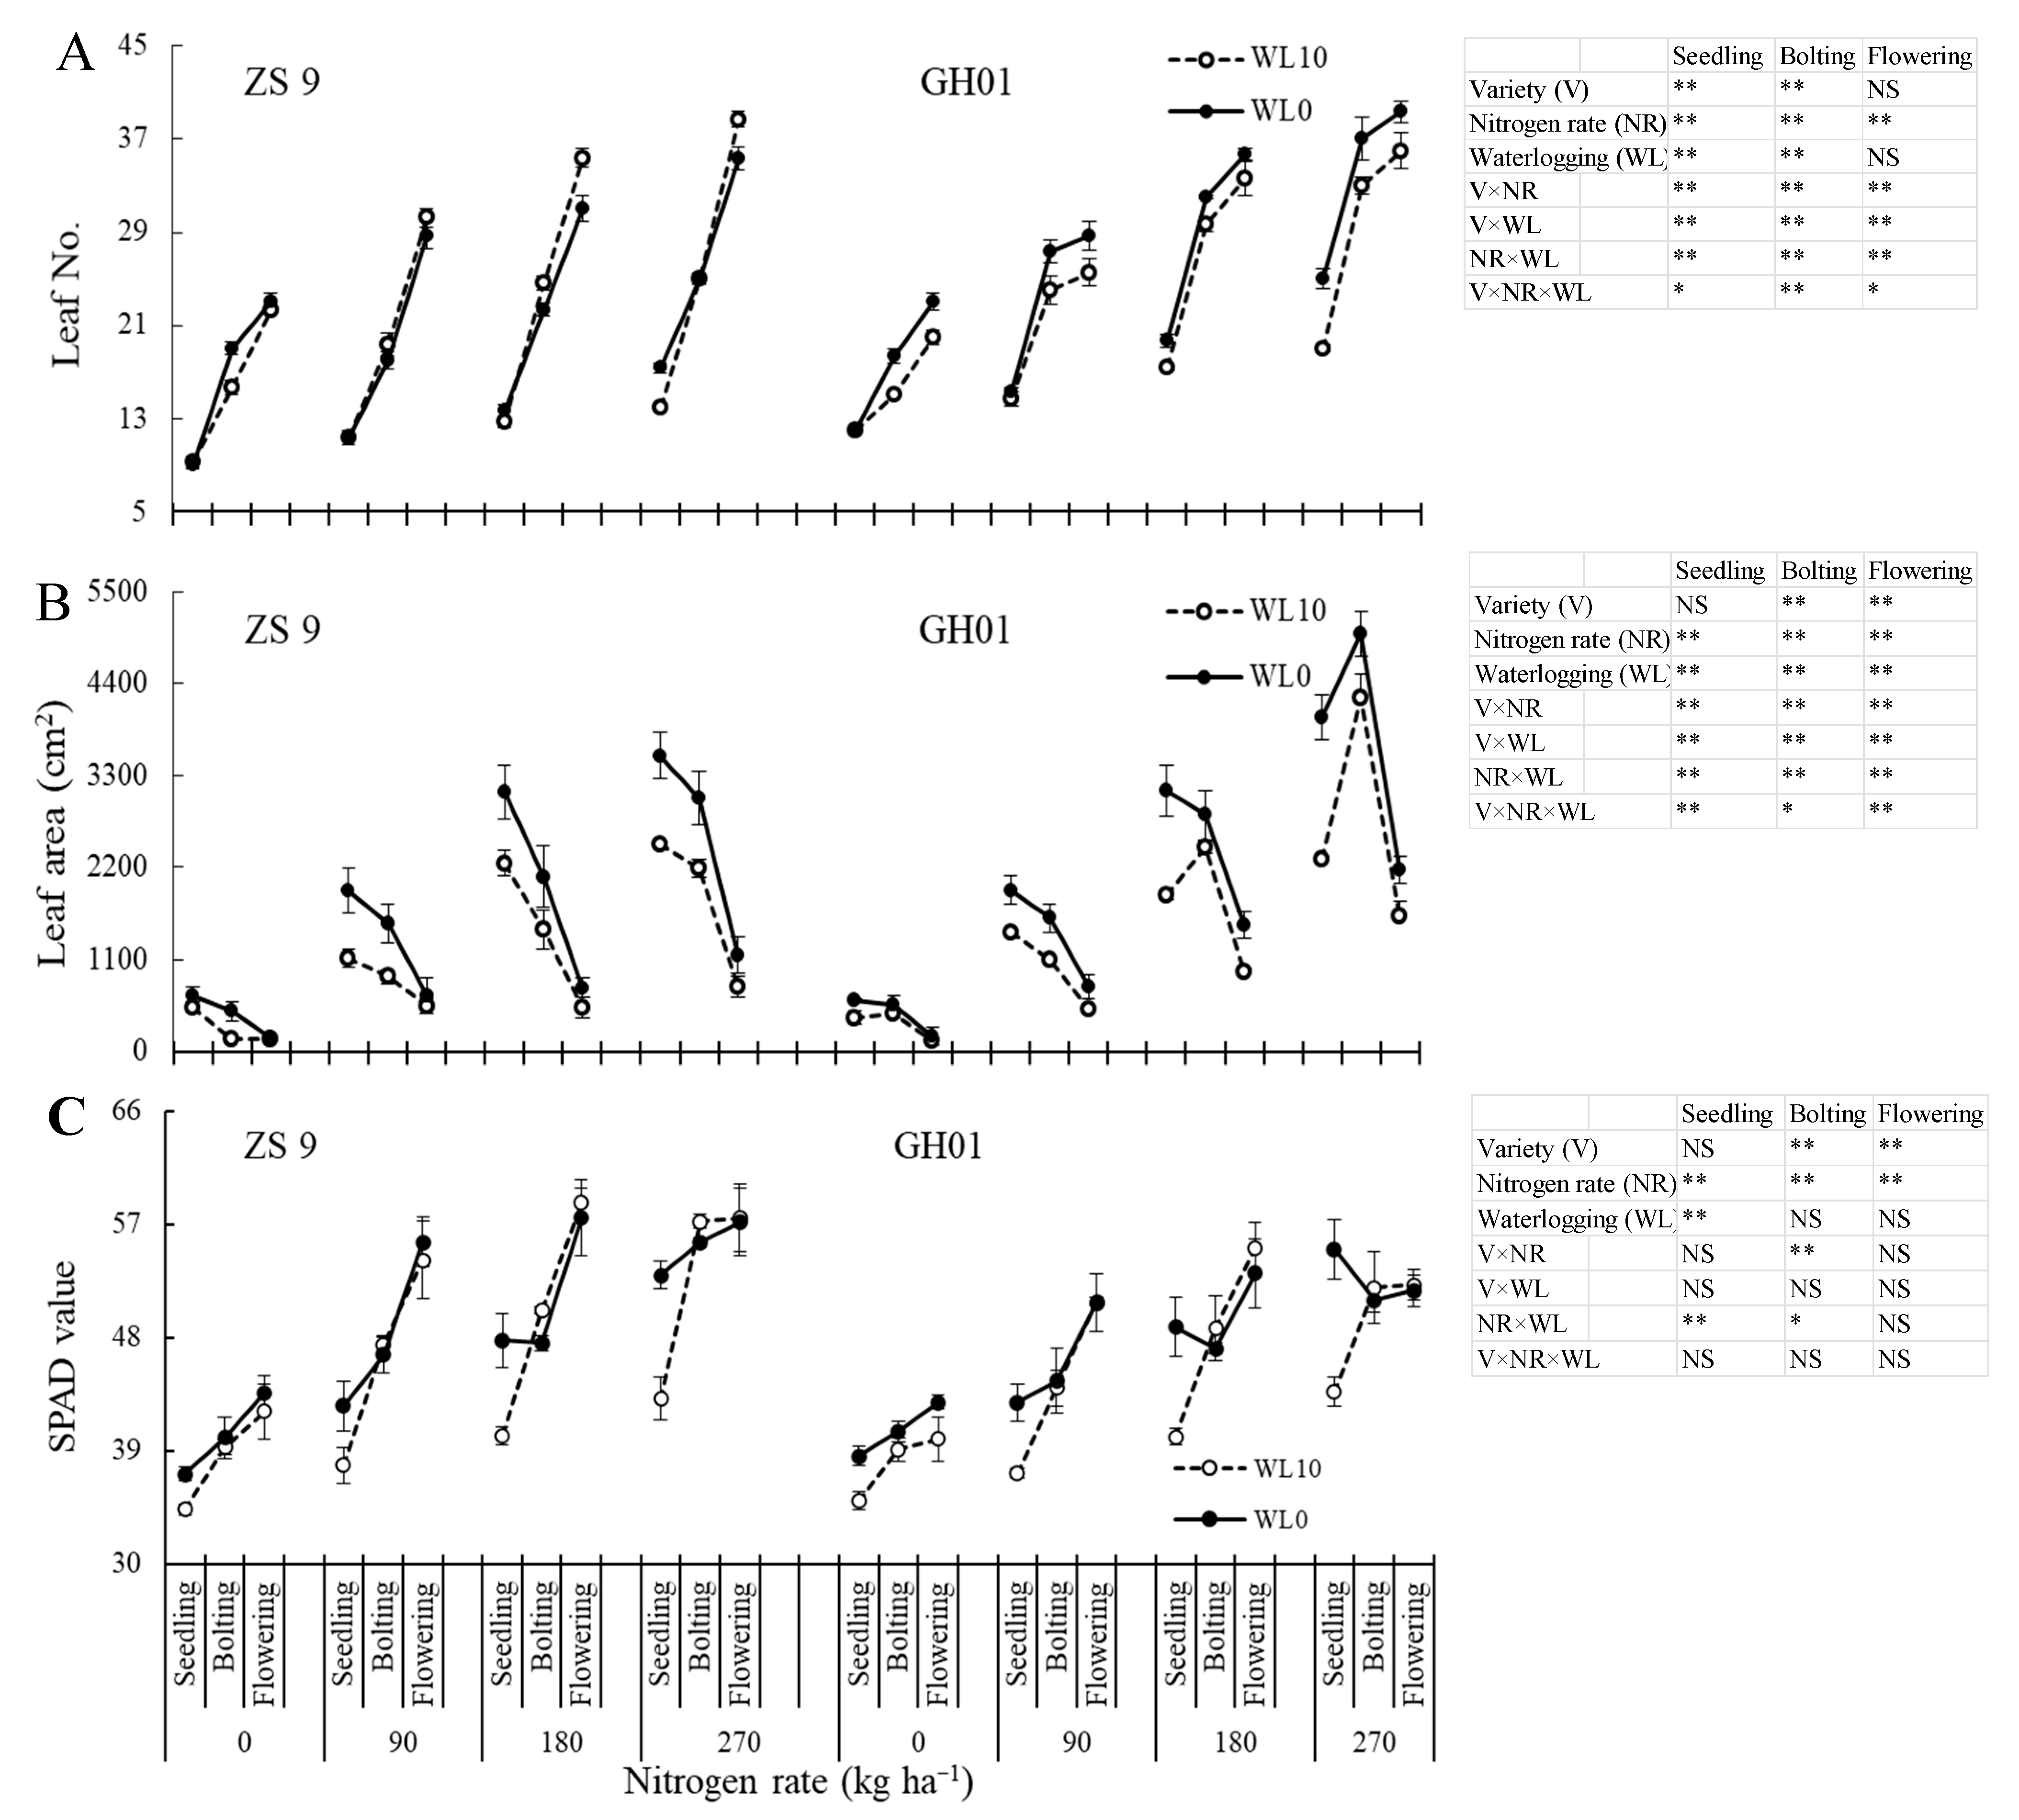
With increasing nitrogen application, the number of leaves and leaf area of the two varieties increased. Waterlogging effects on the number of leaves varied among different nitrogen application rates and varieties. The number of leaves of ZS 9 decreased without nitrogen application, while it increased with nitrogen application rates of 90–270 kg ha−1 after waterlogging at the bolting and flowering stages. The number of leaves of GH01 significantly decreased after waterlogging with all nitrogen application rates. The effect of nitrogen fertilizer on the leaf area of waterlogged rapeseed was more consistent between varieties: compared with the plants without waterlogging, the leaf area of waterlogged rapeseed decreased, with the greatest effect observed at the seedling stage, and the decrease was greater with increasing nitrogen application rate (Figure 4A,B).
With increasing nitrogen application rate, the SPAD of leaves increased. Compared with plants without waterlogging, the leaf SPAD value at the seedling stage was greatly reduced by waterlogging, and the decrease became greater with increasing nitrogen application rate: the decrease in GH01 was higher than that in ZS 9 (20.6% and 18.5%, respectively) with nitrogen application rates of 270 kg ha−1. Leaf SPAD values at the bolting and flowering stages of the two varieties were slightly higher, but were not statistically significantly different than those of the control after waterlogging with nitrogen application rates of 180–270 kg ha−1 (Figure 4C).

3.3.2. Soluble Sugar Content

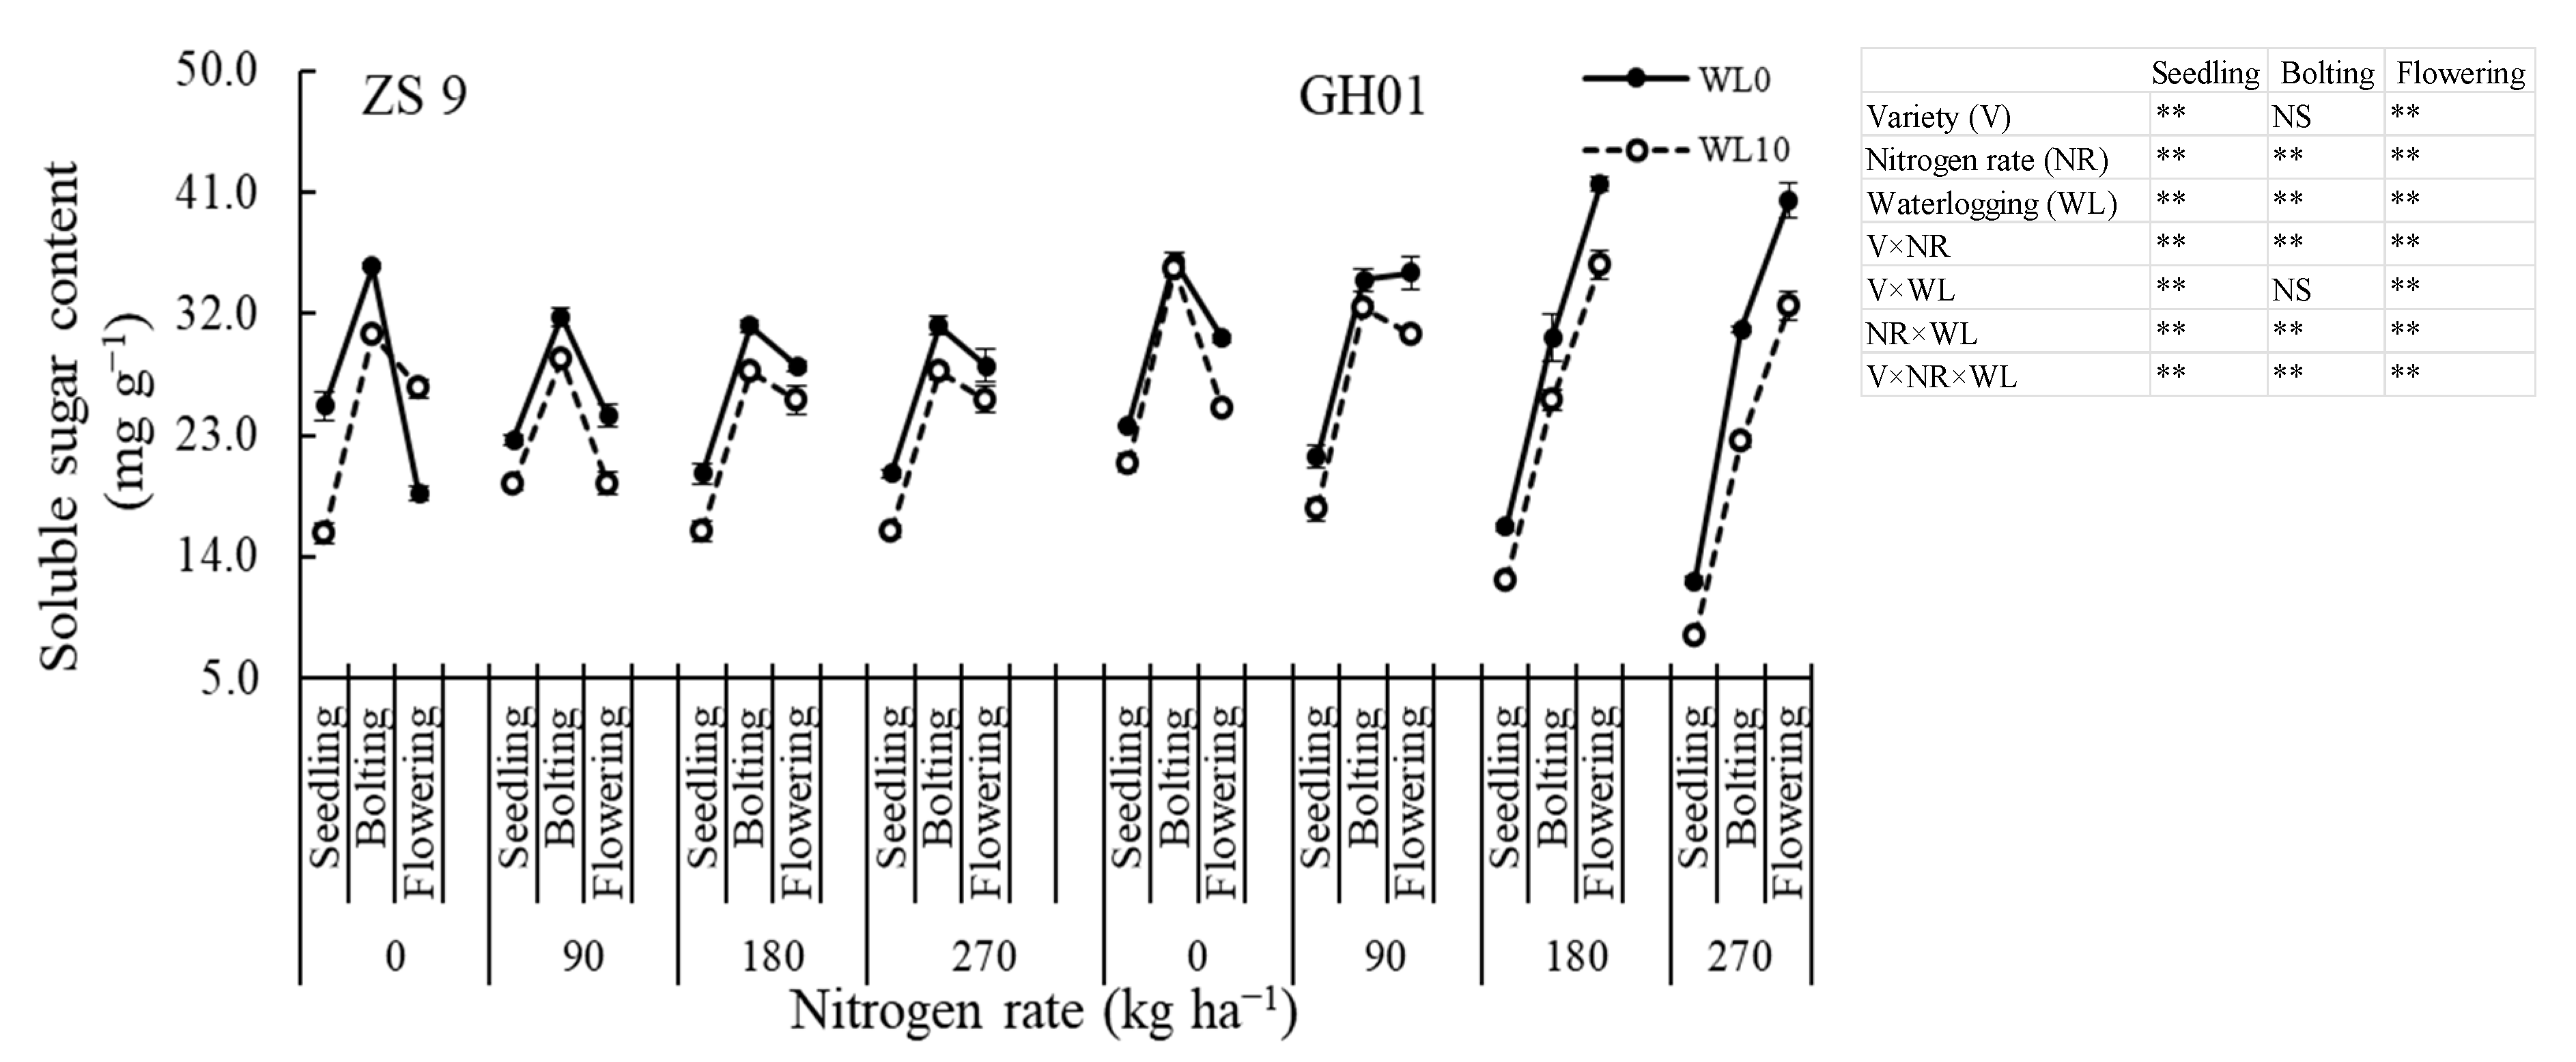
Compared with other treatments, with nitrogen application rates of 180 kg ha−1 to 270 kg ha−1, the peak value of leaf soluble sugar content in GH01 was shifted from the bolting stage to the flowering stage. Leaf soluble sugar contents were all lower than that of the control at different stages after waterlogging with nitrogen application. The ANOVA showed a significant difference under NR×WL at the three stages. A greater decrease in the leaf soluble sugar content of the waterlogged rapeseed was found with more nitrogen and GH01 at the seedling stage. The soluble sugar contents of ZS 9 and GH01 decreased by 7.2% and 11.8% without nitrogen application, and 26.1% and 33.3%, respectively, with nitrogen application rate of 270 kg ha−1 after waterlogging. At the bolting and flowering stages, a smaller decrease in the leaf soluble sugar content of the waterlogged rapeseed was found with more nitrogen and ZS 9 (Figure 5).

3.3.3. Soluble Protein Content

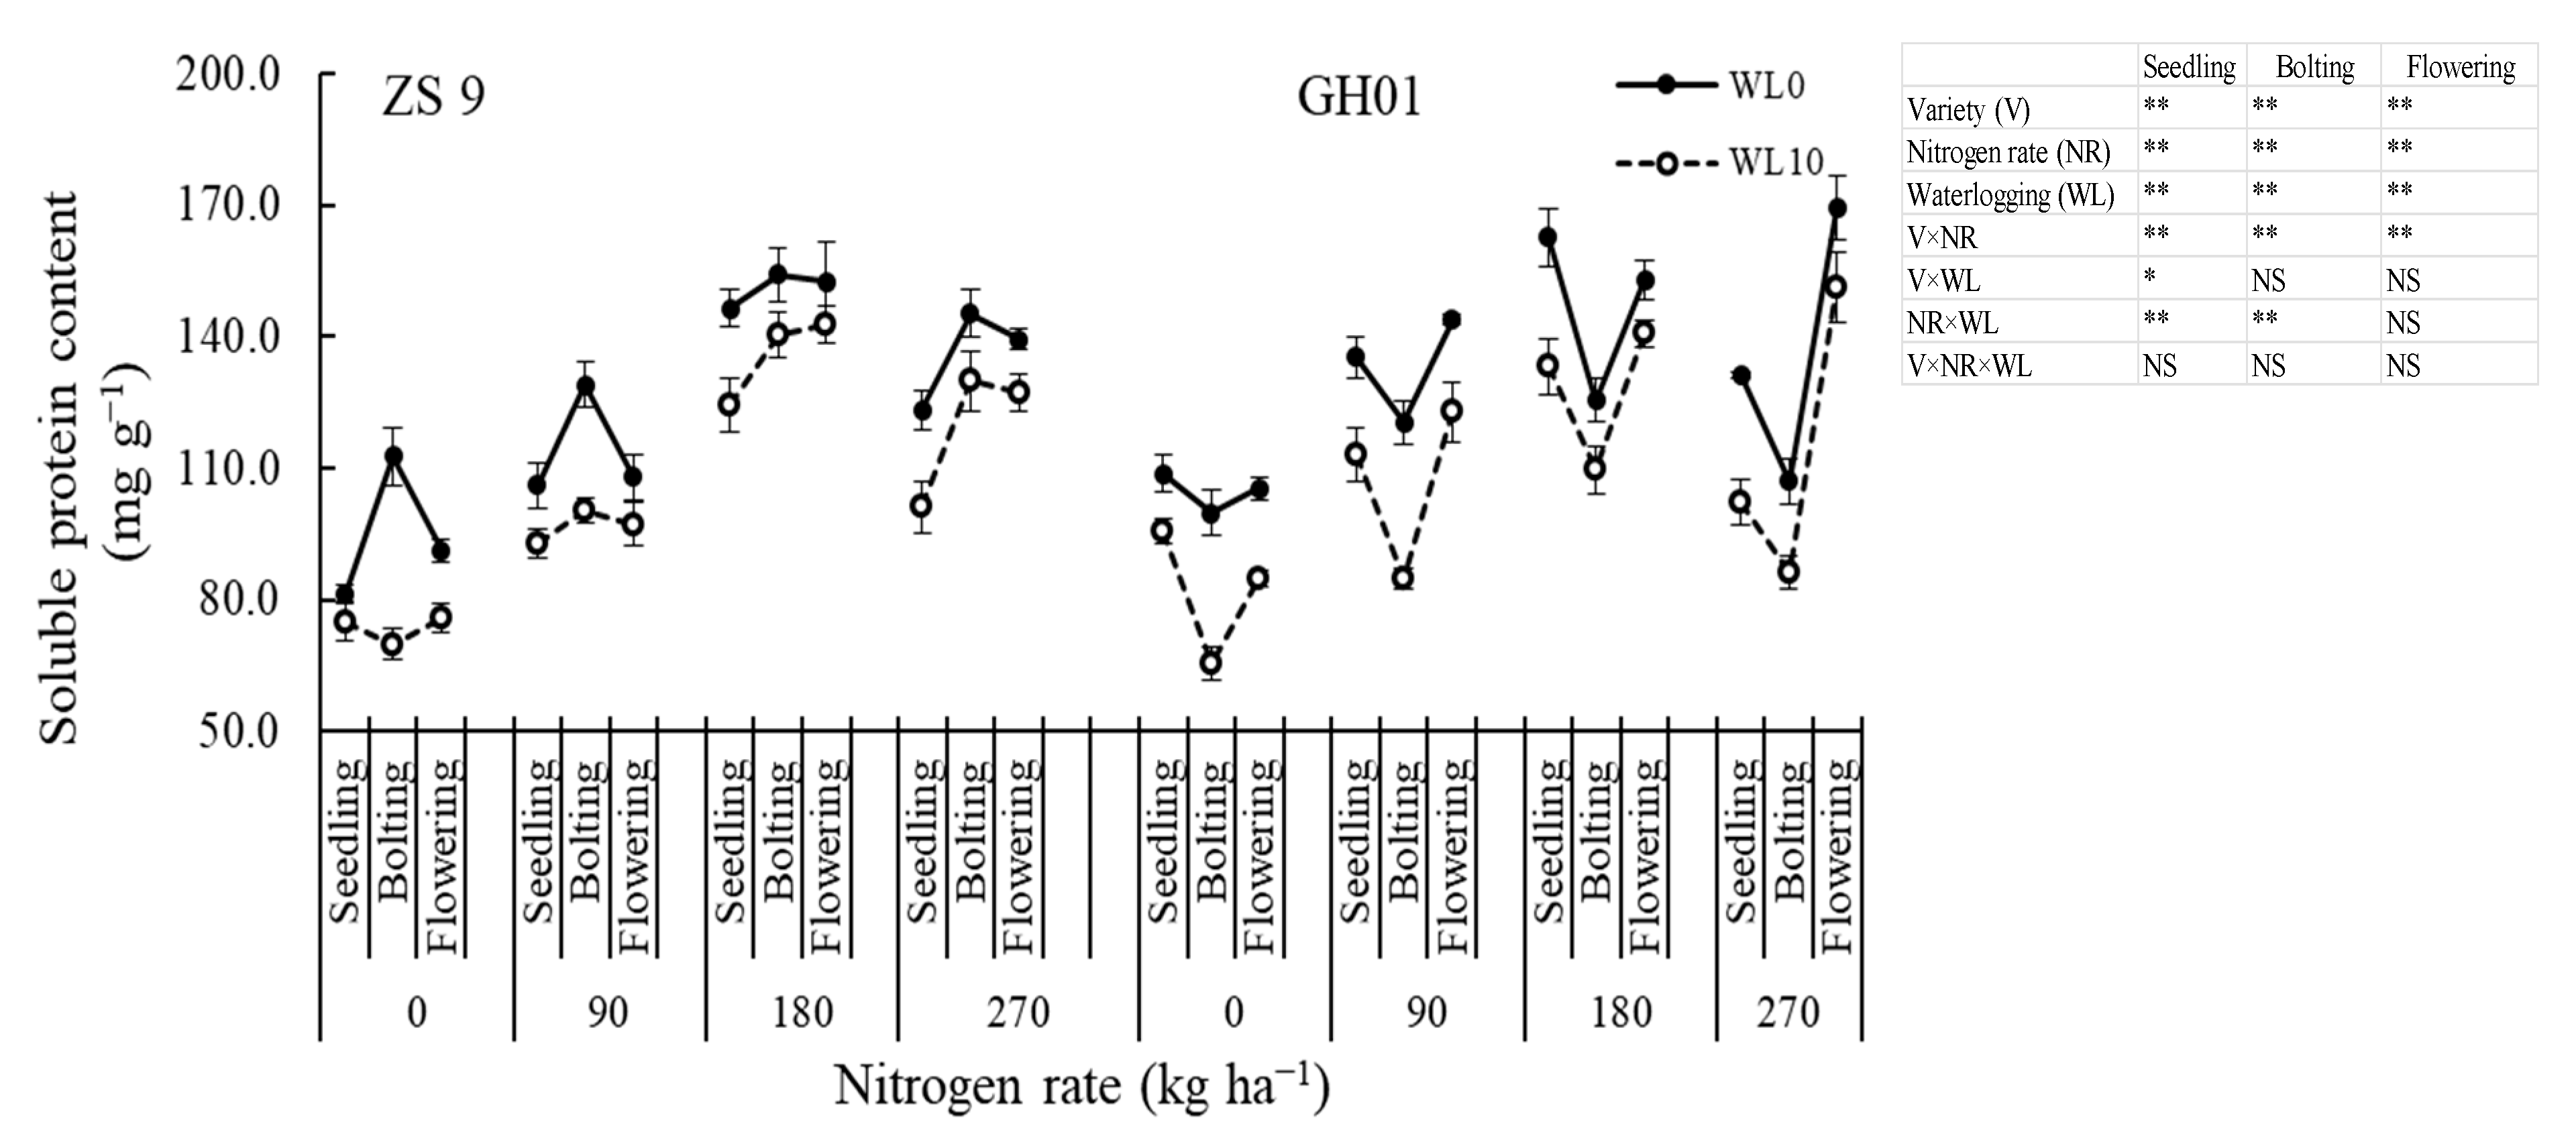
The leaf soluble protein content of ZS 9 increased firstly and then decreased, with a peak value at the bolting stage, while that of GH01 decreased firstly and then increased, with a minimum at the bolting stage with development stages. It increased first and then decreased, showing the highest value in both varieties at a rate of 180 kg ha−1 with the increase in nitrogen application rate. The ANOVA showed a significant difference under NR × WL at seedling and bolting stages. The leaf soluble protein content after waterlogging significantly decreased, and the maximum decrease was observed at the bolting stage. The decrease became smaller with increasing nitrogen application rate. The leaf soluble protein content at the bolting stage of ZS 9 decreased by 38.0% and 8.9% with nitrogen application rates of 0 and 180 kg ha−1, respectively, while that of GH01 decreased by 34.4% and 12.6%, respectively (Figure 6).

3.4. Relationship Between Leaf Growth and Seed Oil and Protein Content

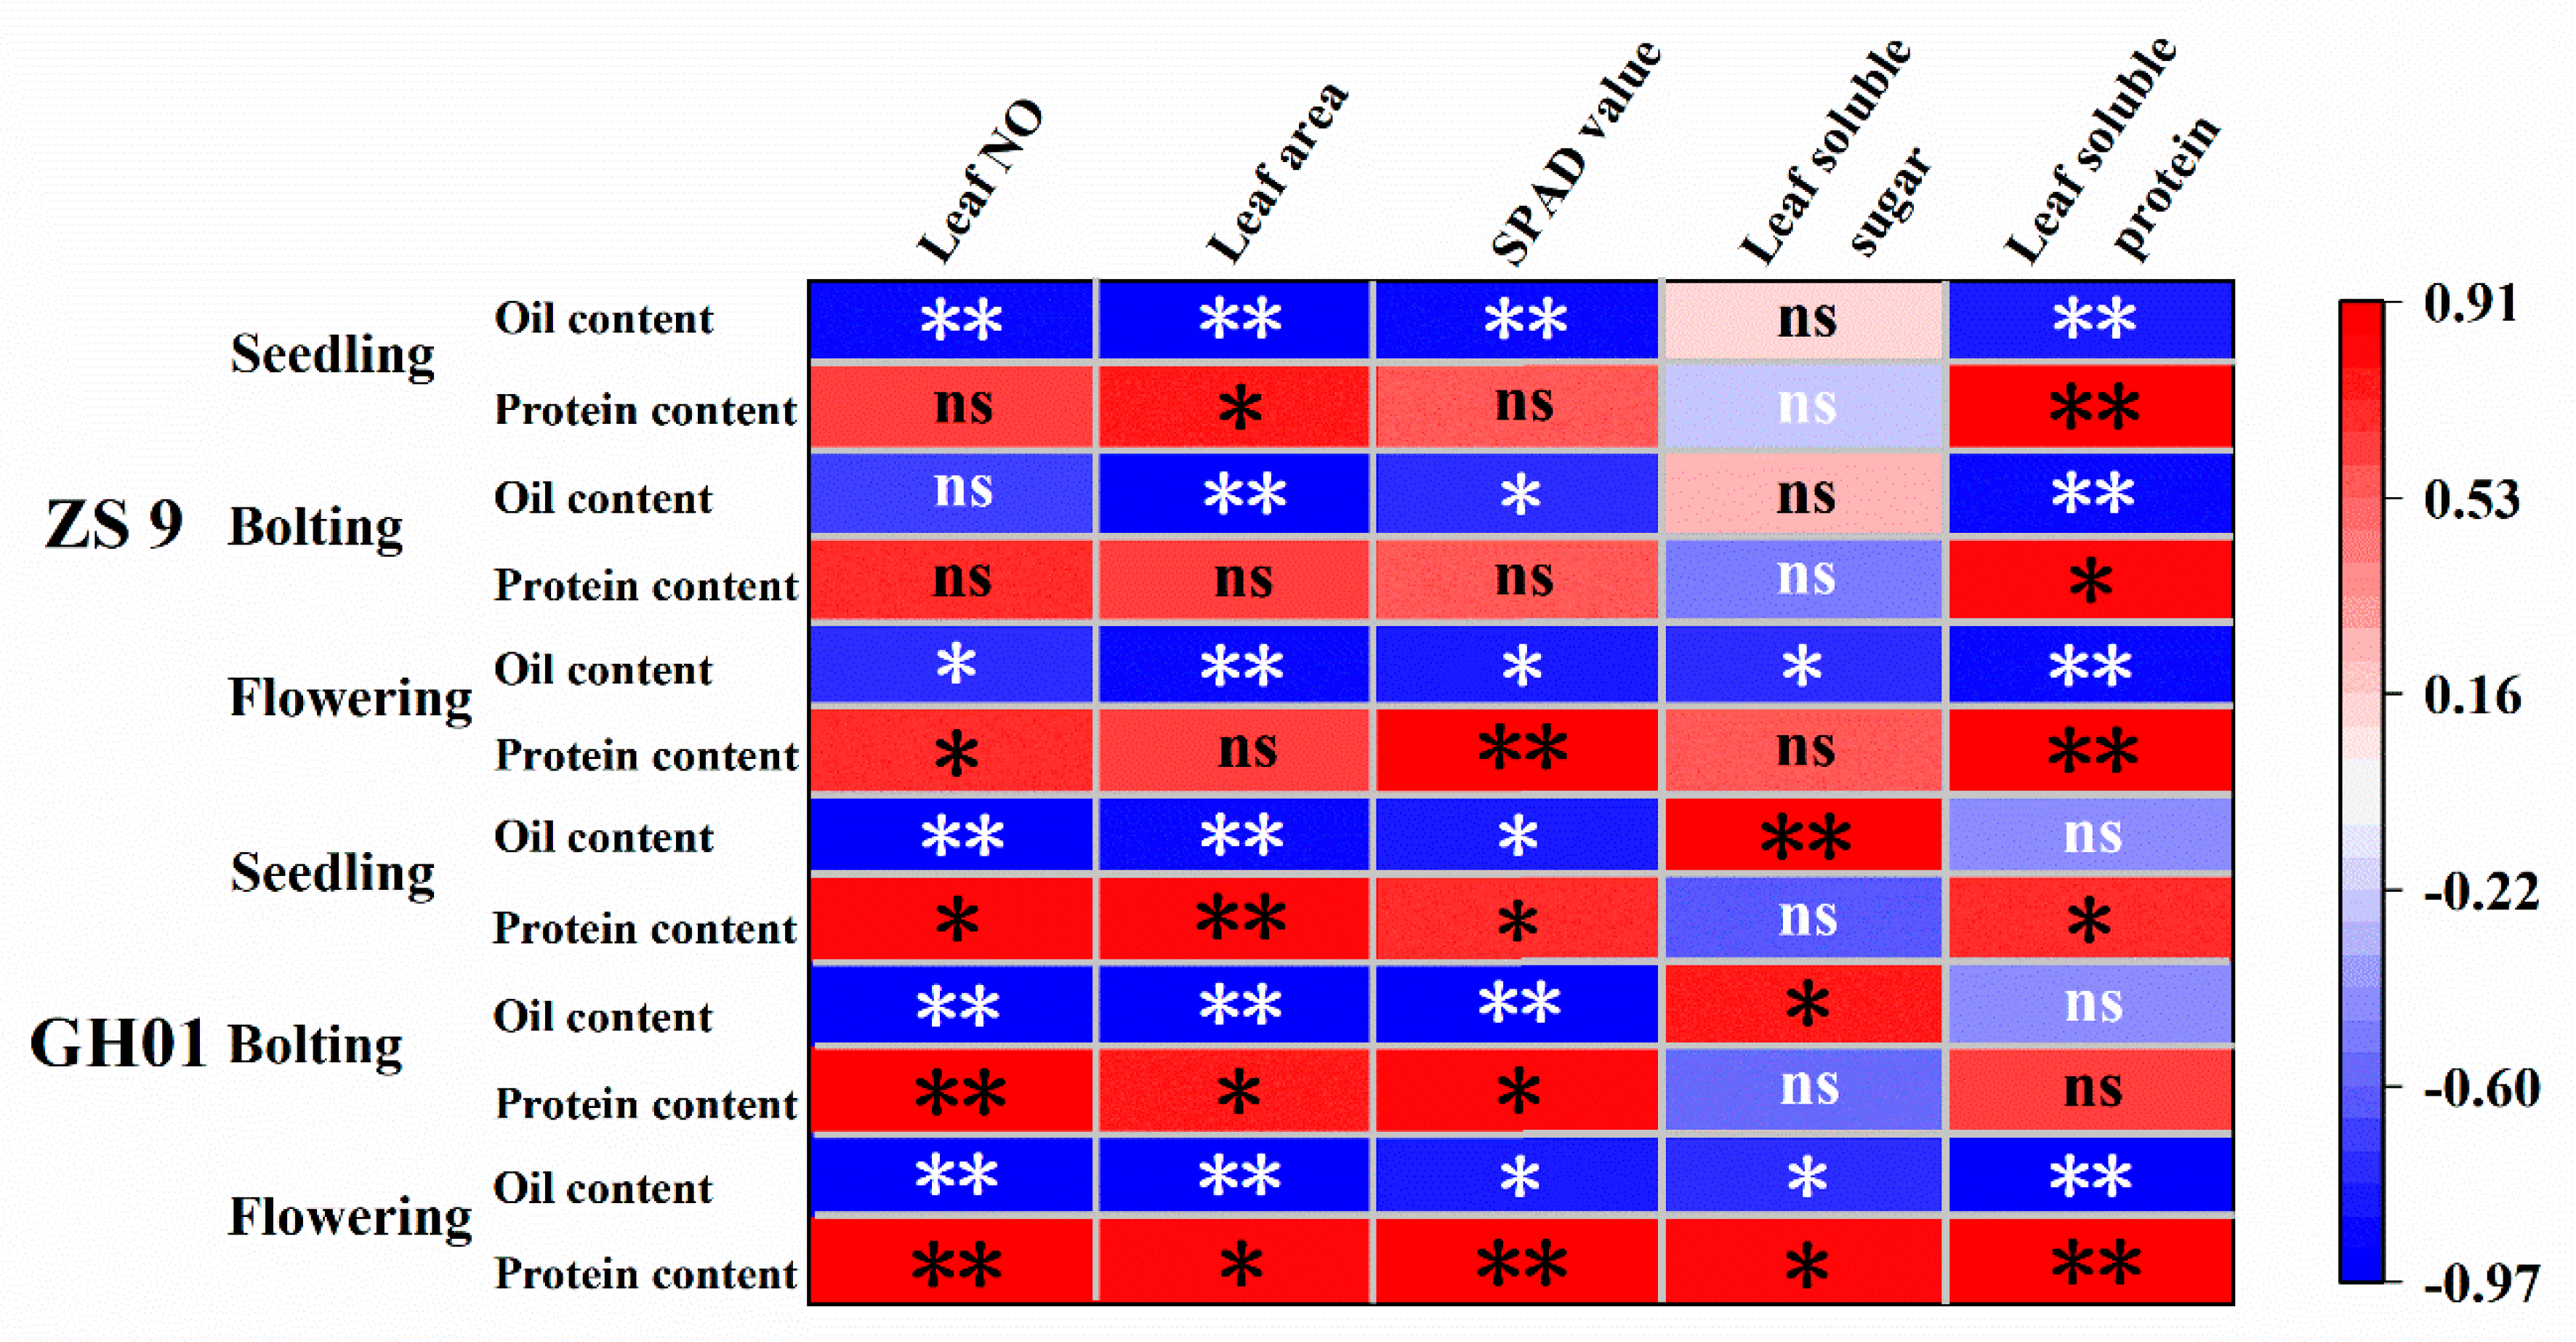
The seed oil of ZS 9 was most significantly negatively correlated with leaf soluble protein content at the flowering stage, while the protein content showed the opposite correlation. The seed oil content of GH01 was significantly negatively correlated with the number of leaves, leaf area and SPAD value, while the seed protein content had opposite correlations, with the most significant correlation with the number of leaves among the three indicators, and the greatest correlation with bolting stage among the different stages (Figure 7).

4. Discussion

The efficiency of winter rapeseed cultivation is mainly determined by the seed yield, followed by the oil content [33], which are influenced by a combination of growth rate, the duration of nutritional growth and seed filling [34]. They are also influenced by genes, environment, cultivation methods and their interactions [35]. The Yangtze River basin is the main production area of rapeseed in China; however, because of the planting mode of rice–rapeseed rotation and the excessive rain in spring and autumn, rapeseed is often subjected to different degrees of waterlogging stress. Based on previous studies, it is clear that waterlogging can affect seed yield by influencing plant aboveground growth and development [29]. Reasonable nitrogen application is an important cultivation method to improve waterlogging tolerance. Previous studies have focused on the regulatory effects of nitrogen fertilizer on the yield of waterlogged crops [36], and the regulatory mechanisms of nitrogen fertilizer on quality of cereal crops have been reported [37], but the regulatory mechanism of nitrogen fertilizer on the quality of rapeseed remains unknown. We therefore carried out studies to clarify the regulatory mechanism of nitrogen application on the quality of waterlogged rapeseed.
Under suitable water conditions, the root has strong capability to absorb water and nutrients, promoting the accumulation of aboveground biomass, and increasing yield and quality. However, under waterlogging conditions, aerobic respiration of the root is inhibited by lack of oxygen in the soil and weakened by the moisture and nutrient absorbance of the root, directly affecting the plant aboveground growth [38,39,40]. Our study showed that, after 10 days of waterlogging at the seedling stage, the biomass accumulation of rapeseed at the seedling and bolting stages was still significantly lower with a nitrogen application rate of 0–270 kg ha−1, and it decreased with increasing nitrogen application, while biomass accumulation at the flowering and maturation stages was significantly higher than that of the plants without waterlogging, with the greatest increase with a nitrogen application rate of 180 kg ha−1. Biomass is the basis for the yield and quality of crops, and the balanced development of each organ had great importance in crops with high yield and quality [41]. Under the conditions of different nitrogen application rates and waterlogging, the biomass distribution of rapeseed changed significantly, and there were obvious differences between varieties. The root and leaf biomass distribution of ZS 9 decreased, while that of stems increased. In GH01, the root biomass distribution at the seedling, bolting and flowering stages increased, while the leaf and stem biomass distributions varied among different stages. Previous studies have shown that the biomass of the root and aboveground plant decreases after waterlogging, with the influence of the root being more than that of the aboveground plant, and biomass is more inclined to distribute to the aboveground plant. This may be an effective metabolic adaptation of the crop under waterlogging conditions, reducing root biomass to reduce the oxygen consumption by the root during aerobic respiration [42]. In the present study, the biomass distribution in roots of the waterlogging-tolerant variety ZS 9 decreased, while the biomass distribution in leaves also decreased, mainly caused by a decrease in leaf area. In the waterlogging and recovery periods, a decrease in leaf area can reduce the evapotranspiration of leaves to reduce water consumption, which is also an adaptive response to the decreased root biomass distribution under physiological water shortage conditions, and this adaptive change continued to the flowering stage. However, the biomass distribution in roots of the sensitive variety increased after waterlogging, which was inconsistent with the change in the biomass of leaves. This may be an important cause of differences in waterlogging resistance between the two varieties. Previous studies have suggested that seed oil content correlated closely with BnRBCS1A expression levels and Rubisco activities in the silique wall, but not in the leaf [43]. At the pod stage, as leaves age, the silique wall becomes the main photosynthesis organ for carbohydrate assimilation for seed development [44,45]. Correlation analysis showed that, under different nitrogen application rates and waterlogging treatments, the leaf biomass distribution had a significant negative correlation with the seed oil content and a significant positive correlation with protein content, which was consistent between varieties. Under the present conditions, leaf growth directly affected seed quality. The reason for the inconsistency with previous results may be that, under the interactive effects of nitrogen and waterlogging, the metabolic pathways changed and the balance in vegetative and reproductive growth of rapeseed was disturbed. However, the mechanisms require further study. Studies on wheat showed that seed starch content is determined by the carbohydrate supply of the source organ and the transformation of the sink organ [46,47]. The carbon substrate comes from two sources: (1) the carbon assimilated after flowering is directly transported to the seed, and (2) carbohydrates produced and stored by the vegetative organ before flowering are redistributed to the seed in the mid–late stage of seed pod filling [48,49], which validates the results of this study.
The leaf characteristics greatly influenced the photosynthetic efficiency and photosynthesis product distribution to each organ of the crop [50]. The present results showed that the leaf area of waterlogged rapeseed decreased compared with the control, and the decrease was greater with increasing nitrogen application rate, with the greatest effect observed at the seedling stage. The number of leaves of ZS 9 at the bolting and flowering stages decreased after waterlogging without nitrogen application, while they increased with nitrogen application rates of 90–270 kg ha−1. The number of leaves of GH01 showed decreases at all nitrogen application rates after waterlogging. Waterlogging reduced the leaf SPAD value at the seedling stage, and the decrease was greater with increasing nitrogen application rate and in GH01. At the bolting and flowering stages, the leaf SPAD value of the two waterlogged varieties was slightly higher than that of the control with nitrogen application rates of 180–270 kg ha−1. Hence, the number of leaves and SPAD showed compensatory effects at the bolting and flowering stages, while the negative effects of waterlogging on leaf area lasted to the flowering stage, and a greater negative effect was observed under high-nitrogen conditions. Under waterlogging conditions, too much nitrogen could reduce soil redox potential [23], and excessive NO3 might cause NH4 accumulation, which could inhibit plant growth and result in metabolic toxicity when reaching a critical level [24]. Compared with the waterlogging-tolerant variety, there was greater demand for nitrogen fertilizer by the sensitive variety to alleviate waterlogging damage. Appropriate application of nitrogen fertilizer after waterlogging can improve the number of leaves of the waterlogging-tolerant variety, and increase the SPAD value of both waterlogging-tolerant and sensitive varieties, to improve leaf photosynthesis and aboveground biomass accumulation, providing the basis for oil and protein synthesis.
Carbon and nitrogen metabolism play important roles in crop growth and development. Carbon metabolism includes the synthesis, decomposition and conversion of carbohydrates, and nitrogen metabolism includes the synthesis, decomposition and re-synthesis of nitrogen-containing compounds. Carbon metabolism can provide energy and a skeleton for nitrogen metabolism, but nitrogen metabolism and carbon metabolism also have a competitive relationship; therefore, regulation of the carbon and nitrogen metabolism balance is the basis for achieving high quality and high yield in crops [51,52,53]. The present study used soluble sugars to estimate leaf carbon metabolism, and soluble protein content to assess leaf nitrogen metabolism. Compared to other treatments, the peak value of leaf soluble sugar content in GH01 was delayed from the bolting stage to the flowering stage with nitrogen application rates of 180 and 270 kg ha−1. The leaf soluble sugar content of waterlogged rapeseed was lower than that of the control under all nitrogen application rates at different stages, and the decrease became greater at the seedling stage, while it became smaller at the bolting and flowering stages with an increase in nitrogen application rate. The leaf soluble protein content decreased significantly after waterlogging, with the greatest decline at the bolting stage, and less decrease was found with increasing nitrogen application. This indicated that leaf carbon and nitrogen metabolism was still affected during the recovery period. Among the measured indicators related to leaves, the seed protein of ZS 9 had the greatest correlation with leaf soluble protein at the flowering stage, while seed protein content of GH01 showed the greatest correlation with number of leaves at bolting stage, and significantly positively correlated with leaf protein content at flowering stage as well. Previous studies have also shown that soluble proteins are the main nitrogen compounds of the leaves, and the reuse of leaf N after bolting can effectively satisfy seed filling to affect quality [28]. In the present study, the decrease in leaf soluble protein content inhibited the reuse of leaf N for seed filling, resulting in a decrease in seed protein of GH 01 with a nitrogen application rate of 180–270 kg ha−1, but this was not statistically significant. In addition, there was a significant difference in the dynamic change in the soluble protein content with the development stage between the two varieties. The leaf soluble protein content of the waterlogging-tolerant variety reached the highest value, while that of the sensitive variety reached the lowest value, both at the bolting stage. The bolting stage is a key vegetative period. Less leaf protein of the sensitive variety GH01 at the bolting stage adversely affected the seed quality after waterlogging. In addition to the insufficient supply of leaf N at the bolting and flowering stage, fewer leaves in GH01 further inhibited carbohydrate assimilation, resulting in a decrease in seed protein after waterlogging. Seebauer et al. [27] reported that, although the leaf soluble sugar content of rapeseed decreased, the main carbon source for fat metabolism in seed also decreased, which was opposite to our results. In the present study, the decreased leaf soluble protein content inhibited the reuse of leaf N. Under this condition, seed protein synthesis was restricted and storage of carbohydrate in leaves was prioritized to fatty acid synthesis, promoting the accumulation of oil content after waterlogging. However, this increase in seed oil content was gradually reduced with increasing nitrogen application rate. Xu et al. [10] reported that there was still a negative correlation between seed oil and protein content of rapeseed after waterlogging, which was quite similar to our results. In the present study, the optimum nitrogen application rates for the positive regulation of oil and protein content after waterlogging were 90 kg ha−1 and 180 kg ha−1, respectively.

5. Conclusions

The interaction between waterlogging and different nitrogen application rates produced different changes in seed protein and oil content between the varieties, which were closely related to leaf characteristics during the recovery period. With nitrogen application after waterlogging, the biomass distribution of roots and leaves in the waterlogging-tolerant variety decreased simultaneously, the number of leaves increased at the bolting and flowering stages, and leaf soluble protein content was high at the bolting stage, which was beneficial for restorative growth. Although the leaf soluble sugar content decreased and the carbon source for fat metabolism in seed decreased, the storage of carbohydrate in leaf was prioritized to fatty acids synthesis, resulting in a significant increase in seed oil content in waterlogged rapeseed, whereas the seed oil content of the waterlogging-sensitive variety showed a slightly increase, but this was not statistically significant. However, this increase decreased gradually with increasing nitrogen application rate. Therefore, the nitrogen application rate needs to be carefully considered according to the characteristics of different varieties when using nitrogen fertilizer to relieve waterlogging stress. In the present study, the optimum nitrogen application rates for positive regulation in oil and protein content after waterlogging were 90 kg ha−1 and 180 kg ha−1, respectively.

Author Contributions

All authors have read and agree to the published version of the manuscript. J.K. and G.Z. conceived and designed the experiments; J.K. and X.L. performed the experiments; X.L., Y.X. and Z.L. analyzed the data; B.W. and G.Z. edited and revised the paper; J.K. wrote the paper.

Funding

This research was funded by the National Natural Science Foundation Youth Fund of China (31601250), the Industry Technology Research Institute (CARS-12) and the Fundamental Research Fund for the Central Universities (2013PY001).

Conflicts of Interest

The authors declare that there is no conflict of interest.

References

  1. FAO. Food Outlook–Biannual Report on Global Food Markets. 2016. Available online: http://www.fao.org/3/a-I5703E.pdf (accessed on 20 March 2017).
  2. Zhou, W.J. Oilseed rape cultivation. In Cultivation of Crops; Ding, Y.S., Ed.; Shanghai Science and Technology Press: Shanghai, China, 1994; pp. 357–380. [Google Scholar]
  3. Zhou, W.J.; Lin, X.Q. Effects of waterlogging at different growth stages on physiological characteristics and seed yield of winter rape (Brassica napus L). Field Crops Res. 1995, 44, 103–110. [Google Scholar] [CrossRef]
  4. Zou, X.; Hu, C.; Zeng, L.; Cheng, Y.; Xu, M.; Zhang, X. A comparison of screening methods to identify waterlogging tolerance in the field in Brassica napus L. during plant ontogeny. PLoS ONE 2014, 3, e89731. [Google Scholar] [CrossRef] [PubMed] [Green Version]
  5. IPCC. Climate Change 2014: Synthesis Report. Contribution of Working Groups I, II and III to the Fifth Assessment Report of the Intergovernmental Panel on Climate Change; Core Writing Team, Pachauri, R.K., Meyer, L.A., Eds.; IPCC: Geneva, Switzerland, 2014. [Google Scholar]
  6. Chiariello, N.R.; Gulmon, S.L. Stress effects on plant reproduction. In Response of Plants to Multiple Stresses; Academic Press: San Diego, CA, USA, 1991; pp. 161–188. [Google Scholar]
  7. Bouchereau, A.; ClossaisBesnard, N.; Bensaoud, A.; Leport, L.; Renard, M. Water stress effects on rapeseed quality. Eur. J. Agron. 1996, 5, 19–30. [Google Scholar] [CrossRef]
  8. de San Celedonio, R.P.; Abeledo, L.G.; Miralles, D.J. Identifying the critical period for waterlogging on yield and its components in wheat and barley. Plant Soil. 2014, 378, 265–277. [Google Scholar] [CrossRef]
  9. Arduini, I.; Orlandi, C.; Pampana, S.; Masoni, A. Waterlogging at tillering affects spike and spikelet formation in wheat. Crop Pasture Sci. 2016, 67, 703–711. [Google Scholar] [CrossRef]
  10. Xu, M.; Ma, H.; Zeng, L.; Cheng, Y.; Lu, G.; Xu, J.; Zhang, X.; Zou, X. The effect of waterlogging on yield and seed quality at the early flowering stage in Brassica napus L. Field Crops Res. 2015, 180, 238–245. [Google Scholar] [CrossRef]
  11. Boem, F.H.G.; Lavado, R.S.; Porcelli, C.A. Note on the effects of winter and spring waterlogging on growth, chemical composition and yield of rapeseed. Field Crops Res. 1996, 47, 175–179. [Google Scholar] [CrossRef]
  12. Wollmer, A.C.; Pitann, B.; Muehling, K.H. Waterlogging events during stem elongation or flowering affect yield of oilseed rape (Brassica napus L.) but not seed quality. J. Agron. Crop Sci. 2018, 204, 165–174. [Google Scholar] [CrossRef]
  13. Striker, G.G. Flooding Stress on Plants: Anatomical, Morphological and Physiological Responses; Mworia, J.K., Ed.; In Tech Open Access Publisher: Rijeka, Croatia, 2012. [Google Scholar]
  14. Ponnamperuma, F.N. The chemistry of submerged soil. Adv. Agron. 1972, 24, 29–96. [Google Scholar]
  15. Colmer, T.D.; Voesenek, L.A.C.J. Flooding tolerance: Suites of plant traits in variable environments. Funct. Plant Biol. 2009, 36, 665–681. [Google Scholar] [CrossRef]
  16. Malik, A.I.; Colmer, T.D.; Lambers, H.; Setter, T.L.; Schortemeyer, M. Short-term waterlogging has long-term effects on the growth and physiology of wheat. New Phytol. 2002, 153, 225–236. [Google Scholar] [CrossRef]
  17. Araki, H.; Hamada, A.; Hossain, M.A.; Takahashi, T. Waterlogging at jointing and/or after anthesis in wheat induces early leaf senescence and impairs grain filling. Field Crops Res. 2012, 137, 27–36. [Google Scholar] [CrossRef]
  18. Meyer, W.S.; Barrs, H.D.; Mosier, A.R.; Schaefer, N.L. Response of maize to three short-term periods of waterlogging at high and low nitrogen levels on undisturbed and repacked soil. Irrigation Sci. 1987, 8, 257–272. [Google Scholar] [CrossRef]
  19. Sigua, G.C.; Williams, M.; Grabowski, J.; Chase, C.; Kongchum, M. Effect of flooding duration and nitrogen fertilization on yield and protein content of three forage species. Agron. J. 2012, 104, 791–798. [Google Scholar] [CrossRef] [Green Version]
  20. Simpson, N.L.; Brennan, R.F.; Anderson, W.K. Grain yield increases in wheat and barley to nitrogen applied after transient waterlogging in the high rainfall cropping zone of western Australia. J. Plant Nutr. 2016, 39, 974–992. [Google Scholar] [CrossRef]
  21. Zhang, B.G.; Puard, M.; Couchat, P. Effect of hypoxia, acidity and nitrate on inorganic nutrition in rice plants. Plant Physiol. Bioch. 1990, 28, 655–661. [Google Scholar]
  22. Ashraf, M.; Habibur, R. Interactive effects of nitrate and long-term waterlogging on growth, water relations, and gaseous exchange properties of maize (Zea mays L.). Plant Sci. 1999, 144, 35–43. [Google Scholar] [CrossRef]
  23. Ponnamperuma, F.N. Effects of flooding on soils. Chapter 2, In Flooding and Plant Growth; Kozlowski, T.T., Ed.; Academic Press: Orlando, FL, USA, 1984; pp. 9–193. [Google Scholar]
  24. Marschner, H. Mineral Nutrition of Higher Plants, 2nd ed.; Academic Press: London, UK, 1995. [Google Scholar]
  25. Wang, C.; Hai, J.; Yang, J.; Tian, J.; Chen, W.; Chen, T.; Luo, H.; Wang, H. Influence of leaf and silique photosynthesis on seeds yield and seeds oil quality of oilseed rape (Brassica napus L.). Eur. J. Agron. 2016, 74, 112–118. [Google Scholar] [CrossRef]
  26. Paul, M.J.; Foyer, C.H. Sink regulation of photosynthesis. J. Exp. Bot. 2001, 52, 1383–1400. [Google Scholar] [CrossRef]
  27. Seebauer, J.R.; Singletary, G.W.; Krumpelman, P.M.; Ruffo, M.L.; Below, F.E. Relationship of source and sink in determining kernel composition of maize. J. Exp. Bot. 2010, 61, 511–519. [Google Scholar] [CrossRef] [Green Version]
  28. Gironde, A.; Etienne, P.; Trouverie, J.; Bouchereau, A.; Le Caherec, F.; Leport, L.; Orsel, M.; Niogret, M.F.; Nesi, N.; Carole, D.; et al. The contrasting N management of two oilseed rape genotypes reveals the mechanisms of proteolysis associated with leaf N remobilization and the respective contributions of leaves and stems to N storage and remobilization during seed filling. BMC Plant Biol. 2015, 15, 59. [Google Scholar] [CrossRef] [PubMed] [Green Version]
  29. Zhou, W.; Zhao, D.; Lin, X. Effects of waterlogging on nitrogen accumulation and alleviation of waterlogging damage by application of nitrogen fertilizer and mixtalol in winter rape (Brassica napus L). J. Plant Growth Regul. 1997, 16, 47–53. [Google Scholar] [CrossRef]
  30. Leul, M.; Zhou, W.J. Alleviation of waterlogging damage in winter rape by application of uniconazole-Effects on morphological characteristics, hormones and photosynthesis. Field Crops Res. 1998, 59, 121–127. [Google Scholar] [CrossRef]
  31. Zou, X.L.; Zeng, L.; Lu, G.Y.; Cheng, Y.; Xu, J.S.; Zhang, X.K. Comparison of transcriptomes undergoing waterlogging at the seedling stage between tolerant and sensitive varieties of Brassica napus L. J. Integr. Agric. 2015, 14, 1723–1734. [Google Scholar] [CrossRef]
  32. Lancashire, P.D.; Bleiholder, H.; Boom, T.V.D.; Langelüddeke, P.; Stauss, R.; Weber, E.; Witzenberger, A. A uniform decimal code for growth stages of crops and weeds. Ann. Appl. Biol. 1991, 119, 561–601. [Google Scholar] [CrossRef]
  33. Rathke, G.W.; Behrens, T.; Diepenbrock, W. Integrated nitrogen management strategies to improve seed yield, oil content and nitrogen efficiency of winter oilseed rape (Brassica napus L.): A review. Agr. Ecosyst. Environ. 2006, 117, 80–108. [Google Scholar] [CrossRef]
  34. Diepenbrock, W. Yield analysis of winter oilseed rape (Brassica napus L.): A review. Field Crops Res. 2000, 67, 35–49. [Google Scholar] [CrossRef]
  35. Brandt, S.A.; Malhi, S.S.; Ulrich, D.; Lafond, G.R.; Kutcher, H.R.; Johnston, A.M. Seeding rate, fertilizer level and disease management effects on hybrid versus open pollinated canola (Brassica napus L.). Can J. Plant Sci. 2007, 87, 255–266. [Google Scholar] [CrossRef]
  36. Arduini, I.; Baldanzi, M.; Pampana, S. Reduced growth and nitrogen uptake during waterlogging at tillering permanently affect yield components in late sown oats. Front Plant Sci. 2019, 10. [Google Scholar]
  37. Jiang, D.; Fan, X.; Dai, T.; Cao, W. Nitrogen fertilizer rate and post-anthesis waterlogging effects on carbohydrate and nitrogen dynamics in wheat. Plant Soil. 2008, 304, 301–314. [Google Scholar] [CrossRef]
  38. Araki, H.; Hossain, M.A.; Takahashi, T. Waterlogging and hypoxia have permanent effects on wheat root growth and respiration. J. Agron. Crop Sci. 2012, 198, 264–275. [Google Scholar] [CrossRef]
  39. Cannell, R.Q.; Belford, R.K.; Blackwell, P.S.; Govi, G.; Thomson, R.J. Effects of waterlogging on soil aeration and on root and shoot growth and yield of winter oats (Avena sativa L.). Plant Soil. 1985, 85, 361–373. [Google Scholar] [CrossRef]
  40. Masoni, A.; Pampana, S.; Arduini, I. Barley response to waterlogging duration at tillering. Crop Sci. 2016, 56, 2722–2730. [Google Scholar] [CrossRef]
  41. Iwasa, Y.; Roughgarden, J. Shoot/root balance of plants: Optimal growth of a system with many vegetative organs. Theor. Popul. Biol. 1984, 25, 78–105. [Google Scholar] [CrossRef]
  42. Huang, B.R.; Johnson, J.W.; Nesmith, S.; Bridges, D.C. Growth, physiological and anatomical responses of two wheat genotypes to waterlogging and nutrient supply. J. Exp. Bot. 1994, 45, 193–202. [Google Scholar] [CrossRef]
  43. Hua, W.; Li, R.J.; Zhan, G.M.; Liu, J.; Li, J.; Wang, X.F.; Liu, G.H.; Wang, H.Z. Maternal control of seed oil content in Brassica napus: The role of silique wall photosynthesis. Plant J. 2012, 69, 432–444. [Google Scholar] [CrossRef] [Green Version]
  44. Allen, E.J.; Morgan, D.G.; Ridgman, W.J. A physiological analysis of the growth of oilseed rape. J. Agric. Sci. 1971, 77, 339–341. [Google Scholar] [CrossRef]
  45. Tayo, T.O.; Morgan, D.G. Factors influencing flower and pod development in oil-seed rape (Brassica napus L.). J. Agr. Sci. 1979, 92, 363–373. [Google Scholar] [CrossRef]
  46. Papakosta, D.K. Phosphorus accumulation and translocation in wheat as affected by cultivar and nitrogen fertilization. J. Agron. Crop Sci. 1994, 173, 260–270. [Google Scholar] [CrossRef]
  47. Papakosta, D.K.; Gagianas, A.A. Nitrogen and dry matter accumulation, remobilization, and losses for Mediterranean wheat during grain filling. Agron. J. 1991, 83, 864–870. [Google Scholar] [CrossRef]
  48. Ehdaie, B.; Alloush, G.A.; Madore, M.A.; Waines, J.G. Genotypic variation for stem reserves and mobilization in wheat: I. postanthesis changes in internode dry matter. Crop Sci. 2006, 46, 735–746. [Google Scholar] [CrossRef]
  49. Ehdaie, B.; Alloush, G.A.; Madore, M.A.; Waines, J.G. Genotypic variation for stem reserves and mobilization in wheat: II. Postanthesis changes in internode water-soluble carbohydrates. Crop Sci. 2006, 46, 2093–2103. [Google Scholar] [CrossRef]
  50. Patterson, D.T.; Bunce, J.A.; Volkenburgh, A.E.V. Photosynthesis in relation to leaf characteristics of cotton from controlled and field Environments. Plant Physiol. 1977, 59, 384–387. [Google Scholar] [CrossRef] [PubMed] [Green Version]
  51. Yamada, S.; Osaki, M.; Tadano, T. Effect of potassium nutrition on translocation of photosynthesized 14C and carbon-nitrogen metabolism in leaves of various crop plants. In Plant Nutrition for Sustainable Food Production and Environment; Springer: Dordrecht, The Netherlands, 1997. [Google Scholar]
  52. Santiago, J.P.; Tegeder, M. Implications of nitrogen phloem loading for carbon metabolism and transport during Arabidopsis development. J. Integr. Plant Biol. 2017, 6, 63–75. [Google Scholar]
  53. Zhang, X.Q.; Li, K.C.; Xing, R.E.; Liu, S.; Li, P.C. Metabolite profiling of wheat seedlings induced by chitosan: Revelation of the enhanced carbon and nitrogen metabolism. Front Plant Sci. 2017, 8, 2017. [Google Scholar] [CrossRef] [Green Version]
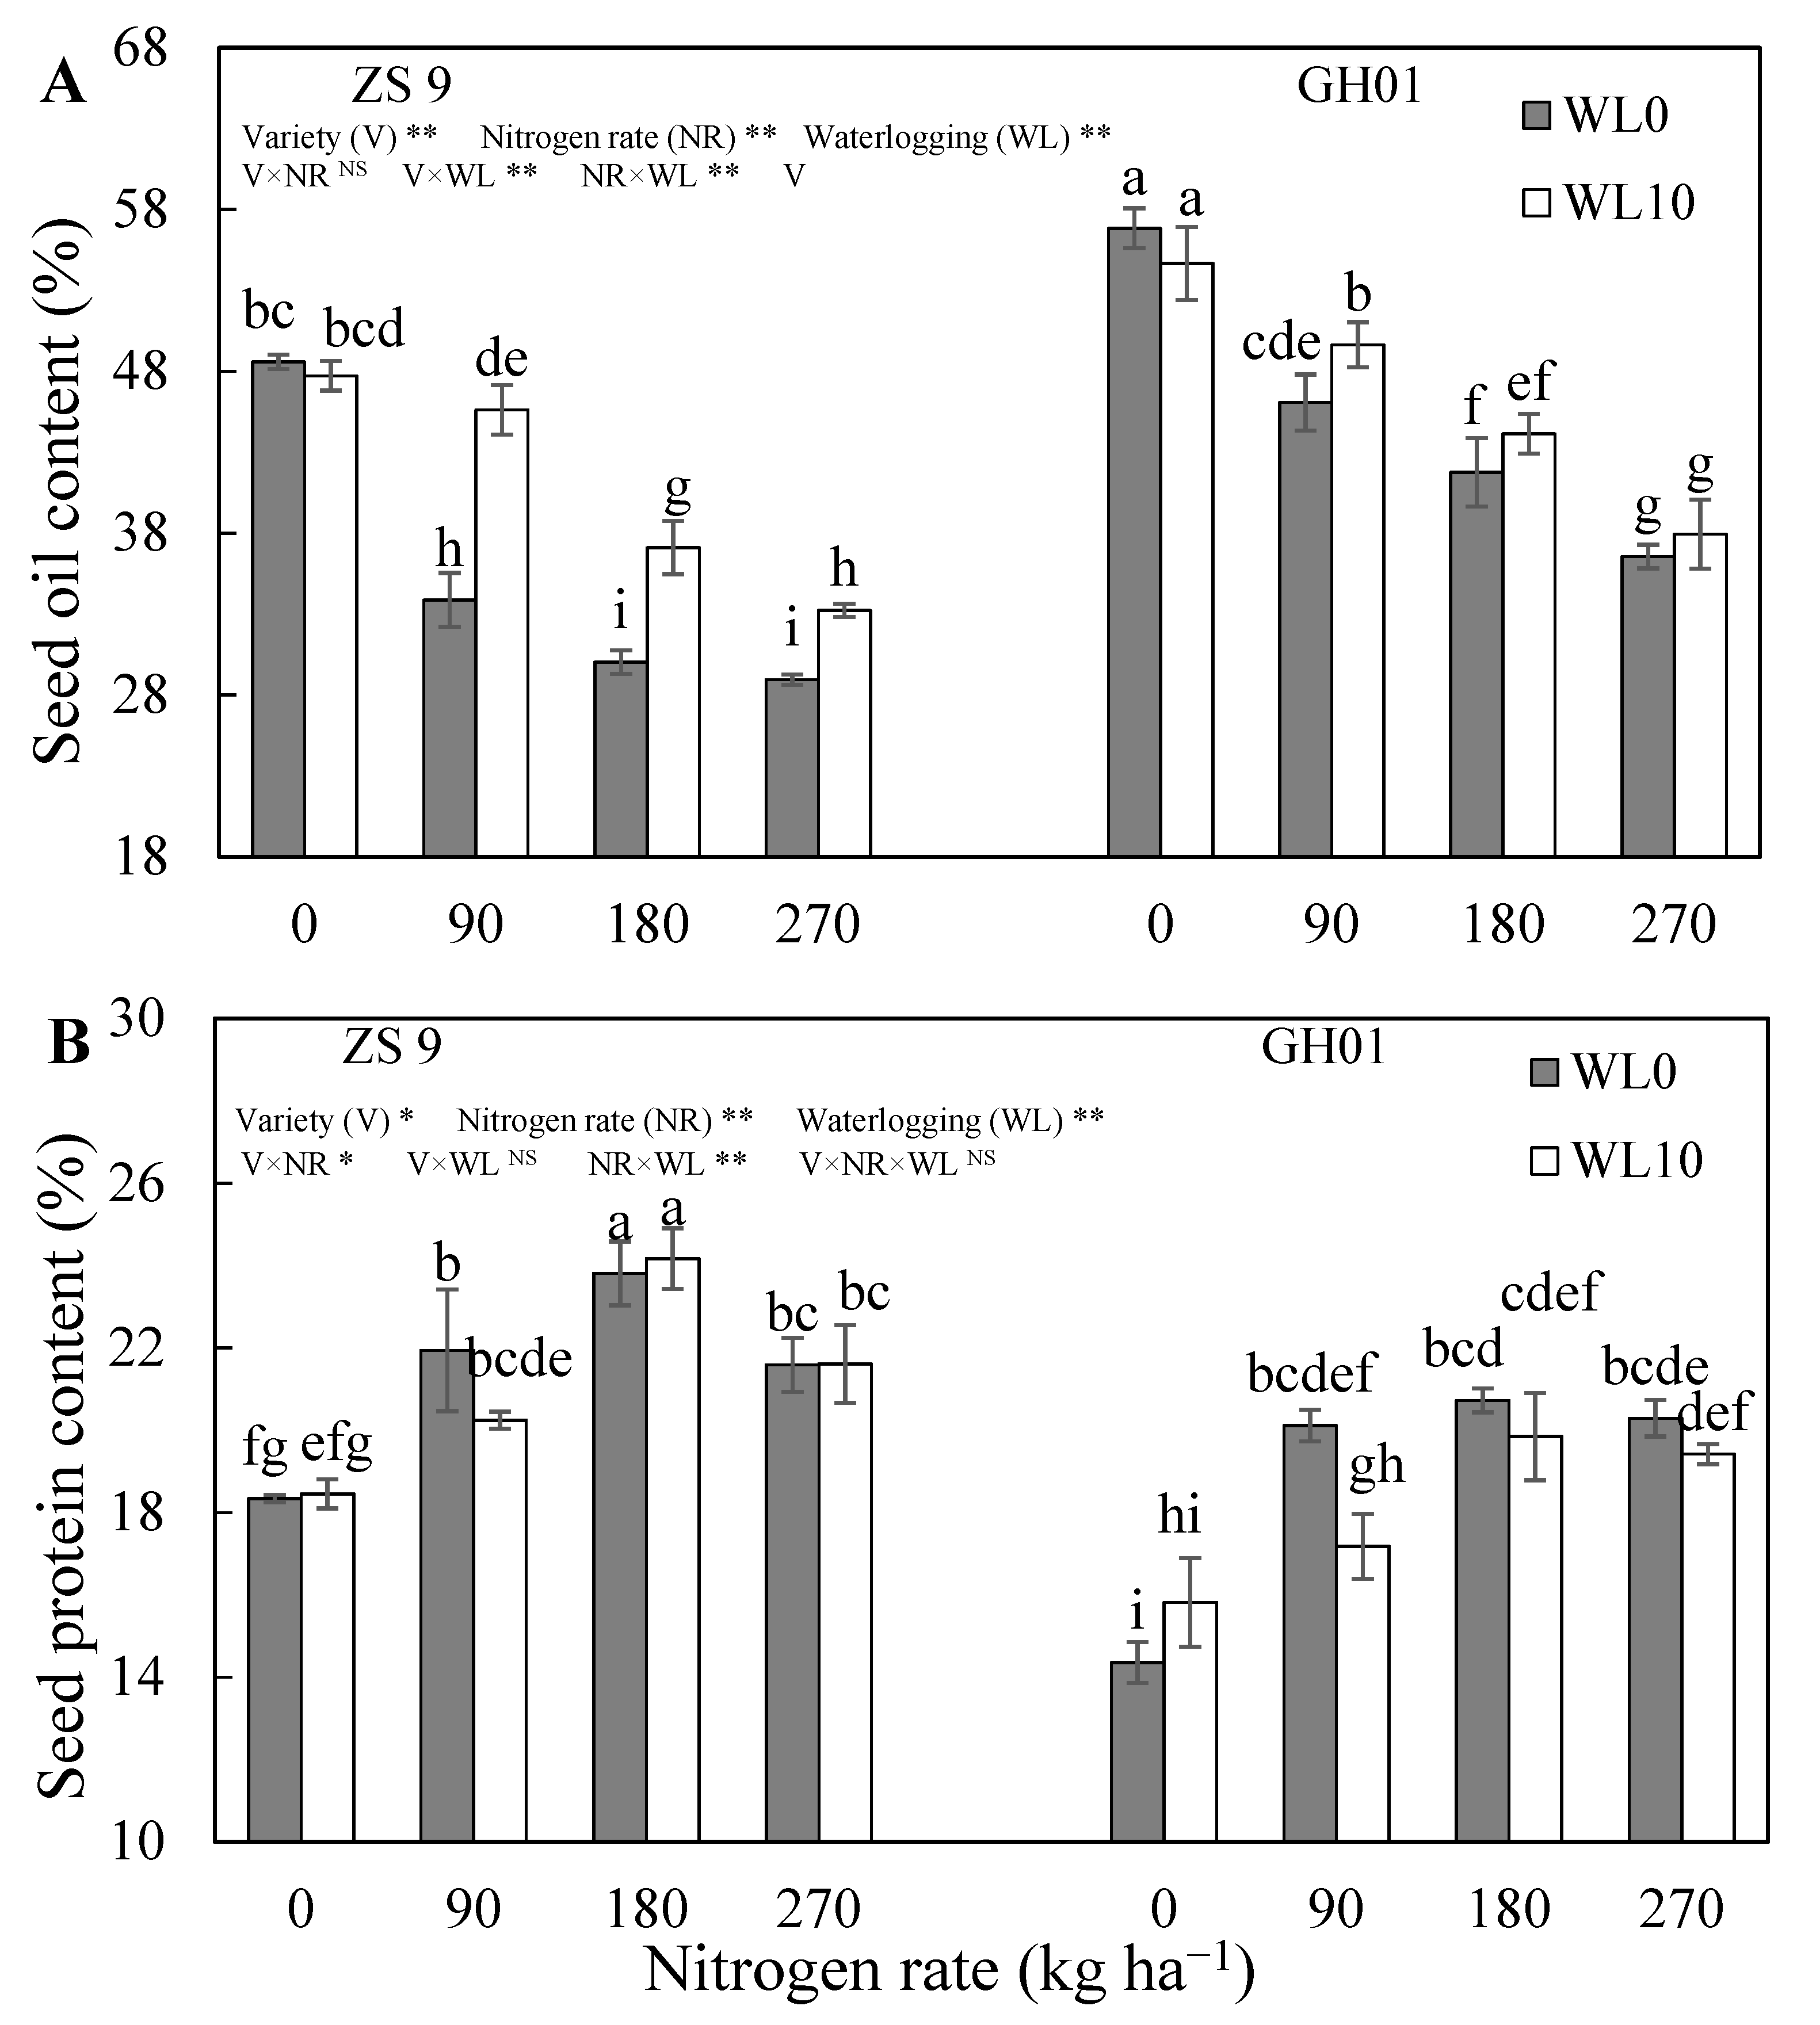
Figure 1. Effect of nitrogen rates on seed oil and protein content of waterlogged rapeseed ((A), seed oil content; (B), Seed protein content). WL0, plants without waterlogging; WL10, plants waterlogged for 10 days at the seedling stage. Values followed by different letters are significantly different at the 0.05 probability level according to LSD test. * Significant at the 0.05 probability level. ** Significant at the 0.01 probability level. NS, not significant according to ANOVA.
Agriculture 10 00207 g001
Figure 2. Effects of nitrogen rates on dry matter partition per plant of waterlogged rapeseed (A, ZS 9; B, GH 01). WL0, plants without waterlogging; WL10, plants waterlogged for 10 days at the seedling stage.
Agriculture 10 00207 g002
Figure 3. Correlation between seed oil content, protein content with leaf biomass distribution rate. * and ** significance at the 0.05 and 0.01 levels, respectively.
Agriculture 10 00207 g003
Figure 4. Effects of nitrogen rates on leaf number (A), leaf area (B), and SPAD (C) of waterlogged rapeseed. WL0, plants without waterlogging; WL10, plants waterlogged for 10 days at the seedling stage. * Significant at the 0.05 probability level, ** Significant at the 0.01 probability level. NS, not significant according to ANOVA.
Agriculture 10 00207 g004
Figure 5. Effects of nitrogen rates on leaf soluble sugar content of waterlogged rapeseed. WL0, plants without waterlogging; WL10, plants waterlogged for 10 days at the seedling stage. ** Significant at the 0.01 probability level. NS, not significant according to ANOVA.
Agriculture 10 00207 g005
Figure 6. Effects of nitrogen rates on leaf soluble protein content of waterlogged rapeseed. WL0, plants without waterlogging; WL10, plants waterlogged for 10 days at the seedling stage. * Significant at the 0.05 probability level. ** Significant at the 0.01 probability level. NS, not significant according to ANOVA.
Agriculture 10 00207 g006
Figure 7. Correlation analysis of leaf traits with seed oil and protein content at different growth stages. n = 8, R0.05 = 0.707, R0.01 = 0.834; * and ** significance at the 0.05 and 0.01 levels, respectively.
Agriculture 10 00207 g007
Table 1. Effects of nitrogen rates on biomass accumulation per plant of waterlogged rapeseed (g).
Nitrogen Rate (kg ha−1)Days of WaterloggingZS 9GH01
SeedlingBoltingFloweringMaturitySeedlingBoltingFloweringMaturity
0WL09.93d13.35f14.43f15.05g5.12f7.54f9.93f15.64g
WL105.82f8.05g10.93g14.30g2.40h4.18g6.78g13.77h
90WL013.47c31.95d40.72e51.74f8.59e23.50d34.10e40.33f
WL108.04e22.28e50.74d71.63d4.30g15.84e35.43e47.12e
180WL019.80b45.52c60.45c65.21e16.13b45.67b55.24d60.24d
WL1013.57c31.89d80.48a89.95b10.60d30.28c72.40b83.85b
270WL026.66a55.18a66.09b73.68c20.23a54.87a63.63c70.08c
WL1018.92b46.85b79.15a94.72a11.90c45.71b80.43a92.74a
Analyses of variance
Variety (V) ********
Nitrogen rate (NR)********
Waterlogging (WL)********
V × NR ********
V × WL *NS****
NR × WL ********
V × NR × WL NS******
Values followed by different letters within the same column are significantly different at the 0.05 probability level according to LSD test; WL0, plants without waterlogging; WL10, plants waterlogged for 10 days at the seedling stage. * Significant at the 0.05 probability level. ** Significant at the 0.01 probability level. NS, not significant according to ANOVA.