Land Equivalent Ratio in the Intercropping of Cucumber with Lettuce as a Function of Cucumber Population Density


 , ,
, ,
Abstract
1. Introduction
2. Materials and Methods
2.1. Experimental Area
2.2. Treatments and Experimental Design
2.3. Installation of the Experiment
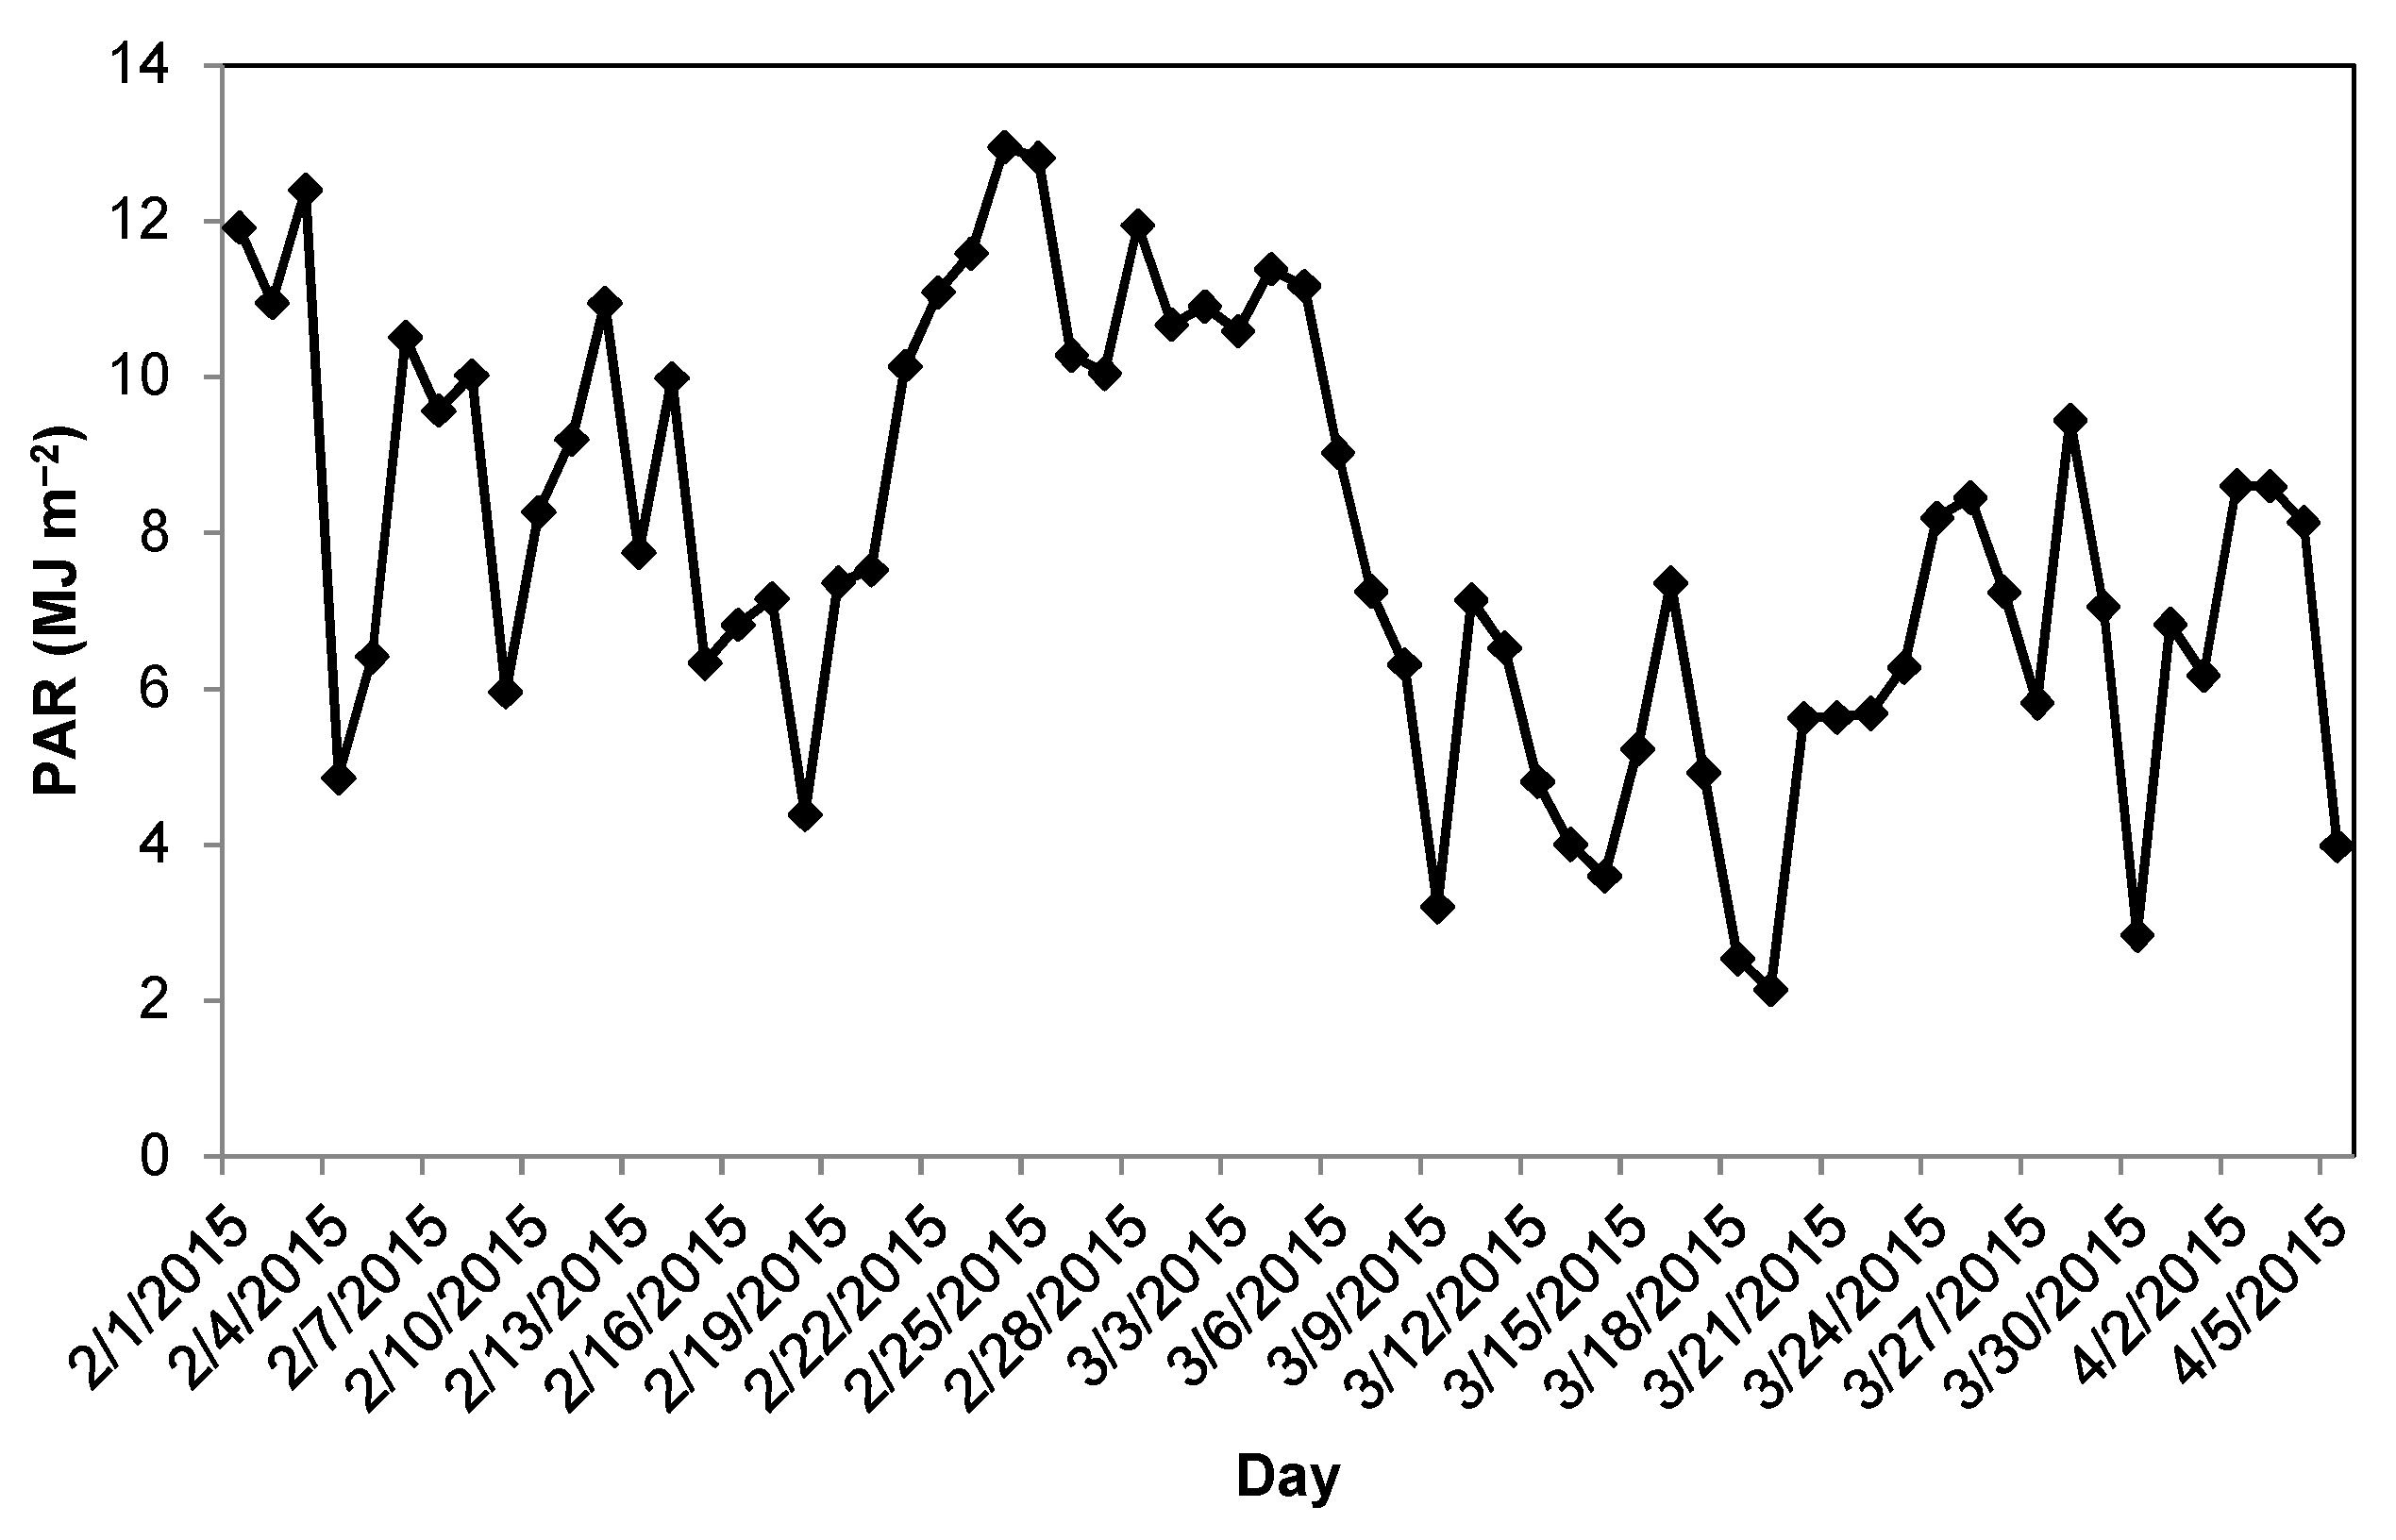
2.4. Characteristics Evaluated Percent of Photosynthetic Assimilation Ratio (PAR)
2.4.1. Percent PAR
2.4.2. Lettuce Fresh Mass
2.4.3. Lettuce and Cucumber Yield
2.4.4. Number of Commercial Cucumbers
2.4.5. Land Equivalent Ratio (LER)
2.4.6. Relative Yield (RY)
2.5. Statistical Analyses
3. Results
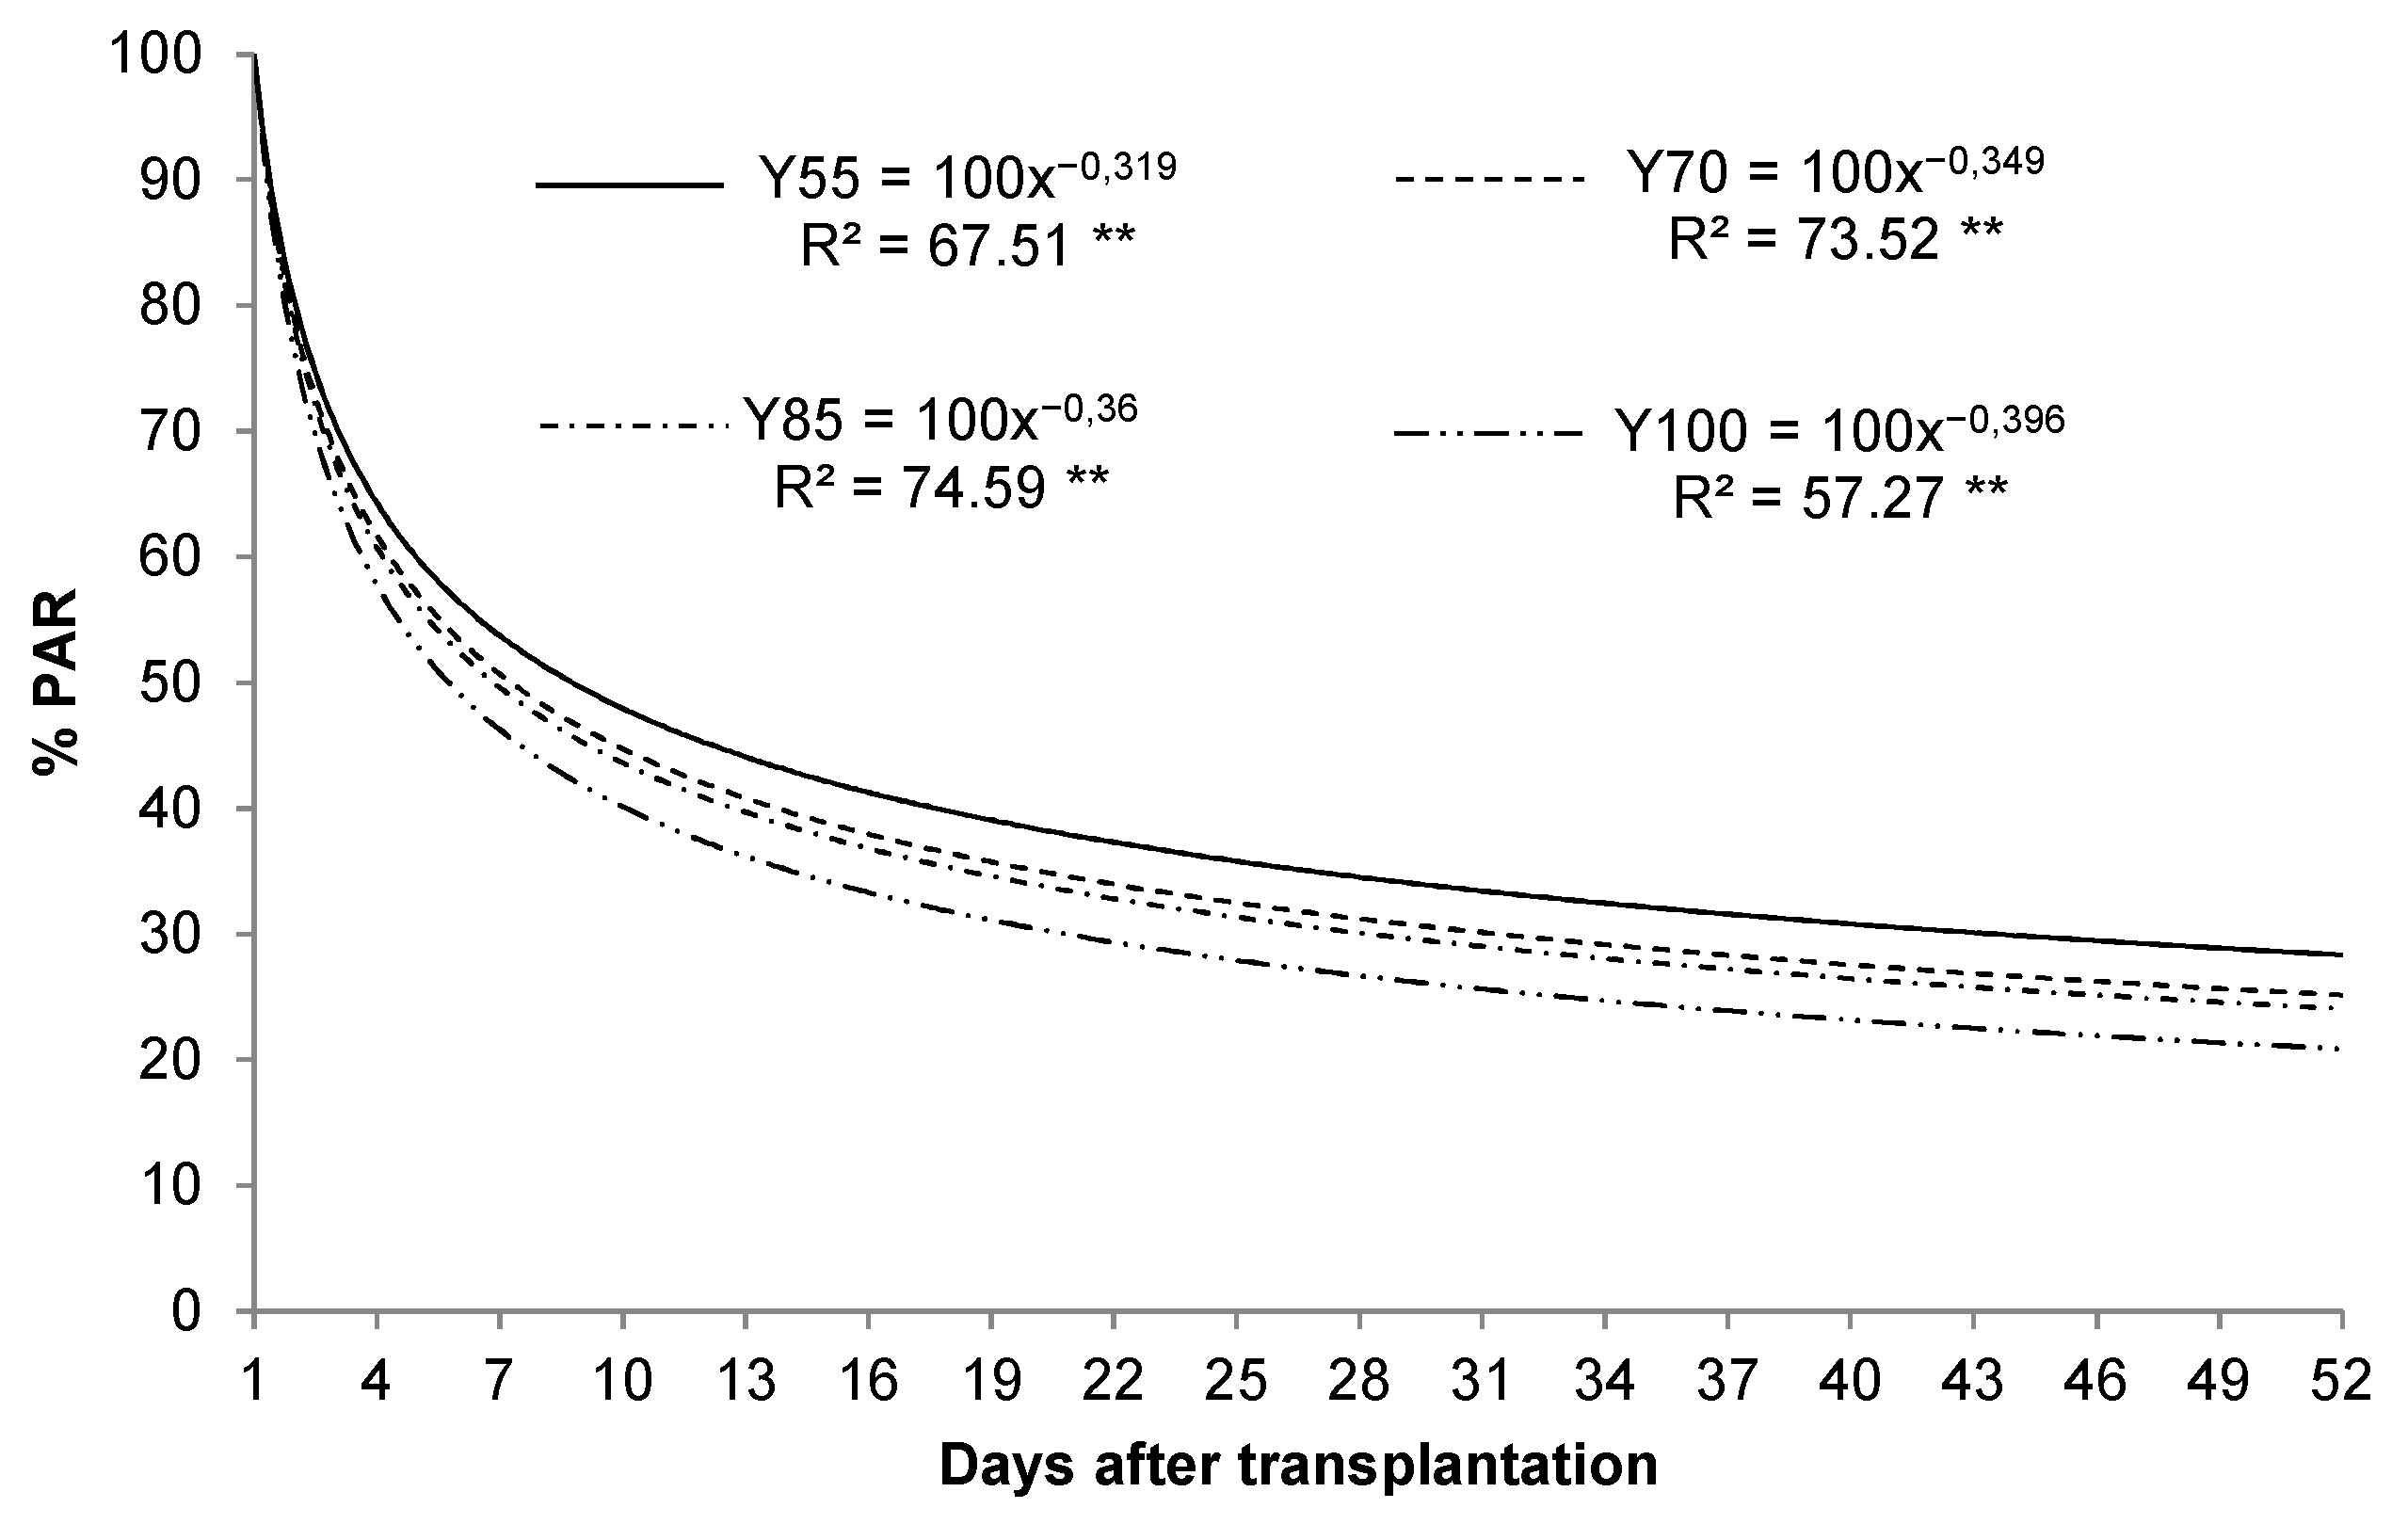
3.1. PAR
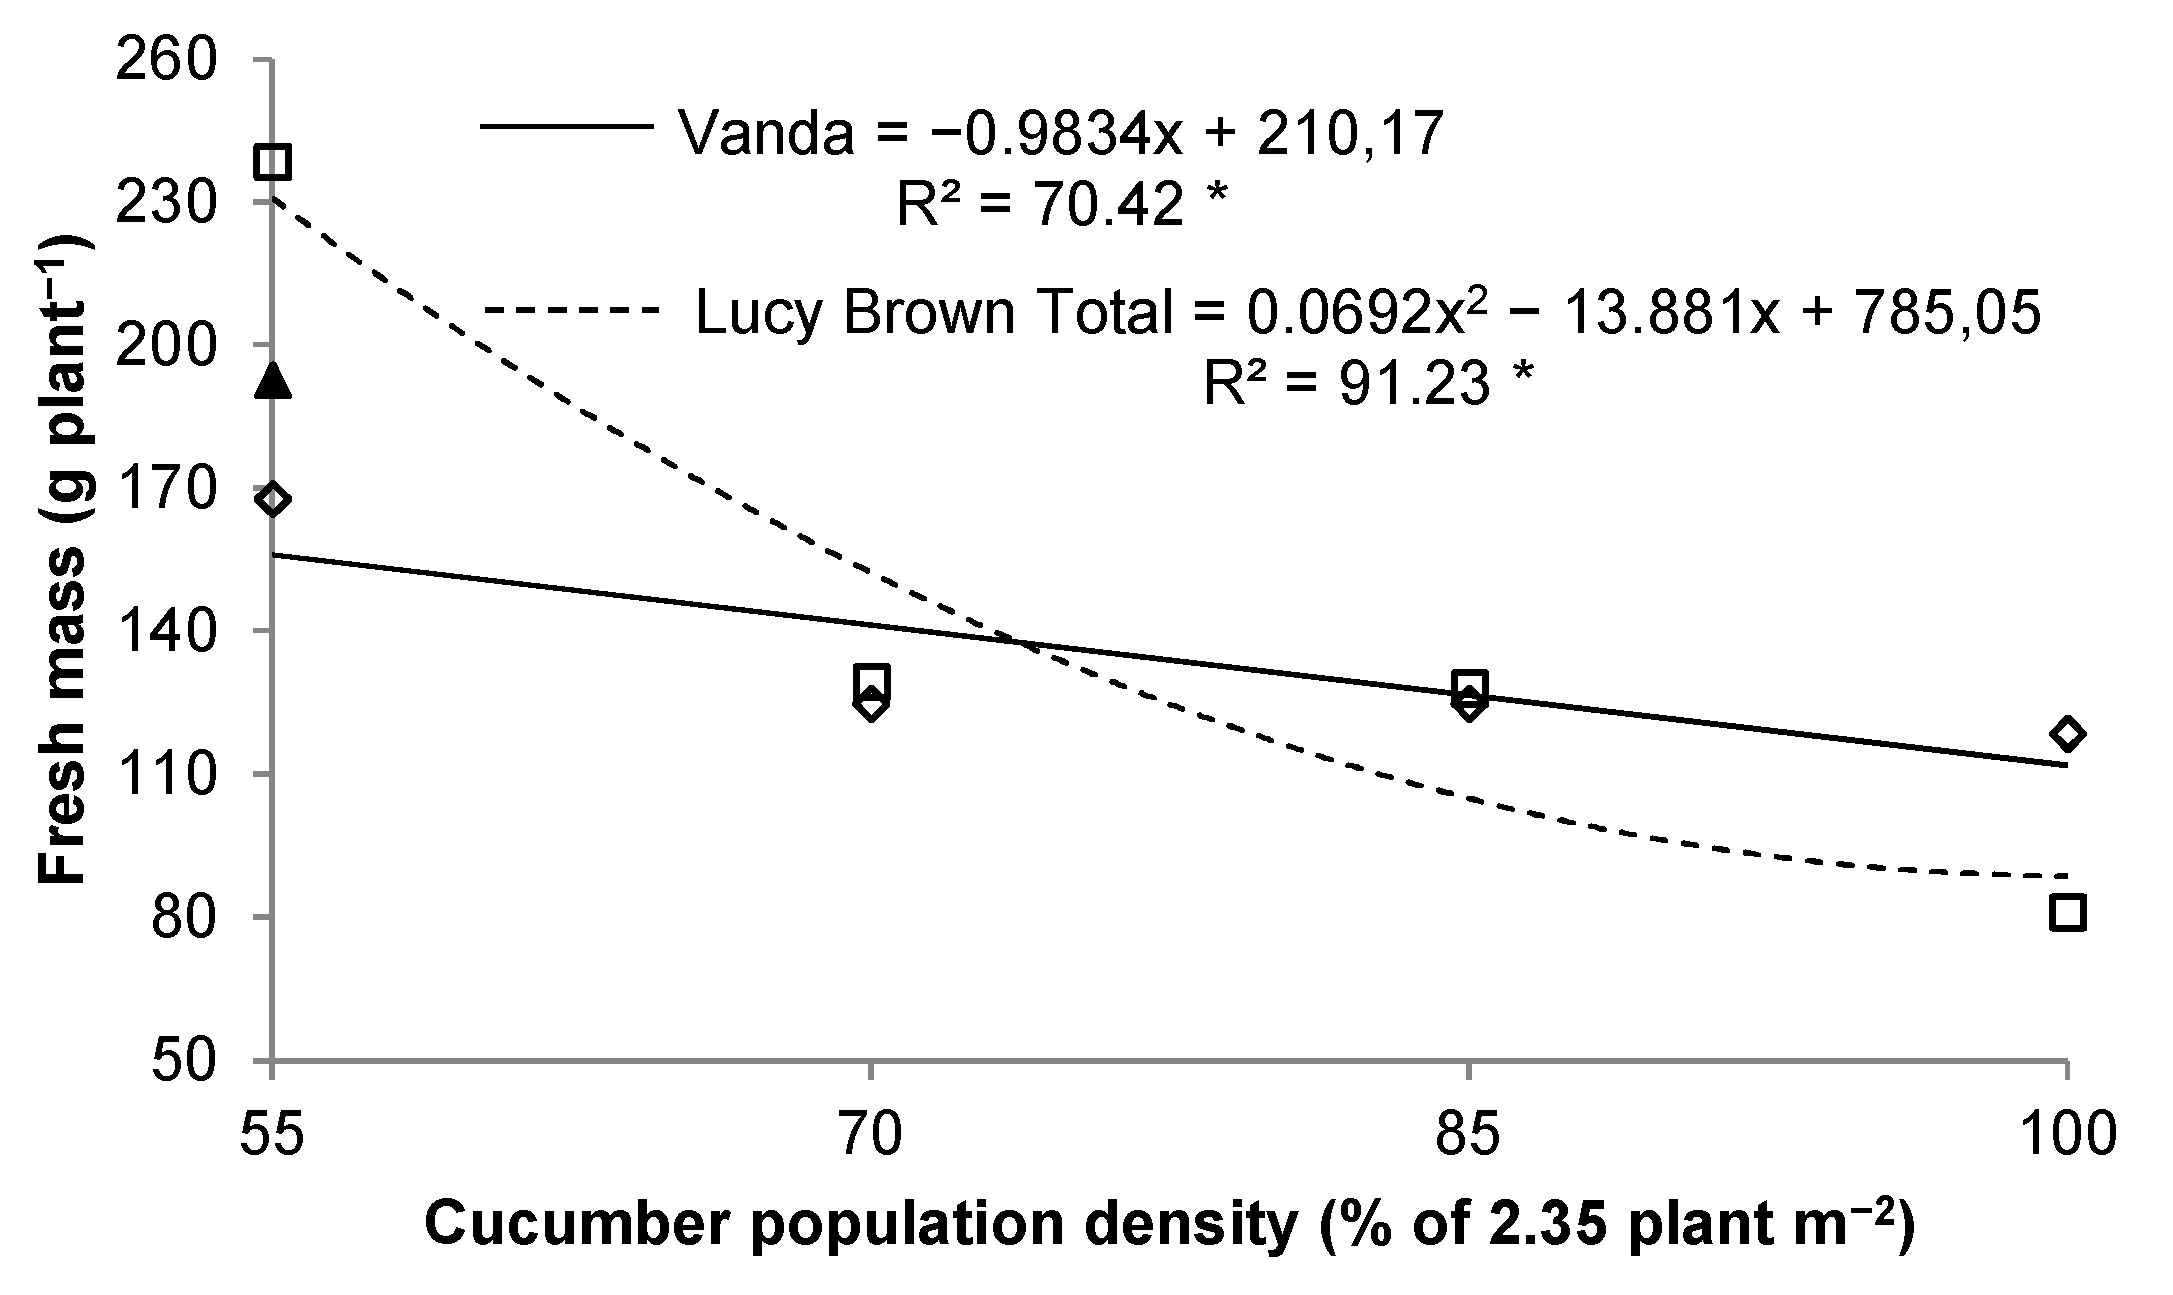
3.2. Lettuce
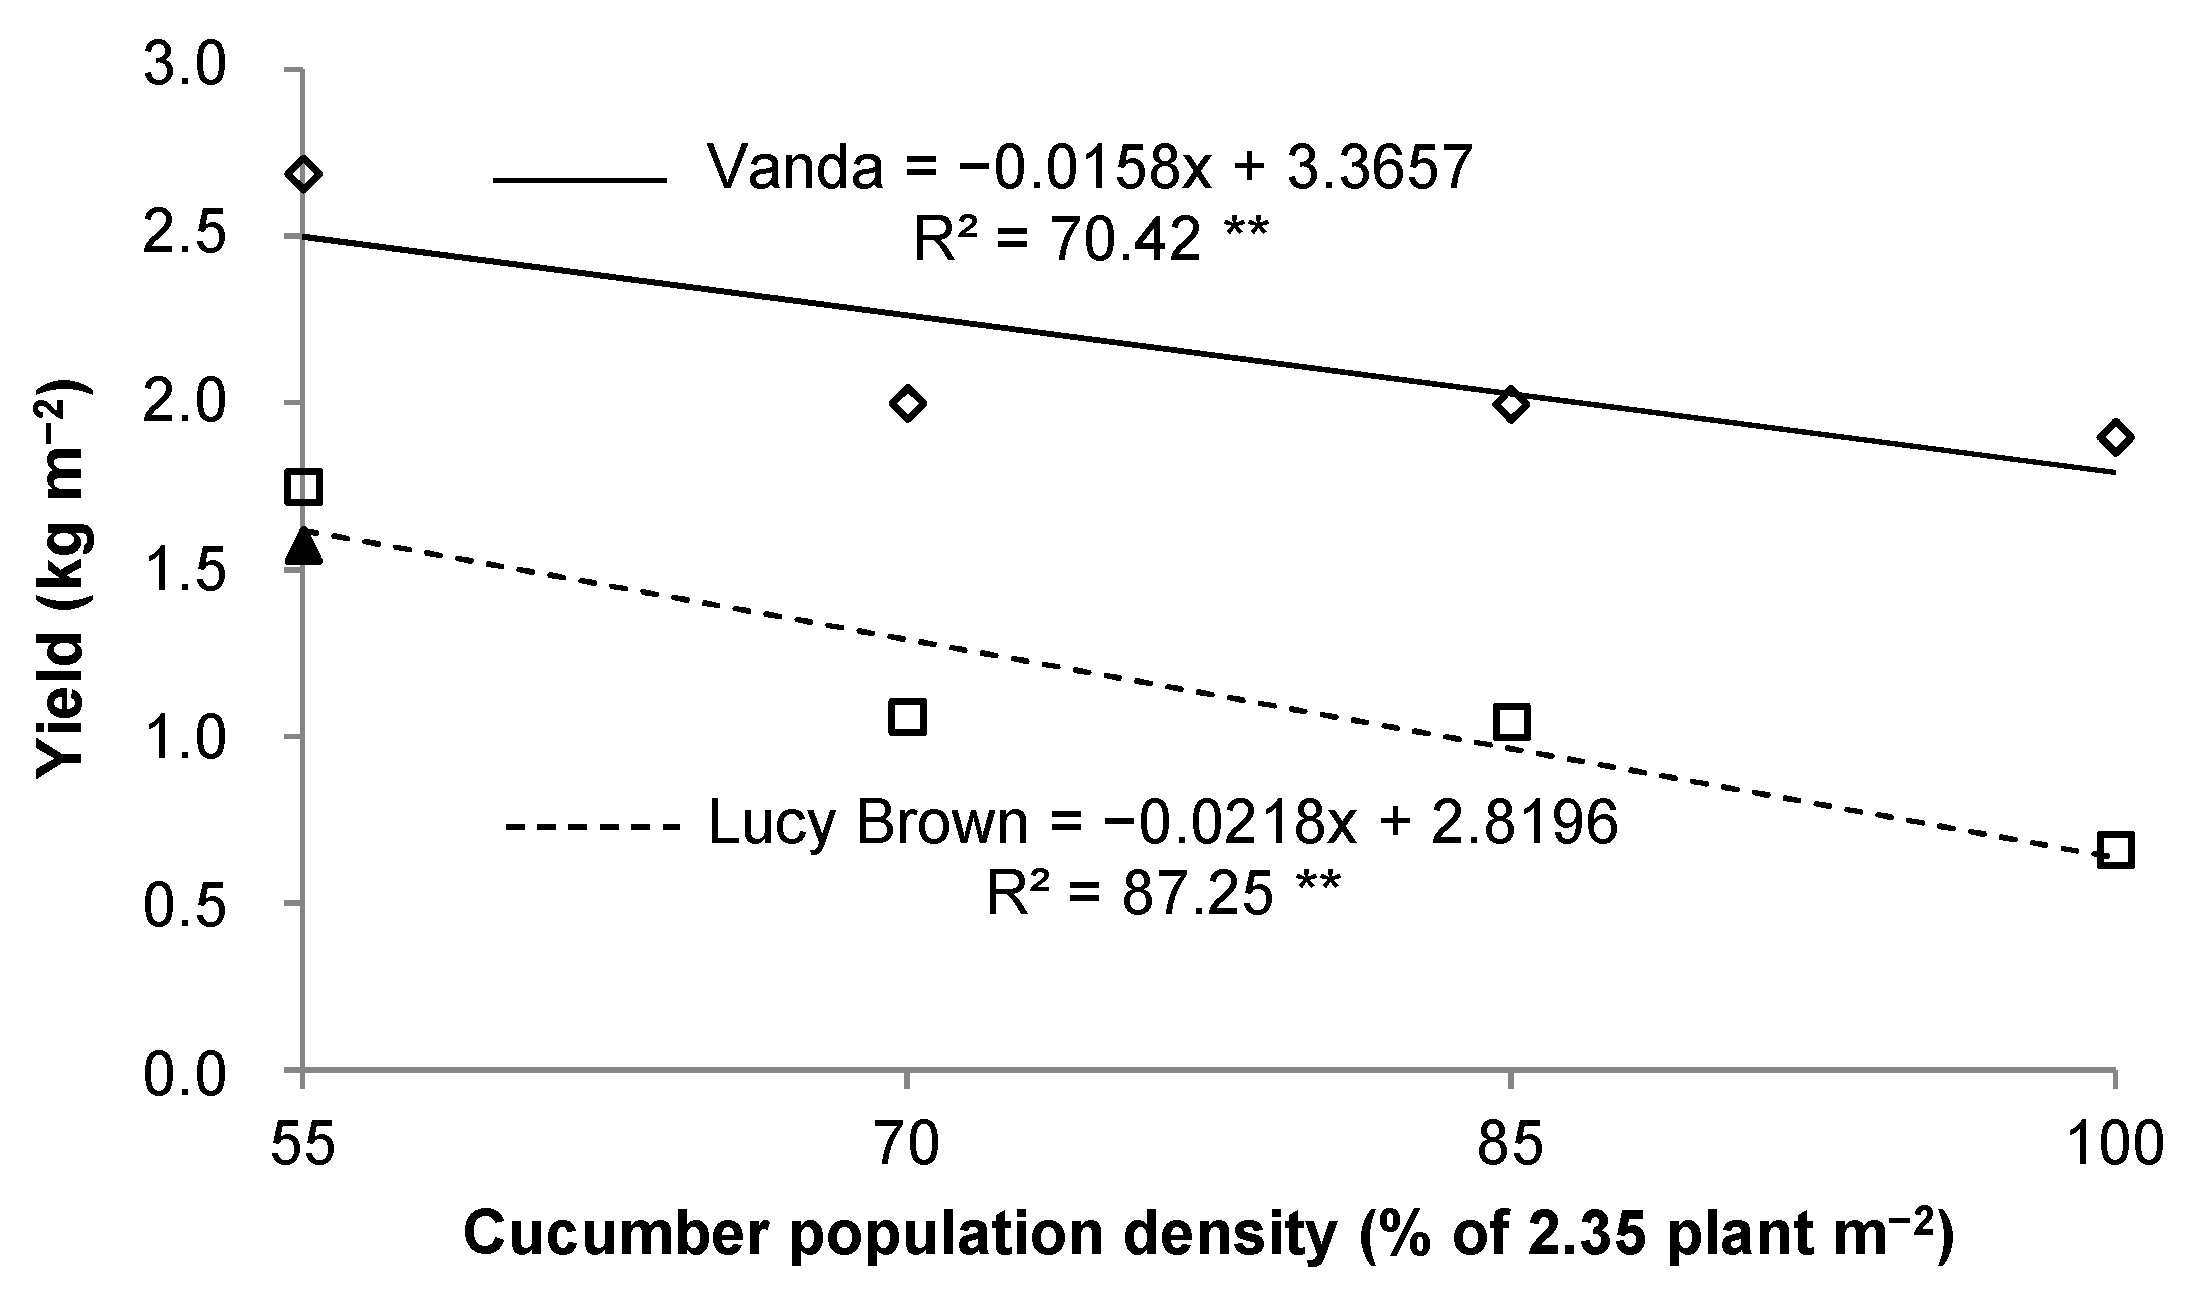
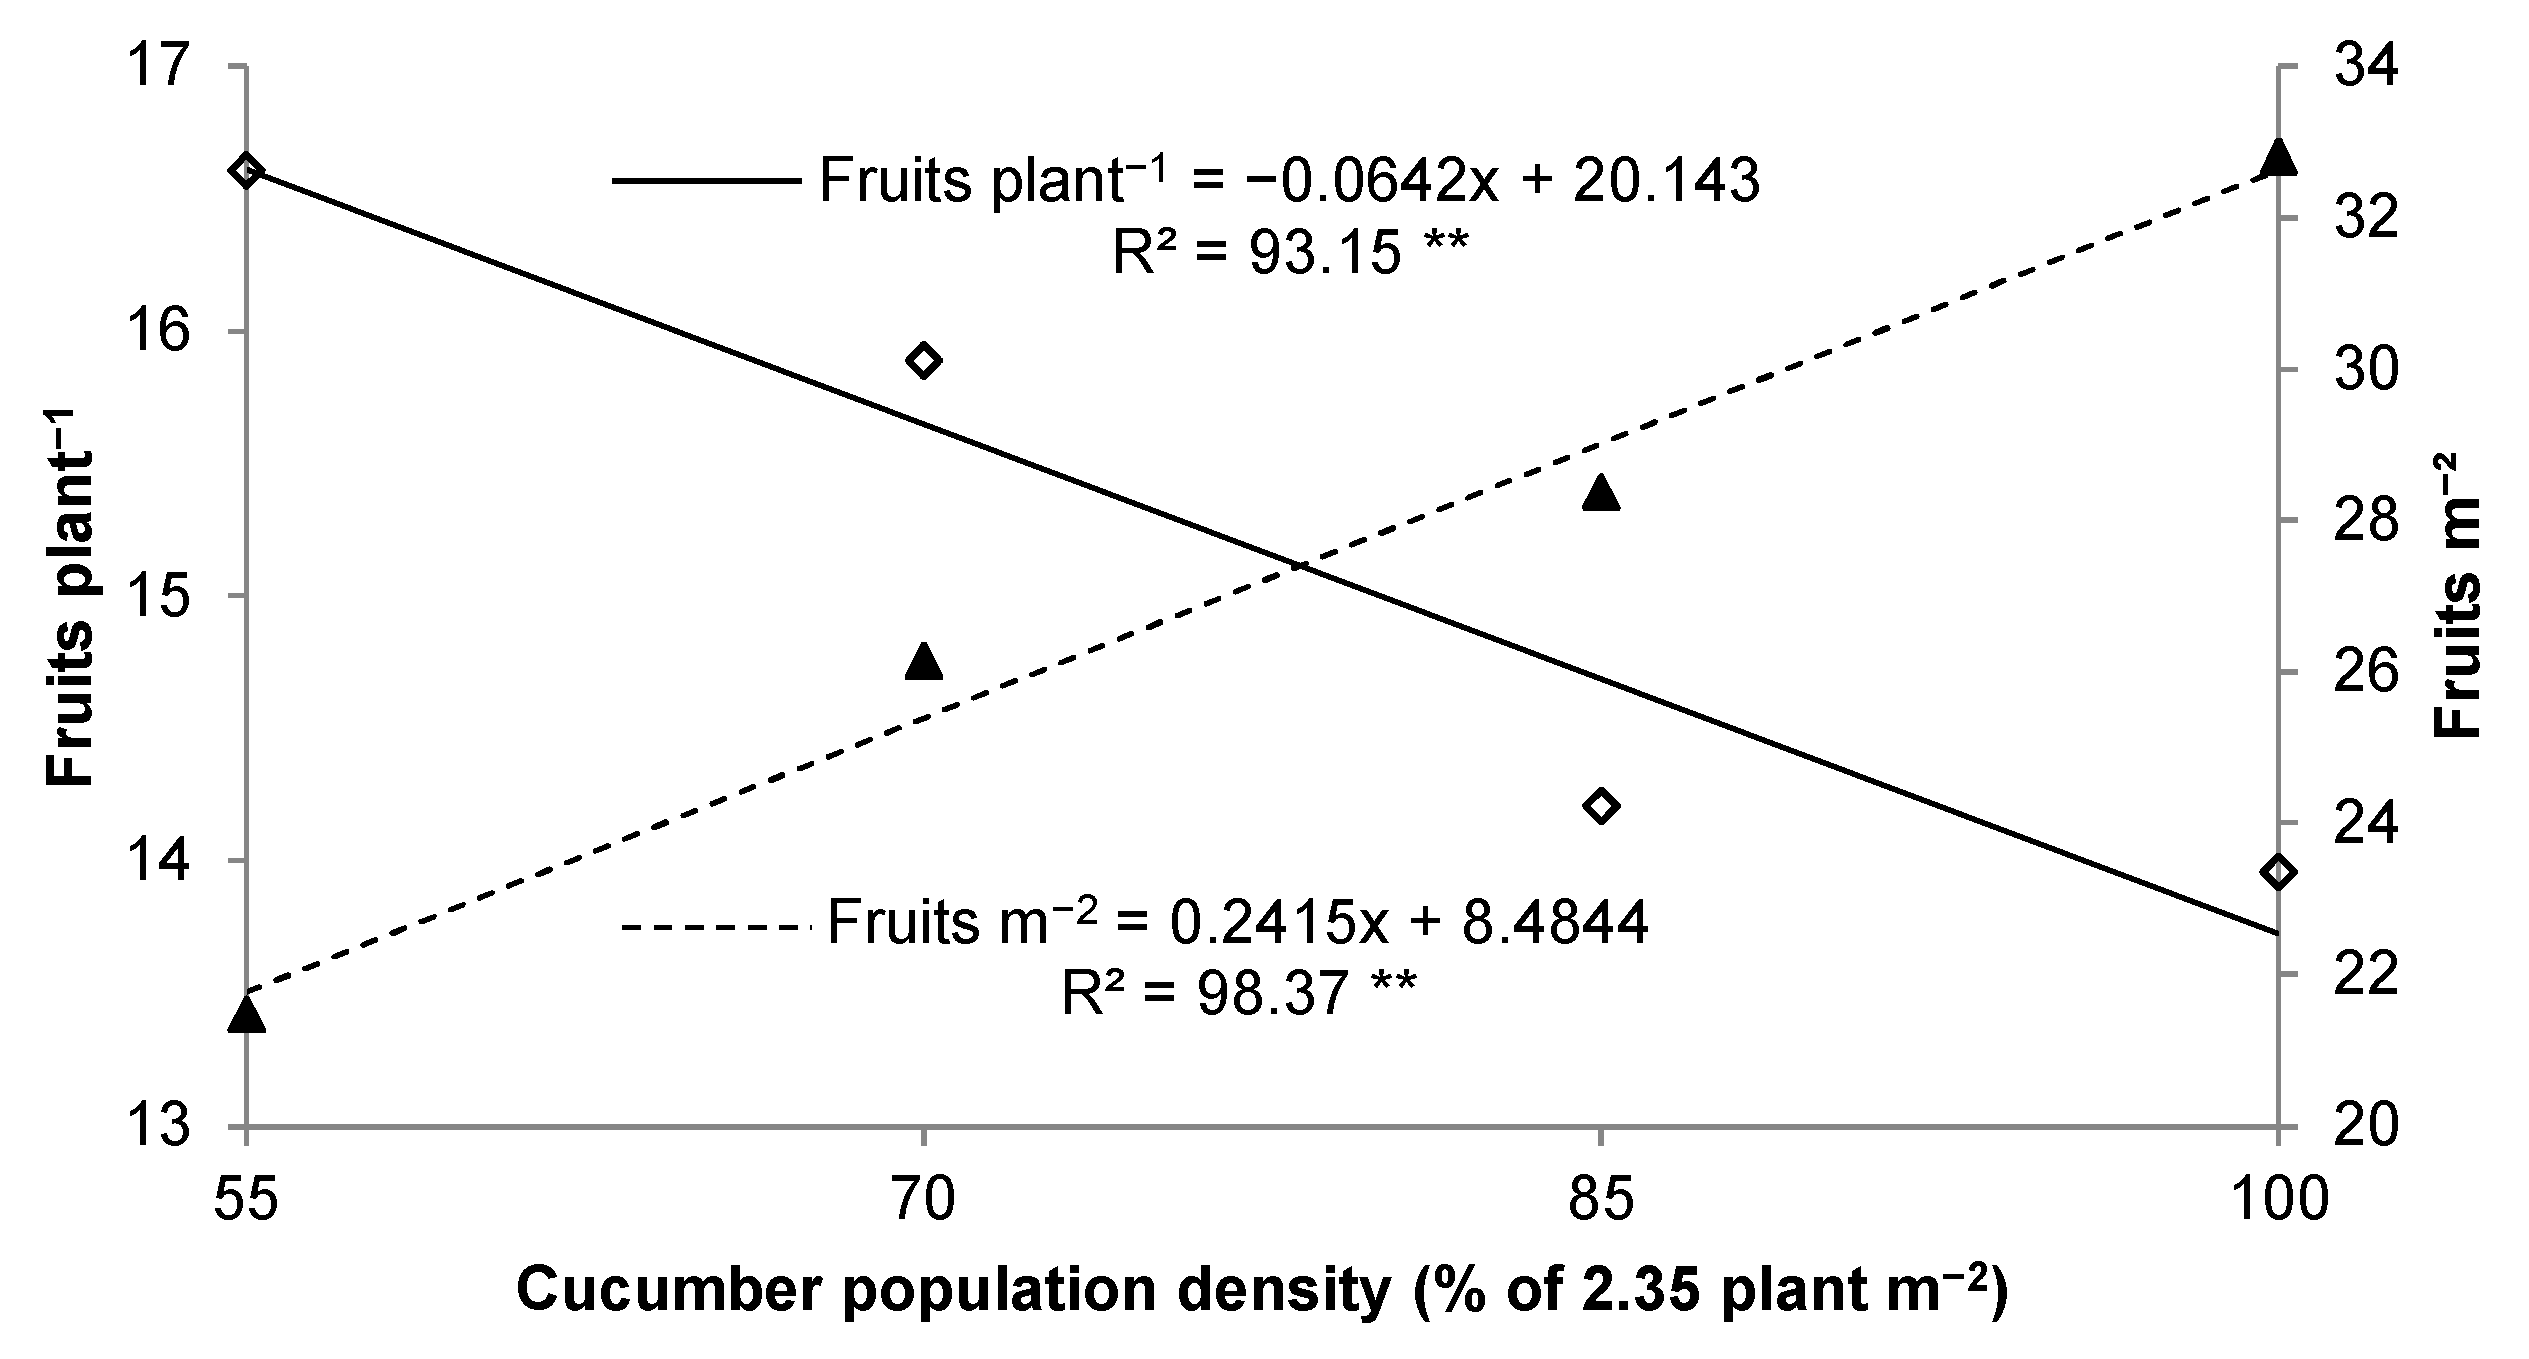
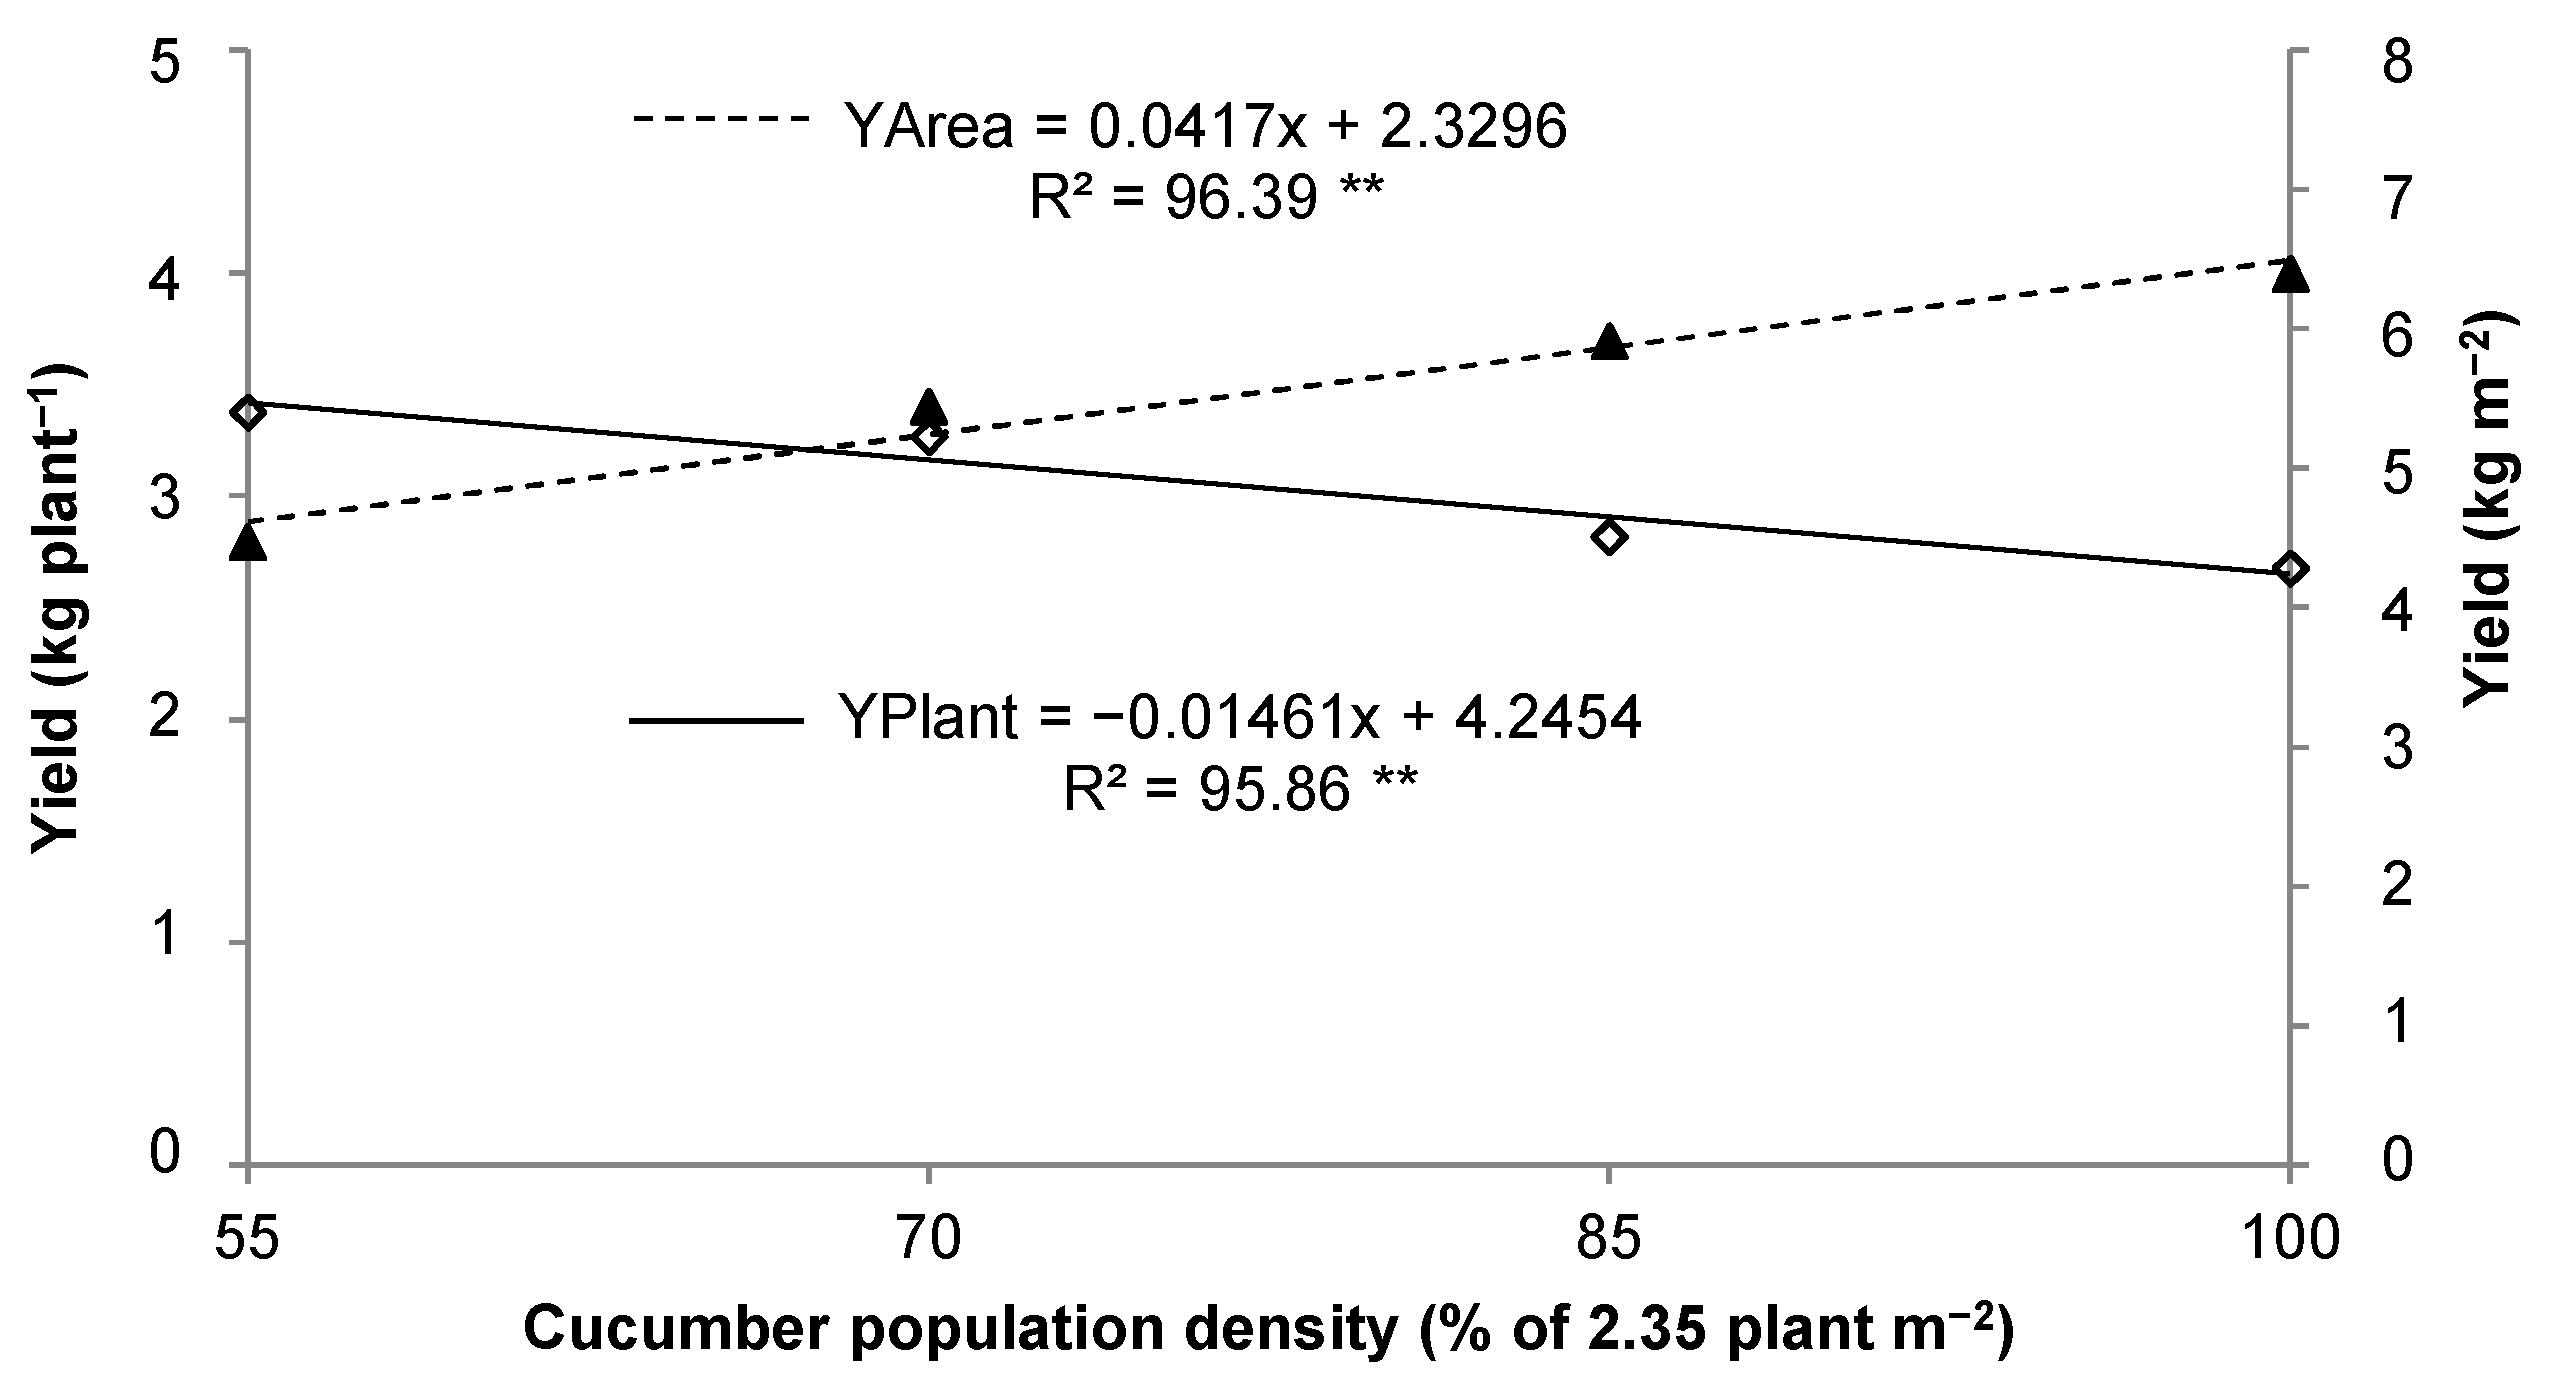
3.3. Cucumber
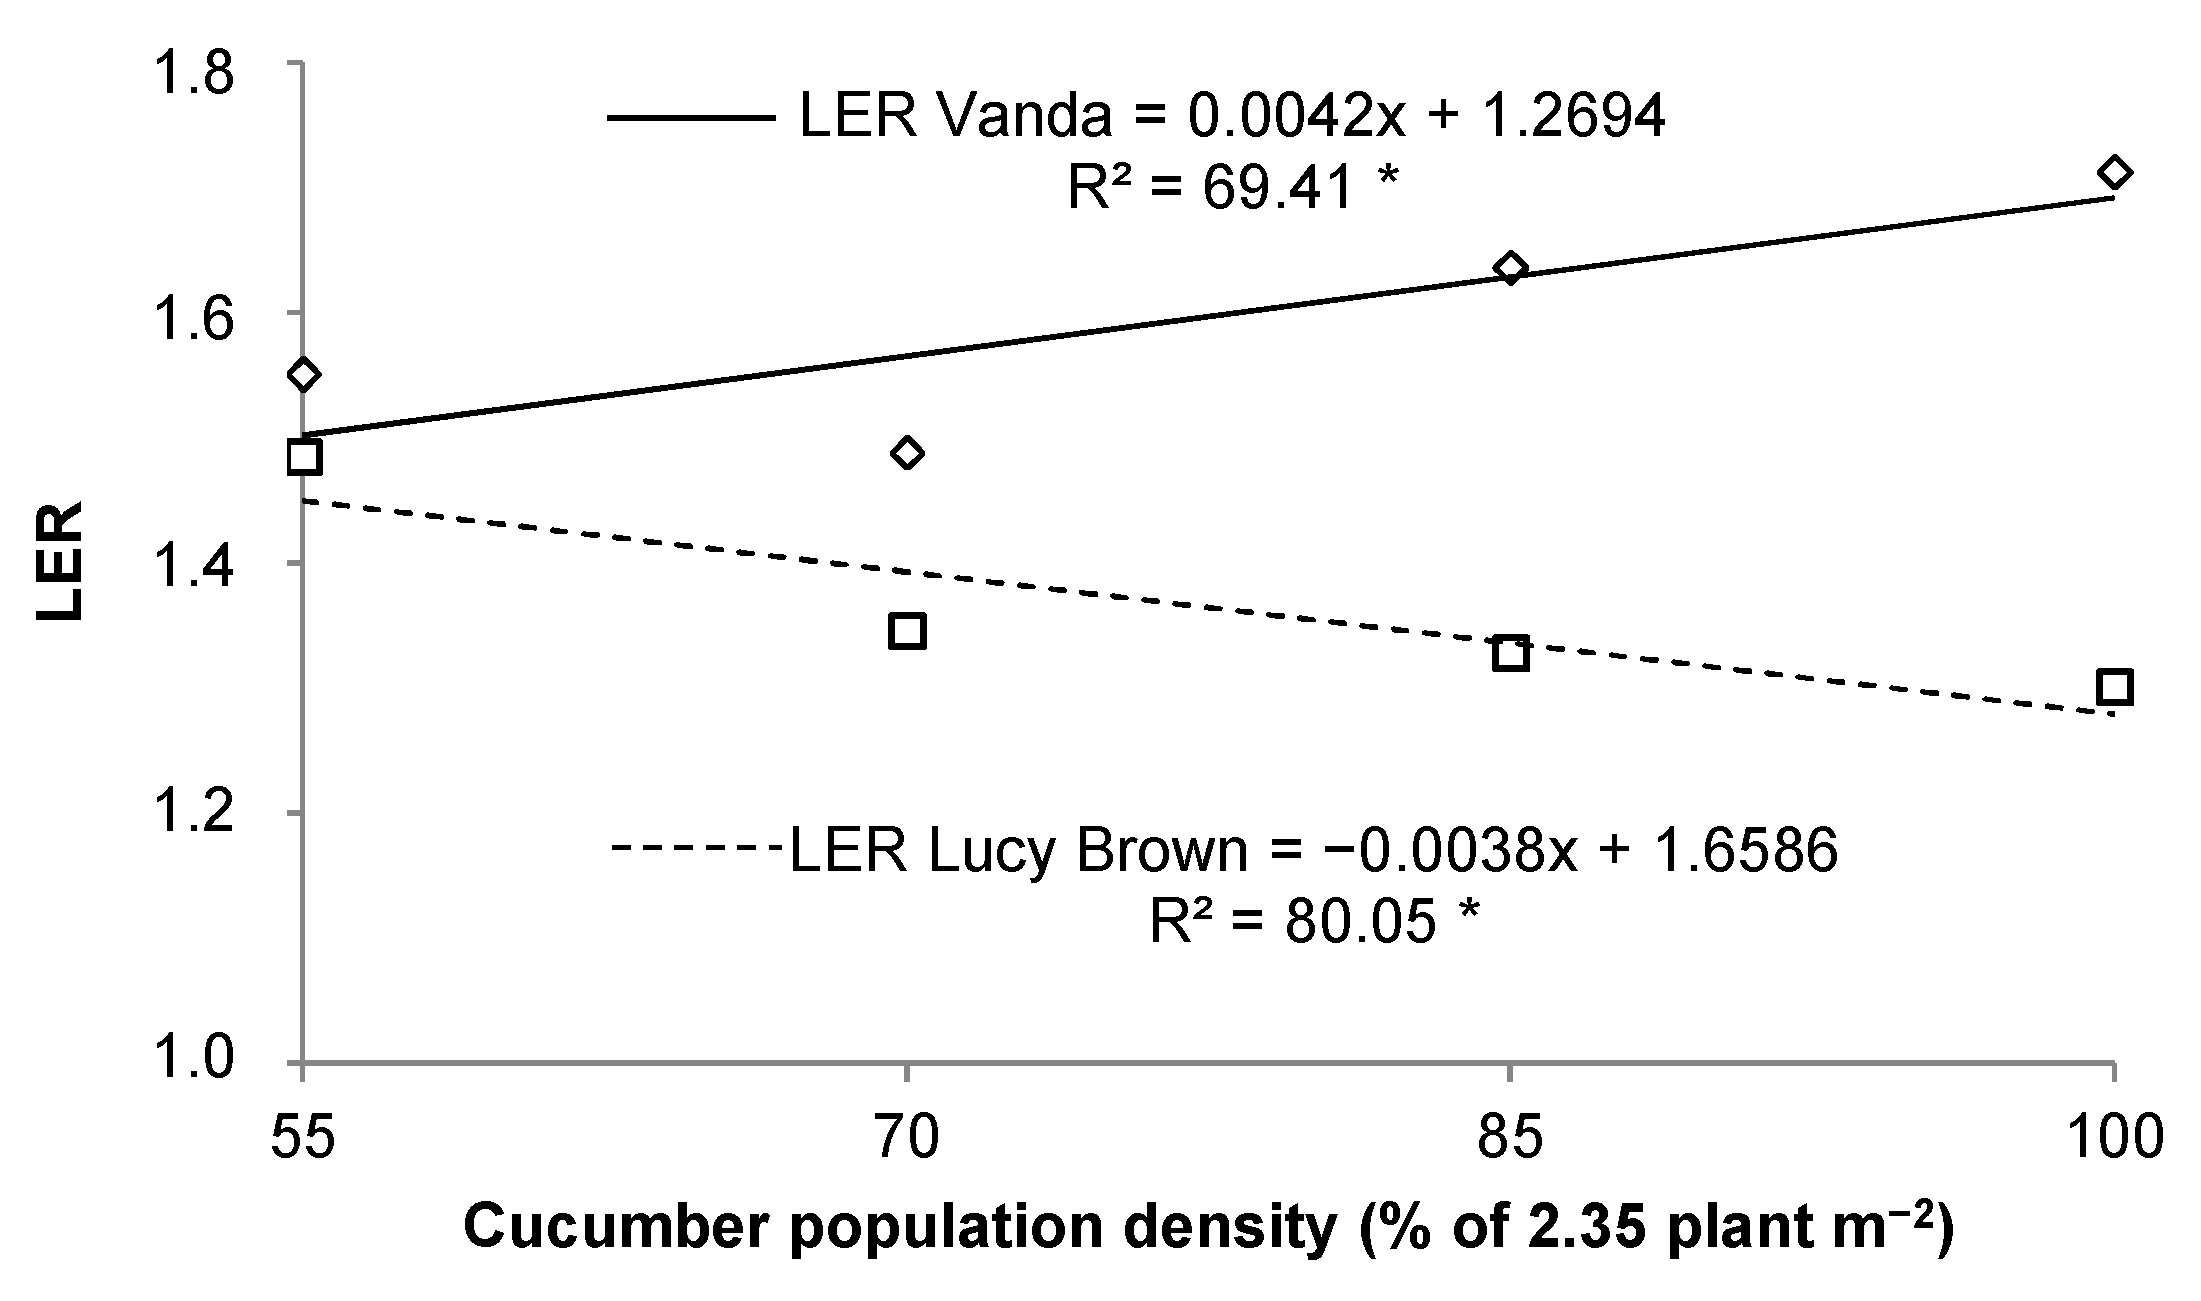
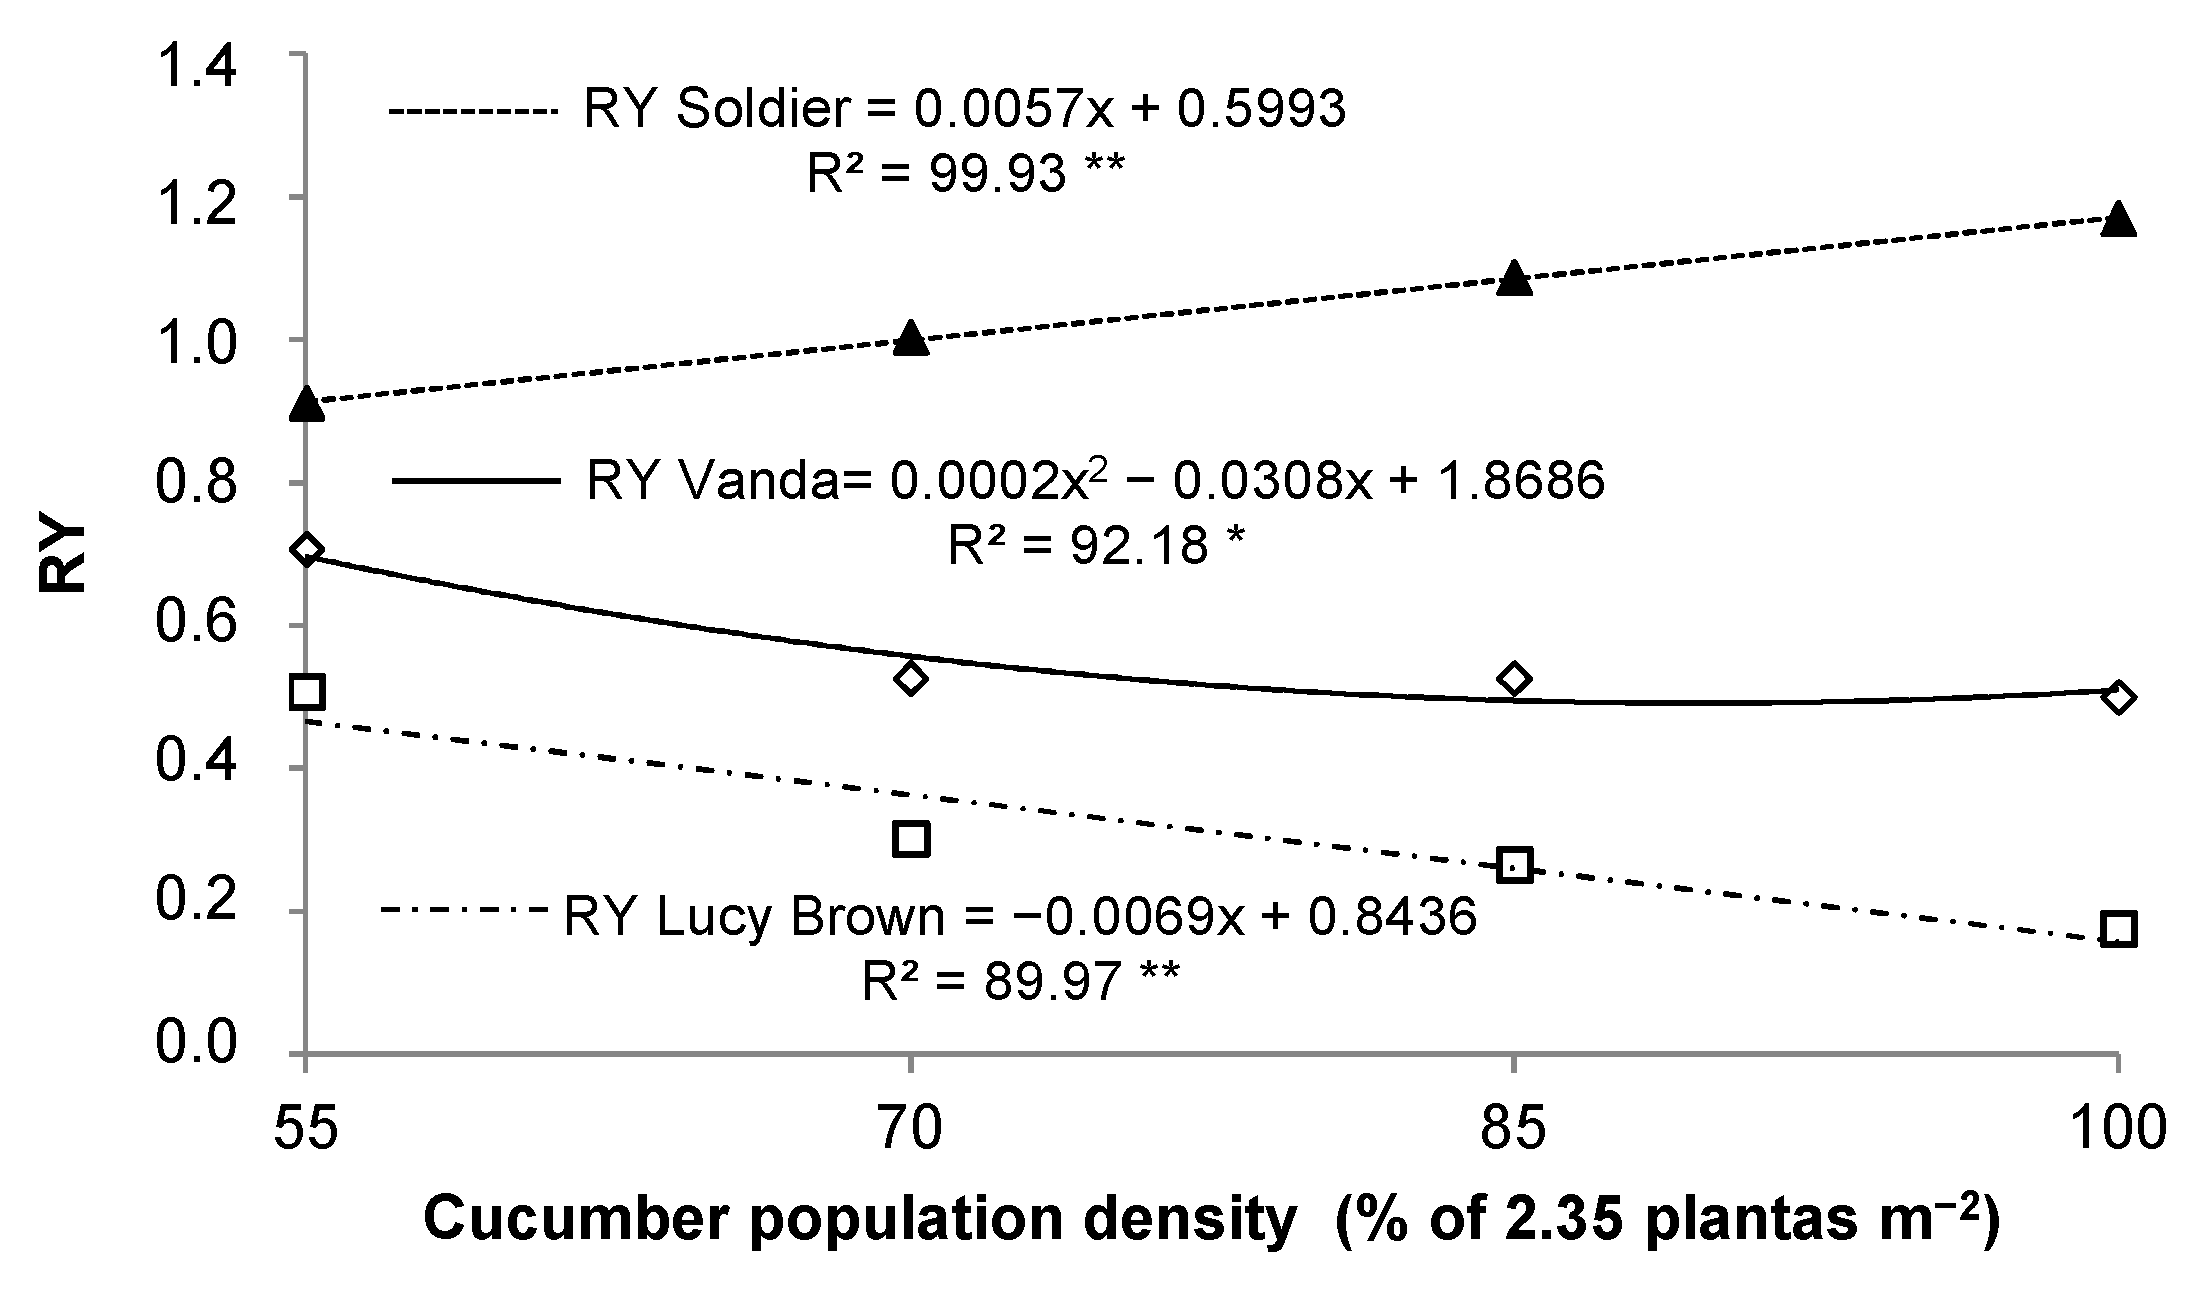
3.4. LER and RY
4. Discussion
5. Conclusions
Author Contributions
Funding
Acknowledgments
Conflicts of Interest
References
- Cecílio Filho, A.B.; Rezende, B.L.A.; Dutra, A.F. Yield of intercropped lettuce and cucumber as a function of population density and cropping season. Rev. Caatinga 2019, 32, 943–951. [Google Scholar] [CrossRef]
- Wang, M.; Wu, C.; Cheng, Z.; Meng, H.; Zhang, M.; Zhang, H. Soil chemical property changes in eggplant/garlic relay intercropping systems under continuous cropping. PLoS ONE 2014, 9, e111040. [Google Scholar] [CrossRef] [PubMed]
- Cecílio Filho, A.B.; Bezerra Neto, F.; Rezende, B.L.A.; Barros Júnior, A.P.; Lima, J.S.S. Indices of bio-agroeconomic efficiency in intercropping systems of cucumber and lettuce in greenhouse. Aust. J. Crop. Sci. 2015, 9, 1154–1164. [Google Scholar]
- Cecílio Filho, A.B.; Rezende, B.L.A.; Barbosa, J.C.; Grangeiro, L.C. Agronomic efficiency of intercropping tomato and lettuce. An. Acad. Bras. Cienc. 2011, 83, 1109–1119. [Google Scholar] [CrossRef] [PubMed]
- Bezerra Neto, F.; Porto, V.C.N.; Gomes, E.G.; Cecílio Filho, A.B.; Moreira, J.N. Assessment of agroeconomic indices in polycultures of lettuce, rocket and carrot through uni- and multivariate approaches in semi-arid Brazil. Ecol. Indic. 2012, 14, 11–17. [Google Scholar] [CrossRef]
- Berry, A.D.; Stall, W.M.; Rathinasabapathi, B.; Gregory, E.; Charudattan, R. Smooth pigweed (Amaranthus hybridus L.) and livid amaranth (Amaranthus lividus) interference with cucumber (Cucumis sativus). Weed Technol. 2006, 20, 227–231. [Google Scholar] [CrossRef]
- Fu, W.; Li, P.; Wu, Y. Effects of different light intensities on chlorophyll fluorescence characteristics and yield in lettuce. Sci. Hortic. 2012, 135, 45–51. [Google Scholar] [CrossRef]
- Cecílio Filho, A.B.; Bianco, M.S.; Tardivo, C.F.; Pugina, G.C.M. Agronomic viability of New Zealand spinach and kale intercropping. An. Acad. Bras. Cienc. 2017, 89, 2975–2986. [Google Scholar] [CrossRef]
- Rezende, B.L.A.; Cecílio Filho, A.B.; Pôrto, D.R.Q.; Barros Junior, A.P.; Silva, G.S.; Barbosa, J.C.; Feltrim, A.L. Consórcios de alface crespa e pepino em função da população do pepino e época de cultivo. Interciencia 2010, 35, 374–379. [Google Scholar]
- Rezende, B.L.A.; Cecílio Filho, A.B.; Barros Junior, A.P.; Pôrto, D.R.Q.; Martins, M.I.E.G. Economic analysis of cucumber and lettuce intercropping under greenhouse in the winter-spring. An. Acad. Bras. Cienc. 2011, 83, 705–717. [Google Scholar] [CrossRef][Green Version]
- Heuvelink, E. Effect of plant density on biomass allocation to the fruits in tomato (Lycopersicon esculentum Mill.). Sci. Hortic. 1995, 64, 193–201. [Google Scholar] [CrossRef]
- Mattera, J.; Romero, L.A.; Cuatrín, A.L.; Cornaglia, P.S.; Grimoldi, A.A. Yield components, light interception and radiation use efficiency of lucerne (Medicago sativa L.) in response to row spacing. Eur. J. Agron. 2013, 45, 87–95. [Google Scholar] [CrossRef]
- Trani, P.E.; Passos, F.A.; Melo, A.M.T.; Azevedo Filho, J.A. Alface, almeirão, chicória, escarole, rúcula e agrião d’água. In Recomendações de Adubação e Calagem Para o Estado de São Paulo; Raij, B., Cantarella, H., Quaggio, J.A., Furlani, A.M.C., Eds.; IAC: Campinas, Brazil, 1997; pp. 168–169. [Google Scholar]
- Trani, P.E.; Passos, F.A.; Melo, A.M.T.; Scivittaro, W.B.; Nagai, H. Abobrinha ou abóbora de moita; abóbora rasteira, moranga e híbridos; bucha e pepino. In Recomendações de Adubação e Calagem Para o Estado de São Paulo; Raij, B., Cantarella, H., Quaggio, J.A., Furlani, A.M.C., Eds.; IAC: Campinas, Brazil, 1997; p. 165. [Google Scholar]
- HortiBrasil. Instituto Brasileiro de Qualidade em Horticultura. Pepino: Classe e Defeitos Variáveis. 2014. Available online: https://www.hortibrasil.org.br/classificacao/pepino/pepino.html (accessed on 17 November 2014).
- Willey, W.; Osiru, D.S.O. Studies on mixtures of maize and beans (Phaseolus vulgaris) with particular reference to plant population. J. Agric. Sci. 1972, 79, 517–529. [Google Scholar] [CrossRef]
- De Wit, C.T.; Van Den Bergh, J.P. Competition between herbage plants. J. Agric. Sci. 1965, 13, 212–221. [Google Scholar]
- Federer, W.T. Statistical issues in intercropping. In Encyclopedia of Environmetrics, 1st ed.; El-Shaarawi, A.H., Piegorsch, W.W., Piegorsch, W.W., Eds.; Wiley: New York, NY, USA, 2002; pp. 1064–1069. [Google Scholar]
- Barbosa, J.C.; Maldonado Júnior, W. Experimentação agronômica & AgroEstat: Sistemas Para Análises Estatísticas de Ensaios Agronômicos. Multipress: Jaboticabal, Brasil, 2015. [Google Scholar]
- Negrini, A.C.A.; Melo, P.C.T.; Ambrosano, E.J.; Sakai, R.H.; Schammass, E.A.; Rossi, F. Performance of lettuce in sole cropping and intercropping with green manures. Hortic. Bras. 2010, 28, 58–63. [Google Scholar] [CrossRef][Green Version]
- Yaseen, M.; Singh, M.; Singh, U.B.; Singh, S.; Ram, M. Optimum planting time, method, plant density, size of planting material, and photo synthetically active radiation for safed musli (Chlorophytum borivilianum). Ind. Crops Prod. 2013, 43, 61–64. [Google Scholar] [CrossRef]
- Caron, B.O.; Manfron, P.A.; Lúcio, A.D.; Schmit, D.; Edieros, S.L.P. Equações de estimativa da fitomassa da parte aérea da alface. Cienc. Rural 2007, 37, 1248–1254. [Google Scholar] [CrossRef]
- Fu, W.; Li, P.; Wu, Y.; Tang, J. Effects of different light intensities on anti-oxidative enzyme activity, quality and biomass in lettuce. Hortic. Sci. 2012, 39, 129–134. [Google Scholar]
- Stagnari, F.; Galieni, A.; Pisante, M. Shading and nitrogen management affect quality, safety and yield of greenhouse-grown leaf lettuce. Sci. Hortic. 2015, 192, 70–79. [Google Scholar] [CrossRef]
- Willey, R.W. Intercropping—Its importance and research needs. Part 1—Competition and yield advantage. Field Crops Abstr. 1979, 32, 1–10. [Google Scholar]
- Barillot, R.; Louarn, G.; Escobar-Gutirrez, A.J.; Huynh, P.; Combes, D. How good is the turbid medium-based approach for accounting for light partitioning in contrasted grasslegume intercropping systems? Ann. Bot. 2011, 108, 1013–1024. [Google Scholar] [CrossRef] [PubMed]
- Poorter, H.; Niklas, K.J.; Reich, P.B.; Oleksyn, J.; Poot, P.; Mommer, L. Biomass allocation to leaves, stems and roots: Meta-analysis of interspecific variation and environmental control. New Phytol. 2012, 193, 30–50. [Google Scholar] [CrossRef] [PubMed]
- Koudela, M.; Petříková, K. Nutrients content and yield in selected cultivars of leaf lettuce (Lactuca sativa L. var crispa). Hortic. Sci. 2008, 35, 99–106. [Google Scholar] [CrossRef]
- Colonna, E.; Rouphael, Y.; Barbieri, G.; Pascale, S. Nutritional quality of ten leafy vegetables harvested at two light intensities. Food Chem. 2016, 199, 702–710. [Google Scholar] [CrossRef] [PubMed]
- Cecílio Filho, A.B.; Bezerra Neto, F.; Rezende, B.L.A.; Grengeiro, L.C.; Lima, J.S.S. Indices of competition and bio-agroeconomic efficiency of lettuce and tomato intercrops in greenhouses. Aust. J. Crop Sci. 2013, 7, 809–819. [Google Scholar]
- Ngouajio, M.; Wang, G.; Hausbeck, M.K. Changes in pickling cucumber yield and economic value in response to planting density. Crop Sci. 2006, 46, 1570–1575. [Google Scholar] [CrossRef]
- Hao, X.; Papadopoulos, A.P. Effects of supplemental lighting and cover materials on growth, photosynthesis, biomass partitioning, early yield and quality of greenhouse cucumber. Sci. Hortic. 1999, 80, 1–18. [Google Scholar] [CrossRef]
- Hovi-Pekkanen, T.; Tahvonen, R. Effects of interlighting on yield and external fruit quality in year-round cultivated cucumber. Sci. Hortic. 2008, 116, 152–161. [Google Scholar] [CrossRef]
- Schultheis, J.R.; Wehner, T.C.; Walters, S.A. Optimum planting density and harvest stage for little-leaf and normal-leaf cucumbers for once-over harvest. Can. J. Plant Sci. 1998, 78, 333–340. [Google Scholar] [CrossRef]
- Keating, B.A.; Carberry, P.S. Resource capture and use in intercropping: Solar radiation. Field Crops Res. 1993, 34, 273–301. [Google Scholar] [CrossRef]
- Sinoquet, H.; Caldwell, R.M. Estimation of light capture and partitioning in intercropping systems. In Ecophysiology of Tropical Intercropping; Sinoquet, H., Cruz, P., Eds.; INRA: Paris, France, 1995; pp. 79–98. [Google Scholar]
- Baumann, D.T.; Bastiaans, L.; Goudriaan, J.; Van Laar, H.H.; Kropff, M.J. Analysing crop yield and plant quality in an intercropping system using an eco-physiological model for interplant competition. Agric. Syst. 2002, 73, 173–203. [Google Scholar] [CrossRef]
- Gou, F.; Van Ittersum, M.K.; Wang, G.; Van Der Putten, P.E.L.; Van Der Werf, W. Yield and yield components of wheat and maize in wheat-maize intercropping in the Netherlands. Eur. J. Agron. 2016, 76, 17–27. [Google Scholar] [CrossRef]
- Berry, A.D.; Stall, W.M.; Rathinasabapathi, B.; Gregory, E.; Charudattan, R. Aggressivity: Cucumber vs. amaranth. Weed Technol. 2006, 20, 986–991. [Google Scholar] [CrossRef]
- Agüero, M.V.; Ponce, A.G.; Moreira, M.R.; Roura, S.I. Lettuce quality loss under conditions that favor the wilting phenomenon. Postharvest Biol. Technol. 2011, 59, 124–131. [Google Scholar] [CrossRef]
- Martínez-Sánchez, A.; Tudela, J.A.; Luna, C.; Allende, A.; Gil, M.I. Postharvest biology and technology low oxygen levels and light exposure affect quality of fresh-cut Romaine lettuce. Postharvest Biol. Technol. 2011, 59, 34–42. [Google Scholar] [CrossRef]
- Galati, V.C.; Guimarães, J.E.R.; Marques, K.M.; Fernandes, J.D.R.; Cecílio Filho, A.B.; Mattiuz, B.H. Silicon in the turgidity maintenance of American lettuce. Afr. J. Agric. Res. 2015, 10, 4699–4705. [Google Scholar]


| Treatment | Acronyms | Lettuce ‘Lucy Brown’ | Lettuce ‘Vanda’ | Cucumber 1 |
|---|---|---|---|---|
| 1—Intercropping | LBI100 | Presence | Absent | Presence (100%) |
| 2—Intercropping | LBI85 | Presence | Absent | Presence (85%) |
| 3—Intercropping | LBI70 | Presence | Absent | Presence (70%) |
| 4—Intercropping | LBI55 | Presence | Absent | Presence (55%) |
| 5—Monoculture | SM100 | Absent | Absent | Presence (100%) |
| 6—Monoculture | SM85 | Absent | Absent | Presence (85%) |
| 7—Monoculture | SM70 | Absent | Absent | Presence (70%) |
| 8—Monoculture | SM55 | Absent | Absent | Presence (55%) |
| 9—Monoculture | LBM | Presence | Absent | Absent |
| 10—Intercropping | VI100 | Absent | Presence | Presence (100%) |
| 11—Intercropping | VI85 | Absent | Presence | Presence (85%) |
| 12—Intercropping | VI70 | Absent | Presence | Presence (70%) |
| 13—Intercropping | VI55 | Absent | Presence | Presence (55%) |
| 14—Monoculture | VM | Absent | Presence | Absent |
| Population Density | T-test (Parallelism) | ||
|---|---|---|---|
| Population Density | |||
| 55 | 70 | 85 | |
| 70 | 0.5683 ns1 | -- | -- |
| 85 | 0.7710 ns | 0.2092 ns | -- |
| 100 | 1.0795 ns | 0.6648 ns | 0.5096 ns |
| F test (Coincidence) | |||
| 55 | 70 | 85 | |
| 70 | 1.5558 ns2 | -- | -- |
| 85 | 2.6858 ns | 0.1638 ns | -- |
| 100 | 7.0390 ** | 3.0562 ns | 2.1009 ns |
| Source of Variation | TFM | TY | ||
|---|---|---|---|---|
| L | 1.24 ns2 | 74.92 ** | ||
| PD | 23.35 ** | 11.84 ** | ||
| L × PD | 5.92 ** | 0.40 ns | ||
| AT1 | 136.34 ** | 0.17 ns | ||
| (L × PD) × AT | 399.00 ** | 25.52 ** | ||
| CV (%) | 14.46 | 16.14 | ||
| Lettuce | Intercropping | Monoculture | ||
| TFM | TY | TFM | TY | |
| g plant−1 | kg m−2 | g plant−1 | kg m−2 | |
| ‘Vanda’ | 133.96 A 3 | 2.14 A | 237.29 B | 3.80 A |
| ‘Lucy Brown’ | 144.21 A | 1.12 B | 452.50 A | 3.70 A |
| Contrasts | TFM | TY |
|---|---|---|
| VM × VI100 1 | 118.75 2 ** | 1.90 3 ** |
| VM × VI85 | 112.50 ** | 1.80 ** |
| VM × VI70 | 112.50 ** | 1.80 ** |
| VM × VI55 | 69.58 ** | 1.11 ** |
| LBM × LBI100 | 371.46 ** | 3.04 ** |
| LBM × LBI85 | 324.58 ** | 2.65 ** |
| LBM × LBI70 | 323.13 ** | 2.64 ** |
| LBM × LBI55 | 214.00 ** | 1.95 ** |
| Source of Variation | NFP | NFA | CYP | CYA | LER | RYlet | RYcuc |
|---|---|---|---|---|---|---|---|
| CS | 1.11 ns1 | 1.17 ns | 0.78 ns | 0.82 ns | 30.82 **,1 | 117.98 ** | 0.36 ns |
| PD | 6.42 ** | 25.78 ** | 6.57 ** | 14.10 ** | 1.18 ns | 25.25 ** | 10.59 ** |
| CS × PD | 1.46 ns | 1.39 ns | 1.22 ns | 1.48 ns | 3.51 * | 1.34 ns | 2.38 ns |
| CV (%) | 11.64 | 11.83 | 12.54 | 13.38 | 7.98 | 15.01 | 9.23 |
© 2020 by the authors. Licensee MDPI, Basel, Switzerland. This article is an open access article distributed under the terms and conditions of the Creative Commons Attribution (CC BY) license (http://creativecommons.org/licenses/by/4.0/).
Share and Cite
Ribas, R.G.T.; Cecílio Filho, A.B.; Dutra, A.F.; Barbosa, J.C.; Rolim, G.d.S. Land Equivalent Ratio in the Intercropping of Cucumber with Lettuce as a Function of Cucumber Population Density. Agriculture 2020, 10, 88. https://doi.org/10.3390/agriculture10030088
Ribas RGT, Cecílio Filho AB, Dutra AF, Barbosa JC, Rolim GdS. Land Equivalent Ratio in the Intercropping of Cucumber with Lettuce as a Function of Cucumber Population Density. Agriculture. 2020; 10(3):88. https://doi.org/10.3390/agriculture10030088
Chicago/Turabian StyleRibas, Rodolfo Gustavo Teixeira, Arthur Bernardes Cecílio Filho, Alexson Filgueiras Dutra, José Carlos Barbosa, and Glauco de Souza Rolim. 2020. "Land Equivalent Ratio in the Intercropping of Cucumber with Lettuce as a Function of Cucumber Population Density" Agriculture 10, no. 3: 88. https://doi.org/10.3390/agriculture10030088
APA StyleRibas, R. G. T., Cecílio Filho, A. B., Dutra, A. F., Barbosa, J. C., & Rolim, G. d. S. (2020). Land Equivalent Ratio in the Intercropping of Cucumber with Lettuce as a Function of Cucumber Population Density. Agriculture, 10(3), 88. https://doi.org/10.3390/agriculture10030088