Article

Biochar Amendment Enhances Water Retention in a Tropical Sandy Soil

by
Martha Lustosa Carvalho
1,*,
Moacir Tuzzin de Moraes
2,
Carlos Eduardo P. Cerri
1 and
Maurício Roberto Cherubin
1,*
1
Department of Soil Science, “Luiz de Queiroz” College of Agriculture/University of São Paulo (ESALQ/USP), Piracicaba SP 13418-900, Brazil
2
Department of Agronomic Science (DAGRO-FB), Federal University of Technology-Paraná campus Francisco Beltrão, Francisco Beltrão PR 85601-970, Brazil
*
Authors to whom correspondence should be addressed.
Agriculture 2020, 10(3), 62; https://doi.org/10.3390/agriculture10030062
Submission received: 30 January 2020 / Revised: 25 February 2020 / Accepted: 2 March 2020 / Published: 4 March 2020
(This article belongs to the Section Agricultural Soils)

Abstract

:
The use of biochar, which is the solid product of biomass pyrolysis, in agricultural soils, has been shown as a strategic solution for building soil carbon stocks and mitigating greenhouse gas emissions. However, biochar amendment might also benefit other key soil processes and services, such as those that are related to water retention, particularly in sandy soils. Here, we conducted an experiment to investigate the potential of biochar to enhance pore size distribution and water retention properties in a tropical sandy soil. Three biochar rates were incorporated (equivalent to 6.25, 12.5, and 25 Mg ha−1) into plastic pots containing a sandy Oxisol sampled from a sugarcane field in Brazil. Undisturbed samples of the mixture were collected at two evaluation times (50 and 150 days) and used to determine water retention curves and other soil physical properties. The results showed that biochar amendment decreased soil bulk density and increased water retention capacity, micropore volume, and available water content. Higher soil water retention in amended soil is associated with the inherent characteristics of biochar (e.g., internal porosity) and potential improvements in soil structure. Microporosity and water retention were enhanced with intermediate biochar rate (12.5 Mg ha−1), instead of the highest rate (25 Mg ha−1) tested. Further studies are needed to validate these results under field conditions.

1. Introduction

Climate-smart agriculture is critical for achieving food and energy security and mitigating global warming and climate change [1,2]. Agricultural activities (e.g., land use change, soil tillage, and use of synthetic N fertilizers) account for 14% of greenhouse gas (GHG) emissions of anthropogenic origin [3,4], which has intensified alterations in the planet’s hydrological regimes in response to global climate change [5,6]. These modifications may bring new challenges for food production in some areas, including Brazil, where more than 80% of production areas are rainfed [7]. Thus, water shortage is the main factor limiting the yield potential of agricultural crops in Brazil [8,9].
In the last decades, new resources and improved agricultural management strategies have emerged for mitigating global GHG emissions [1]. One of these strategies is the use of biochar, a recalcitrant organic material that is produced through the thermal degradation of biomass in a low oxygen environment, to promote soil carbon (C) accretion [1,10]. However, the benefits of biochar go beyond C sequestration, affecting other multiple soil properties and processes [11,12,13]. These benefits include increasing soil pH [14], cycling and plant-availability of nutrients [15], cation exchange capacity [16], adsorption of potentially toxic elements [17], and microbial biodiversity [18]. In addition, a recent global meta-analysis showed the potential of biochar use for enhancing soil physical properties, such as reducing bulk density and increasing water retention capacity [19], especially in coarse-textured soils under temperate climate [20,21,22]. However, there is a paucity of studies investigating the potential of biochar to increase water retention capacity in tropical soils [23,24,25] and particularly, in sandy soils, where plants are more susceptible to water stress.
Therefore, the hypothesis that was tested in this study was that the water retention capacity of a tropical sandy soil would proportionally increase with the rate of biochar incorporated into the soil. To test this hypothesis, we investigated the impact of biochar amendment on pore function and water retention properties in a tropical sandy soil.

2. Materials and Methods

2.1. Soil and Biochar Characteristics

The experiment was performed while using soil samples from an Oxisol (“Latossolo Vermelho-Amarelo Distrófico”—Brazilian Soil Classification System, dos Santos et al. [26]), with sandy loam texture, i.e., 78% sand, 7% silt, and 15% clay. The soil samples were collected from the 0–20 cm layer in a commercial sugarcane field that was cultivated under conventional tillage system and located in Ipeúna (22°6′9″ S, 47°43′8″ W; elevation of 635 m), São Paulo state, southeastern Brazil. The soil samples were air-dried and sieved in 2 mm sieves.
Table 1 presents the characteristics of the biochar that was used in this experiment. For more information on the physical and chemical characteristics of this particular biochar, as well as production parameters, see Rittl et al. [27].

2.2. Experimental Design

The experiment was assembled in a greenhouse following a completely randomized block design, with one factor—rate of biochar—and two evaluation times, with four replications for each treatment. The rates of biochar tested were equivalent to 0, 6.25, 12.5, and 25 Mg ha−1, while the evaluation times tested were 50 and 150 days after incorporation (DAI). We chose the rates for this experiment based on work by Woolf et al. [28], in which the authors established that the maximum application of biochar in the first 15 cm of soil depth was 50 Mg ha−1. While considering that our experiment was to be conducted on small pots (depth < 10 cm), we established the maximum rate for the experiment (25 Mg ha−1) as 50% of the rate that was used by Woolf et al. [28]. We then determined the intermediate rate (12.5 Mg ha−1) as 50% of the maximum rate, and the lowest rate (6.25 Mg ha−1) as 25% of the same maximum rate. The amount of biochar was calculated while assuming that the biochar was only added to the upper 10 cm of the soil and covered the surface area of the pot.
The experiment was set up in a total of 32 plastic pots (4 treatments × 4 replicates × 2 evaluation times) with a volume of 725 cm3 and dimensions of 9.1 cm of height, 12.5 cm top diameter, and 9.3 cm lower diameter (total surface area 376 cm2). The bottoms of the pots were lined with a drainage blanket to prevent soil loss. First, the plastic pots were packed with 500 g of soil, as well as the biochar amounts equivalent to the four rates (23.5 g to the 6.25 Mg ha−1 rate, 47 g to the 12.5 Mg ha−1 rate, and 94 g to the 25 Mg ha−1 rate) being tested. After the addition to the pots, the biochar was manually incorporated in the soil and the pots were randomly allocated on the greenhouse stand.
During the experiment, the soil water content of the biochar-amended soil was maintained close to pot capacity to preserve biological activity. Pot capacity, which is the amount of water remaining in a pot after an irrigation and visible drainage has ceased [29], was determined by pot weight after soil saturation and drainage for 24 h (for sandy soil). Every seven days the pots were weighed, and distilled water was added until the soil returned to the pot capacity.

2.3. Soil Physical Sampling and Analyses

The soil samples were collected at each predefined evaluation times (i.e., 50 and 150 days after the incorporation of biochar). One soil core was collected at the center of each pot using stainless steel cylinders with an approximate volume of 50 cm3 (about 5 cm in diameter and 2.5 cm in height). Soil physical properties (soil bulk density, total porosity, macroporosity, microporosity, and soil water retention) were determined according to Dane and Topp [30]. The bulk density was calculated as the dry soil weight of each soil sample divided by the volume of the ring containing the sample. Microporosity was determined as the water content in the sample at potential of −0.06 bar (−6 kPa). Macroporosity was determined as the difference between the water content at saturation and soil water content at −6 kPa water potential. The total porosity was calculated as the sum of macro- and microporosity.

2.3.1. Soil Water Retention Curve (SWRC)

Soil water retention curves were determined for the 32 samples while using seven matric potential points to fit the curves. Initially, the soil samples were saturated by capillary rise for 24 h, weighed and subjected to water drainage at the following matric potentials: −2; −3; −6, −10, −30, −100, and −1000 kPa on pressure plate extractors (Richards’ chambers). After reaching equilibrium at each water tension, the soil samples were weighed to quantify the volumetric soil water content (m3 m−3). Subsequently, all soil samples were oven-dried at 105 °C for 72 h to quantify dry soil mass to determine the soil bulk density (Mg m−3).
Soil water retention curves were fitted to the measured dataset (soil water content and matric potential) while using the SWRC (Soil Water Retention Curve Software) software [31] by fitting the parameters (α, n and m) using a non-linear model that was proposed by van Genuchten [32] (Equation (1)), while assuming the Mualem [33] restriction (m = 1 − 1/n).
θ = θ r + θ s θ r [ 1 + ( α h ) n ] m
where: θ (m3 m−3) is a water content estimate; θr (m3 m−3) is the residual water content; θs (m3 m−3) is saturated water content; α (kPa−1) and n are adjustment parameters; m = 1 − 1/n and h are the positive values of matric potential.
Table 2 shows the fitted van Genuchten parameters for each water retention curve.

2.3.2. Plant-Available Water Content and Soil Porosity

The corresponding values of soil moisture at −10 kPa—field capacity (FC, m3 m−3) and −1500 kPa—permanent wilting point (PWP, m3 m−3) were directly obtained from the adjusted SWRCs. Based on these values, the plant-available water content (AWC, m3 m−3) was calculated for each treatment (Equation (2)), as:
A W C = F C P W P
The pore size distribution curve was obtained from the first derivative of the van Genuchten equation, and the equivalent pore diameter was estimated while using the reduced form of the capillarity equation (Equation (3)) [34]. Thus, microporosity, macroporosity, and total porosity were determined from the adjusted values of soil water retention curves. Total porosity (TP) was defined as the total water volume retained under soil saturation divided by the sample volume. The volume fraction of total porosity was separated in macroporosity (pores > 50 µm), defined as pores draining freely with gravity, and microporosity (pores ≤ 50 µm), defined as effective pores for retaining plant-available water.
E D P = 300 h
where EPD is the equivalent diameter of the smallest pore (μm); and h is the positive value of the matric potential (kPa).

2.3.3. Soil Water (SWSC) and Air (SAC) Storage Capacity Indexes

The SWSC and SAC indexes were proposed by Reynolds et al. [35] as tools for assessing soil quality, and they were calculated as follows: soil water storage capacity (SWSC) is defined as the ratio between water content FC and TP, as shown in Equation (4). The SAC index is calculated as the ratio between drained pores in the −10 kPa (CAt) potential and TP, as shown in Equation (5).
S W S C = F C T P
S A C = C A t T P

2.4. Data Analysis

The dataset was subjected to an analysis of variance (ANOVA) to test the effects of biochar rates on the soil physical and hydrological properties at each evaluation time separately. When these effects were significant, the means were compared while using Tukey’s test (p < 0.05). Available water content data for the 32 SWRCs was used to calculate a regression and rate-response curve.

3. Results

3.1. Soil Bulk Density

Biochar amendment promoted a reduction of soil bulk density as compared to control (Figure 1). At 50 days after incorporation (DAI), bulk density decreased by 33%, when compared to the control, for the 6.25 Mg ha−1 rate; by 59% for the 12.5 Mg ha−1 rate and by 63% for the 25 Mg ha−1 rate (Figure 1a). Similarly, at 150 DAI, the reduction was 32% for the 6.25 Mg ha−1 rate, 55% for the 12.5 Mg ha−1 rate, and 56% for the 25 Mg ha−1 rate (Figure 1b).
There were no differences between the 12.5 Mg ha−1 and 25 Mg ha−1 treatments in both 50 DAI and 150 DAI, suggesting that the maximum rate to influence this parameter was approximately 12.5 Mg ha−1, and the addition of higher rates did not bring significant changes in soil bulk density.

3.2. Soil Water Retention Curves (SWRCs) and Available Water Content (AWC)

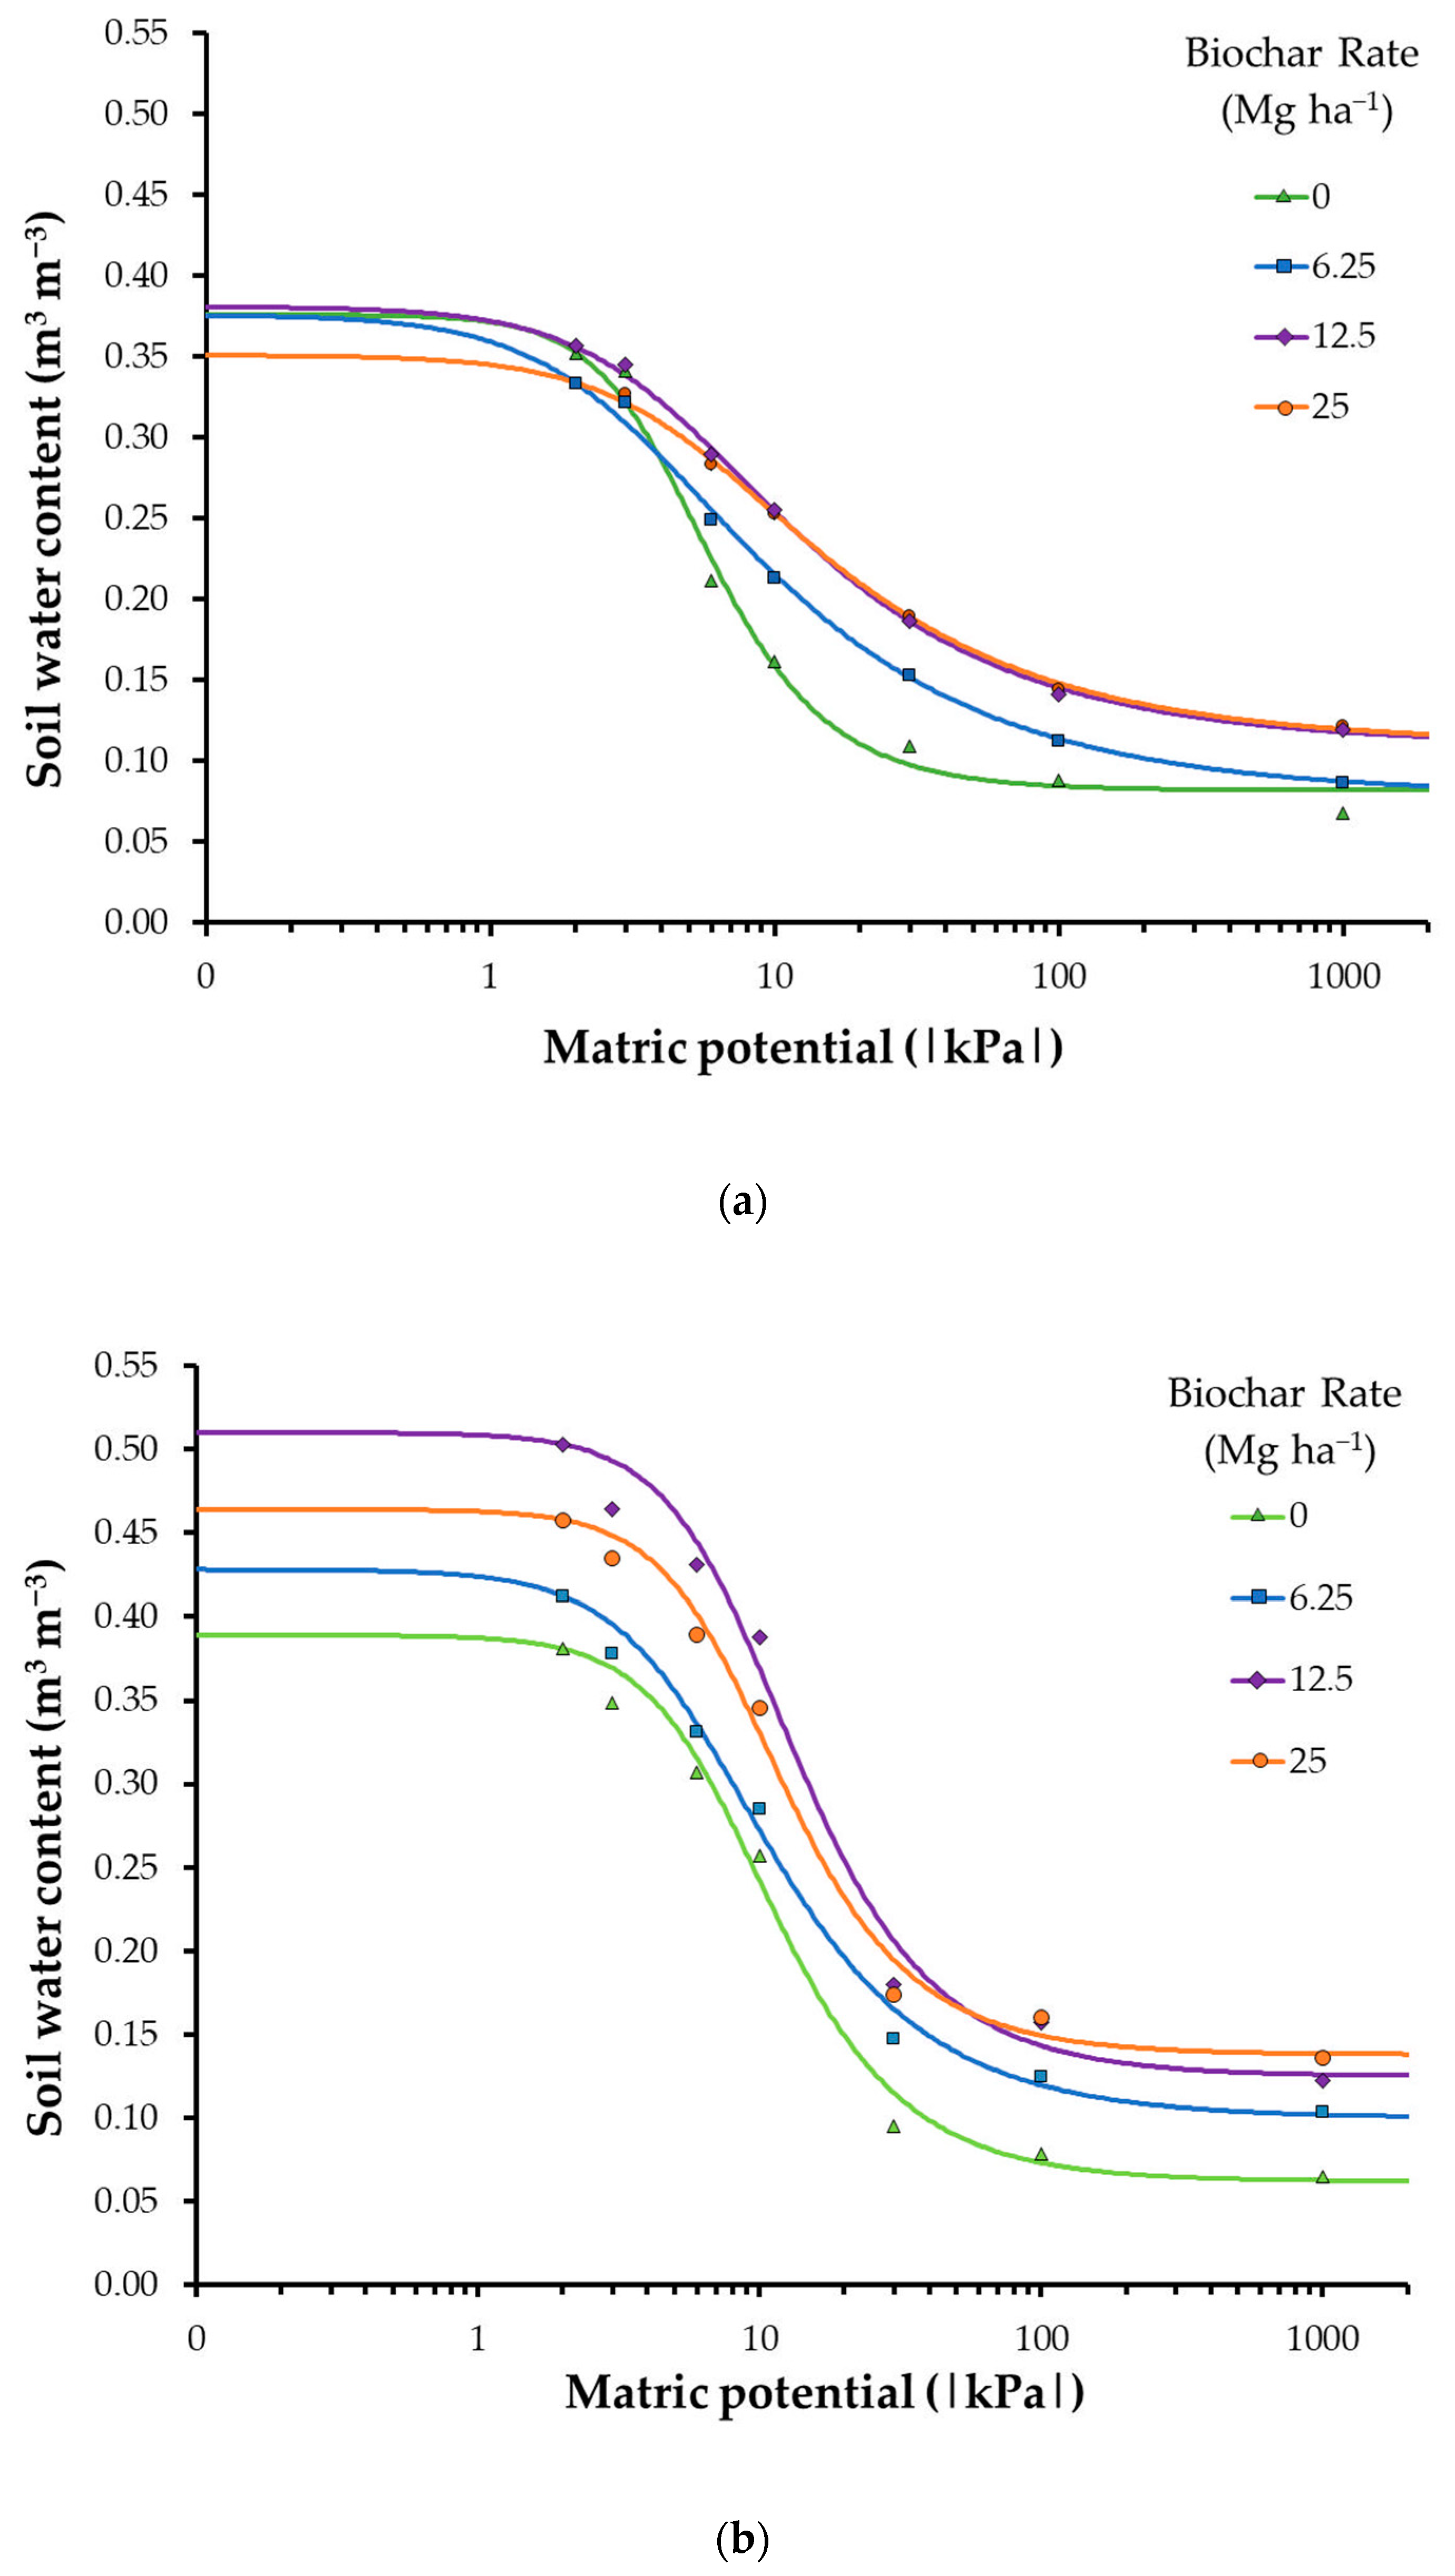
The SWRCs for samples that were collected at 50 DAI (Figure 2a) show that the control was able to retain more water—in comparison to biochar treatments—at the first section of the curve (potentials from 0 to −1.5 kPa) where the soil was very close to saturation. From this point until the end of the curve, the biochar treatments had higher water retention capacity, increasing with the application rate.
At 50 DAI (Figure 2a), soil that was amended with 12.5 Mg ha−1 of biochar showed the highest performance of all treatments at low tensions (up to −10 kPa), and very similar performance to the 25 Mg ha−1 rate at higher tensions (from −10 to −1000 kPa). Soil that was amended with 25 Mg ha−1 had the poorest retention capacity at the lowest tensions, but an inverse pattern was observed at high-tension points. At 150 DAI (Figure 2b), the 12.5 Mg ha−1 biochar rate induced the highest soil water retention capacity at the lowest tensions, and a similar performance to the 25 Mg ha−1 rate at high tensions.
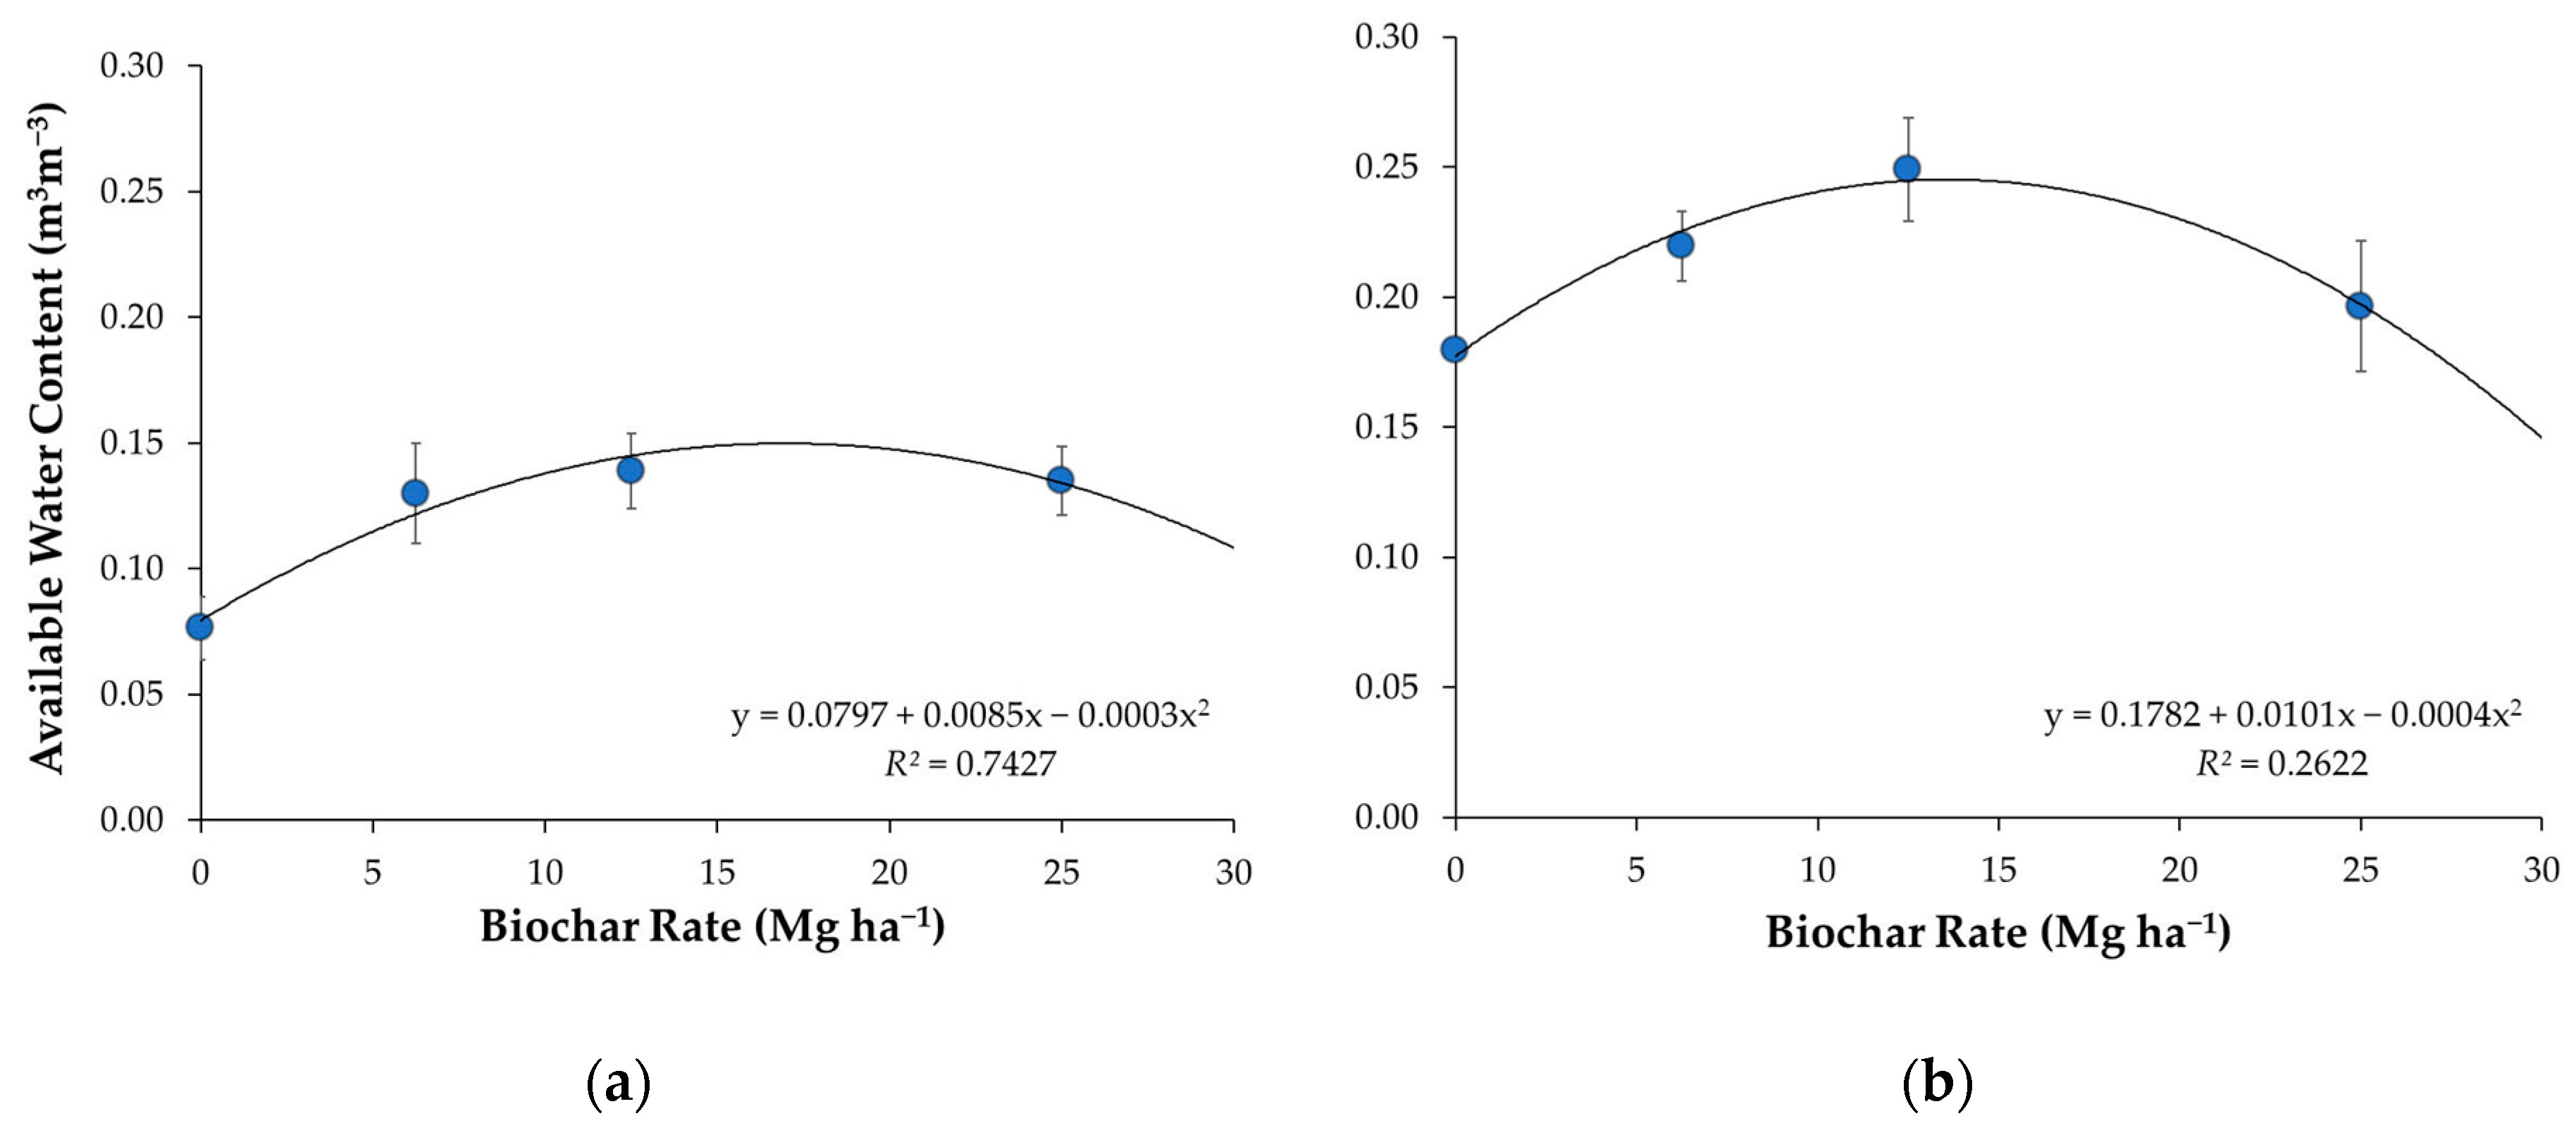
The AWC exhibited a quadratic response function to biochar rates. At 50 DAI (Figure 3a), the highest AWC was reached, with 14.2 Mg ha−1 of biochar. At 150 DAI (Figure 3b), the pattern was similar to the one that was observed at 50 DAI, in which all biochar treatments increased the AWC (i.e., 15% increase to the 6.25 Mg ha−1 rate, 30% for the 12.5 Mg ha−1 rate, and 25% for the 25 Mg ha−1 rate) when compared to control. The rate that provided the highest AWC, according to the regression, was 12.6 Mg ha−1. The coefficient of determination for the second regression (150 DAI) was relatively low (r2 = 0.26) when compared with the first regression (r2 = 0.74).

3.3. Pore Size Distribution

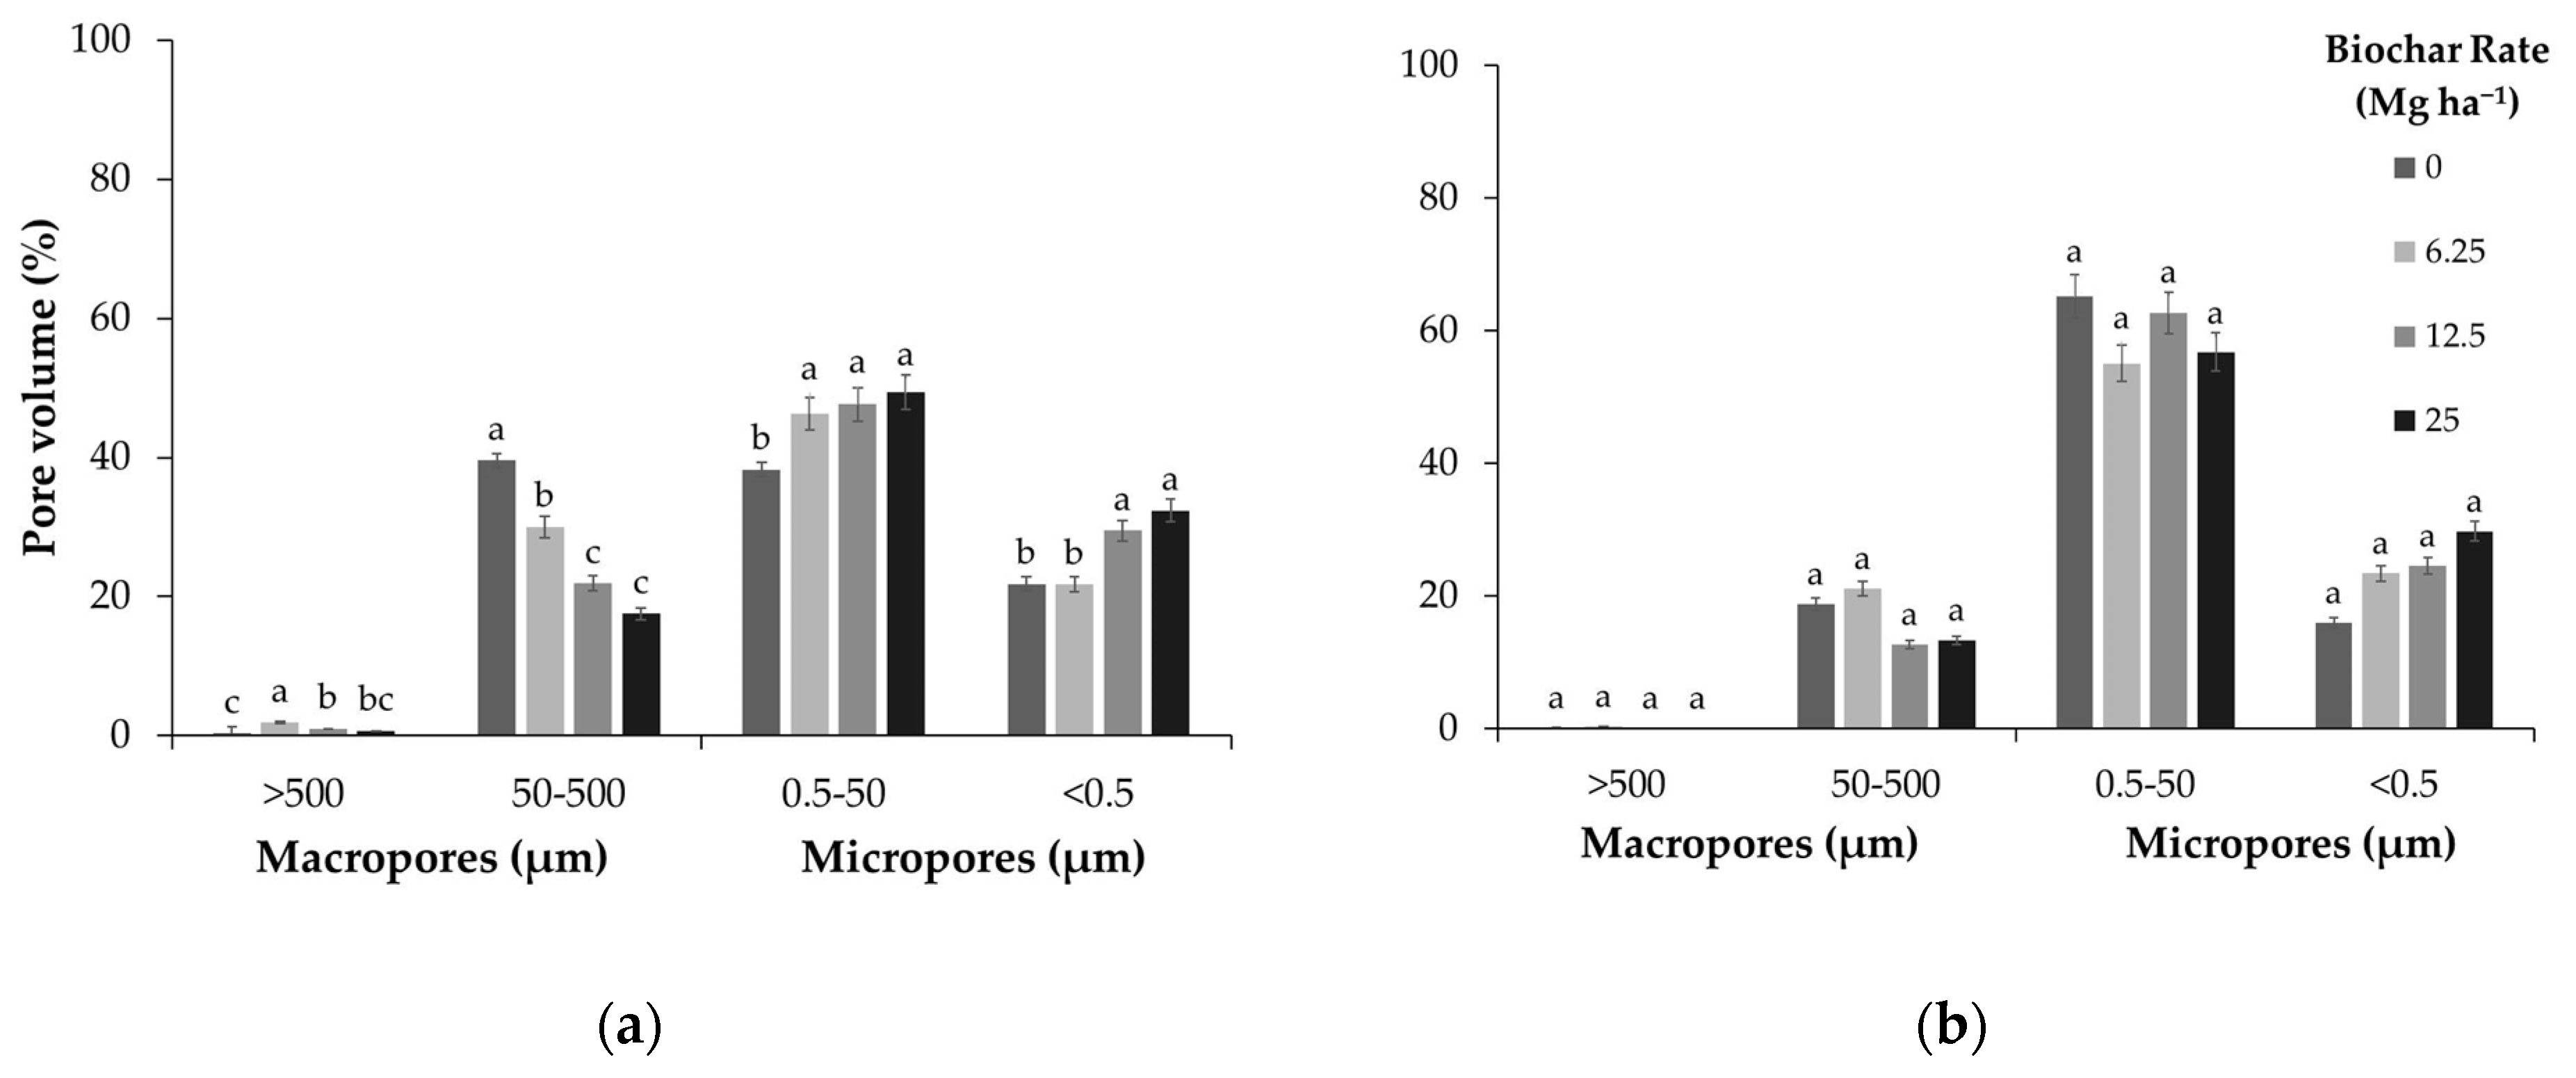
The soil pore size distributions were changed due to biochar addition (Figure 4) and over time. In general, at 50 DAI there was higher macroporosity volume under non-amended soil (control) than all other biochar rates (Figure 4a). The microporosity volume was higher in soil with biochar when compared to the control condition at 50 DAI (Figure 4a). Micropores that can retain plant-available water (pores from 0.5 µm to 50 µm) accounted for approximately 45% of total volume of pores. At 150 DAI, no significant differences among the treatments were detected for macroporosity and microporosity. However, micropores (pores from 0.5 µm to 50 µm) represented approximately 60% of total volume of pores.

3.4. Soil Water Storage Capacity (SWSC) and Soil Air Capacity (SAC) Indexes

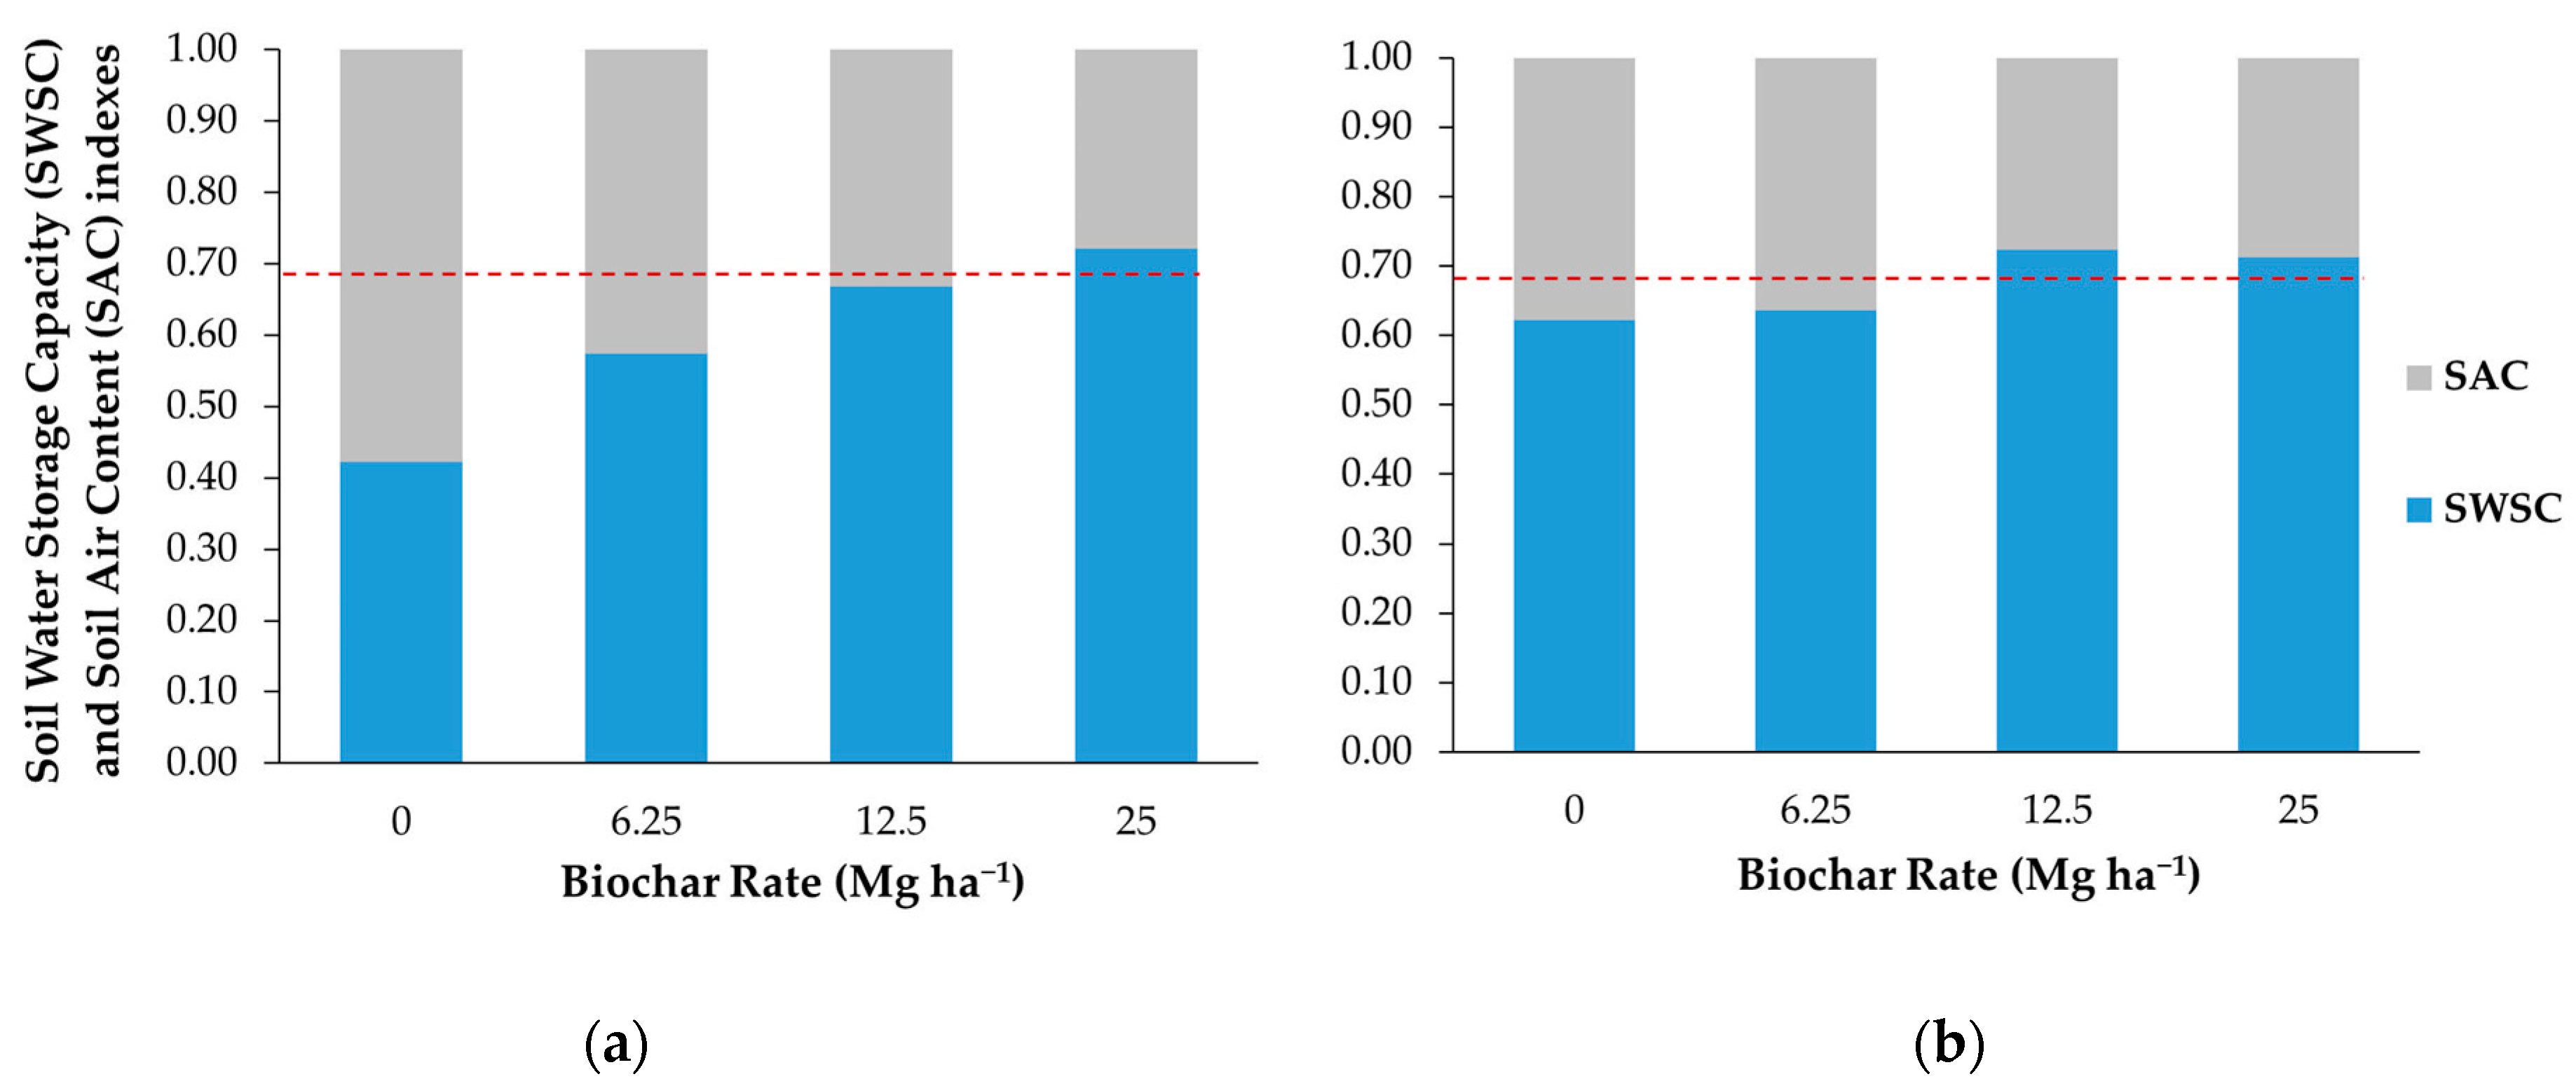
The proportions of water and air storage ratio in the soil after 50 DAI and 150 DAI are shown in different colors in Figure 5. The dashed red lines indicate the soil pore distribution non-limiting to root growth (ideal ratio = SAC 0.33 and SWSC: 0.66) that was proposed by Reynolds et al. [35]. The water-to-air storage ratio of the control increased between 50 DAI and 150 DAI, indicating an increase in water storage capacity (SWSC). However, in both evaluation times, the SWSC was below the critical limit that was proposed by Reynolds et al. [35].
Biochar treatments had a higher water-to-air storage ratio when compared to the control. The highest ratio was observed for the 25 Mg ha−1 rate, and it remained stable throughout the evaluation period. For the non-amended soil (control), increases in the water storage capacity between 50 DAI and 150 DAI occurred for the 6.25 Mg ha−1 and 12.5 Mg ha−1 treatments.
In both evaluation times, the 6.25 Mg ha−1 rate showed SWSC that was slightly below the ideal, while the 25 Mg ha−1 treatment was above the optimum. A different pattern was seen for the 12.5 Mg ha−1 rate—a nearly ideal proportion of water and air storage was observed at 50 DAI (Figure 5a), while an increase in water capacity was observed at 150 DAI (Figure 5b), increasing the index above the ideal level.

4. Discussion

The incorporation of biochar decreased the soil bulk density in the studied soil, as consistently reported in the literature [19,36,37]. In sandy soils, the bulk density tends to be more responsive to biochar application when compared to loamy soils [19], due to soil intrinsic properties, such as lower total porosity and high mineral particle density. The incorporation of biochar, a material with lower particle density than soil [21] decreased the bulk density of the soil by occupying volume and reducing total weight. Similarly, the incorporation of a highly porous substance as biochar increased the total pore space of the soil + biochar mixture, thus decreasing the bulk density.
Another potential mechanism of reducing the bulk density in biochar-amended soils might be associated with increases in the soil aggregate stability, porosity, and available water capacity, as recently suggested by Obia et al. [24] and Verheijen at al. [38]. The high content of organic C in this biochar (64%) improved the soil water retention [39,40] due to two factors: an increased number of contact points between the particles of the aggregates [41] and a structural rearrangement [42]. The formation of contact points within the aggregates was favored by wet-dry cycles [43], thus reducing the aggregate bulk density and increasing soil pore network and soil water retention at the same time. Thus, over time (from 50 to 150 days) soil water retention increases may be associated with the reconsolidation of soil structure, being governed by age-hardening phenomenon [41]. The pore network and soil structure are strengthened with time [44], increasing soil cohesion and positively influencing hydraulic or gaseous fluxes [45]. The increase in total porosity had a direct effect in soil hydrological properties. Drainage and water retention in soils are linked to soil porosity, in which larger diameter pores (macropores) influence drainage, and smaller diameter pores (micropores) influence water retention, mainly by capillarity. The macropore and micropore ratios determine whether a soil has greater drainage or water retention capacity, thus pore size distribution allows for us to infer about water dynamics in the soil. Sandy soils have a predominance of macropores, favoring water drainage rather than water retention. On the other hand, biochar is a highly porous material with the prevalence of micropores [46]. Thus, biochar amendment to a sandy soil increased its total porosity, and more specifically microporosity (Figure 4), enhancing water retention (Figure 2). These results are in line with a recent study in tropical sandy soils in Brazil, in which water retention increased with the decrease in biochar particle size and the consequent increase in surface specific area [39].
Soil water retention might also be mediated by adsorption mechanisms, apart from capillarity. Biochar particles are able to retain water particles through this mechanism due to their high specific surface area per unit of mass (Table 1). The incorporation of biochar in the soil might increase soil surface area, especially in sandy soils, thus increasing the water retention of the system [24]. The biochar effect on soil water retention can be clearly observed in the SWRCs. Biochar amendment increased the water content along the entire curve, especially at the second evaluation time (Figure 2b). Ulyett et al. [47] reported a similar result, although the SWRC in that study did not incorporate matric potentials up to the wilting point (−1500 kPa). At lower tensions (0 to −6 kPa), water content increase is probably due to water retention in large macropores created in the soil surrounding biochar particles as they settle without clogging pores [48], a mechanism that was proposed by Hardie et al. [49], and to the adsorption of water molecules in biochar. At these lower tensions close to soil saturation, water is loosely retained and is removed (drained) by gravity. Thus, the water only remains available to plants for short periods. However, under higher tensions, water is retained in micropores and it cannot be drained by gravity. The increase in microporosity due to biochar amendment leads to a greater water volume retained in the soil at these tensions [50], up to the wilting point [19]. The water might be directly stored in internal biochar micropores [19], or, as Petersen et al. [51] reported, in drainage pores converted by biochar particles into smaller water-holding pores. All of the biochar-amended soils held higher water content in the tensions between field capacity and the permanent wilting point (Figure 2) as compared to the control, increasing AWC to be potentially used by plants [52]. The increases in AWC that were found in this study fall within the range reported by Razzaghi et al. [19], being observed in 57 studies that were conducted in coarse-textured soils around the world. However, biochar addition did not have the expected linear effect, which suggested that the highest rate used was excessive for this short-term study.
Although the results of this study show an increase in porosity and AWC related to biochar amendment, Jeffery et al. [53] observed that this effect does not always occur. In some cases, biochar amendment increases the total soil porosity without increasing water retention in the system. Biochars with high hydrophobicity are not effective in increasing water retention, given that their hydrophobic nature prevents water from entering the internal pores of the particles [53]. In sandy soil, Ajayi et al. [54] observed that over time hydrophobicity (repellency index) significantly increased with increasing biochar rate due to wet-dry cycles. This corroborates our results, which show a reduction of water retention at higher biochar rate (i.e., 25 Mg ha−1 of biochar).
The air and water storage indexes (SWSC and SAC) indicate that the sandy soil used here has unbalanced aeration and water retention, with larger pores that are filled by air. While considering the frequent and ever-longer drought periods that Brazilian agricultural production experiences, cultivated plants in sandy soils with low water retention capacity are more susceptible to water stress and they can suffer production losses. Within the limitations of a greenhouse pot study, the results suggest that the optimum soil response was observed with the biochar rate around 12.5 Mg ha−1, which can improve soil physical and hydrological quality, maintaining a balance between aeration porosity and soil water retention (Figure 4 and Figure 5) in tropical sandy soils with similar characteristics to the soil used here.
However, it is important to note that the observed effects are strongly related to feedstock and pyrolysis parameters, and dependent on biochar application rates and soil types [13,19,48,55]. Moreover, biochar incorporation depth under field conditions, especially in intensive tillage systems, is greater than in this pot experiment (10 cm) and it might set another variable that needs to be assessed. Nevertheless, we encourage further studies with long-term biochar amendment, using different types of biochars, to validate our conclusion in field conditions under different cropping systems, although this greenhouse study showed promising evidence of potential biochar use for increasing water retention.

5. Conclusions

Biochar amendment increased the water retention in the sandy soil studied, by modifying distribution of soil pores. Water retention did not linearly increase with the biochar rate. Intermediate rates had the highest available water content, 14.2 Mg ha−1 for 50 DAI and 12.6 Mg ha−1 for 150 DAI. However, optimal rates may vary according to soil, biochar characteristics, and time of incorporation; therefore, for fine-tuning, biochar recommendation in large-scale field conditions site-specific experimentation is required.
Nevertheless, our study revealed that biochar amendment has the potential to contribute to mitigating water stress in sandy soils in Brazil, and possibly in other tropical regions.

Author Contributions

Conceptualization, M.L.C., C.E.P.C. and M.R.C.; experimental conduction and data analysis, M.L.C., M.T.d.M., M.R.C.; writing—Original draft preparation, M.L.C., M.T.d.M., C.E.P.C. and M.R.C. All authors have read and agreed to the published version of the manuscript.

Funding

This research received no external funding.

Acknowledgments

The authors would like to thank Reginaldo Natalino “Rossi” Nogueira for his technical support in the laboratory.

Conflicts of Interest

The authors declare no conflict of interest.

References

  1. Paustian, K.; Lehmann, J.; Ogle, S.; Reay, D.; Robertson, G.; Smith, P. Climate-smart soils. Nature 2016, 532, 49–57. [Google Scholar] [CrossRef] [PubMed] [Green Version]
  2. Bai, X.; Huang, Y.; Ren, W.; Coyne, M.; Jacinthe, P.A.; Tao, B.; Matocha, C. Responses of soil carbon sequestration to climate-smart agriculture practices: A meta-analysis. Glob. Chang. Biol. 2019, 25, 2591–2606. [Google Scholar] [CrossRef] [PubMed]
  3. Smith, P.; Martino, D.; Cai, Z.C.; Gwary, D.; Janzen, H.; Kumar, P.; McCarl, B.; Ogle, S.; O’Mara, F.; Rice, C.; et al. Policy and technological constraints to implementation of greenhouse gas mitigation options in agriculture. Agric. Ecosyst. Environ. 2007, 118, 6–28. [Google Scholar] [CrossRef]
  4. Tubiello, F. Agriculture, Forestry and Other Land Use Emissions by Sources and Removals by Sinks: 1990–2011 Analysis; FAO Statistics Division: Rome, Italy, 2014. [Google Scholar]
  5. Vörösmarty, C.J.; Sahagian, D. Anthropogenic disturbance of the terrestrial water cycle. Bioscience 2000, 50, 753–765. [Google Scholar] [CrossRef] [Green Version]
  6. Trenberth, K.E.; Fasullo, J.T.; Shepherd, T.G. Attribution of climate extreme events. Nat. Clim. Chang. 2015, 5, 725–730. [Google Scholar] [CrossRef]
  7. Christofidis, D. Irrigação, a fronteira hídrica na produção de alimentos. Irrigação e Tecnologia Moderna 2002, 54, 46–55. [Google Scholar]
  8. Sentelhas, P.C.; Battisti, R.; Camara, G.M.S.; Farias, J.R.B.; Hampf, A.C.; Nendel, C. The soybean yield gap in Brazil—Magnitude, causes and possible solutions for sustainable production. J. Agric. Sci. 2015, 153, 1394–1411. [Google Scholar] [CrossRef] [Green Version]
  9. Dias, H.B.; Sentelhas, P.C. Sugarcane yield gap analysis in Brazil—A multi-model approach for determining magnitudes and causes. Sci. Total Environ. 2018, 637, 1127–1136. [Google Scholar] [CrossRef]
  10. Lal, R.; Negassa, W.; Lorenz, K. Carbon sequestration in soil. Curr. Opin. Environ. Sustain. 2015, 15, 79–86. [Google Scholar] [CrossRef]
  11. Lone, A.H.; Najar, G.R.; Ganie, M.A.; Sofi, J.A.; Ali, T. Biochar for Sustainable Soil Health: A Review of Prospects and Concerns. Pedosphere 2015, 25, 639–653. [Google Scholar] [CrossRef]
  12. Ding, Y.; Liu, Y.G.; Liu, S.B.; Huang, X.X.; Li, Z.W.; Tan, X.F.; Zeng, G.M.; Zhou, L. Potential Benefits of Biochar in Agricultural Soils: A Review. Pedosphere 2017, 27, 645–661. [Google Scholar] [CrossRef]
  13. Chibuike, G.; Uzoh, I.; Unagwu, B. Biochar-induced modification of soil properties and the effect on crop production. Adv. Agric. Sci. 2019, 7, 59–87. [Google Scholar]
  14. Deluca, T.H.; Gundale, M.J.; MacKenzie, M.D.; Jones, D.L. Biochar effects on soil nutrient transformations. In Biochar for Environmental Management: Science, Technology and Implementation, 2nd ed.; Lehmann, J., Joseph, S., Eds.; Earthscan: New York, NY, USA, 2015; pp. 424–425. [Google Scholar]
  15. Gul, S.; Whalen, J.K. Biochemical cycling of nitrogen and phosphorus in biochar-amended soils. Soil Biol. Biochem. 2016, 103, 1–15. [Google Scholar] [CrossRef]
  16. Jin, Y.; Liang, X.Q.; He, M.M.; Liu, Y.; Tian, G.M.; Shi, J.Y. Manure biochar influence upon soil properties, phosphorus distribution and phosphatase activities: A microcosm incubation study. Chemosphere 2016, 142, 128–135. [Google Scholar] [CrossRef] [PubMed]
  17. Novais, S.V.; Zenero, M.D.O.; Barreto, M.S.C.; Montes, C.R.; Cerri, C.E.P. Phosphorus removal from eutrophic water using modified biochar. Sci. Total Environ. 2018, 63, 825–835. [Google Scholar] [CrossRef] [PubMed]
  18. Lehmann, J.; Rillig, M.C.; Thies, J.; Masiello, C.A.; Hockaday, W.C.; Crowley, D. Biochar effects on soil biota—A review. Soil Biol. Biochem. 2011, 43, 1812–1836. [Google Scholar] [CrossRef]
  19. Razzaghi, F.; Obour, P.B.; Arthur, E. Does biochar improve soil water retention? A systematic review and meta-analysis. Geoderma 2020, 361, 114055. [Google Scholar] [CrossRef]
  20. Abel, S.; Peters, A.; Trinks, S.; Schonsky, H.; Facklam, M.; Wessolek, G. Impact of biochar and hydrochar addition on water retention and water repellency of sandy soil. Geoderma 2013, 202, 183–191. [Google Scholar] [CrossRef]
  21. Liu, Z.L.; Dugan, B.; Masiello, C.A.; Gonnermann, H.M. Biochar particle size, shape, and porosity act together to influence soil water properties. PLoS ONE 2017, 12, e0179079. [Google Scholar] [CrossRef] [Green Version]
  22. Wang, D.Y.; Li, C.Y.; Parikh, S.J.; Scow, K.M. Impact of biochar on water retention of two agricultural soils —A multi-scale analysis. Geoderma 2019, 340, 185–191. [Google Scholar] [CrossRef]
  23. Carvalho, M.T.D.; Maia, A.D.N.; Madari, B.E.; Bastiaans, L.; van Oort, P.A.J.; Heinemann, A.B.; da Silva, M.A.S.; Petter, F.A.; Marimon, B.H.; Meinke, H. Biochar increases plant-available water in a sandy loam soil under an aerobic rice crop system. Solid Earth 2014, 5, 939–952. [Google Scholar] [CrossRef] [Green Version]
  24. Obia, A.; Mulder, J.; Martinsen, V.; Cornelissen, G.; Borresen, T. In situ effects of biochar on aggregation, water retention and porosity in light-textured tropical soils. Soil Till. Res. 2016, 155, 35–44. [Google Scholar] [CrossRef]
  25. Tanure, M.M.C.; da Costa, L.M.; Huiz, H.A.; Fernandes, R.B.A.; Cecon, P.R.; Pereira, J.D.; da Luz, J.M.R. Soil water retention, physiological characteristics, and growth of maize plants in response to biochar application to soil. Soil Till. Res. 2019, 192, 164–173. [Google Scholar] [CrossRef]
  26. Santos, H.G.; Jacomine, P.; dos Anjos, L.H.C.; de Oliveira, V.A.; Lumbreras, J.F.; Coelho, M.R.; de Almeida, J.A.; de Araujo Filho, J.C.; de Oliveira, J.B.; Cunha, T.J.F. Brazilian Soil Classification System, 5th ed.; Reichart, C.E.A.; Anjos, L.H.C.; dos Alves, M.C.; dos Santos, H.G.; Lumbreras, J.F., Translators; rev. and exp. Embrapa soil (CNPS): Brasília, Brazil, 2018; ISBN 978-85-7035-821-9. [Google Scholar]
  27. Rittl, T.F.; Butterbach-Bahl, K.; Basile, C.M.; Pereira, L.A.; Alms, V.; Dannenmann, M.; Couto, E.G.; Cerri, C.E.P. Greenhouse gas emissions from soil amended with agricultural residue biochars: Effects of feedstock type, production temperature and soil moisture. Biomass Bioenerg. 2018, 117, 1–9. [Google Scholar] [CrossRef]
  28. Woolf, D.; Amonette, J.; Street-Perrott, F.; Lehmann, J.; Joseph, S. Sustainable biochar to mitigate global climate change. Nat. Commun. 2010, 1. [Google Scholar] [CrossRef] [PubMed] [Green Version]
  29. Kirkham, M.B. Field Capacity, Wilting Point, Available Water, and the Non-Limiting Water Range. In Principles of Soil and Plant Water Relations; Kirkham, M.B., Ed.; Academic Press: Cambridge, MA, USA, 2005; pp. 101–115. [Google Scholar] [CrossRef]
  30. Dane, J.H.; Topp, C. Physical Methods. In Methods of Soil Analysis; Soil Science Society of America Book Series, no. 5; Soil Science Society of America Inc.: Madison, WI, USA, 2002; p. 1962. [Google Scholar]
  31. Dourado-Neto, D.; Nielsen, D.R.; Hopmans, J.W.; Reichardt, K.; Bacchi, O.O.S. Software to model soil water retention curves (SWRC, version 2.00). Sci. Agric. 2000, 57, 191–192. [Google Scholar] [CrossRef]
  32. Van Genuchten, M.T. A Closed-Form Equation for Predicting the Hydraulic Conductivity of Unsaturated Soils. Soil Sci. Soc. Am. J. 1980, 44, 892–898. [Google Scholar] [CrossRef] [Green Version]
  33. Mualem, Y. A new model for predicting the hydraulic conductivity of unsaturated porous media. Water Resour. Res. 1976, 12, 513–522. [Google Scholar] [CrossRef] [Green Version]
  34. Marsall, T.J.; Holmes, J.W. Soil Physics; Cambridge Univ. Press: New York, NY, USA, 1988. [Google Scholar]
  35. Reynolds, W.D.; Bowman, B.T.; Drury, C.F.; Tan, C.S.; Lu, X. Indicators of good soil physical quality: Density and storage parameters. Geoderma 2002, 110, 131–146. [Google Scholar] [CrossRef]
  36. Mukherjee, A.; Lal, R. Biochar Impacts on Soil Physical Properties and Greenhouse Gas Emissions. Agronomy 2013, 2, 313–339. [Google Scholar] [CrossRef] [Green Version]
  37. Lim, T.J.; Spokas, K.A.; Feyereisen, G.; Novak, J.M. Predicting the impact of biochar additions on soil hydraulic properties. Chemosphere 2016, 142, 136–144. [Google Scholar] [CrossRef] [PubMed]
  38. Verheijen, F.G.A.; Zhuravel, A.; Silva, F.C.; Amaro, A.; Ben-Hur, M.; Keizer, J.J. The influence of biochar particle size and concentration on bulk density and maximum water holding capacity of sandy vs sandy loam soil in a column experiment. Geoderma 2019, 347, 194–202. [Google Scholar] [CrossRef]
  39. Duarte, S.D.; Glaser, B.; Cerri, C.E.P. Effect of Biochar Particle Size on Physical, Hydrological and Chemical Properties of Loamy and Sandy Tropical Soils. Agronomy 2019, 9, 165. [Google Scholar] [CrossRef] [Green Version]
  40. Glaser, B.; Lehmann, J.; Zech, W. Ameliorating physical and chemical properties of highly weathered soils in the tropics with charcoal—A review. Biol. Fertil. Soils 2002, 35, 219–230. [Google Scholar] [CrossRef]
  41. Moraes, M.T.; Debiasi, H.; Carlesso, R.; Franchini, J.C.; Silva, V.R.; Luz, F.B. Age-hardening phenomena in an oxisol from the subtropical region of Brazil. Soil Till. Res. 2017, 170, 27–37. [Google Scholar] [CrossRef]
  42. Reichert, J.M.; Rosa, V.T.; Vogelmann, E.S.; Rosa, D.P.; Horn, R.; Reinert, D.J.; Sattler, A.; Denardin, J.E. Conceptual framework for capacity and intensity physical soil properties affected by short and long-term (14 years) continuous no-tillage and controlled traffic. Soil Till. Res. 2016, 158, 123–136. [Google Scholar] [CrossRef] [Green Version]
  43. Bonetti, J.A.; Anghinoni, I.; Moraes, M.T.; Fink, J.R. Resilience of soils with different texture, mineralogy and organic matter under long-term conservation systems. Soil Till. Res. 2017, 174, 104–112. [Google Scholar] [CrossRef]
  44. Dexter, A.R.; Horn, R.; Kemper, W.D. Two mechanisms for age-hardening of soil. J. Soil Sci. 1988, 39, 163–175. [Google Scholar] [CrossRef]
  45. Horn, R. Time dependence of soil mechanical properties and pore functions for arable soils. Soil Sci. Soc. Am. J. 2004, 68, 1131–1137. [Google Scholar] [CrossRef]
  46. Downie, A.; Munroe, P.; Crosky, A. Characteristics of Biochar—Physical and Structural Properties. In Biochar for Environmental Management: Science and Technology, 1st ed.; Lehmann, J., Joseph, S., Eds.; Earthscan: New York, NY, USA, 2009; pp. 13–29. [Google Scholar]
  47. Herath, H.M.S.K.; Camps-Arbestain, M.; Hedley, M. Effect of biochar on soil physical properties in two contrasting soils: An Alfisol and an Andisol. Geoderma 2013, 209–210, 188–197. [Google Scholar] [CrossRef]
  48. Ulyett, J.; Sakrabani, R.; Kibblewhite, M.; Hann, M. Impact of biochar addition on water retention, nitrification and carbon dioxide evolution from two sandy loam soils. Eur. J. Soil Sci. 2014, 65, 96–104. [Google Scholar] [CrossRef]
  49. Hardie, M.; Clothier, B.; Bound, S.; Oliver, G.; Close, D. Does biochar influence soil physical properties and soil water availability? Plant Soil 2014, 376, 347–361. [Google Scholar] [CrossRef]
  50. Barnes, R.T.; Gallagher, M.E.; Masiello, C.A.; Liu, Z.L.; Dugan, B. Biochar-Induced Changes in Soil Hydraulic Conductivity and Dissolved Nutrient Fluxes Constrained by Laboratory Experiments. PLoS ONE 2014, 9, e108340. [Google Scholar] [CrossRef] [PubMed] [Green Version]
  51. Petersen, C.T.; Hansen, E.; Larsen, H.H.; Hansen, L.V.; Ahrenfeldt, J.; Hauggaard-Nielsen, H. Pore-size distribution and compressibility of coarse sandy subsoil with added biochar. Eur. J. Soil Sci. 2016, 67, 726–736. [Google Scholar] [CrossRef] [Green Version]
  52. Peake, L.R.; Reid, B.J.; Tang, X.Y. Quantifying the influence of biochar on the physical and hydrological properties of dissimilar soils. Geoderma 2014, 235, 182–190. [Google Scholar] [CrossRef]
  53. Jeffery, S.; Meinders, M.B.J.; Stoof, C.R.; Bezemer, T.M.; van de Voorde, T.F.J.; Mommer, L.; van Groenigen, J.W. Biochar application does not improve the soil hydrological function of a sandy soil. Geoderma 2015, 251, 47–54. [Google Scholar] [CrossRef]
  54. Ajayi, A.E.; Holthusen, D.; Horn, R. Changes in microstructural behaviour and hydraulic functions of biochar amended soils. Soil Till. Res. 2016, 155, 166–175. [Google Scholar] [CrossRef]
  55. Kinney, T.J.; Masiello, C.A.; Dugan, B.; Hockaday, W.C.; Dean, M.R.; Zygourakis, K.; Barnes, R.T. Hydrologic properties of biochars produced at different temperatures. Biomass Bioenerg. 2012, 41, 34–43. [Google Scholar] [CrossRef]
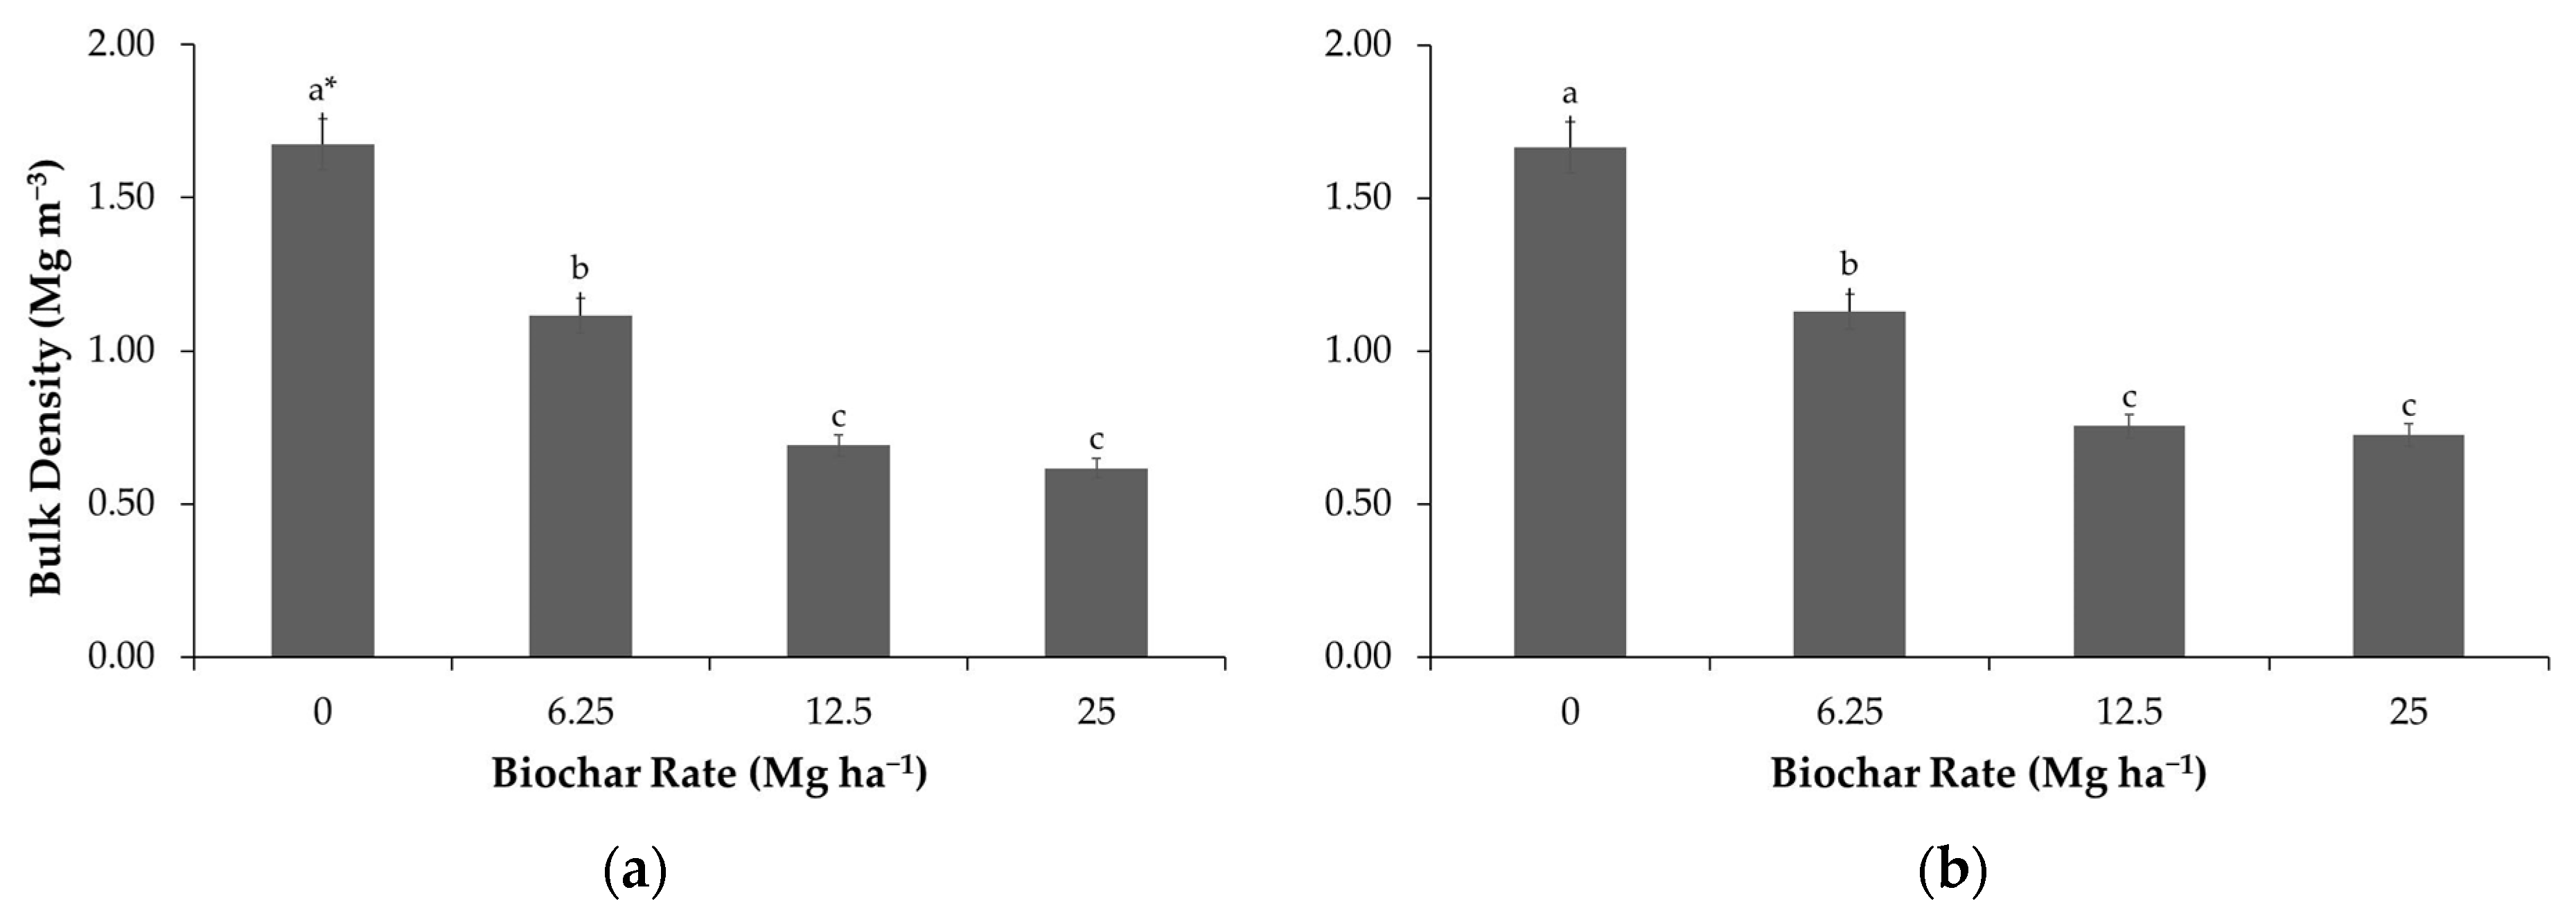
Figure 1. Soil bulk density as a function of biochar rates (0, 6.25, 12.5, and 25 Mg ha−1) evaluated at (a) 50 days and (b) 150 days after incorporation in soil. * Means followed by the same letter did not differ according to Tukey’s test (p < 0.05).
Agriculture 10 00062 g001
Figure 2. Average water retention curves for biochar rates (0, 6.25, 12.5, and 25 Mg ha−1) evaluated at (a) 50 days and (b) 150 days after incorporation in soil. n = 4.
Agriculture 10 00062 g002
Figure 3. Available water content in the soil for biochar rates (0, 6.25, 12.5 and 25 Mg ha−1) evaluated at (a) 50 days and (b) 150 days after incorporation in soil. Bars represent the standard error. n = 4.
Agriculture 10 00062 g003
Figure 4. Soil pores size distribution as a function biochar rates (0, 6.25, 12.5, and 25 Mg ha−1) evaluated at (a) 50 days and (b) 150 days after incorporation in soil. n = 4. Different letters on the bars indicate significant differences among treatments according to Tukey’s test (p < 0.05).
Agriculture 10 00062 g004
Figure 5. Soil Water Storage Capacity (SWSC) and Soil Air Content (SAC) indexes for biochar rates (0, 6.25, 12.5, and 25 Mg ha−1) evaluated at (a) 50 days and (b) 150 days after incorporation in soil. Dashed red lines indicate the critical limit of water and air storage ratio to root growth (ideal ratio = SAC: 0.33 and SWSC: 0.66, as proposed by Reynolds et al. [35]).
Agriculture 10 00062 g005
Table 1. Physical and chemical properties of the biochar used in the experiment.
FeedstockPyrolysis Temperature
(°C)
Surface Area
(m2 g−1)
CNC:NpHCation Exchange Capacity
%
Miscanthus giganteus450371.964.40.878.45.920.1
Source: adapted from Rittl et al. [27].
Table 2. Adjustment parameters for the average Soil Water Retention Curves (SWRCs) of a sandy soil amended with different biochar rates, at two evaluation times.
Biochar Rate
(Mg ha−1)
SWRC Parameters
αmnθrθsr2
kPa−1 m3 m−3
50 days after biochar incorporation
00.2330.6012.5050.0820.3760.988
6.250.3240.3811.6150.0790.3760.996
12.50.2300.3931.6490.1100.3810.998
250.1910.3871.6300.1110.3510.998
150 days after biochar incorporation
00.1310.5682.3140.0620.3890.991
6.250.1610.5032.0130.1000.4280.993
12.50.1110.5592.2660.1250.5100.988
250.1190.5762.3570.1380.4640.992
Note: Adjustment parameters (α, m and n), Residual water content (θr), Saturated water content (θs), and Coefficient of determination for SWRC (r2). n = 4.