Article

Modelling the Impacts of Climate Change on Soybeans Water Use and Yields in Ogun-Ona River Basin, Nigeria

by
Oludare Sunday Durodola
1,2 and
Khaldoon A. Mourad
3,*
1
Pan African University Institute of Water and Energy Sciences, Abou Bekr Belkaid University of Tlemcen B.P. 119, Tlemcen 13000, Algeria
2
Land and Water Division, Food and Agriculture Organization of the United Nations, 00153 Rome, Italy
3
The Centre for Sustainable Visions and Lund University, 201, SE-22100 Lund, Sweden
*
Author to whom correspondence should be addressed.
Agriculture 2020, 10(12), 593; https://doi.org/10.3390/agriculture10120593
Submission received: 22 October 2020 / Revised: 23 November 2020 / Accepted: 30 November 2020 / Published: 1 December 2020

Abstract

:
African countries such as Nigeria are anticipated to be more susceptible to the impacts of climate change due to reliance on rainfed agriculture. In this regard, the impacts of climate change on crop water requirements (CWR), yields and crop water productivity (CWP) of soybean in the Ogun-Ona River Basin, Nigeria, were evaluated for the baseline period (1986–2015) and future period (2021–2099) under Representative Concentration Pathway (RCP) 4.5 and 8.5 scenarios using AquaCrop Version 6.1. Future climate projections from the Swedish Meteorological and Hydrological Institute’s climate models (HadGEM2-ES and RCA4) were used in simulating the future scenarios. The results show that for the baseline period, CWR and yield are increasing while CWP shows a slight increase. For the future period, the CWR is projected to fluctuate and depend on the rainfall pattern. Meanwhile, carbon dioxide fertilization has positive effects on yield and is projected to increase up to 40% under RCP 8.5. The results of this study certainly offer useful information on suitable adaption measures which could be implemented by stakeholders and policymakers to improve soybean productivity in Nigeria.

1. Introduction

Africa is projected to be more vulnerable to climate change impacts due to reliance on natural resources, the high level of climate variability, the vast rainfed agriculture, and the low institutional and economic capacity to manage and adapt to climate change [1,2,3]. The connection between agriculture and climate change is interwoven. It is predicted that agriculture will be greatly affected by climate change and agriculture will contribute to climate change. According to Food and Agriculture Organization (FAO), a 60% increase above the 2006 global food demand levels is expected by 2050 as a result of rapid population growth, increase in urbanization, as well as income growth [4]. Water use for agriculture amounts to about 70% of all water withdrawals from rivers, lakes, streams and aquifers [5]. However, water resources, which are the basis for food production are finite and currently under serious pressure. Despite this pressure, water resources need to meet up with current and future demands for agricultural, domestic and industrial uses.
The main biophysical processes involved in agricultural crop production such as evaporation from soils, transpiration from plants, nutrient cycles and growth of plants are altered by climate change [6]. Thus, the climate is a vital factor in crop production and could directly influence crop productivity. Studies have shown that climate change will affect water and crop productivity differently depending on location, crops and climatic zone [6,7,8,9,10,11,12,13]. While some crops will benefit, other crops will be affected negatively [7]. Some crops will perform optimally with hotter temperatures and long growing seasons [5]. However, studies have shown that the negative effects might exceed the positive effects across different locations [8,9,10,11,12,13]. The interaction among water, food and climate change shows that it is important to examine the impacts of climate change on water and crop productivity. Meanwhile, one of the means of examining these impacts is through the use of crop models coupled with future climate projections. Recently, crop modelling and crop model applications have gained more interest in examining the impacts of climate change on water and crop productivity. Due to the threats of climate change on agricultural water use and other demanding uses, simulation models have been found to be significant tools in evaluating the water needs of crops [9,10,11,12,13,14,15]. These models are developed to estimate crop growth, development, yield, water use efficiency, water consumption and irrigation schedules under different climatic conditions, soil textures, field management, conservation practices and soil fertility.
Several studies in Nigeria have shown that the increase in temperature will affect water and crop productivity [9,16,17,18,19,20]. The predicted changes in temperature, consecutive dry and wet days will likely have huge impacts on water and crop productivity in Ogun-Ona River Basin and Nigeria at large. Crop development, water requirements and growth are highly dependent on the number of consecutive dry and wet days. Most agricultural production in Nigeria depends on rainfall. Therefore, significant changes in rainfall patterns, the number of consecutive dry and wet days will greatly impact crop production and might lead to food insecurity if proper and urgent actions are not taken. Crop water requirement (CWR) is the total amount of water that crops need for growth throughout the season [21,22,23]. In addition, there are uncertainties in future crop yield and crop water productivity (CWP). Yield is the harvestable quantity of crops [24] and CWP is the ratio of crop yield to the quantity of water consumed by the crop during a growing season [24]. Hence, it is important to examine the impact of climate change on water and crop productivity due to the fact that the impacts of climate change vary across locations and activities.
Soybean is one of the common staple foods grown in Nigeria. Soybean is a profitable crop that is grown in all parts of Nigeria but predominant in the sub-humid and savannah agro-ecological zones which cover the Ogun-Ona River Basin [9]. Nigeria and South Africa are the two leading African countries in the production of soybean and responsible for 29% and 40% of total African production respectively [25]. Soybean production is expected to rise due to population growth, an increase in food demand and a shift in food consumption. Currently, there is an increased demand for soybean globally and production is expected to double by 2050 compared to the rate of production in 2010. Soybean is a typical C3 plant. C3 plants are the type of plants that their first products of photosynthesis give a 3-carbon compound i.e., phosphoglyceric acid (PGA). Other features of C3 plants are that the optimal temperature required for photosynthesis is really low, photorespiration rate is high, the plants perform more efficiently when the temperature decreases and CO2 fixation is really low in C3 plants [26]. Additionally, soybean is highly sensitive to changes in climate and soil properties [27]. Also, Kumagai et al. [28] found that the plasticity of biomass and pod production at a low planting density reveals suitable parameters to maximize soybean yield under elevated atmospheric carbon dioxide (eCO2).
In Ogun-Ona River Basin, soybean is predominantly cultivated under rainfed agriculture which means that irregularities in rainfall pattern and rise in temperature can cause water stress for crops and significantly affect yields and water requirements. Soybean has been reported to be highly sensitive to climate change [25]. Just as other crops, there are a lot of uncertainties on the responses of soybean to rise in temperature, changes in rainfall patterns and an increase in atmospheric CO2 concentration. However, there are some studies that have been carried out to predict this phenomenon. A significant increase in soybean yield was projected in Cameroon when simulated with a process-based crop model (CropSyst) coupled with two global climate models (GCMs) under different climate change scenarios [29]. The growing season of soybean is also projected to shorten by 2 days to 23 days [29]. Similarly, studies have shown that due to carbon fertilization of C3 plants such as soybean, there are tendencies that crop yield might increase especially under extremely high atmospheric CO2 concentration [13]. In contrast to the projected yield increase by [13], soybean yield is predicted to reduce when simulated based on global climate models [25]. Still, there are several uncertainties regarding soybean water and crop productivity globally.
Since rainfed soybean production is predominant in Ogun-Ona River Basin, it is becoming increasingly difficult to grow it as climate change impacts on agriculture intensifies. However, will soybean perform optimally under various climate change scenarios in Ogun-Ona River Basin? With the current growing water demands and the threats of climate change, how will soybean behave under a changing climate? What will be the future water requirements of this crop? Will soybean yields increase or decrease? These uncertainties pose great challenges to crop productivity, irrigation and water allocation for agriculture. In order to provide more clarity, it is imperative to conduct more studies to examine how soybean will respond to various locations since the impact of climate change is spatially distributed. Therefore, this study seeks to:
(1)
Estimate the seasonal CWR, yield and CWP of soybean during the baseline period (1986–2015) within the study area based on different soil textures.
(2)
Simulate the future seasonal CWR, yield and CWP of soybean for various soil textures under different climate change scenarios (2021–2099).
(3)
Compare the future seasonal CWR, yield and CWP of soybean for various soil textures to the baseline period under different climate change scenarios.

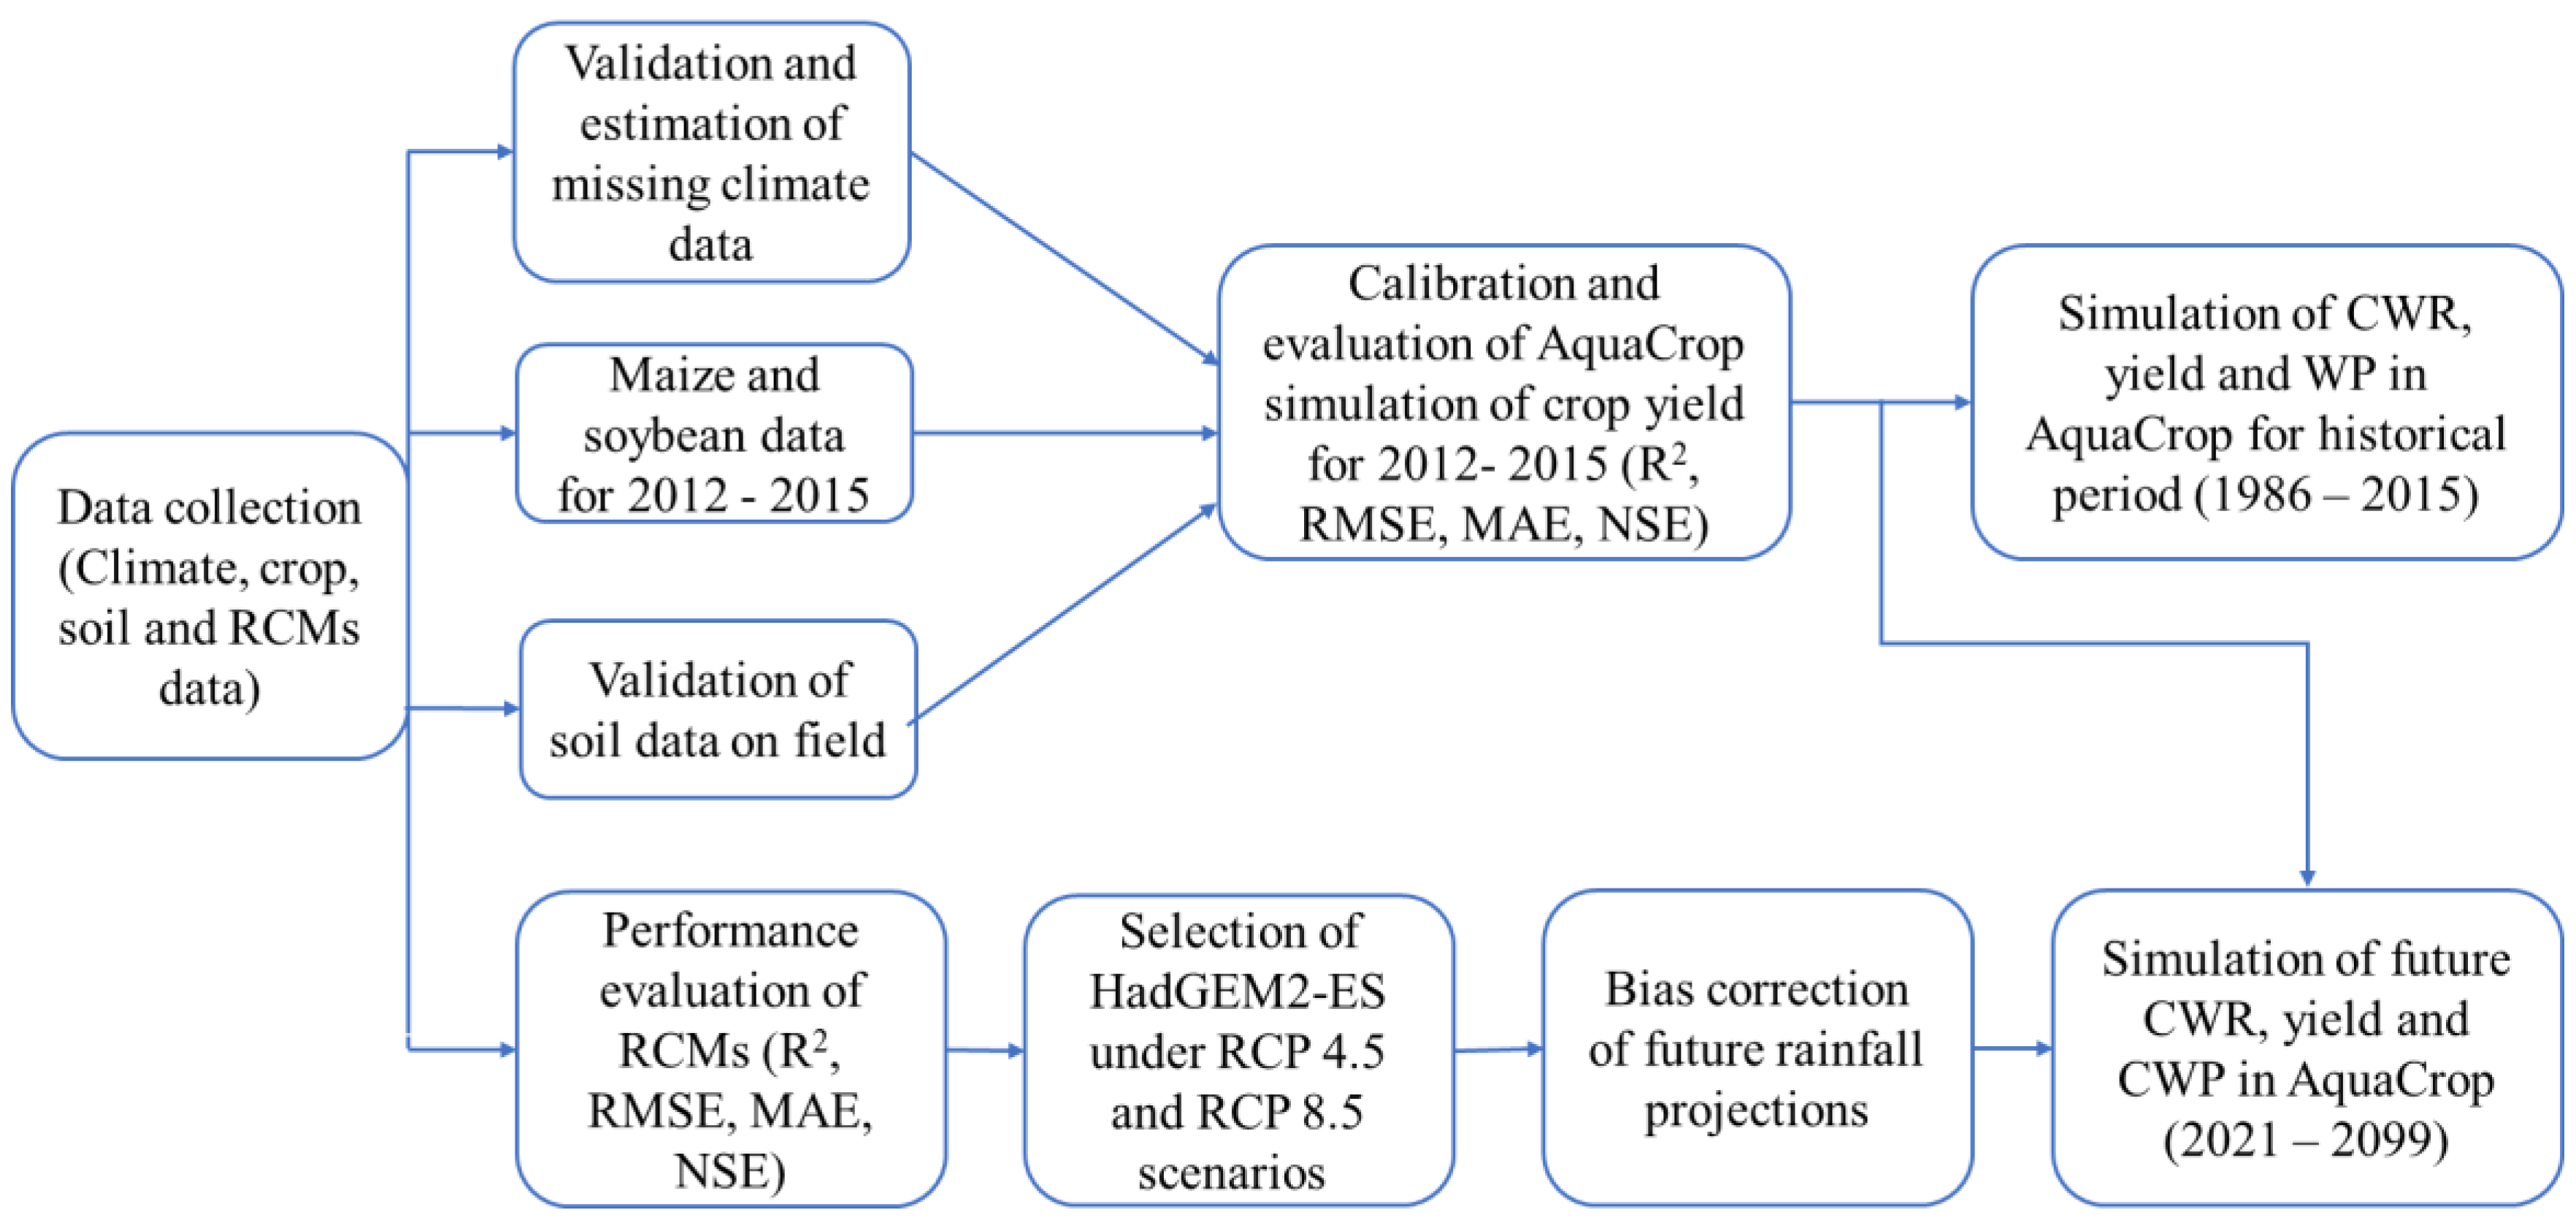
2. Materials and Methods
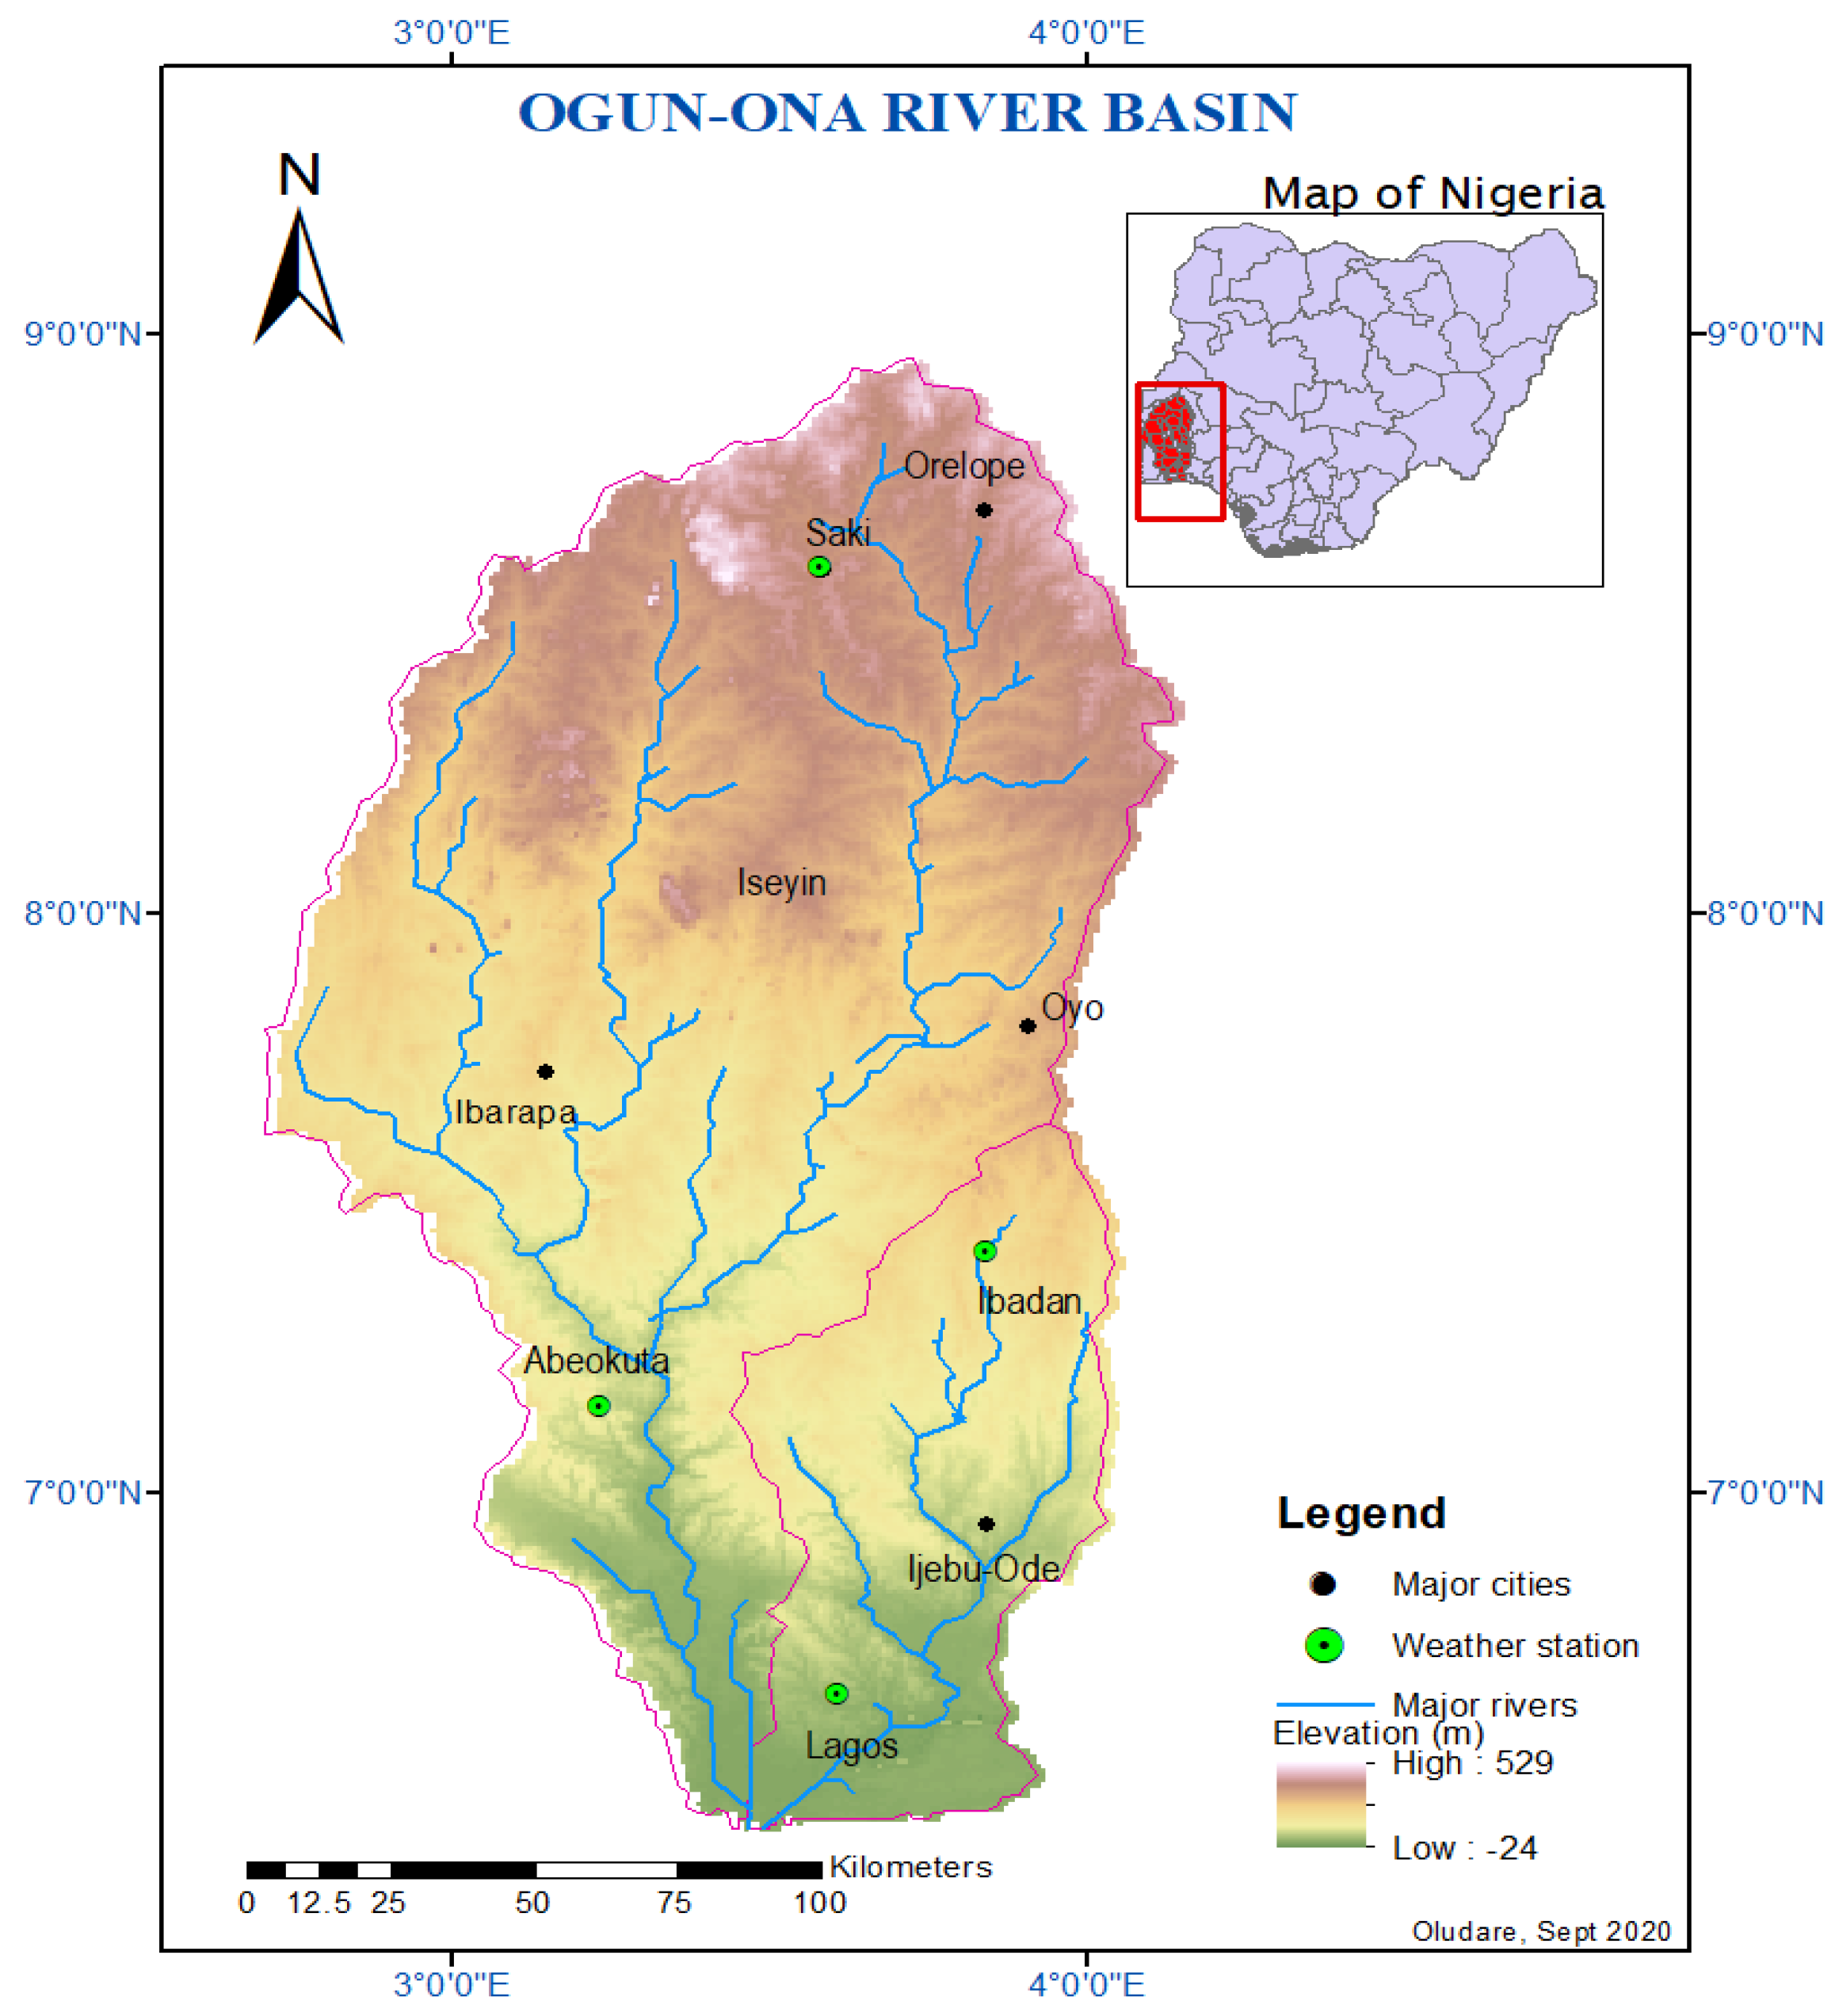
Figure 1 presents the flowchart of the methodology and describes how the study was carried out.

2.1. The Study Area

The study area of this research is the Ogun-Ona River Basin located in the south-western region of Nigeria. The basin is located between latitude 6°33′–9°00′ N and longitude 2°40′–4°00′ E, Figure 2, and covers about 29,040 km2. Ogun and Ona rivers, from which the basin derives its name, are the major rivers in the basin. This basin is a sub-basin of the Ogun-Osun River Basin within the jurisdiction of the Ogun-Osun River Basin Authority. The study area is located in the derived savannah agro-ecological zone of the country which is characterized by tropical climate as well as wet and dry seasons. The temperature of the region ranges from 21 °C to 34 °C and average rainfall is 1340 mm between March and September. This region is largely agrarian, and the population heavily depends on agriculture as the source of income.

2.2. AquaCrop

AquaCrop is a crop water productivity model used with decision support systems. The model was developed by the Land and Water Division of the Food and Agriculture Organization (FAO) [24,30]. This model is user-friendly, not complex and requires relatively few parameters for calibration compared to other crop models [31]. The parameters describe the soil, crop and atmosphere interactions that are highly crucial for crop growth. AquaCrop Version 6.1 which is the latest version of the model was used in this study. The model was selected based on the following:
(1)
Process-based crop models such as AquaCrop are superior to the statistical crop models especially in the assessment of the impact of climate change on crop growth, yields, and water requirements [10].
(2)
AquaCrop simulates crop growth based on a water-driven mechanism which is more suitable for climate change studies because it normalizes the water productivity for evaporation and carbon (iv) oxide concentration [24,26,30].
(3)
AquaCrop has been widely used and validated in various climatic conditions for the assessment of climate change impacts on crop growth, development and water requirements with reliable outputs.
(4)
The algorithms and equations are well documented [24,26,30,31].
Based on these points, the model fits into the objectives and scope of this study.

2.2.1. Evapotranspiration, Crop Yield and Water Productivity

Reference evapotranspiration (ET0) is estimated in AquaCrop from inputted climate data using the Penman-Monteith equation [32] which has been reported as the most effective method of estimating evapotranspiration [33]. CWR is estimated in the model as given in Equation (1).
E T c = K c × E T 0
K c = Crop coefficient, describes the impacts of crop height, crop cover, canopy resistance, and soil evaporation. The value differs throughout the growing season; E T c = Crop evapotranspiration (mm/day).
In terms of calculating crop yield, AquaCrop uses the multiplication of biomass and harvest index as given in Equation (2) [24,34].
Y = H I   × B
where: Y = Crop yield (kg/ha or t/ha), HI = Harvest index (fraction or percent), B = Biomass (t/ha or kg/ha).
In the model, daily transpiration is calculated by multiplying the crop coefficient with ET0 and soil coefficient as given by [30] in Equation (3).
T r = K s ( K c T r . x × C C * ) E T 0
where Tr = Crop transpiration (mm/day), Ks = stress factor (Kssto or Ksaer) (fraction), CC * = adjusted green canopy cover (fraction), K c T r . x   × C C * = crop coefficient.
In estimating yield, the model automatically adjusts the harvest index to respond to temperature changes and water stress conditions which is very crucial for this study. The daily biomass production in the model is estimated as given by [30] in Equation (4).
B = K s b × W P * ×   T r E T 0
where B = daily aboveground biomass (t/ha or kg/m2), Tr = daily crop transpiration (mm/day), ET0 = daily reference evapotranspiration (mm/day), WP* = water productivity of the crop variety normalized for atmospheric CO2 concentration levels and evaporation (kg/m3), Ksb = Cold temperature stress factor for biomass (fraction).
In AquaCrop, the modification coefficient for the atmospheric CO2 concentration is estimated by using Equation (5) for the normalization of CO2 concentration which is essential for normalizing water productivity [24,30].
f C O 2 = ( C a C a , 0 ) 1 + 0.000318 × ( C a C a , 0 )
where f C O 2 = Modification coefficient for CO2 (dimensionless), Ca = Atmospheric CO2 (µL/L), C a , 0 = Baseline CO2 recorded in 2000 at Mauna Loa Observatory Centre, Hawaii which is 369.47 µL/L.
Meanwhile, CWP is the ratio of crop yield to the quantity of water consumed by the crop during a growing season, Equation (6) [9,31].
C W P =   Y i e l d E T a   × 100
CWP = crop water productivity in kg/m3, Yield in t/ha and ETa in mm/season. ETa accounts for water that is consumed and, in the model, it consists of soil evaporation and plant transpiration. The unit conversion factor is 100.
In addition, when it rains, not all rainwater is available for crops. Some water losses occur through runoff and deep percolation. The amount of water from rainfall available for crops within the crop root zone after loses is known as effective rainfall. In AquaCrop, the United States Department for Agriculture (USDA, Washington, DC, USA) Soil Conservation method is used to estimate the effective rainfall so as to consider water loss through runoff and deep percolation which are components of water balance. The formulas are given in Equations (7) and (8).
P e f f = [ P d e c × ( 125 0.6 × P d e c ) 125 ]   for P d e c     250 / 3   mm
P e f f = ( 125 3 ) + 0.1 × P d e c for   P d e c   >   250 / 3   mm
where P e f f = Effective rainfall (mm/day), and Pdec = 10-day rainfall (mm/decadal).

2.2.2. Soil Water Balance

Soil water balance is an integral component of AquaCrop since the model operates on a water-driven mechanism with the biomass production linked with transpiration. The model simulates soil water balance on a daily basis by adjusting the soil water content throughout a given soil profile [30]. In order to cater for the fluctuations in soil water content such as incoming water fluxes (rainfall irrigation and capillary rise) and outgoing water fluxes (evaporation, runoff, transpiration and deep percolation), the root zone of the soil is regarded as a reservoir [30]. Drainage and infiltration within the root zone are simulated by a series of equations in terms of the dependent variable (θ) through a unitless drainage factor usually obtained from Ksat [24]. It is also possible to consider groundwater movement in soil water balance in areas where there is a shallow groundwater table to the root zone.

2.3. Data Collection
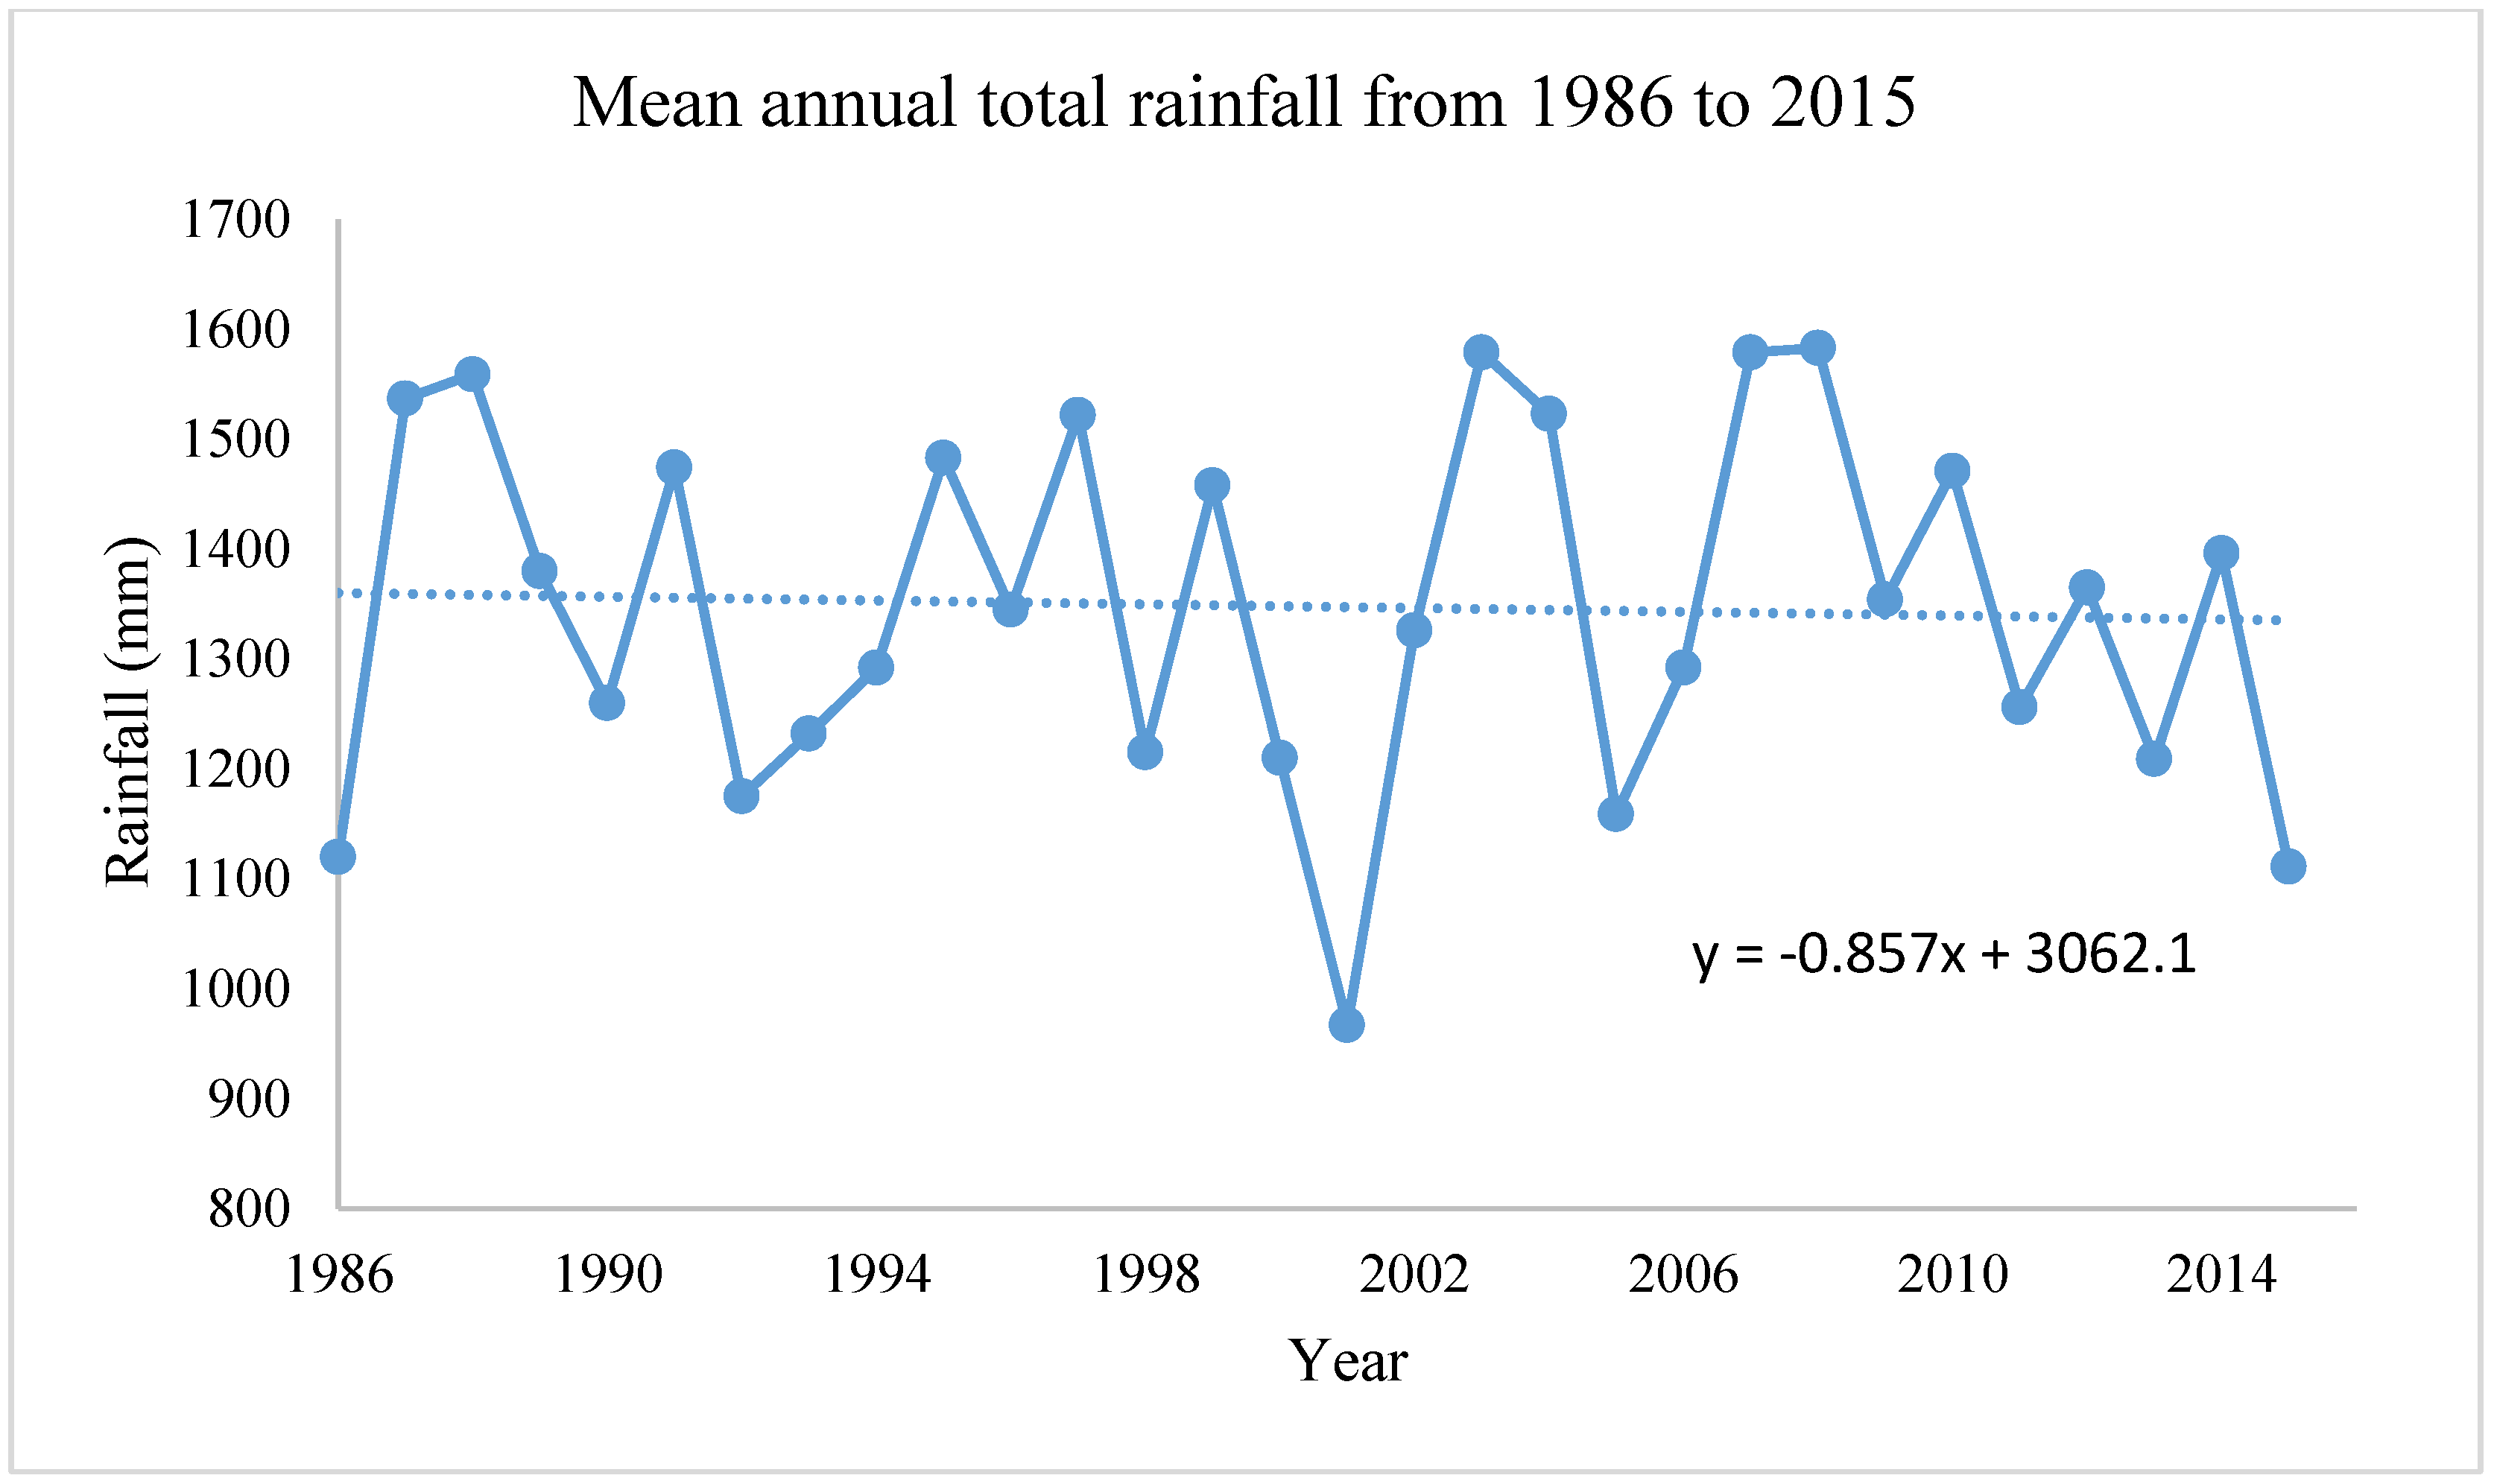
2.3.1. Climate Data

The climate data from 1976–2015 (40 years) of the basin were acquired from the Nigerian Meteorological Agency (NIMET). The datasets of 1976–1985 (10 years) were only daily rainfall, maximum and minimum temperatures used for climate model evaluation while the datasets of 1986–2015 (30 years) were daily rainfall, maximum and minimum temperatures, relative humidity, wind speed and solar radiation used for historical simulations. The mean monthly values and trend of the climatic parameters from 1986–2015 are shown in Table A1, Figure A1 and Figure A2 in Annex. The figures reveal that the rainy season starts from April to July before a short dry period in August known as August break. The peak is around June, July and September with around 200 mm while the lowest rainfall is usually in January and December with less than 10 mm. Meanwhile, the annual mean temperature of the basin is 26.7 °C. The months of February and March are usually the hottest periods with a maximum temperature of 34.8 °C and 34.4 °C, respectively.

2.3.2. Soil Data

Soil physical and chemical properties of the basin were obtained from the Harmonised World Soil Database (HWSD) which has a resolution of 1 km (30 arcs second). The data was downloaded from the FAO website (http://www.fao.org/soils-portal/soil-survey/soil-maps-and-databases) [35]. The soil in the basin is dominantly Ferric Luvisols and Lithosols [36]. The textures of the agricultural soils (0–100 cm) are predominantly sandy loam, loamy sand and sandy clay loam. The soil data was validated with data obtained from the Ogun-Osun River Bain Authority and field experiments. Thereafter, the percentages of sand, silt and clay particles were used to obtain the hydrological properties such as permanent wilting point (PWP), field capacity (FC), saturation (SAT), total available water (TAW) and hydraulic conductivity (Ksat) using SPAW model (Version 6.02) (https://hrsl.ba.ars.usda.gov/soilwater/index.htm) which is a soil water properties model previously employed by [9,11,37]. The soil properties used for calibration and modeling are given in Table 1.

2.3.3. Crop Data

Four years of experimental crop data (2012–2015) were obtained from the Agricultural Development Programme (ADP). The data which contains crop parameters from different soil textures were obtained during experiments and farming seasons that were done in various locations within the basin. The information reveals the planting spacing of soybean spacing was 25 cm and 65 cm intra and inter-row spacing, respectively. The variety of soybean used in experiments was TGX 1448-2E. The data for 2012 and 2013 growing seasons were used for calibration while validation was done using data for 2014 and 2015 growing seasons.

2.3.4. Future Climate Projections

The future climate data were obtained from the Coordinated Regional Downscaling Experiment (CORDEX) project and downloaded from the Earth System Grid Federation server (https://esgf-index1.ceda.ac.uk/search/cordex-ceda/). In the CORDEX project, multiple GCMs have been downscaled using different regional climate models (RCMs) to regional levels including Africa. The CORDEX-Africa datasets are available in daily, 10-day and monthly periods at a spatial resolution of 0.44° × 0.44° which is approximately 50 km × 50 km for the period of 1951–2005 (historical) and 2006–2099 (future). Based on an extensive literature review, the Rossby Centre Regional Climate Model (RCA4), which is one of the RCMs developed by the Swedish Meteorological and Hydrological Institute (SMHI) under nine GCMs in CORDEX-Africa, was selected. RCA4 has been assessed with highly satisfactory results in some studies [38,39]. MOHC-HadGEM2-ES under RCA4 can effectively capture the future climate of West Africa with satisfactory results [38]. In addition, the projections of MOHC-HadGEM2-ES under RCA4 for Ogun-Osun River Basin (where the study area is located) performed satisfactorily when compared with other models [9]. Hence, MOHC-HadGEM2-ES under RCA4 was selected. MOHC-HadGEM2-ES datasets were evaluated with the historical dataset of the study area. Climate models simulate climate parameters at each grid point depending on its resolution. Historical daily rainfall, minimum and maximum temperatures of the basin simulated by the RCM for 1976–2005 (30 years) were downloaded for evaluation with the observed data.

2.4. Performance Evaluation and Bias Correction of Future Climate Model

In order to access the performance and ability of the climate model to capture the observed data, four statistical indicators which are coefficient of determination (R2), root mean square error (RMSE), mean absolute error (MAE) and Nash-Sutcliffe modeling efficiency (NSE) were employed. R2 is a dimensionless indicator that expresses the fit between observed and simulated values. It ranges from 0 to 1.0 for which a value of 1 shows a perfect fit between the observed and simulated values. RMSE is a measure of the entire and mean deviation between simulated and observed values. It has the unit of the parameter that is being simulated, which implies that the closer the value to zero, the better the performance of the model. MAE gives the mean of the deviation between simulated and observed values and has the unit of the parameter that is being simulated. The closer the value of MAE to zero, the better the performance of the model. NSE is a unitless coefficient that ranges from −∞ to 1 which measures the general deviation between simulated and observed values. An efficiency of 1.0 reveals a perfect match between simulated and observed values. The closer the efficiency is to 1.0, the better the performance of the model. When NSE is less than zero, it means that the observed mean is a better predictor.
The daily observed and simulated climatic data for the historical period of 1976–2005 were used for the evaluation. The results of the evaluation as given in Table 2 reveals that HadGEM2-ES downscaled by RCA4 performed satisfactorily. The negative value of NSE for rainfall depicts that the observed mean is a better predictor than the model. In order to correct this and improve the performance of the model, the rainfall dataset for HadGEM2-ES was bias-corrected.
The bias correction technique applied is Quantile Mapping (QM) with the gamma distribution model. The principle of the QM technique relies on adjusting the cumulative distribution functions (CDF) of the simulated historical GCM/RCM data based on observed historical data as given in Equation (9). This method matches the CDF of the simulated historical GCM data and the observed historical data together thereby correcting the bias (extremes, intensity and frequency) in the future GCM data [7]. It has been proved that the quality of RCM data and shape of CDF is improved through QM in previous studies [7,9,39,40]. QM also performed better than the change factor method that was tested in this study. Thus, daily historical observed and simulated rainfall data from 1976–2005 (30 years) were used to bias correct the future simulated data (2021–2099) through QM.
y = Fobs−1 (FRC(x)),
where y = bias-corrected future rainfall values, Fobs−1 = inverse of the CDF of the observed values, FRCM = CDF of the historical RCM data.
Hence, future daily rainfall (after bias correction), minimum and maximum temperatures of the basin obtained from HadGEM2-ES (GCM) and RCA4 (RCM) for the period of 2021–2099 under Representative Concentration Pathway (RCP) 4.5 and 8.5 scenarios under the CORDEX-Africa project was used.

2.5. Calibration and Validation of AquaCrop

In the AquaCrop model, the planting date window was calibrated between 1–15 June which is the usual planting period of soybean within the basin. The crop cycle of soybean in Nigeria is provided in Figure A3 for a better understanding of its phenology. All the calibrated parameters and values used are given in Table A2. The model was calibrated to automatically select a planting date based on the establishment of rainfall (cumulative rainfall at least 40 mm) within each year according to the inputted rainfall data and starts simulation on that date. This was done to emulate the planting styles of farmers within the study area who plants after the onset of rainfall within those planting periods. The initial soil conditions were set at field capacity since rainfed agriculture is simulated. Meanwhile, groundwater intrusion has not been established on agricultural fields within the basin, thus, groundwater was not considered [9,15]. Soil infertility and weak weed management are common within the study. Hence, the soil fertility and weed management functions were both calibrated as moderate. In the model, soil fertility is moderate when it has 60% of the potential biomass production which corresponds to a nitrogen rate of 60 kg/ha as shown in field experiments within the basin. Then, all the management files were set up as project files. Each field with similar soil texture and management practices were grouped into single units to form projects under the historical period (1986–2015) and future period (2021–2099).
In order to assess the performance of AquaCrop, the four years of experimental data obtained were evaluated through R2, RMSE, MAE and NSE. The results show that the simulated yields match well with the observed yields. The average simulated and average observed soybean yields are 2.71 and 2.69 t/ha respectively as shown in Table A3. Hence, satisfactory results obtained make the model reliable and suitable for both historical and future climate conditions of the basin. A preliminary sensitivity analysis was done on the physical soil properties and found out that the model is more sensitive to FC and PWP than other properties of the soil. Validation of water fluxes could not be done due to limited data but these validations have been done within the Ogun-Osun River Basin that AquaCrop performs satisfactorily in simulating water fluxes of soybean within the region [9].

3. Results

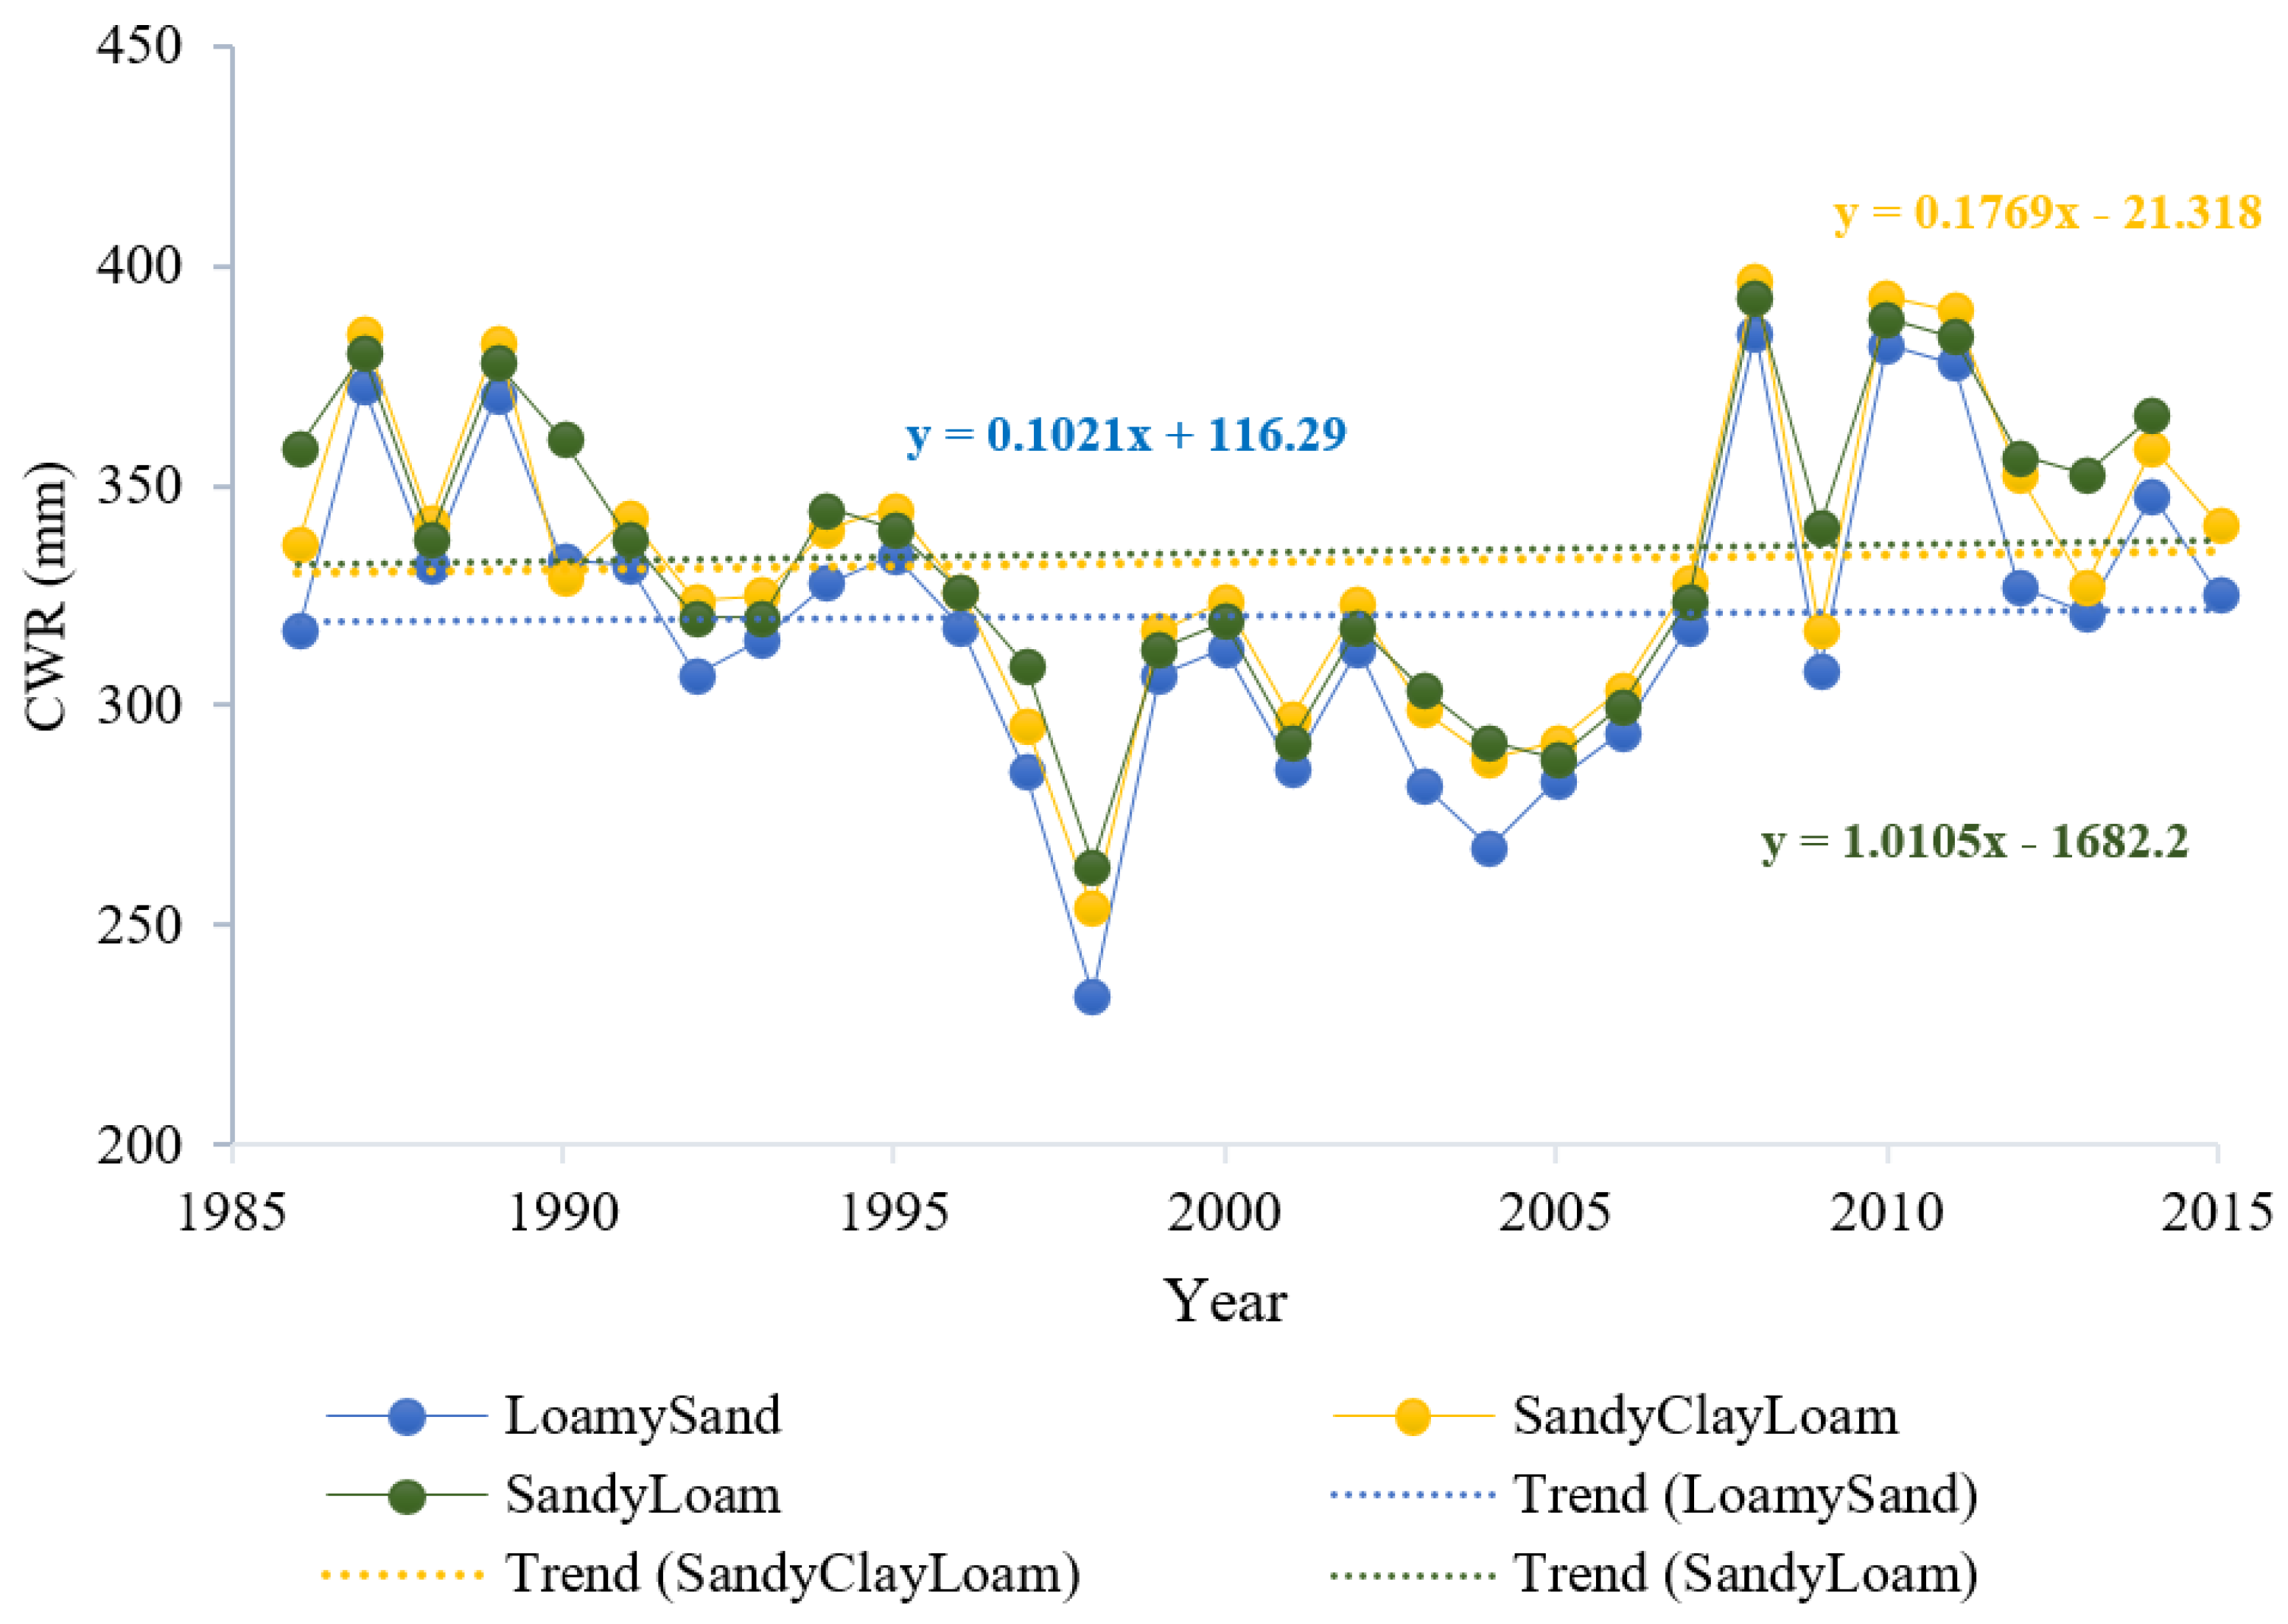
3.1. Temporal Distribution of CWR, Yield and CWP in the Past Decades

The CWR, yield and CWP of rainfed soybean were simulated from 1986–2015 (30 years) on the soil texture within the study area to estimate the changes in the trend of production and examine temporal variability of these parameters. CWR, yield, and CWP were averaged over all points with the same soil texture.

3.1.1. Temporal Distribution of Seasonal Crop Water Requirements (CWR)

According to Figure 3, soybean CWR on all the soil textures shows an upward surge. The trendlines show an increasing trend with the slope values 0.11, 0.18, and 1.01 mm/year on loamy sand, sandy clay loam and sandy loam soils respectively. Although, CWR was decreasing from 1986 to 2006, it later increased in 2007 up till 2015. From this study, climate change is causing an increasing trend in soybean CWR in the basin. CWR can be affected by rainfall variability, change in temperature and CO2 concentration. The analyses show that climate change through increased temperature and huge variability of rainfall within the basin is causing an increase in the CWR of soybean. It shows that soybean CWR is mostly affected by rainfall variability than all other factors. Furthermore, it shows that even though the temperature is increasing, and the growing season is reducing, still soybean CWR is increasing.

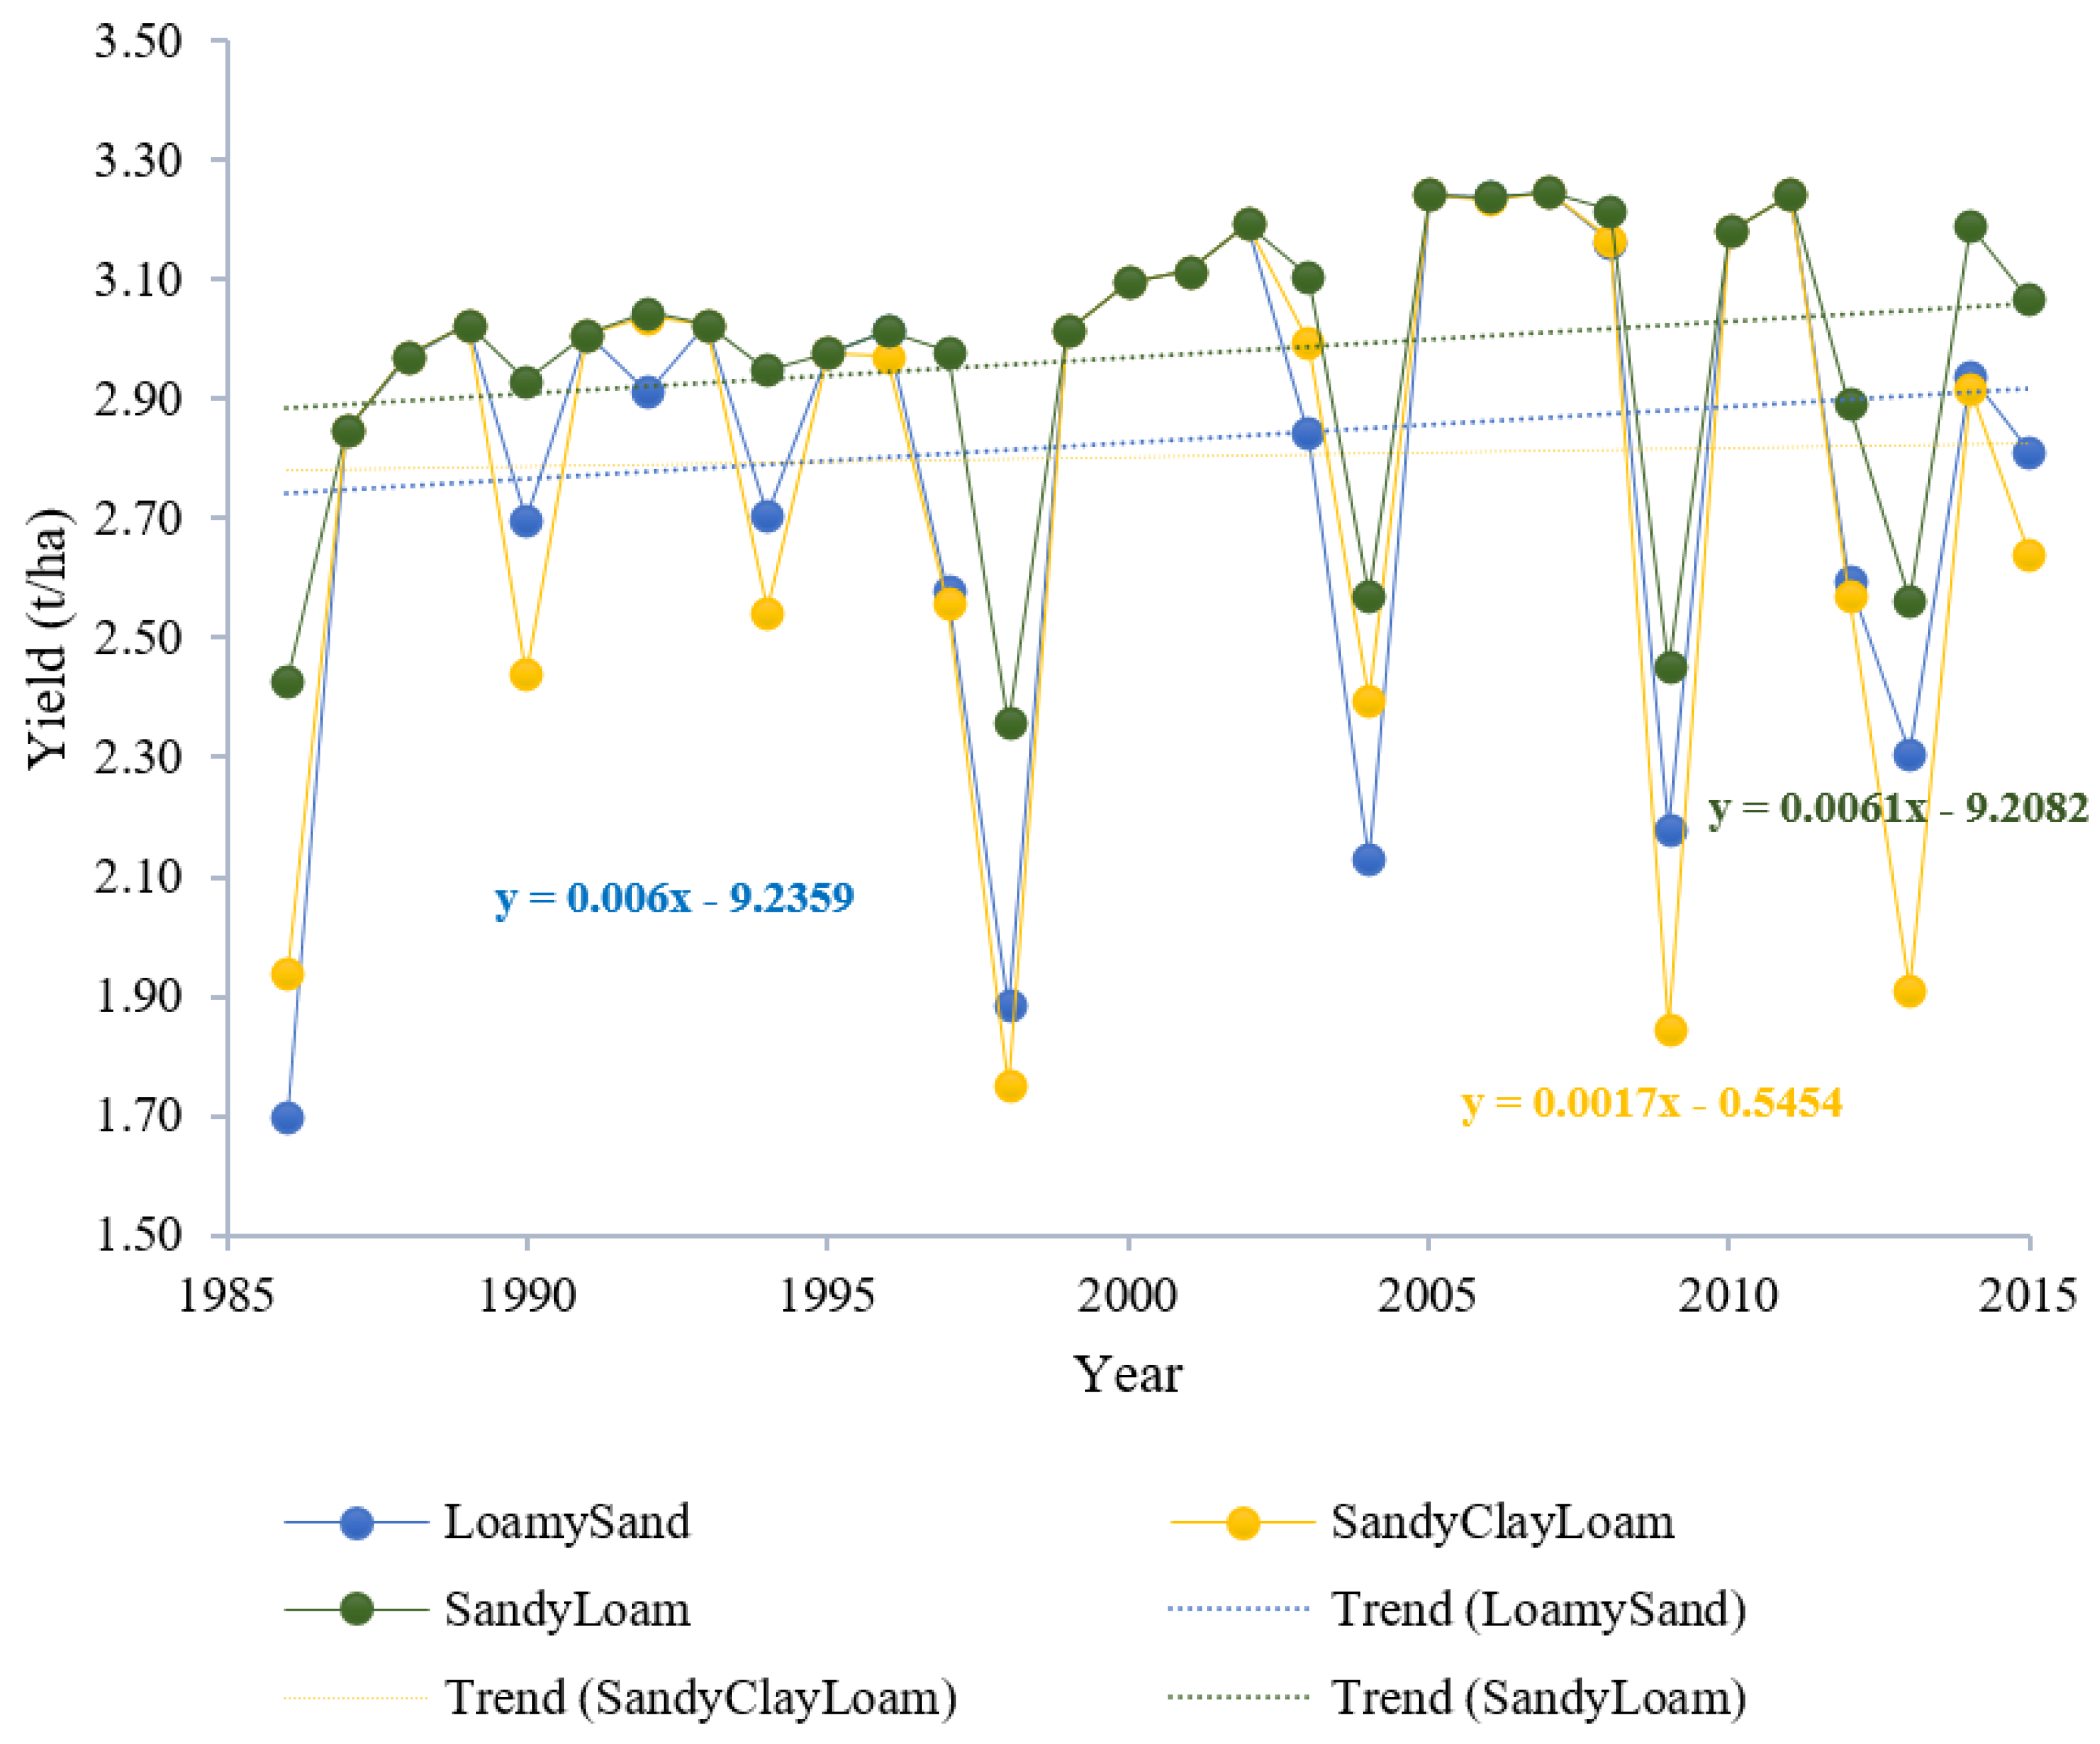
3.1.2. Temporal Distribution of Crop Yield

For yields, according to Figure 4, the trendlines show that there is an increase in yield across the years. The results show positive slopes of 0.006, 0.002 and 0.006 t/ha/year on loamy sand, sandy clay loam and sandy loam soils respectively. The increasing trend in soybean yield is attributable to CO2 fertilization [41] which has more influence than rainfall variability and increasing temperature. The seemingly positive effects of climate change on soybean yields show that while some crops are negatively affected, some crops are benefitting from climate change. Thus, within the basin, climate change has a positive impact on soybean yields.

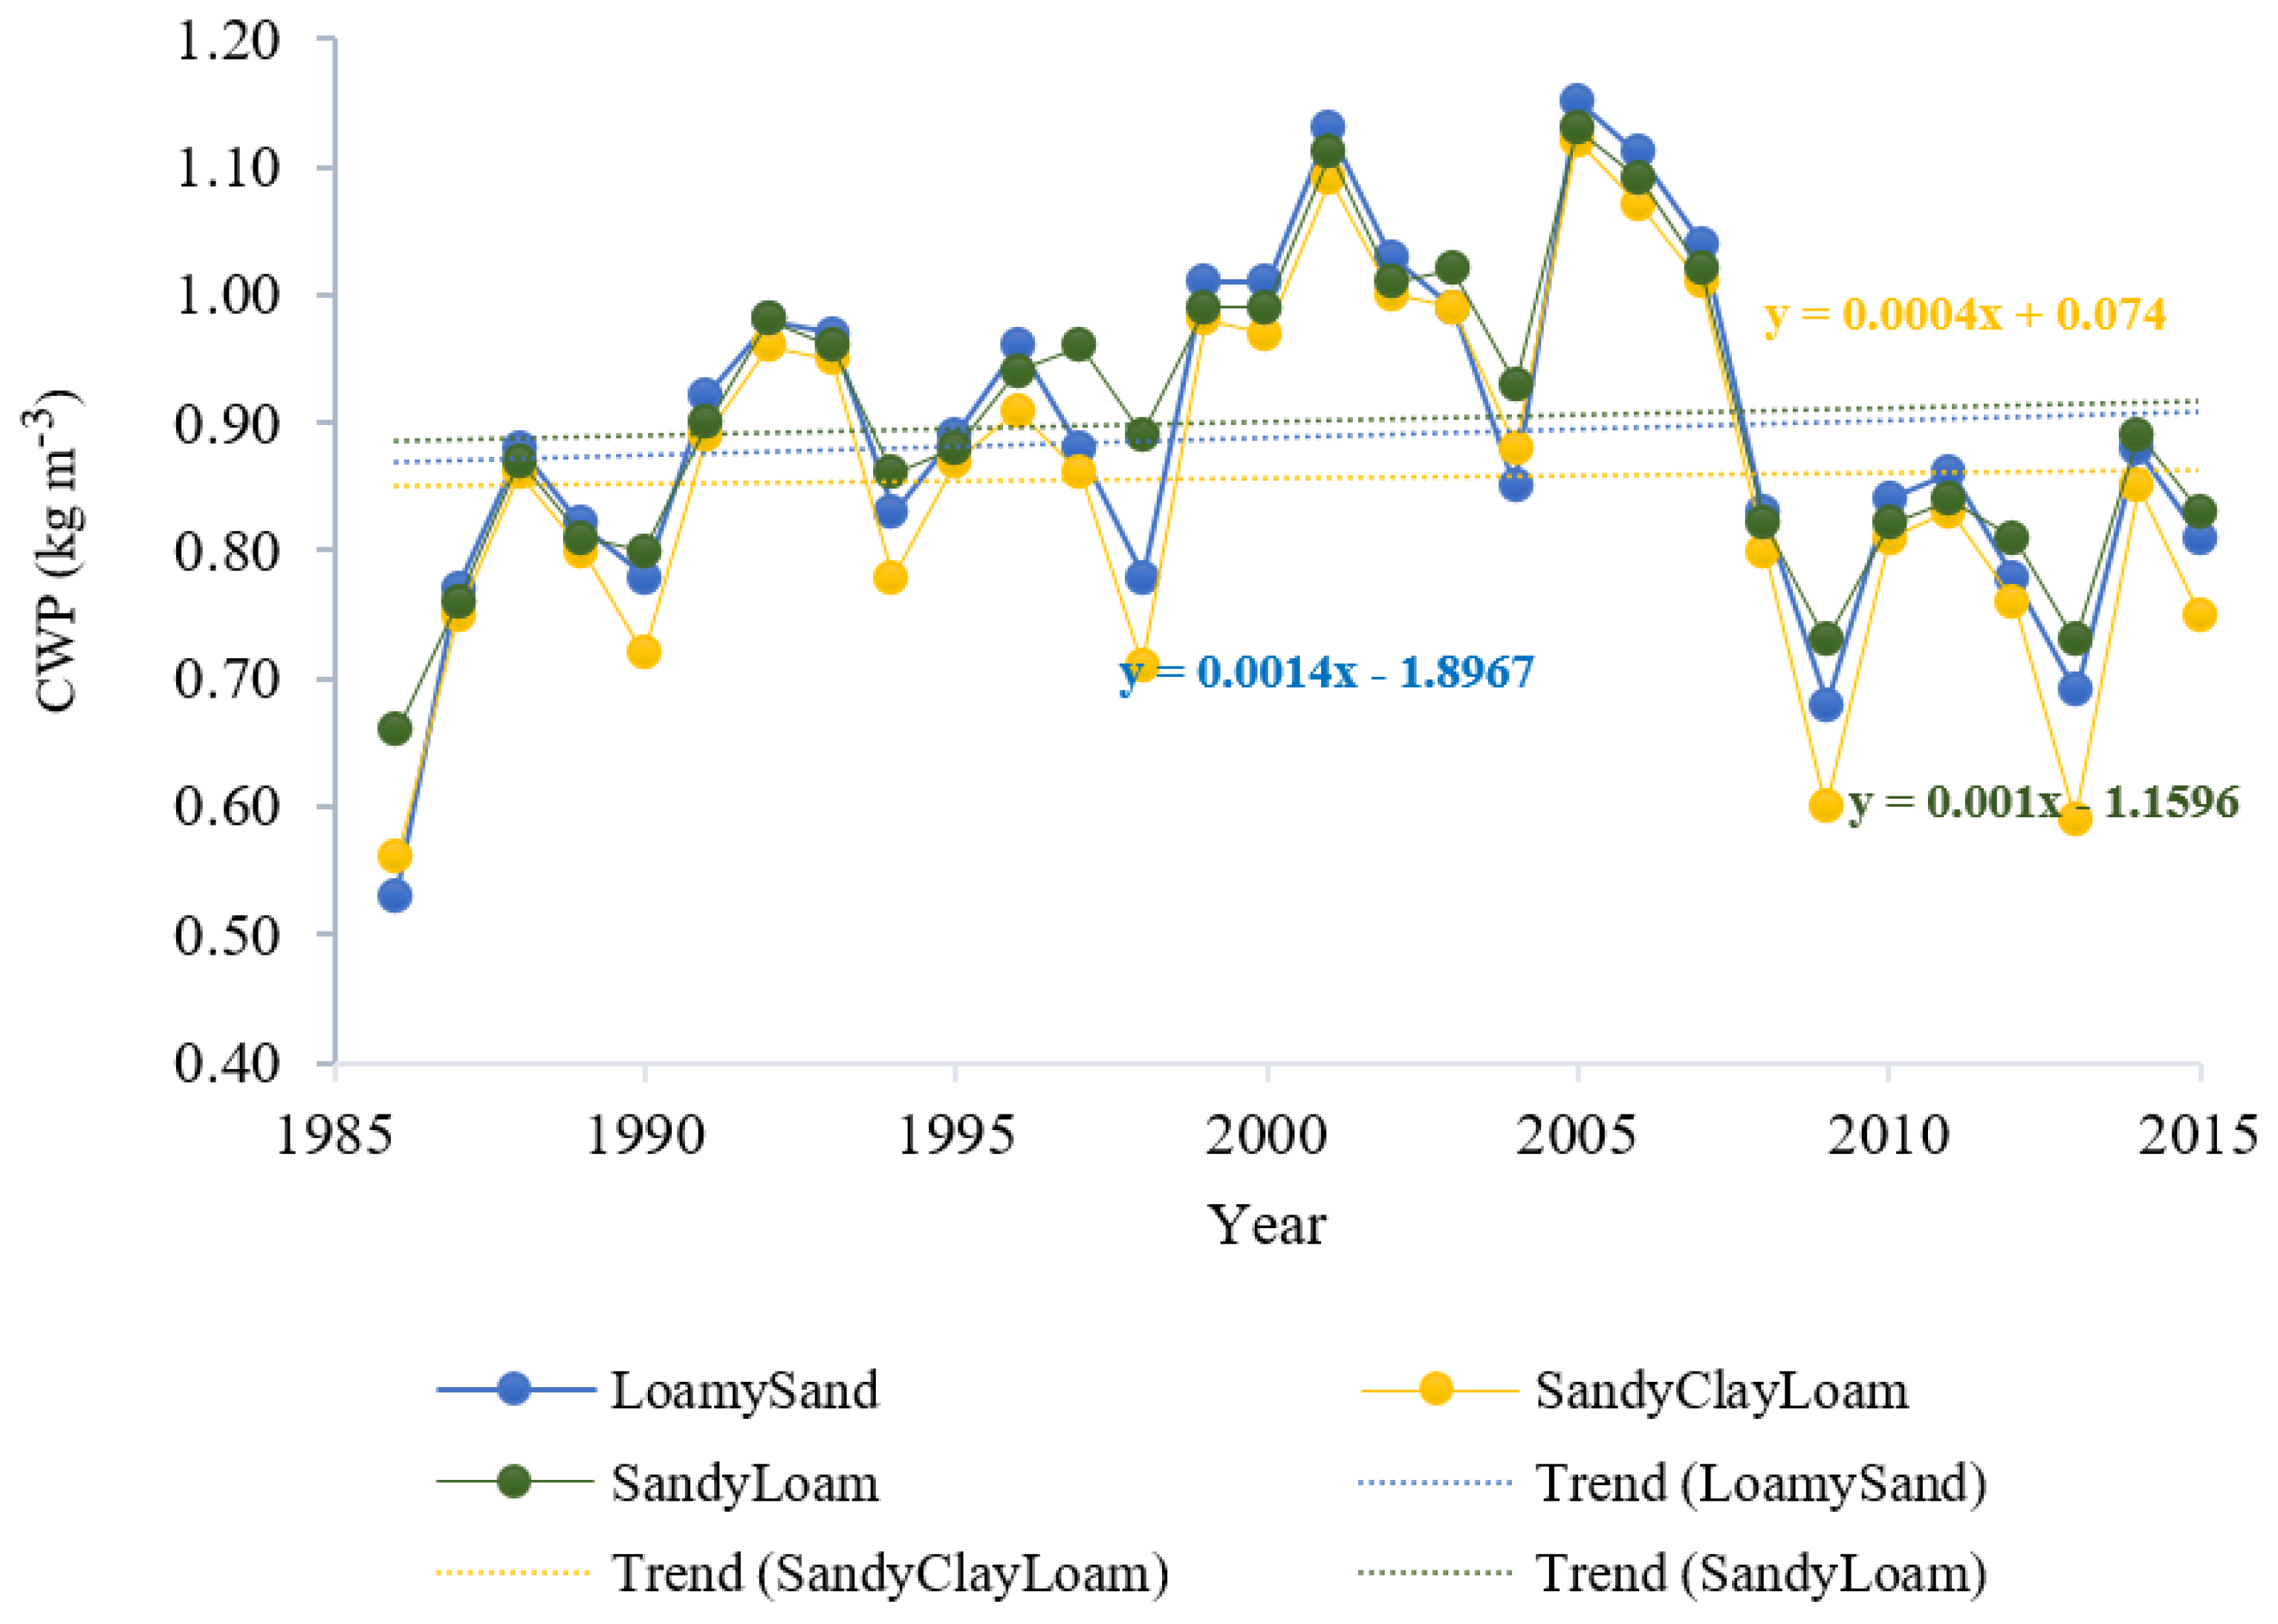
3.1.3. Temporal Distribution of Crop Water Productivity (CWP)

According to Figure 5, a clear upward trend of CWP was observed on all the soil textures from 1986 till it peaked in 2007 before declining from 2008 till 2015. In addition, the trendlines show that there is a slight increase in CWP of soybean on loamy sand, sand clay loam and sandy loam soils with slope values of 0.0014, 0.0004 and 0.001 kg/m3/year respectively. It shows that CWP follows the same pattern as yield. This is not surprising since CWP is directly proportional to crop yields. It further shows that soybean is effectively converting the consumptive water use into quantifiable yields.

3.2. Future Changes in Climatic Parameters, CWR, Yield and CWP under Different Climate Change Scenarios

The future changes in rainfall, minimum and maximum temperatures for future periods of near future (2021–2040), mid-century (2041–2070) and late-century (2071–2099) under RCP 4.5 and RCP 8.5 scenarios relative to mean of the baseline period (1986–2015) were estimated based on the projections of HadGEM2-ES model. The analysis shows that the basin will experience a reduction in annual rainfall across all scenarios and future periods except in the period of 2041–2070. From Table 3, under the RCP 4.5 scenario, annual rainfall will decrease by 10% by 2040, increase by 3% by 2070 and decrease by 8% by 2099 compared to the average of the baseline period. In addition, both minimum and maximum temperatures will increase gradually from 2021 up to 2099 under both RCP 4.5 and RCP 8.5 scenarios. RCP 8.5 is expected to be generally hotter than RCP 4.5 since RCP 8.5. The maximum temperature was projected to increase by 2.7 °C and 4.4 °C by the late century under RCP 4.5 and RCP 8.5 scenarios, respectively, compared to the average of the baseline period. Similarly, minimum temperature is projected to increase by up to 2.4 °C and 4.2 °C by the late century under RCP 4.5 and RCP 8.5 scenarios, respectively, compared to the average of the baseline period.
Climate change is capable of significantly affecting agricultural production globally which is expected to be temporally and spatially distributed. The future CWR, IWR, yield and CWP of soybean were simulated for future periods of near future (2021–2040), mid-century (2041–2070) and late-century (2071–2099) under RCP 4.5 and RCP 8.5 scenarios based on the projections of HadGEM2-ES model.

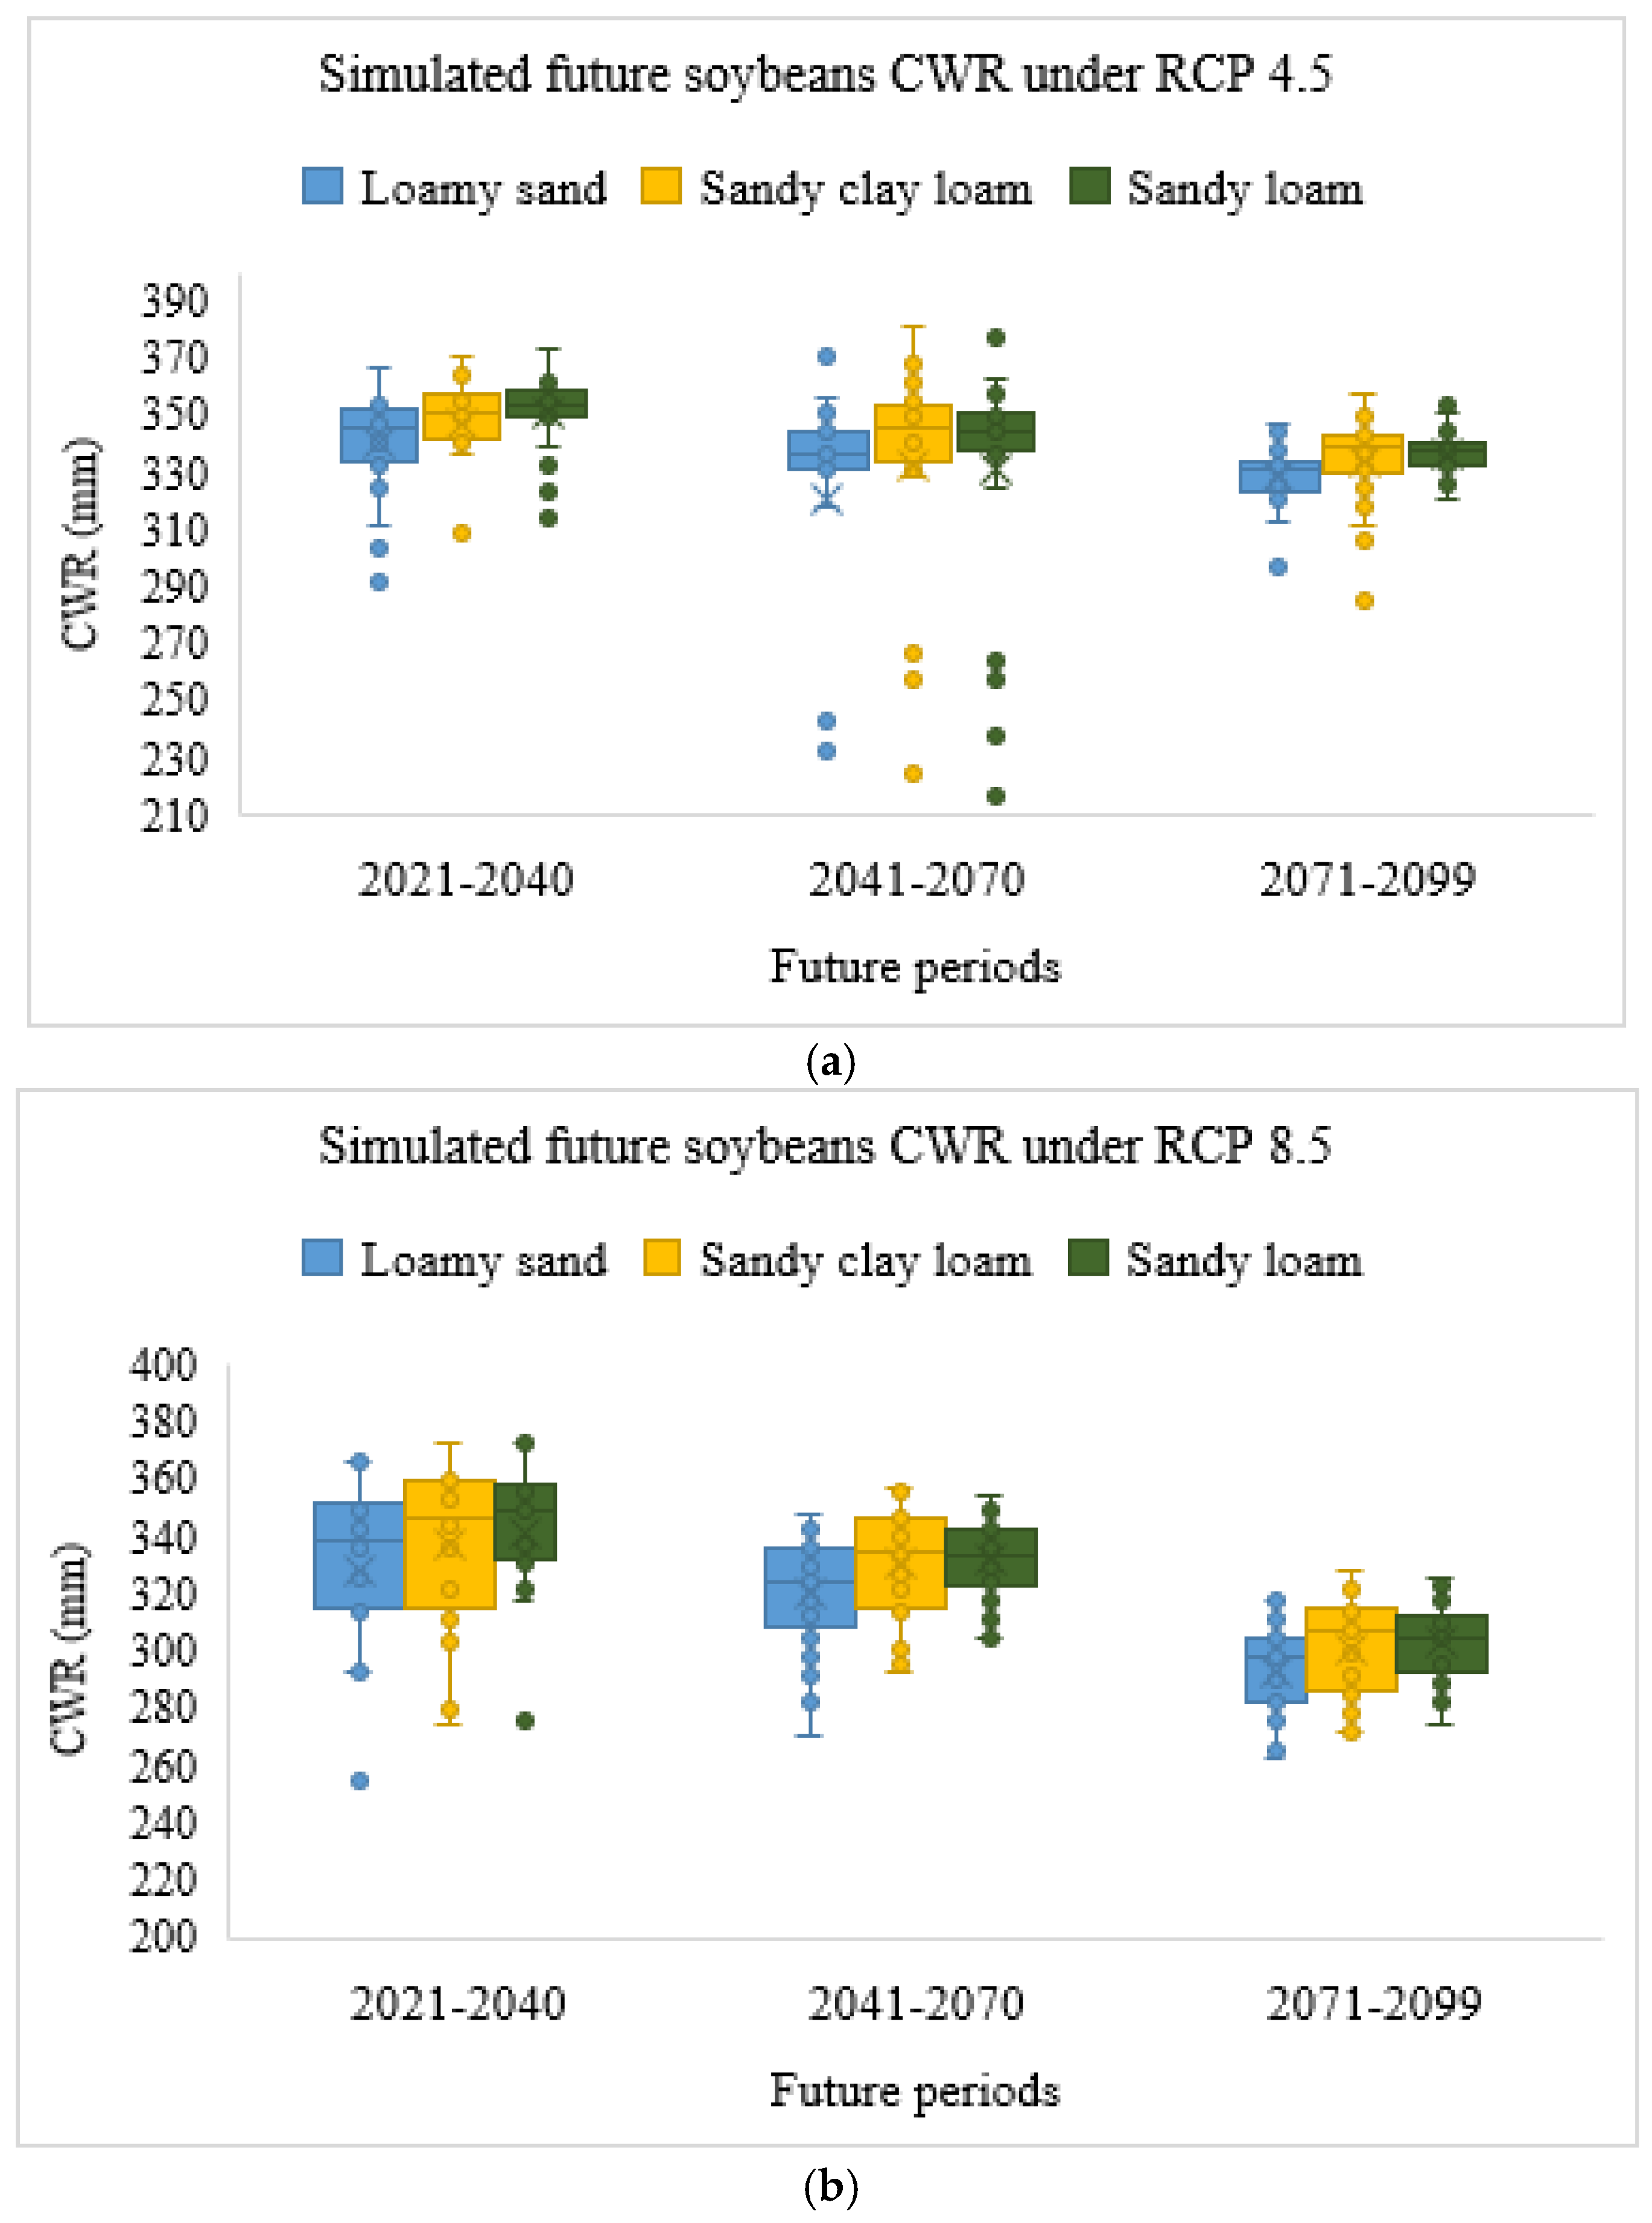
3.2.1. Future Seasonal Crop Water Requirements (CWR)

The simulations show that climate change (change in rainfall and temperature) will significantly affect soybean CWR. The CWR of soybean is projected to decrease gradually from 2021–2099 as shown in Figure 6. Under RCP 4.5, the average CWR of soybean on loamy sand, sandy clay loam and sandy loam soils are projected to be 340, 347 and 351 mm in the near future; 321, 332 and 330 mm in the mid-century and 329, 334 and 337 mm in the late century respectively. Meanwhile, under RCP 8.5, CWR of soybean will reduce largely when compared with the results under RCP 4.5 in all future periods. Under RCP 8.5, the average CWR of soybean on loamy sand, sandy clay loam and sandy loam soils are projected to be 328, 337 and 341 mm in the near future; 320, 330 and 332 mm in the mid-century as well as 293, 301 and 303 mm in the late century, respectively.

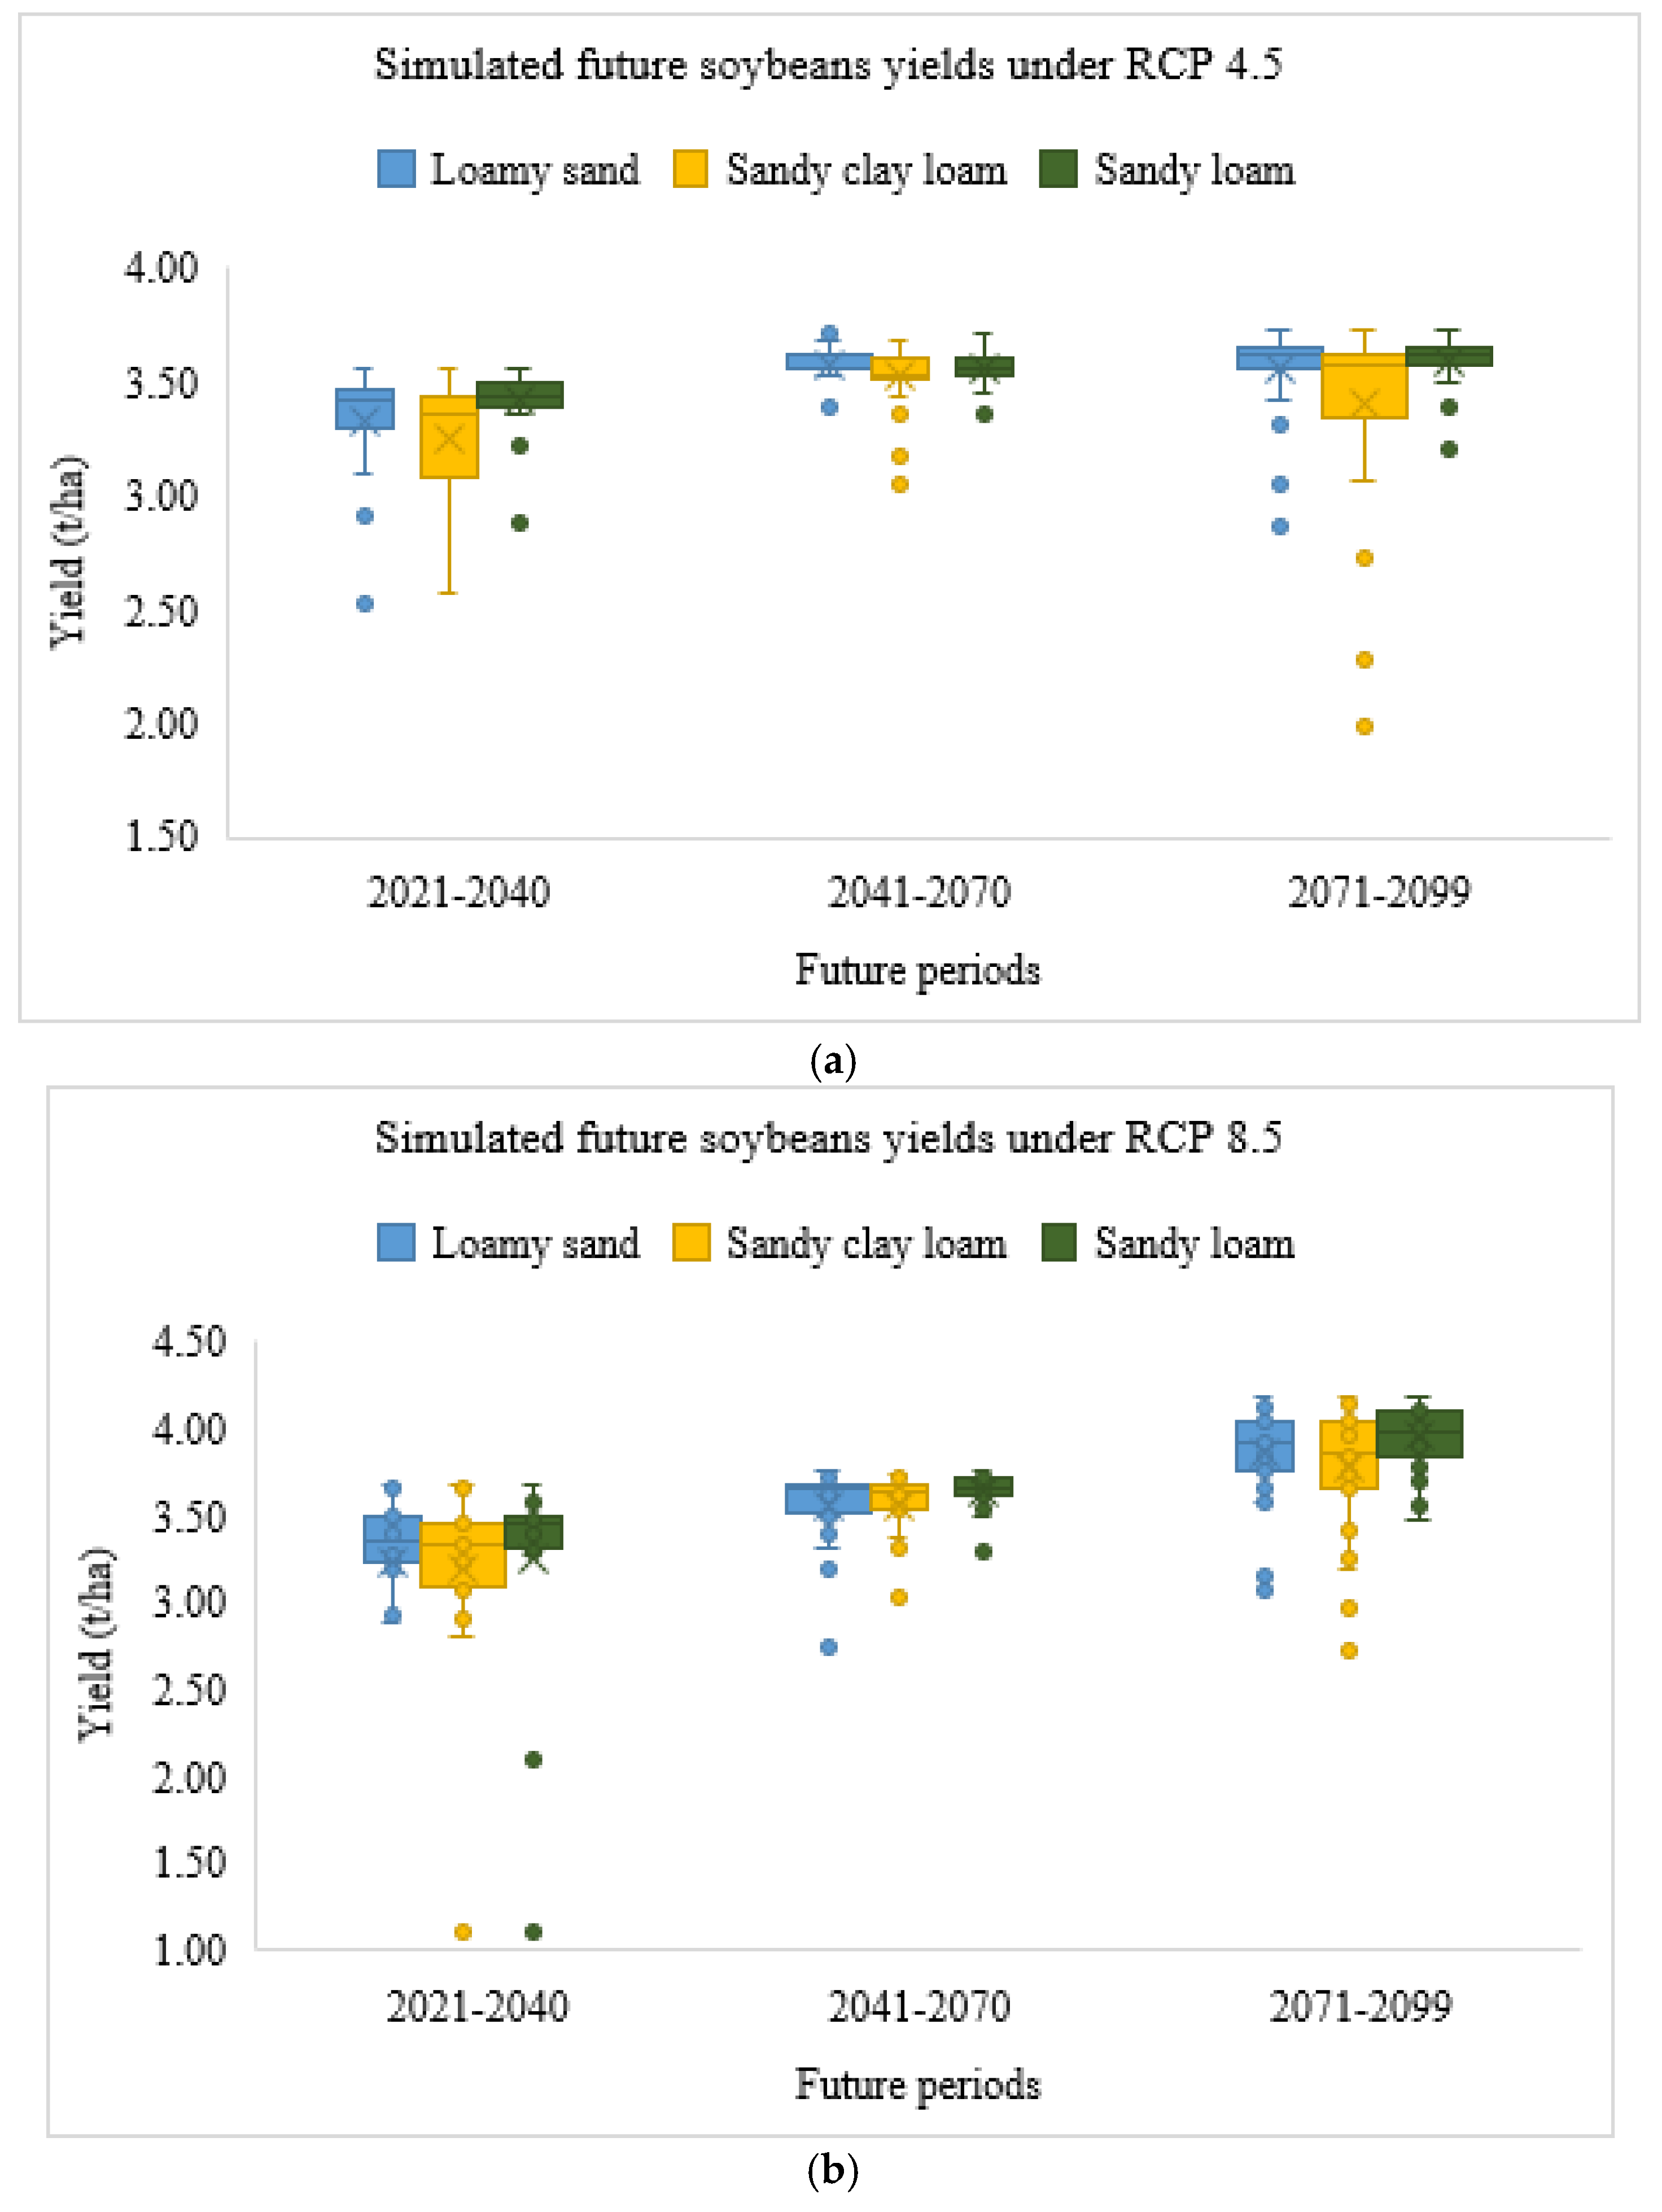
3.2.2. Future Crop Yields

According to Figure 7, rainfed soybean yield is projected to progressively increase from 2021 to 2099 under both RCP 4.5 and RCP 8.5 scenarios within the basin. In this case, higher yields are projected under RCP 8.5 than RCP 4.5. The results show that soybean yields are almost similar for the soils. Under RCP 4.5, the average soybean yield on loamy sand, sandy clay loam and sandy loam soils are projected to be 3.33, 3.26 and 3.41 t/ha in the near future; 3.58, 3.5 and 3.55 t/ha in the mid-century and 3.55, 3.29 and 3.60 t/ha in the late century respectively. Similarly, under RCP 8.5, the average soybean yield on loamy sand, sandy clay loam and sandy loam soils are projected to be 3.22, 3.19 and 3.26 t/ha in the near future; 3.60, 3.57 and 3.70 t/ha in the mid-century and 3.92, 3.83 and 4.01 t/ha in the late century respectively. The higher yields under RCP 8.5 could be attributed to higher CO2 concentrations.

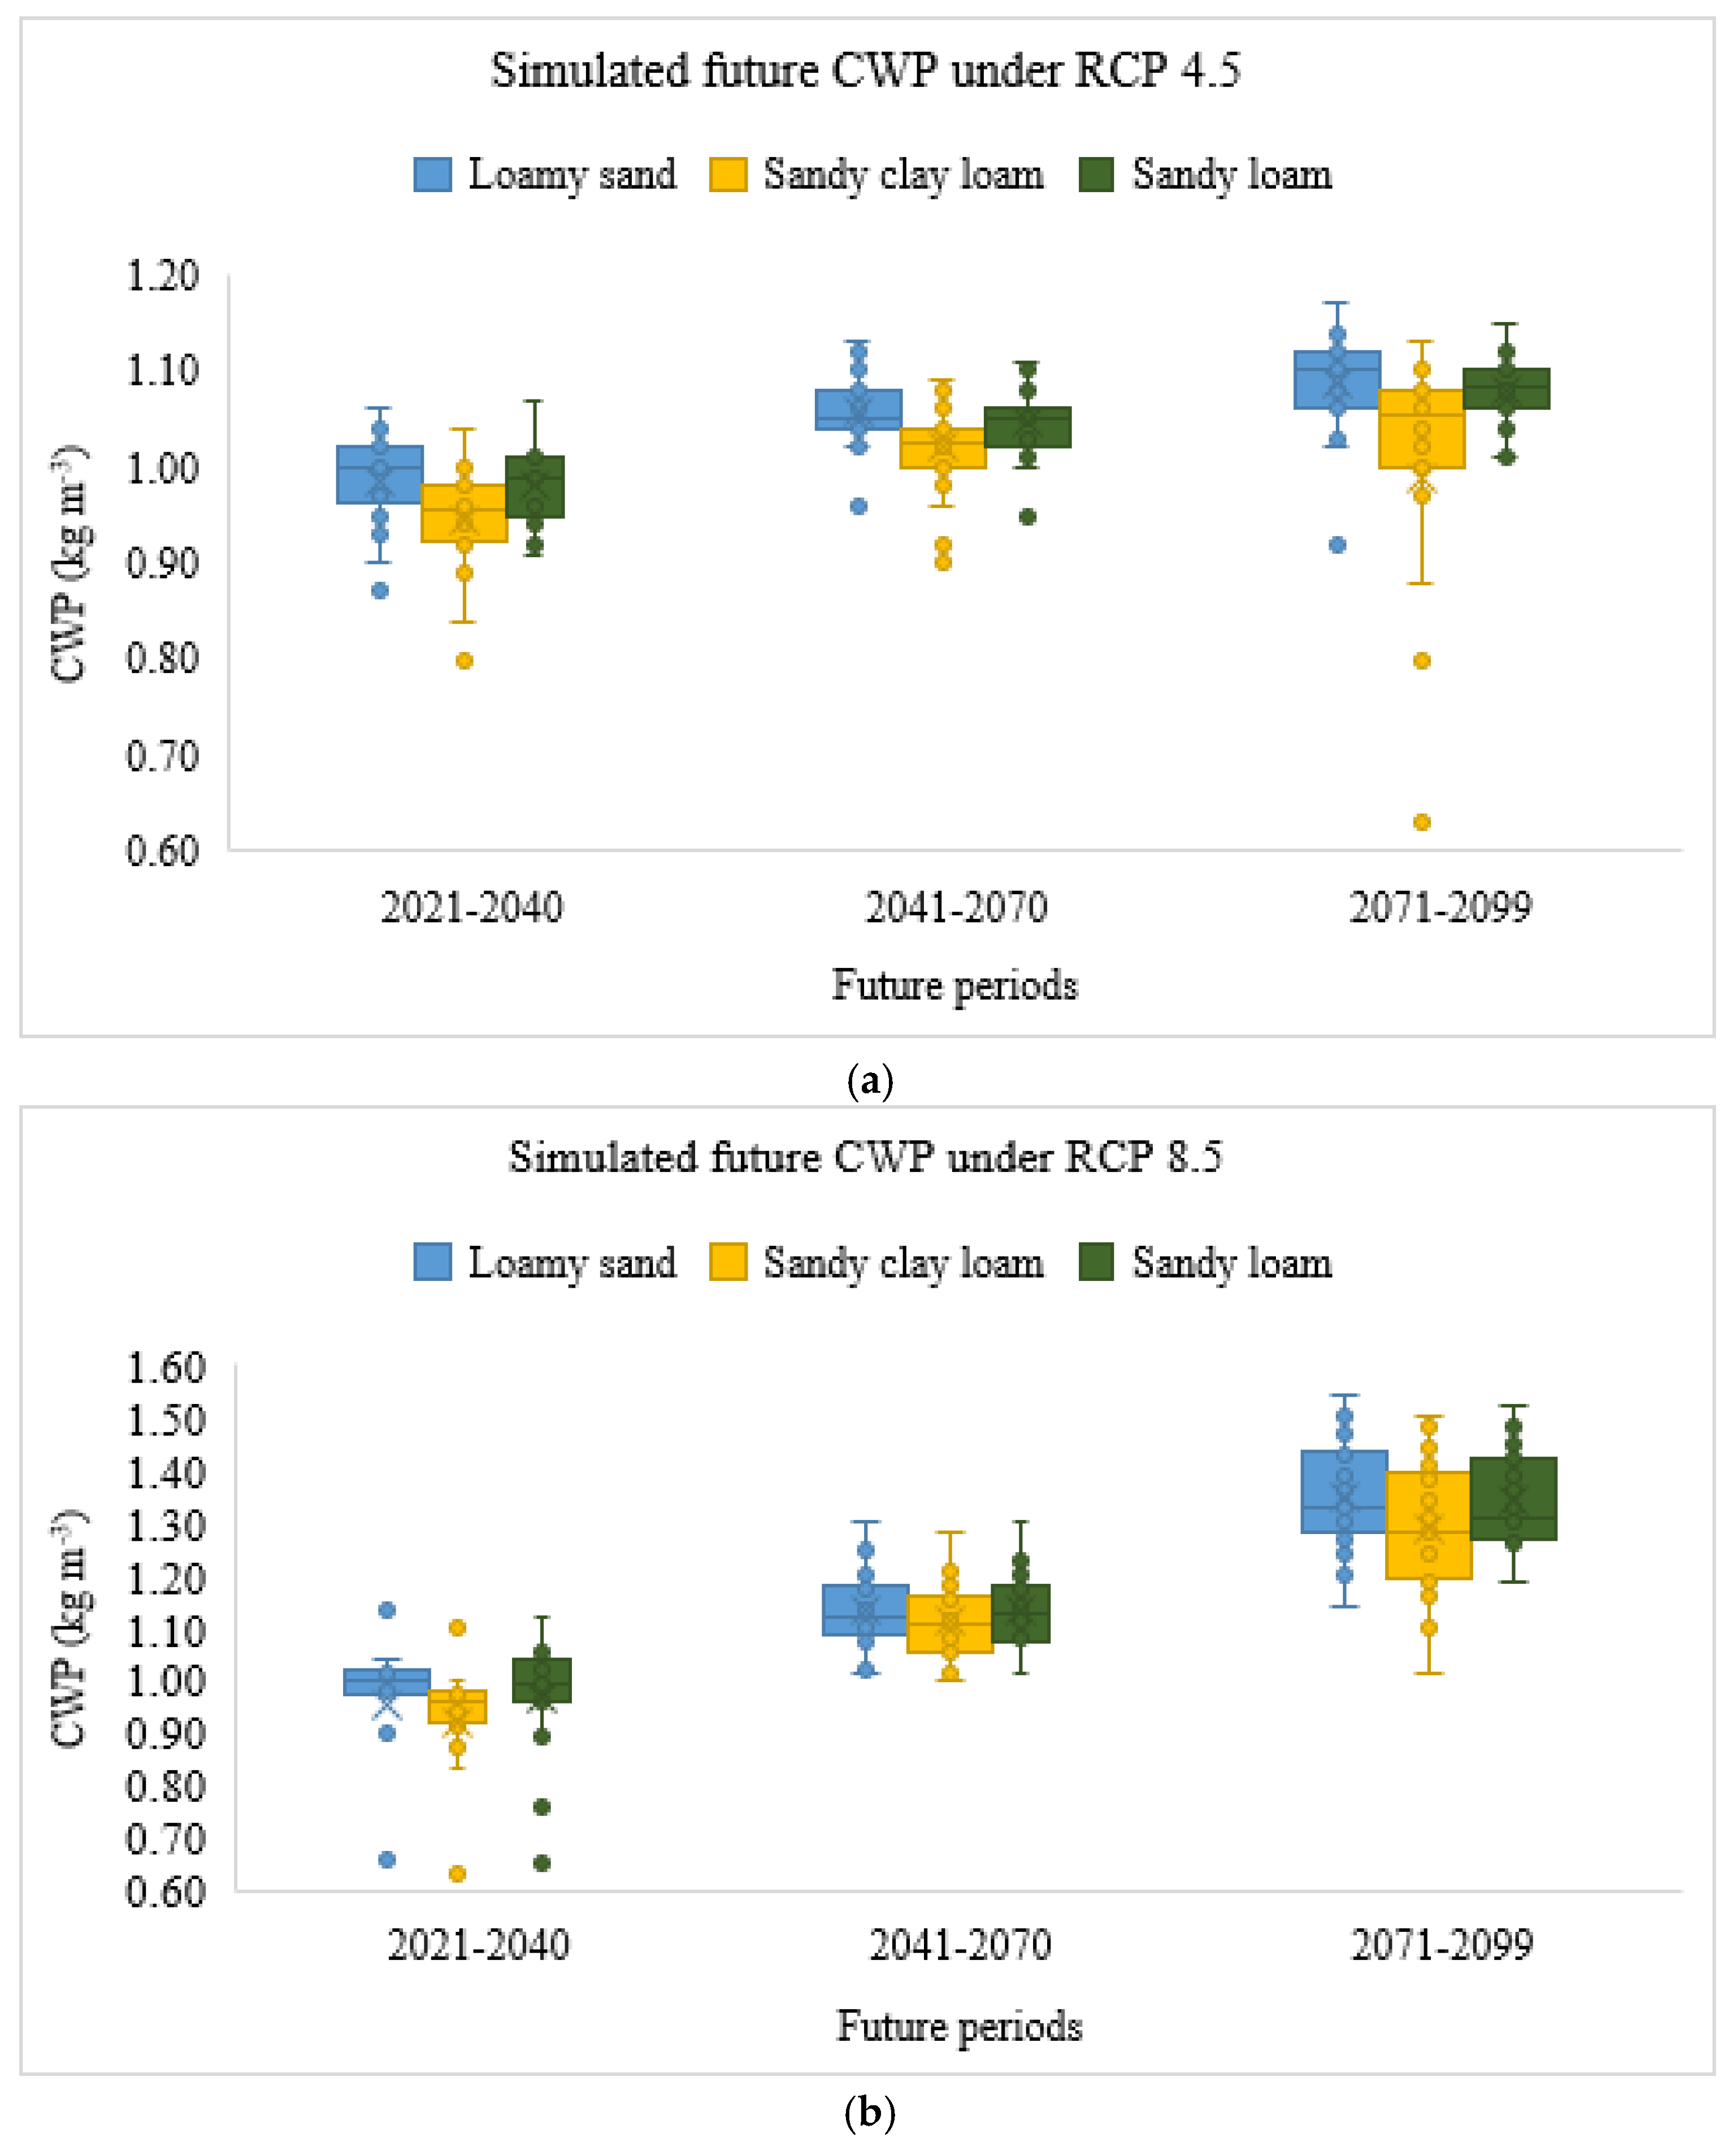
3.2.3. Future Crop Water Productivity (CWP)

The simulated future CWP show different variations for the future periods as well as under different climate change scenarios. According to the simulations, there will be huge variability within the soil textures and the growing seasons. The simulations of soybean CWP under both RCP 4.5 and RCP 8 scenarios show an increasing trend in the future years as shown in Figure 8. Under RCP 4.5, the average CWP of soybean on loamy sand, sandy clay loam and sandy loam soils are projected to be 0.99, 0.94 and 0.98 kg/m3 in the near future; 1.06, 1.02 and 1.05 kg/m3 in the mid-century and 1.09, 0.99 and 1.08 kg/m3 in the late century respectively. Meanwhile, under RCP 8.5, the average CWP of soybean on loamy sand, sandy clay loam and sandy loam soils are projected to be 0.94, 0.90 and 0.96 kg/m3 in the near future; 1.13, 1.12 and 1.13 kg/m3 in the mid-century and 1.35, 1.28 and 1.34 kg/m3 in the late century respectively. The projected CWP also follows the same pattern as yields. Higher CWP is projected under RCP 8.5 than RCP 4.5 due to simulated higher yields under this scenario.

3.3. Temporal Changes in Future Seasonal CWR, Yield and CWP under Different Climate Change Scenarios for Different Soil Textures

The period of 1986–2015 was used as a baseline period to estimate the temporal changes in CWR, yield and CWP of rainfed soybean on different soil textures in three future periods of near future (2021–2040), mid-century (2041–2070) and late-century (2071–2099) under RCP 4.5 and RCP 8.5 scenarios.

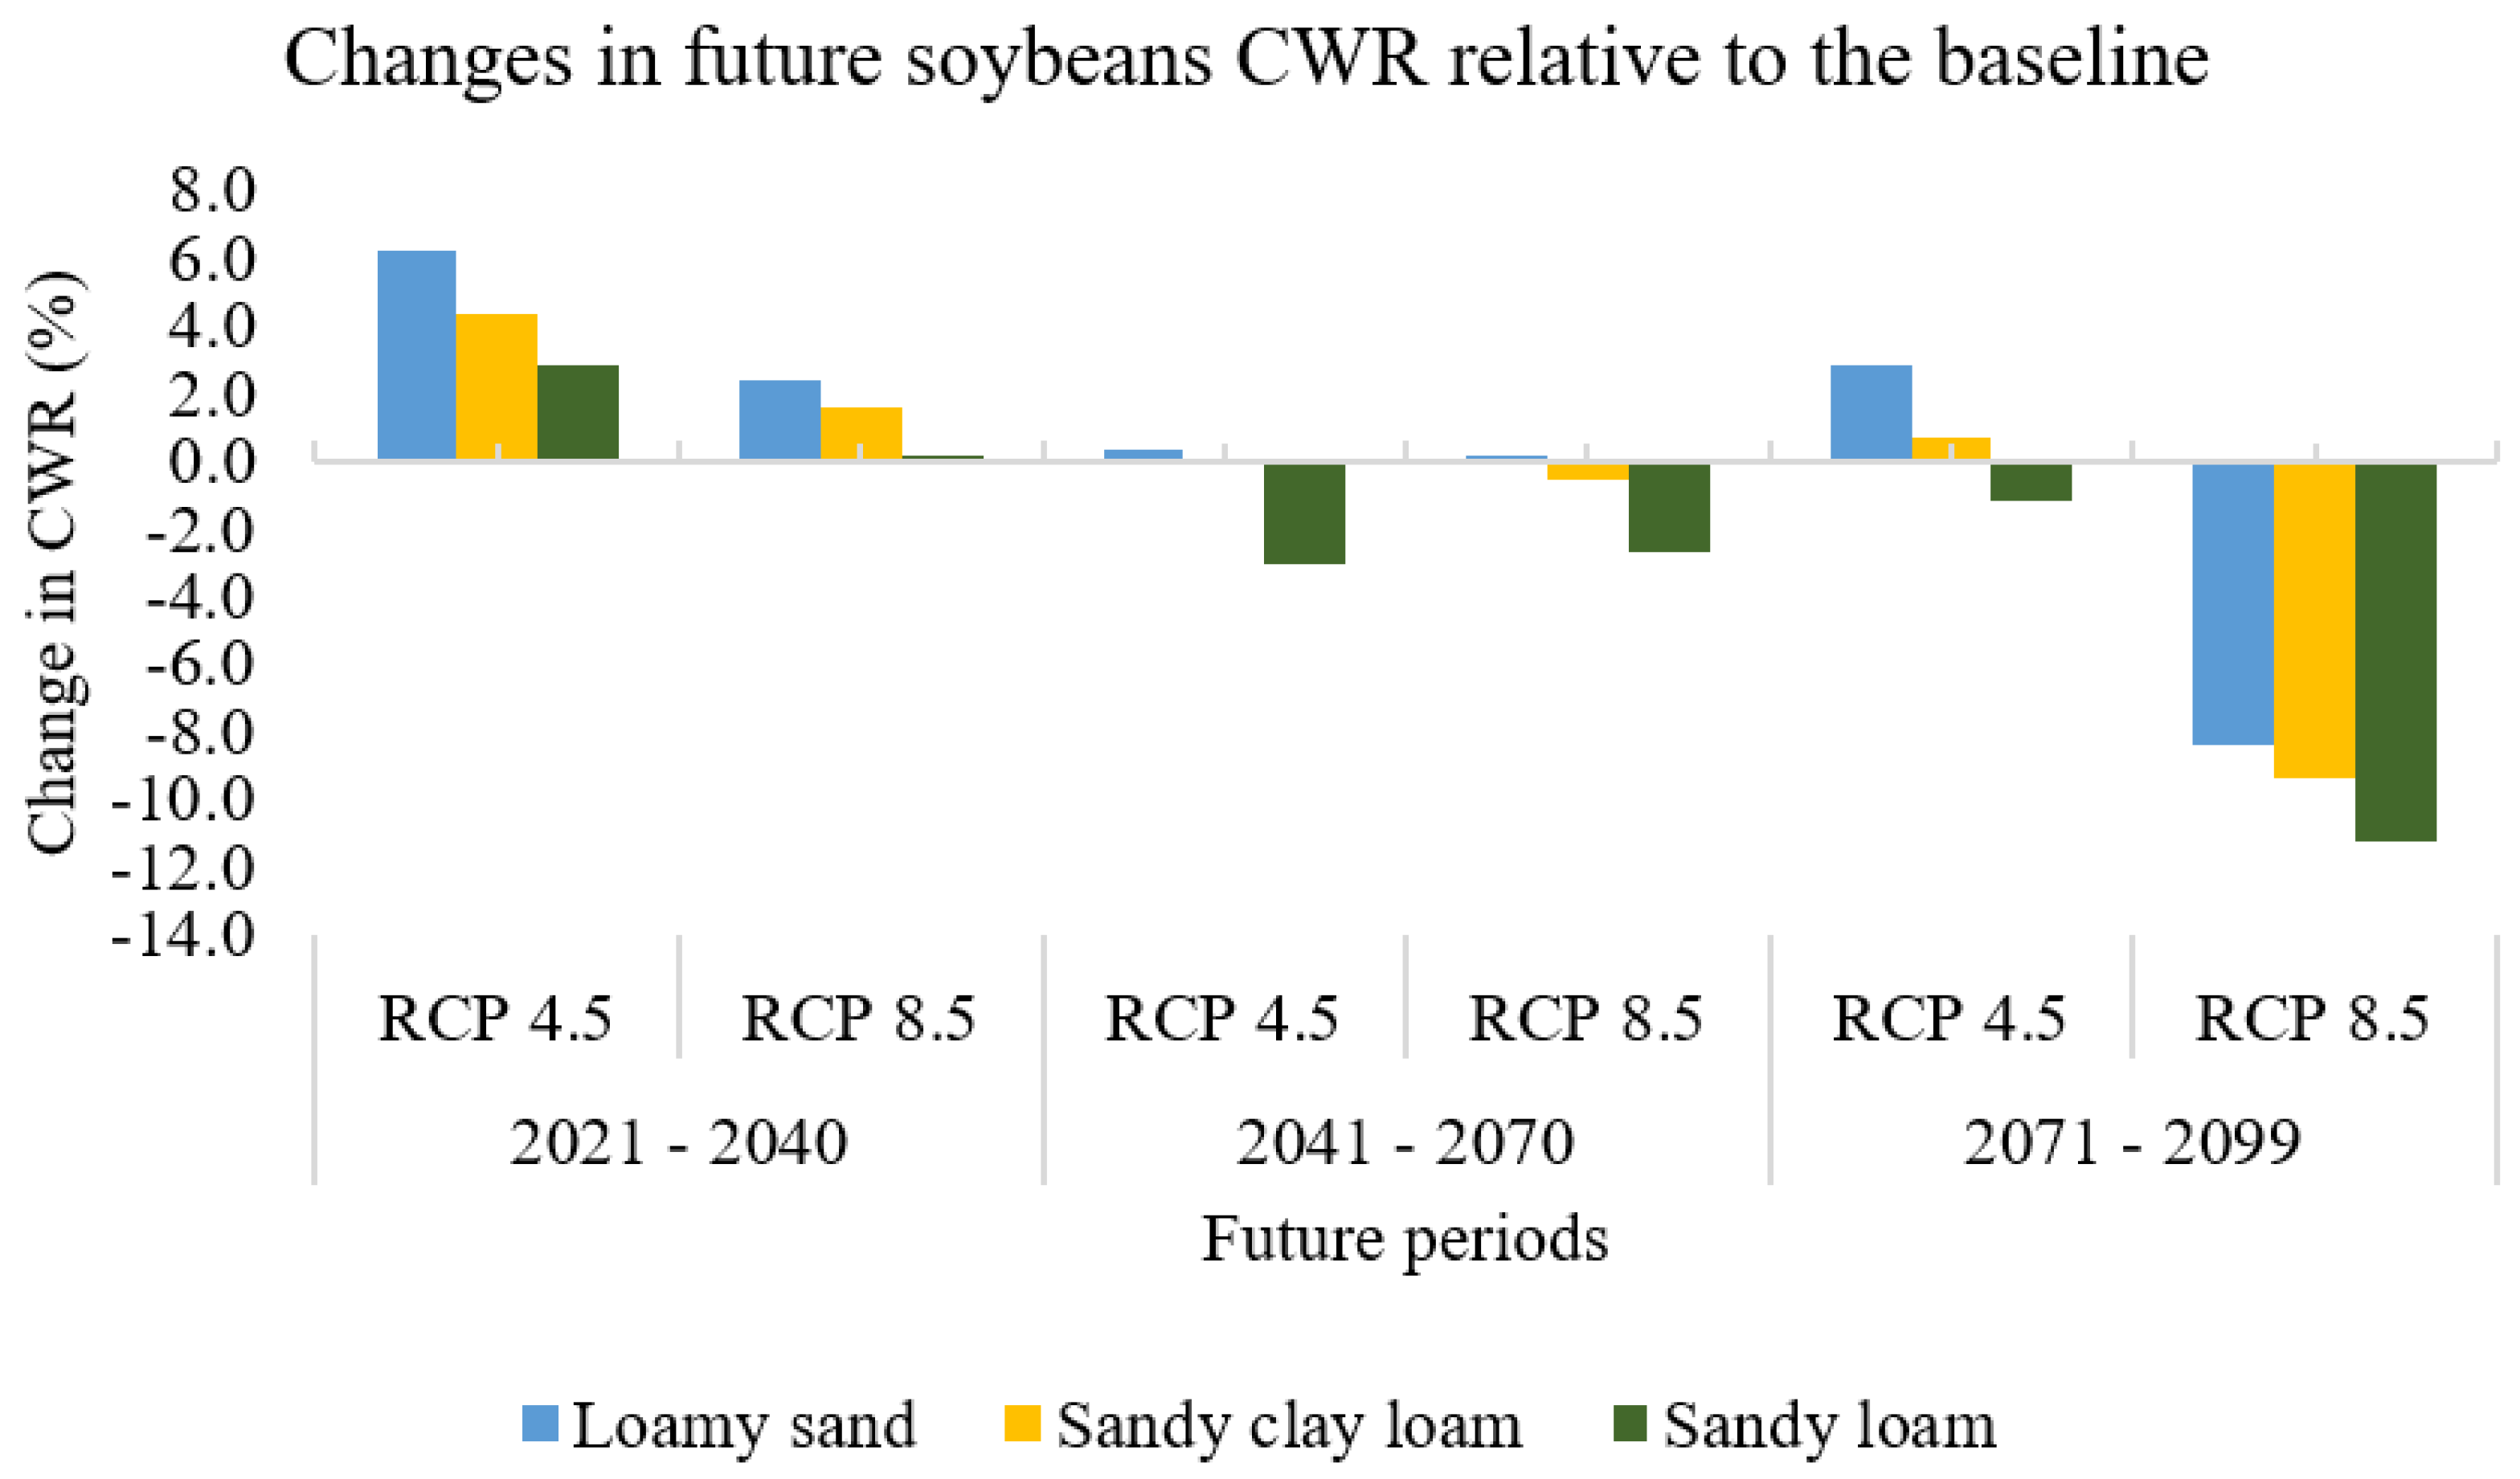
3.3.1. Changes in Future Seasonal Crop Water Requirements (CWR)

The future changes in soybean CWR are projected to fluctuate when compared with the average of the baseline. According to Figure 9, under RCP 4.5, small increases ranging from 3.0 to 6% are projected in the near future. In addition, under RCP 8.5, increase changes of about 2% are projected in the near future, while in the mid-centuries, the change could be up to −3 depending on the soil textures. However, under RCP 8.5 in the late-century, the highest changes which range from −11.25 to −8.37% are projected. Meanwhile, the increase in CWR is not unconnected to the combined effects of CO2 fertilization and elevated temperature. However, the results of this study show that under RCP 8.5 in the late century, soybean CWR will decrease. This could be attributed to the fact that under this scenario and year period, the negative effects of elevated temperature will likely suppress the positive effects of CO2 fertilization.

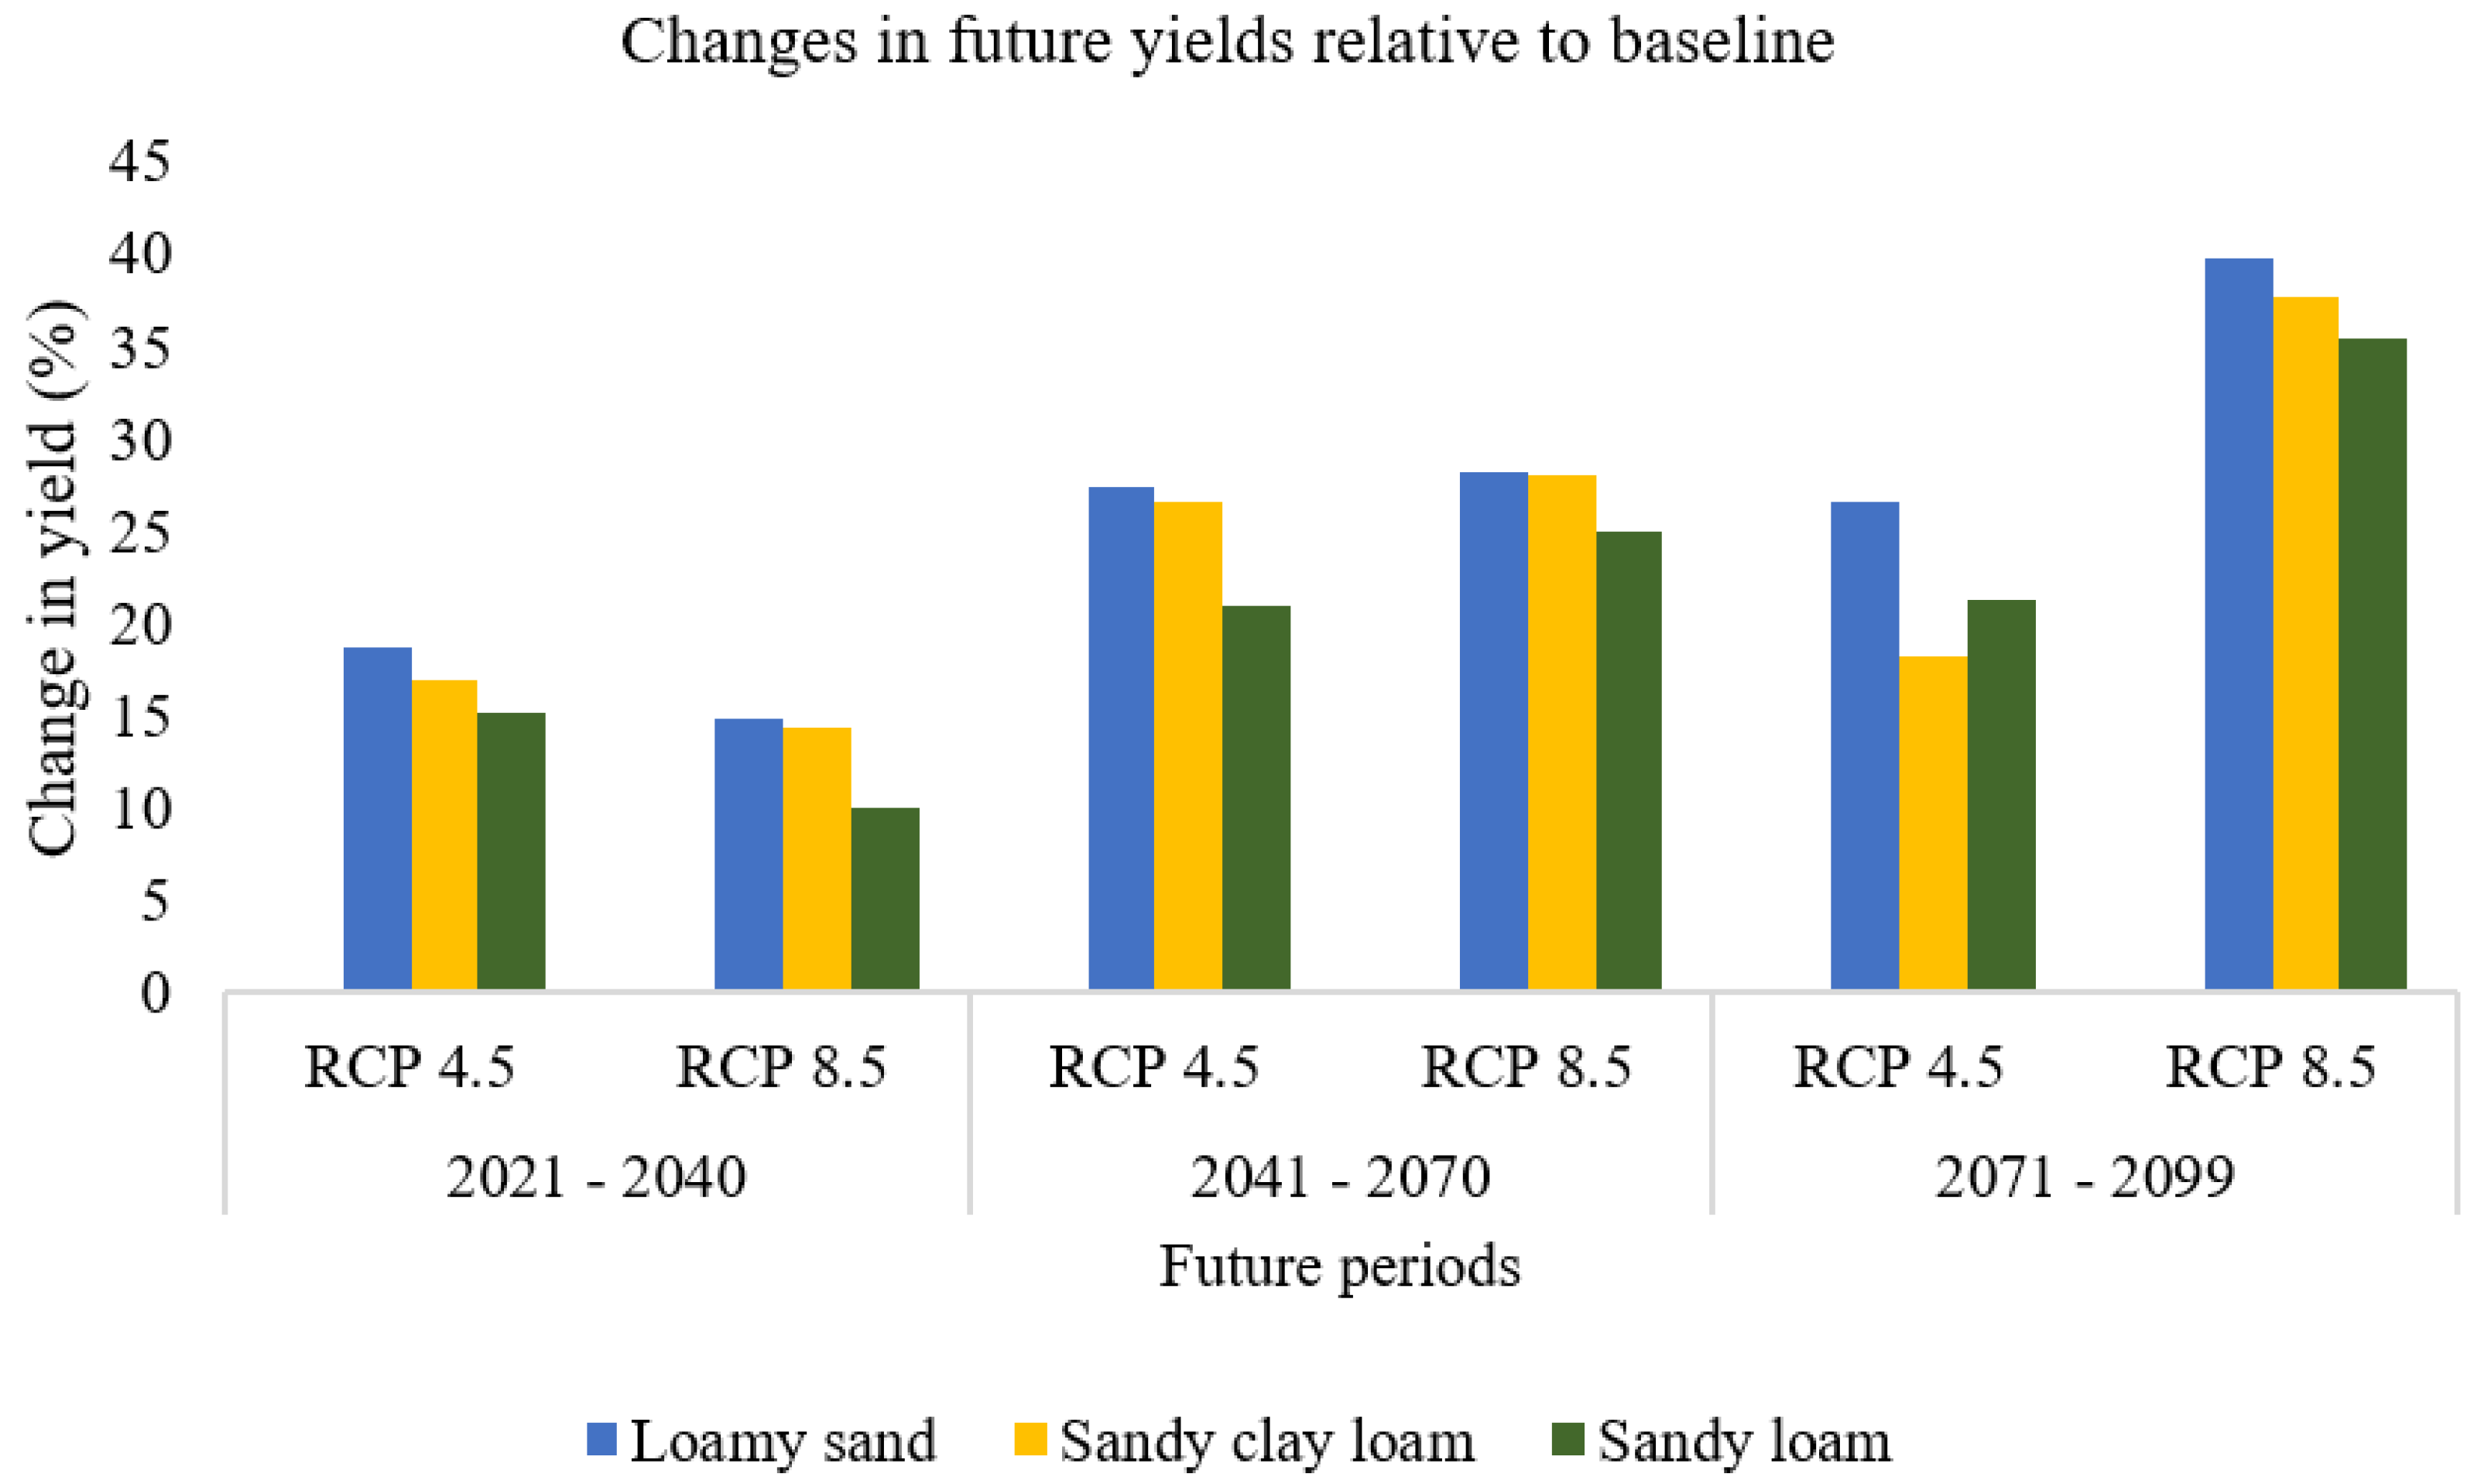
3.3.2. Changes in Future Seasonal Yield

According to Figure 10, positive changes are projected for soybean yields in future periods in all scenarios. The results show that under RCP 4.5, the change ranges from 15.19 to 19.70%, 21.04 to 28.83%, and 18.23 to 25.36% in the near future, mid-century and late-century respectively. While under RCP 8.5, the change ranges from 10.06 to 18.87%, 24.94 to 26.40%, and 35.09 to 39.70% in the near future, mid-century and late-century respectively. Soybean yields will likely be benefitted by CO2 fertilization which will have more influence than other factors such as an increase in temperature and rainfall pattern. The rate of changes will likely depend on the concentration levels of CO2.

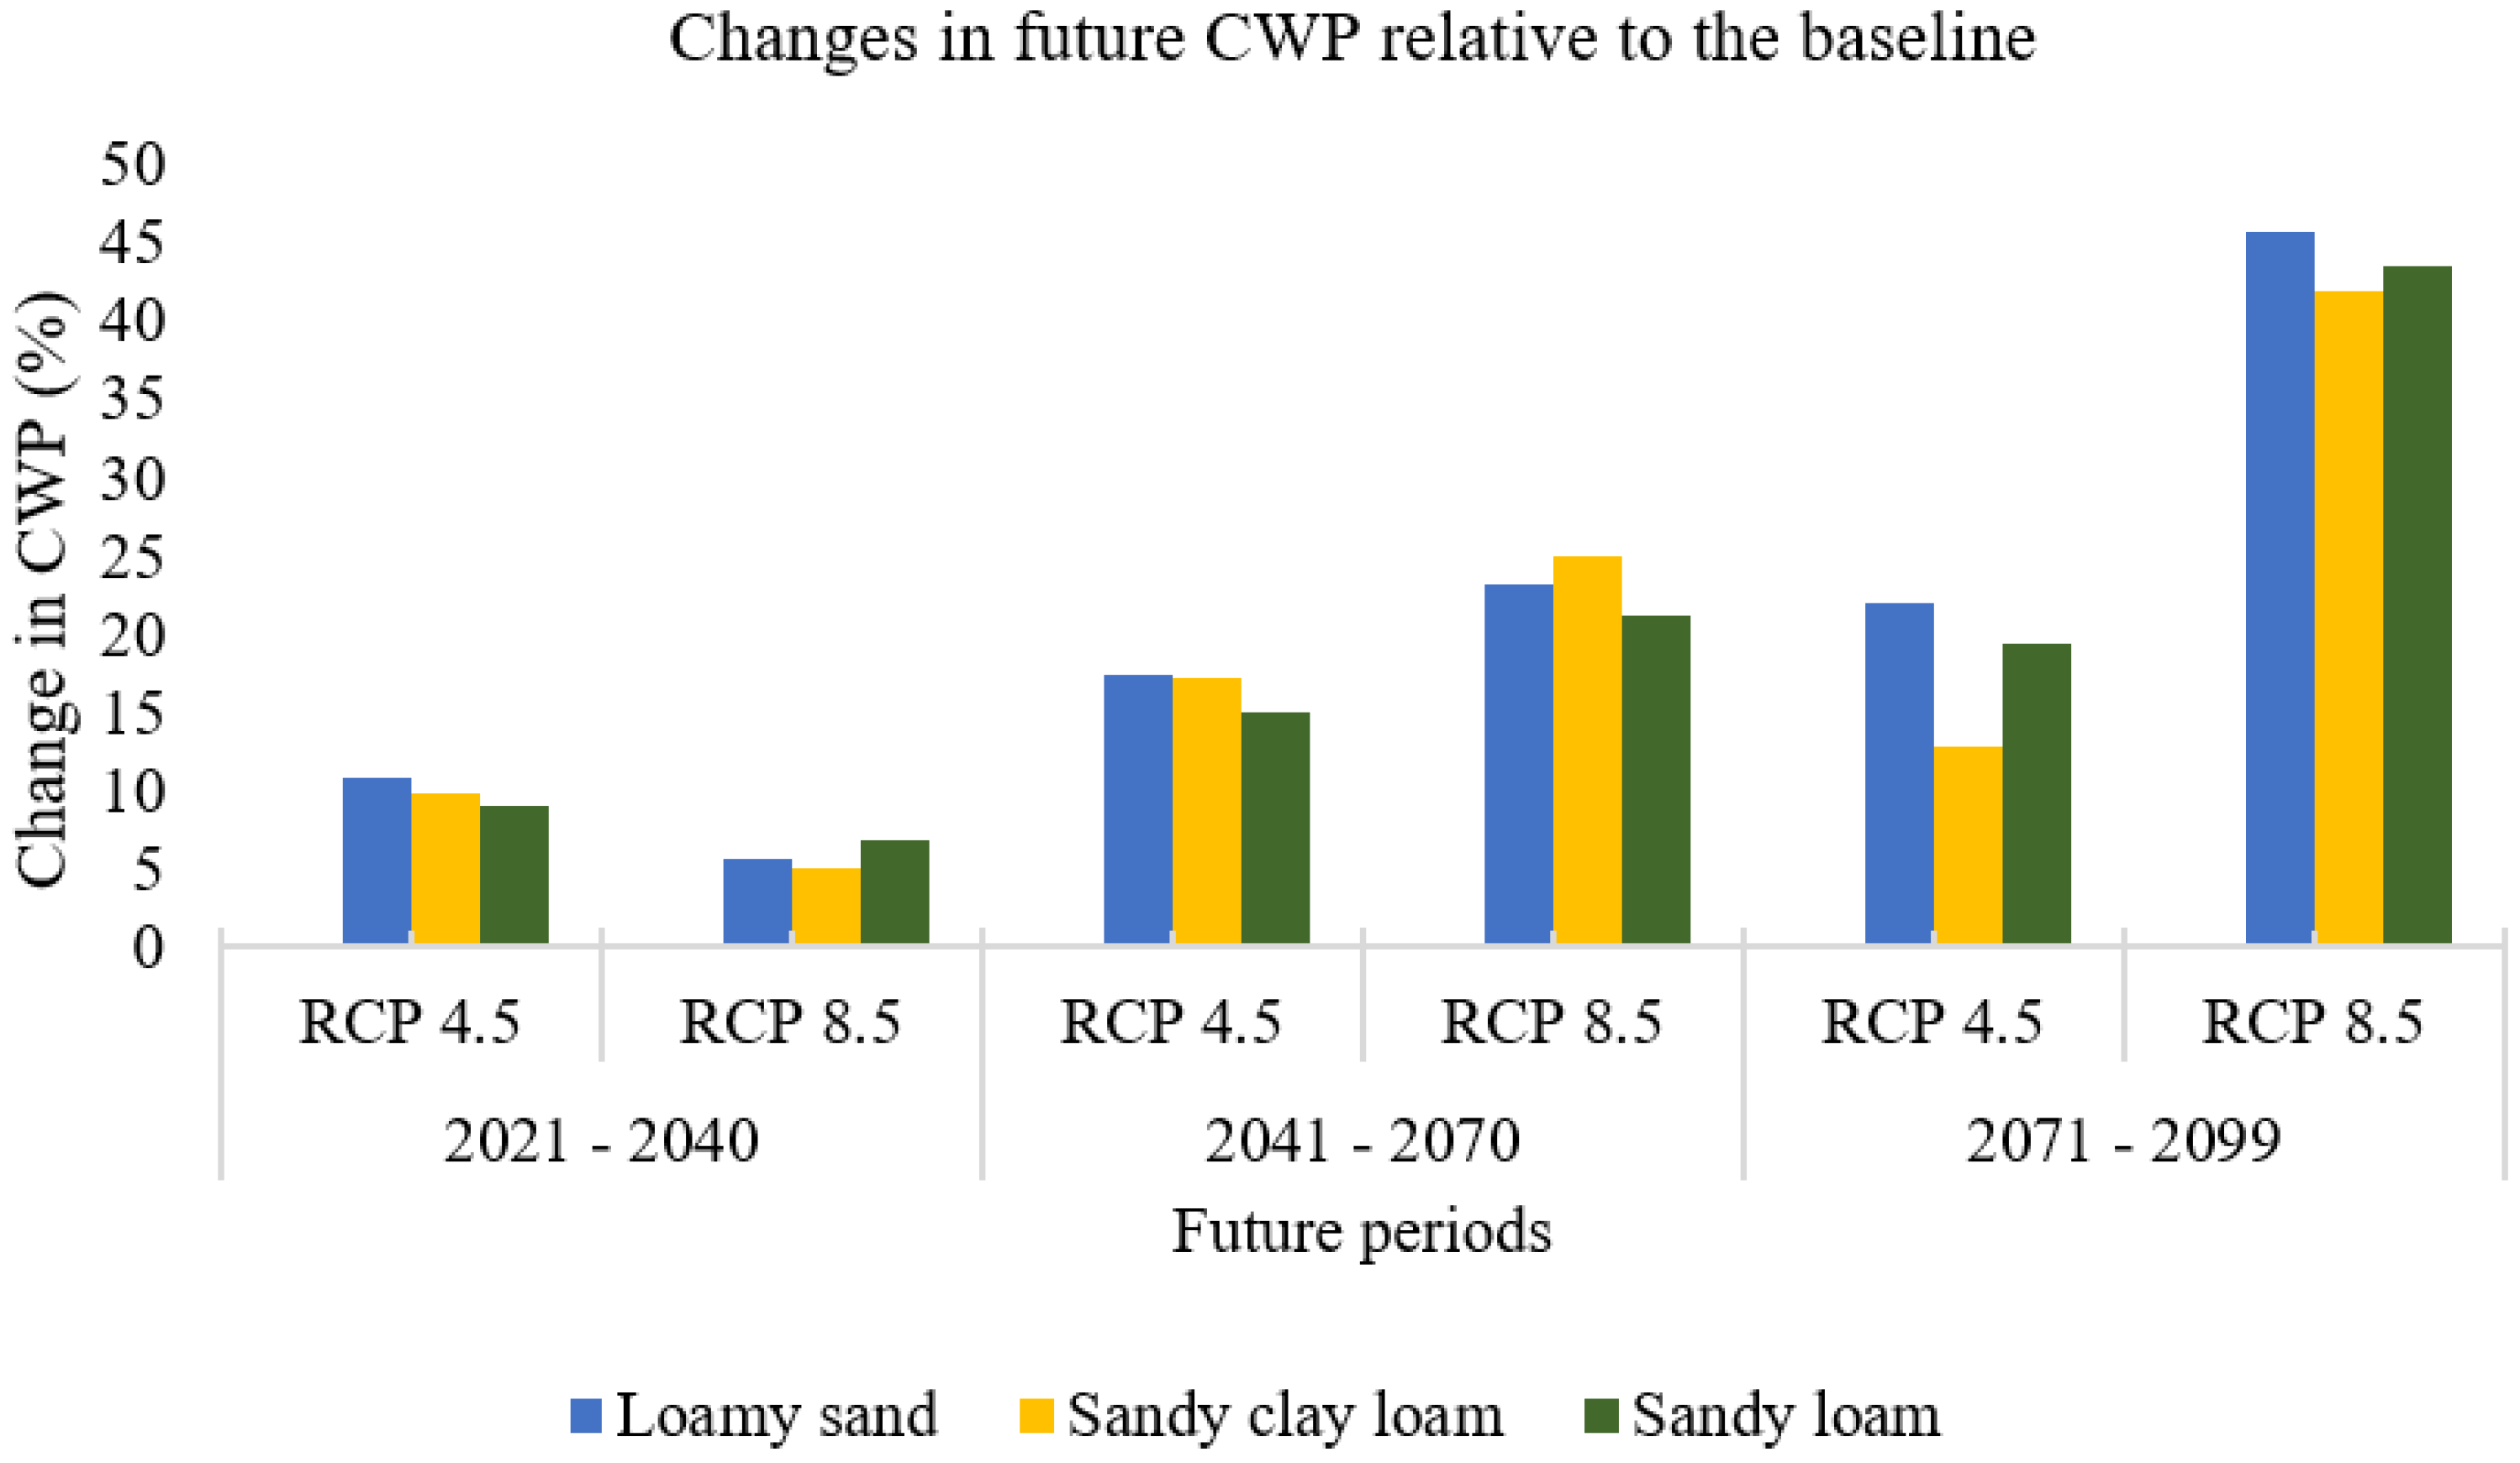
3.3.3. Changes in Future Crop Water Productivity (CWP)

Changes in future soybean CWP will increase gradually across all future years under RCP 4.5 and RCP 8.5 as shown in Figure 11. The results show that under RCP 4.5, the changes in future soybean CWP range from 10 to 20% depending on soil texture and future period. Under RCP 8.5, the changes in future soybean CWP are projected to range from 4.94% to 7.71%, 21.22% to 25.02%, and 41.86 to 45.79% in the near future, mid-century and late-century, respectively. The likely increase in soybean CWP is not unconnected to that the fact that CO2 fertilization has more influence than other factors on soybean yield which directly influence CWP. Due to the increase in CO2 concentration which triggers early fertilization of soybean, soybean yield will likely increase thus increasing CWP. Table A3 in the Appendix A represents the model evaluation of simulated soybean yield in various soil textures for four growing seasons.

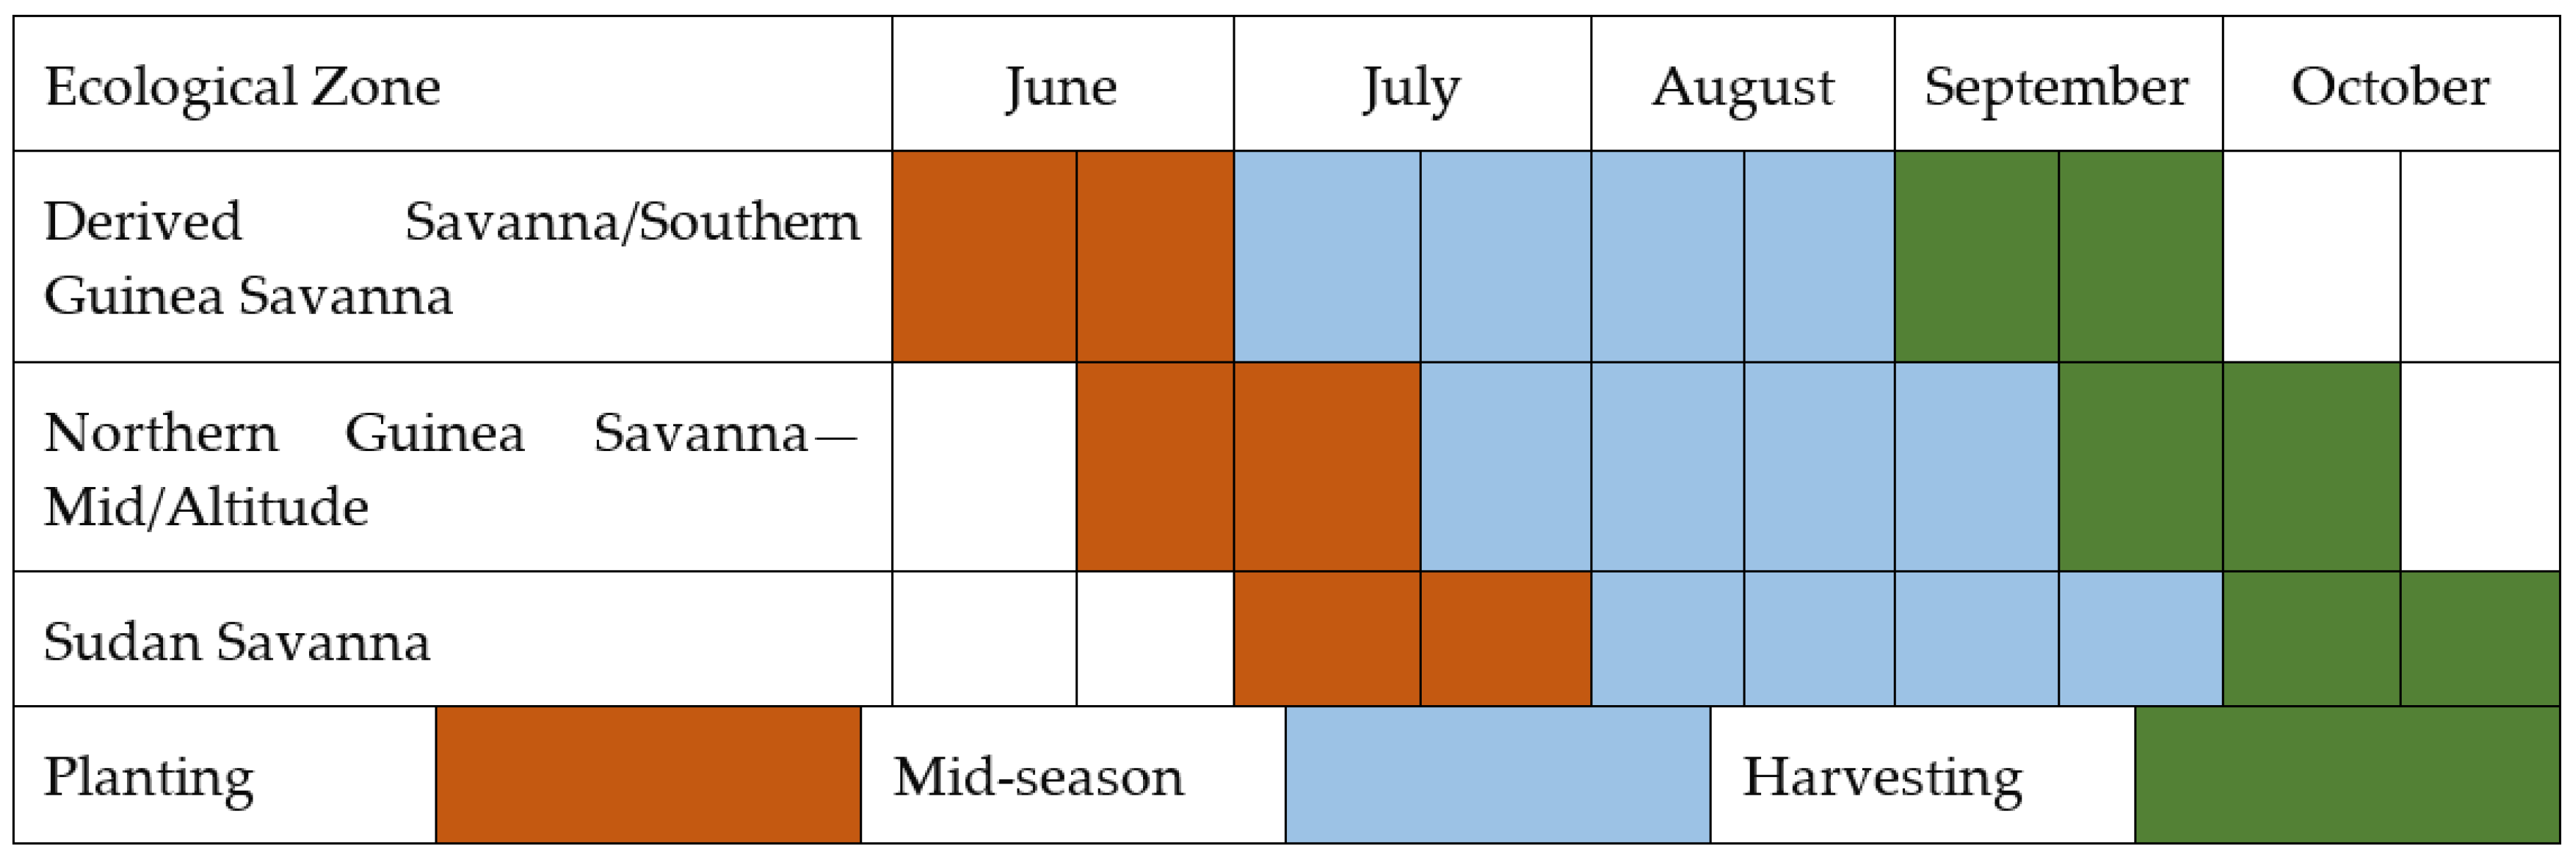
3.4. Planting Dates and Length of Growing Seasons

Optimum planting dates contribute immensely to crop yield and productivity [29]. During historical simulations, the planting date window was calibrated between 1–15 June for planting. The results show that the planting dates simulated during the historical period were within 1–4 June except for years when rainfall was delayed and occurred on 15 June. Meanwhile, the growing season of soybean ranges from 108–116 days while the mean was 112 days. On the other hand, the future simulations show that under both scenarios, no substantial changes in planting dates are projected. Moreover, climate change will significantly reduce the growing season of rainfed soybean within the basin. From the simulations, the projected growing season of soybean ranges from 96 to 112 days. When compared with the baseline, the reduction in soybean growing season will vary from 4 to 12 days.

4. Discussion

4.1. Historical Period

The increase in soybean CWR could be attributed to the increase in dry days during the “August break” of the basin which falls within the growing cycle of soybean. The variability in dry days and wet days even during the rainy season within the basin is one of the uncertainties that need to be investigated further. The differences in the temporal trends of CWR further consolidates the fact that there is a high inter-seasonal variability of water requirements across different regions [5,7,9]. Consequently, these uncertainties need to be unraveled as this will go a long way in provoking breeding of climate-resilient varieties, sustainable policy formulation and implementations.
The increasing trend in yield confirms that soybean (C3 crop) has the tendency of producing higher yields when subjected to increased temperature [13,26]. The increasing trend can, however, be attributed to elevated temperature and the slight increase of CO2 concentration. For CWP, the results stress the fact that soybean cultivated on sandy and loamy soils are productive and have higher water productivities [26]. Moreover, the CWP is increasing slightly which follows the pattern of soybean yields. This shows the urgent need to improve crop yields and at the same time improve CWP for optimum growth and production [42]. Therefore, the impact of climate change on CWP within the basin is significantly based on the baseline period. In terms of planting dates, the simulated planting dates are similar to the usual planting dates of the crops within the basin [27]. This further consolidates the fact that planting date is a huge factor that contributes to crop productivity. Delay in the onset of rainfall could be challenging for farmers, thus delay or early planting dates could lead to low yields and productivity. Climate change has been projected to alter growing seasons [11], which will likely give rise to quicker maturity of crops and could lead to bad quality of crops. It is worth noting that the simulations show a gradual reduction in growing days occasioned by increased temperature and huge variability in growing days as a result of climate variability.

4.2. Future Periods

For the future periods, under both scenarios, huge variability in CWR is projected to occur in the period of 2071–2099. This means that elevated temperature and increased CO2 concentration will affect CWR significantly. It is important to note that this study shows that the changes in future CWR under RCP 8.5 are somewhat different from the changes under RCP 4.5 due to increased CO2 concentration under RCP 8.5 compared with RCP 4.5. Even though CO2 fertilization which triggers early stomatal closure is more significant for soybean (C3 crop) than maize and millet (C4 crops) [13,26], it will not really affect soybean CWR within the basin except in the late-century under RCP 8.5. Similarly, the CWR of wheat, a C3 crop is also projected to decrease especially in the late-century despite temperature increase [43]. In addition, the consecutive dry and wet days during the growing season as projected by the climate model could influence this factor as well. This highlights the fact that rainfall variability and patterns have huge impacts on crop growth and productivity [44].
In terms of future yields, the projected increase in yields can be attributed to carbon fertilization of C3 plants such as soybean, which reveals that there will be a rapid increase in crop yield especially when soybean yields were simulated on extremely high atmospheric CO2 concentration [13,29]. Similarly, an increase in soybean yields will likely range from 5.5 to 162% and 5 to 18% in Cameroon and West Africa respectively [13,29]. In contrast, soybean yield will likely decline in Sub-Saharan African [25]. Moreover, the decline could be attributed to the GCM and crop models employed. The contradictory results in projected soybean yields further stress the fact that climate change impacts on soybean yields are temporal and spatially distributed as well as crop and GCM dependent. It confirms that while some crops will benefit from climate change, other crops will be affected negatively [7]. The results also show that fluctuations in rainfall and elevated temperature will likely have a slight influence on future soybean yields within the basin. In other studies, the yields of wheat (C3 crop) are projected to increase up to 13% [41] while rice (C3 crop) yield is projected to reduce by 10.36–14.36% [7]. Hence, it is still unclear if all C3 crops will be positively affected by climate change especially CO2 fertilization and if the effects will be location-specific or not. Furthermore, in this case, the quality of soybean needs to be evaluated under elevated temperatures and increased CO2 concentration. Even though there is a likelihood of an increase in soybean yields, it is important to research on the quality of soybean under these conditions. Achieving food security is not just about increased yields but improving the quality of yields as well.
Considering CWP, it is worthy to note that for each future period, soybean CWP under RCP 8.5 is projected to be higher than that of RCP 4.5 which is attributable to CO2 fertilization. This trend is the same as the future yields. In addition, the results show that as the temperature increases in the future years, soybean has the tendency of converting lesser crop consumptive water use into higher yields despite reduced growing seasons under both scenarios. This phenomenon can be attributed to the claim that some C3 crops such as soybean are projected to have higher CWP under higher CO2 concentration due to the positive effect of carbon fertilization [13,26,29]. Similarly, wheat CWP will likely increase by 14.6% [36] but CWP of another C3 crop, rice is expected to reduce by 28% under RCP 8.5 in the late-century [7]. Notably, this study shows that the length of the soybean growing season is projected to decrease. The highest decline in the growing season is projected in the late-century under RCP 8.5. However, there are still uncertainties about the effects of triggered fertilization and early stomatal closure on the nutritional composition of crops.
Globally, food demand is increasing, hence, it is important to ensure high crop productivity. This will ensure adequate food production even sufficient for more export and will increase farmers’ profits. Climate-smart agricultural practices such as soil conservation practices can help in improving yields and CWP [42,45], thus they should be investigated under climate change scenarios. The use of organic fertilizers, appropriate and suitable weed and pest management, cultivation of climate-resilient varieties [9] and rainwater harvesting [46] should be encouraged by the stakeholders [9]. With the increasing trend in temperature, most of the current crop varieties cannot withstand such elevated temperatures. Low yields have been recorded within Nigeria in recent times despite the ever-increasing demand for food [20]. Hence, with the development of new crop varieties, food security could be achieved. Furthermore, another adaptation strategy that needs to be reinforced is climate information services [45]. Therefore, there is a need for more funding and monitoring of meteorological stations in Nigeria. This will tremendously advance climate data accessibility and reliability.
Finally, it is important to state that this study was conducted with available, but limited data such that validation of water fluxes could not be done. Evidently, this paper forms the basis for extensive studies to be conducted that will investigate the spatial distribution of crop yield and water requirements using an ensemble of GCM within the basin and Nigeria at large.

5. Conclusions

The seasonal crop water requirements (CWR), crop yield and crop water productivity (CWP) of soybean in the Ogun-Ona River Basin in Nigeria based on the climate data of the baseline period (1986–2015) and future periods (2021–2099) were simulated. The study shows that soybean CWR and yield are temporarily increasing while CWP shows a slight increase. In addition, HadGEM2-ES downscaled by RCA4 is capable of simulating the future climate of the region satisfactorily while the quantile mapping bias correction method performed satisfactorily in removing the biases in the projected rainfall thus making it a reliable bias correction method. Just as the global temperature is expected to continually rise, the climate projections of the region show that maximum temperature will increase by 4.4 °C by 2099 under RCP 8.5 while rainfall is projected to reduce by 10% in the future periods. The future scenarios show that changes in soybean CWR will range from 10 to −10% in the future periods under RCP 4.5 and RCP 8.5. CWR was found to be largely influenced by changes in rainfall than temperature rise and increased CO2 concentration. The days of the growing season of soybean will be shortened due to temperature rise. Moreover, soybean yield and CWP are projected to have positive effects of climate change, hence increasing up to about 40% under RCP 8.5. The soybean yield is significantly influenced by increasing CO2 concentration than other changes in climate parameters. The outcomes of this study certainly offer useful information that could be implemented by stakeholders and policymakers to improve soybean productivity in Nigeria and Africa at large.
Last but not least, stakeholders and decision-makers should make use of research outcomes to tackle food and water security. Strategies addressing climate change adaptation and water allocation should enhance such studies worldwide to increase water and crop productivity.

Author Contributions

Methodology, O.S.D. and K.A.M.; analysis, modeling, validation and field visits, O.S.D.; resources, K.A.M. and O.S.D.; data, O.S.D. and K.A.M.; writing (original draft preparation), O.S.D.; writing (review, editing, and submission), K.A.M.; supervision, open access publication, K.A.M. All authors have read and agreed to the published version of the manuscript.

Funding

This research was funded by the African Union Commission through a research grant provided by the Pan African University Institute of Water and Energy Sciences (PAUWES), Algeria.

Acknowledgments

The authors thank the African Union Commission (AUC) for funding this research, the Centre for Sustainable Visions and Lund University for funding the publication of this paper in an open access journal. Many thanks to CORDEX for providing climate projection data in open access format. Last but not least, the authors appreciate the anonymous reviewers that reviewed the manuscript of this paper.

Conflicts of Interest

The authors declare no conflict of interests.

Appendix A

Table A1. The climatic parameters of the basin.
MonthTemperature (°C)Humidity (%)Wind Speed (km/Day)Solar Radiation (MJ/m2/day)Rainfall (mm/Month)
AveMinMax
January27.0120.9933.0361.7973.8614.275.27
February28.4722.1434.7961.8093.8516.3031.25
March28.7623.1734.3568.61103.9717.0473.31
April27.9923.0832.9075.5798.3116.75127.17
May27.0322.5131.5578.2885.0616.72148.83
June26.0121.9730.0680.6180.2715.44201.26
July25.0721.8328.3183.3282.0312.51195.99
August24.6921.6327.7484.4977.6211.32121.87
September25.3221.6129.0382.0268.7713.62232.17
October26.0922.0130.1680.4058.9415.11178.58
November27.2222.4032.0572.6858.8815.6823.20
December26.7921.0732.5066.6562.7114.396.77
Figure A1. Mean annual total rainfall of the basin from 1986 to 2015.
Agriculture 10 00593 g0a1
Figure A2. The average annual mean temperature of the basin from 1986 to 2015.
Agriculture 10 00593 g0a2
Figure A3. The crop cycle of soybeans in Nigeria (Authors’ figure; adapted/culled from [27]).
Agriculture 10 00593 g0a3
Table A2. The non-conservative crop parameters are used for calibration and validation.
ParametersUnitSoybean
Plant populationPlants/ha352,000
Initial canopy cover% of canopy cover0.40
Maximum canopy cover% of canopy cover90
Days from planting to emergenceGDD (Day)105 (7)
Days from planting to maximum canopy coverGDD (Day)1485 (99)
Days from planting to senescenceGDD (Day)1725 (115)
Days from planting to maturityGDD (Day)1800 (120)
Days from planting to floweringGDD (Day)607 (45)
Days from planting to maximum rooting depthGDD (Day)1635 (109)
Length building up to HIGDD (Day)510 (34)
Duration of floweringGDD (Day)420 (28)
Maximum effective rooting depthm1.6
Normalized water productivity for climate and CO2g/m215.0
Soil fertility stress-moderate
Sink strength under elevated CO2%50
Reference harvest index%40
Table A3. Model evaluation of simulated soybean yield in various soil textures for four growing seasons.
YearSoil TextureObservation (t/ha)Simulation (t/ha)R2RMSE (t/ha)MAE (t/ha)NSE
2015Loamy sand2.792.810.99 0.98
Sandy clay loam2.622.640.0170.016
Sandy loam3.063.07
2014Loamy sand2.942.94
Sandy clay loam2.882.920.960.0560.003
Sandy loam3.103.19
2013Loamy sand2.272.31
Sandy clay loam2.062.000.980.0430.002
Sandy loam2.542.56
2012Loamy sand2.572.60
Sandy clay loam2.592.570.990.0270.027
Sandy loam2.862.89

References

  1. Baarsch, F.; Granadillos, J.R.; Hare, W.; Knaus, M.; Krapp, M.; Schaeffer, M.; Lotze-Campen, H. The impact of climate change on incomes and convergence in Africa. World Dev. 2020, 126, 104699. [Google Scholar] [CrossRef]
  2. Besada, H.; Werner, K. An assessment of the effects of Africa’s water crisis on food security and management. Int. J. Water Resour. Dev. 2015, 31, 120–133. [Google Scholar] [CrossRef] [Green Version]
  3. Sylla, M.B.; Nikiema, P.M.; Gibba, P.; Kebe, I.; Klutse, N.A.B. Climate change over West Africa: Recent trends and future projections. Adapt. Clim. Change Var. Rural West Afr. 2016, 25–40. [Google Scholar] [CrossRef]
  4. FAO. The State of the World’s Land and Water Resources for Food and Agriculture: Managing Systems at Risk; Routledge: London, UK, 2016. [Google Scholar] [CrossRef]
  5. FAO. Water for Sustainable Food and Agriculture. In A Report Produced for the G20 Presidency of Germany; FAO: Rome, Italy, 2017. [Google Scholar]
  6. Rahman, M.A.; Haq, M.E.; Anjum, N. Potential crop water requirements of dry season boro rice under climate change in north-east hydrological region of Bangladesh. Agric. Eng. Int. CIGR J. 2019, 21, 1–13. [Google Scholar]
  7. Boonwichai, S.; Shrestha, S.; Babel, M.S.; Weesakul, S.; Datta, A. Climate change impacts on irrigation water requirement, crop water productivity and rice yield in the Songkhram River Basin, Thailand. J. Clean. Prod. 2018, 198, 1157–1164. [Google Scholar] [CrossRef]
  8. Masson-Delmotte, V.; Zhai, P.; Pörtner, D.; Roberts, J.; Skea, P.R.; Shukla, A.; Pirani, W.; Moufouma-Okia, C.; Péan, R.; Pidcock, S.; et al. (Eds.) Global Warming of 1.5 °C. An IPCC Special Report on the Impacts of Global Warming of 1.5°C Above Pre-Industrial Levels and Related Global Greenhouse Gas Emission Pathways, in the Context of Strengthening the Global Response to the Threat of Climate Change; World Meteorological Organization: Geneva, Switzerland, 2018; p. 32. [Google Scholar]
  9. Durodola, O.S.; Mourad, K.A. Modelling Maize Yield and Water Requirements under Different Climate Change Scenarios. Climate 2020, 8, 127. [Google Scholar] [CrossRef]
  10. Basso, B.; Hyndman, D.W.; Kendall, A.D.; Grace, P.R.; Robertson, G.P. Can impacts of climate change and agricultural adaptation strategies be accurately quantified if crop models are annually re-initialized? PLoS ONE 2015, 10, e0127333. [Google Scholar] [CrossRef] [Green Version]
  11. Ding, Y.; Wang, W.; Song, R.; Shao, Q.; Jiao, X.; Xing, W. Modeling spatial and temporal variability of the impact of climate change on rice irrigation water requirements in the middle and lower reaches of the Yangtze River, China. Agric. Water Manag. 2017, 193, 89–101. [Google Scholar] [CrossRef]
  12. Li, J.; Zhu, T.; Mao, X.; Adeloye, A.J. Modeling crop water consumption and water productivity in the middle reaches of Heihe River Basin. Comput. Electron. Agric. 2016, 123, 242–255. [Google Scholar] [CrossRef]
  13. Roudier, P.; Sultan, B.; Quirion, P.; Berg, A. The impact of future climate change on West African crop yields: What does the recent literature say? Glob. Environ. Change 2011, 21, 1073–1083. [Google Scholar] [CrossRef] [Green Version]
  14. Wang, J.; Liu, X.; Cheng, K.; Zhang, X.; Li, L.; Pan, G. Winter wheat water requirement and utilization efficiency under simulated climate change conditions: A Penman-Monteith model evaluation. Agric. Water Manag. 2018, 197, 100–109. [Google Scholar] [CrossRef]
  15. Adeboye, O.B.; Schultz, B.; Adekalu, K.O.; Prasad, K.C. Performance evaluation of AquaCrop in simulating soil water storage, yield, and water productivity of rainfed soybean (Glycine max L. merr) in Ile-Ife, Nigeria. Agric. Water Manag. 2019, 213, 1130–1146. [Google Scholar] [CrossRef]
  16. Hula, M.A.; Udoh, J.C. An assessment of the impact of flood events in Makurdi, Nigeria. Civil. Environ. Res. 2015, 7, 53–60. [Google Scholar]
  17. Idowu, A.A.; Ayoola, S.O.; Opele, A.I.; Ikenweiwe, N.B. Impact of Climate Change in Nigeria. Iran. J. Energy Environ. 2011, 2, 145–152. [Google Scholar]
  18. Durodola, O.S. The Impact of Climate Change Induced Extreme Events on Agriculture and Food Security: A Review on Nigeria. Agric. Sci. 2019, 10, 487–498. [Google Scholar] [CrossRef] [Green Version]
  19. Idumah, F.O.; Mangodo, C.; Ighodaro, U.B.; Owombo, P.T. Climate Change and Food Production in Nigeria: Implication for Food Security in Nigeria. J. Agric. Sci. 2016, 8, 74. [Google Scholar] [CrossRef] [Green Version]
  20. Olayide, O.E.; Tetteh, I.K.; Popoola, L. Differential impacts of rainfall and irrigation on agricultural production in Nigeria: Any lessons for climate-smart agriculture? Agric. Water Manag. 2016, 178, 30–36. [Google Scholar] [CrossRef] [Green Version]
  21. Mourad, K.A.; Gaese, H.; Jabarin, S.A. Economic value of tree fruit production in Jordan Valley from a virtual water perspective. Water Resour. Manag. 2010, 24, 2021–2034. [Google Scholar] [CrossRef]
  22. Mourad, K.A.; Berndtsson, R. Grapes as an alternative crop for water saving. In Grapes: Cultivation, Varieties and Nutritional Uses; Murphy, R.P., Steifler, C.K., Eds.; Nova Science Publishers Inc.: London, UK, 2012; pp. 183–192. [Google Scholar]
  23. Ewaid, S.H.; Abed, S.A.; Al-Ansari, N. Crop water requirements and irrigation schedules for some major crops in southern Iraq. Water 2019, 11, 756. [Google Scholar] [CrossRef] [Green Version]
  24. Raes, D.; Steduto, P.; Hsiao, T.C.; Fereres, E. Aquacrop-The FAO crop model to simulate yield response to water: II. main algorithms and software description. Agron. J. 2009, 101, 438–447. [Google Scholar] [CrossRef] [Green Version]
  25. Gbegbelegbe, S.; Alene, A.; Kamara, A.; Wiebe, K.; Manyong, V.; Abdoulaye, T.; Mkandawire, P. Ex-ante evaluation of promising soybean innovations for sub-Saharan Africa. Food Energy Secur. 2019, 8, 1–16. [Google Scholar] [CrossRef] [PubMed] [Green Version]
  26. Steduto, P.; Hsiao, T.C.; Fereres, E.; Raes, D. Crop. Yield Response to Water; FAO Irrigation and Drainage: Rome, Italy, 2012. [Google Scholar]
  27. Dugje, I.Y.; Omoigui, L.O.; Ekeleme, F.; Bandyopadhyay, R.; Lava Kumar, P.; Kamara, A.Y. Farmers’ Guide to Soybean Production in Northern Nigeria; International Institute of Tropical Agriculture: Ibadan, Nigeria, 2009. [Google Scholar]
  28. Kumagai, E.; Kumagai, N.; Masuya, Y.; Shimono, H. Phenotypic Plasticity Conditions the Response of Soybean Seed Yield to Elevated Atmospheric CO2 Concentration. Plant Physol. 2015, 169, 2021–2029. [Google Scholar] [CrossRef] [PubMed] [Green Version]
  29. Tingem, M.; Rivington, M. Adaptation for crop agriculture to climate change in Cameroon: Turning on the heat. Mitig. Adapt. Strateg. Glob. Change 2009, 14, 153–168. [Google Scholar] [CrossRef]
  30. Vanuytrecht, E.; Raes, D.; Steduto, P.; Hsiao, T.C.; Fereres, E.; Heng, L.K.; Mejias Moreno, P. AquaCrop: FAO’s crop water productivity and yield response model. Environ. Model. Softw. 2014, 62, 351–360. [Google Scholar] [CrossRef]
  31. Hsiao, T.C.; Heng, L.; Steduto, P.; Rojas-Lara, B.; Raes, D.; Fereres, E. Aquacrop-The FAO crop model to simulate yield response to water: III. Parameterization and testing for maize. Agron. J. 2009, 101, 448–459. [Google Scholar] [CrossRef]
  32. Allen, R.G.; Pereira, L.S.; Raes, D.; Smith, M. Crop Evapotranspiration: Guidelines for Computing Crop Water Requirements; FAO Irrigation and Drainage Paper: Rome, Italy, 1998. [Google Scholar]
  33. Fisher, D.K.; Pringle, H.C. III Evaluation of alternative methods for estimating reference evapotranspiration. Agric. Sci. 2013, 4, 51–60. [Google Scholar] [CrossRef] [Green Version]
  34. FAO. AquaCrop Training Handbook-Book I. Understanding AquaCrop; Food and Agriculture Organisation: Rome, Italy, 2017. [Google Scholar]
  35. Fischer, G.; Nachtergaele, F.; Prieler, S.; van Velthuizen, H.T.; Verelst, L.; Wiberg, D. Harmonized world soil database v1.2. Glob. Agro Ecol. Zones Assess. Agric. 2008, 8, 10. [Google Scholar]
  36. Sotona, T.; Salako, F.K.; Adesodun, J.K. Soil physical properties of selected soil series in relation to compaction and erosion on farmers’ fields at Abeokuta, southwestern Nigeria. Arch. Agron. Soil Sci. 2014, 60, 841–857. [Google Scholar] [CrossRef]
  37. Luhunga, P.M. Assessment of the Impacts of Climate Change on Maize Production in the Southern and Western Highlands Sub-agro Ecological Zones of Tanzania. Front. Environ. Sci. 2017, 5, 51. [Google Scholar] [CrossRef] [Green Version]
  38. Akinsanola, A.A.; Ajayi, V.O.; Adejare, A.T.; Adeyeri, O.E.; Gbode, I.E.; Ogunjobi, K.O.; Abolude, A.T. Evaluation of rainfall simulations over West Africa in dynamically downscaled CMIP5 global circulation models. Theor. Appl. Climatol. 2018, 132, 437–450. [Google Scholar] [CrossRef]
  39. Ayugi, B.; Tan, G.; Niu, R.; Babaousmail, H.; Ojara, M.; Wido, H.; Ongoma, V. Quantile Mapping Bias Correction on Rossby Centre Regional Climate Models for Precipitation Analysis over Kenya, East Africa. Water 2020, 12, 801. [Google Scholar] [CrossRef] [Green Version]
  40. Heo, J.H.; Ahn, H.; Shin, J.Y.; Kjeldsen, T.R.; Jeong, C. Probability distributions for a quantile mapping technique for a bias correction of precipitation data: A case study to precipitation data under climate change. Water 2019, 11, 1475. [Google Scholar] [CrossRef] [Green Version]
  41. Liben, F.M.; Wortmann, C.S.; Yang, H.; Lindquist, J.L.; Tadesse, T.; Wegary, D. Crop model and weather data generation evaluation for conservation agriculture in Ethiopia. Field Crops Res. 2018, 228, 122–134. [Google Scholar] [CrossRef]
  42. Adeboye, O.B.; Schultz, B.; Adekalu, K.O.; Prasad, K. Soil water storage, yield, water productivity and transpiration efficiency of soybean (Glyxine max L.Merr) as affected by soil surface management in Ile-Ife, Nigeria. Int. Soil Water Conserv. Res. 2017, 5, 141–150. [Google Scholar] [CrossRef]
  43. Chattaraj, S.; Chakraborty, D.; Sehgal, V.K.; Paul, R.K.; Singh, S.D.; Daripa, A.; Pathak, H. Predicting the impact of climate change on water requirement of wheat in the semi-arid Indo-Gangetic Plains of India. Agric. Ecosyst. Environ. 2014, 197, 174–183. [Google Scholar] [CrossRef]
  44. Sultan, B.; Guan, K.; Kouressy, M.; Biasutti, M.; Piani, C.; Hammer, G.L.; Lobell, D.B. Robust features of future climate change impacts on sorghum yields in West Africa. Environ. Res. Lett. 2014, 9, 104006. [Google Scholar] [CrossRef]
  45. Partey, S.T.; Zougmoré, R.B.; Ouédraogo, M.; Campbell, B.M. Developing climate-smart agriculture to face climate variability in West Africa: Challenges and lessons learnt. J. Clean. Prod. 2018, 187, 285–295. [Google Scholar] [CrossRef]
  46. Durodola, O.S.; Bwambale, J.; Nabunya, V. Using every drop: Rainwater harvesting for food security in Mbale, Uganda. Water Pract. Technol. 2020, 15, 295–310. [Google Scholar] [CrossRef]
Figure 1. The flowchart of the methodology employed.
Agriculture 10 00593 g001
Figure 2. The geographical location of the study area.
Agriculture 10 00593 g002
Figure 3. Temporal variability of CWR.
Agriculture 10 00593 g003
Figure 4. Temporal variability of yield.
Agriculture 10 00593 g004
Figure 5. Temporal variability of CWP.
Agriculture 10 00593 g005
Figure 6. Simulated future CWR under RCP 4.5 (a)and RCP 8.5 (b).
Agriculture 10 00593 g006
Figure 7. Simulated future yields under RCP 4.5 (a) and RCP 8.5 (b).
Agriculture 10 00593 g007
Figure 8. Simulated future CWP under RCP 4.5 (a)and RCP 8.5 (b).
Agriculture 10 00593 g008
Figure 9. Temporal changes in future CWR under RCP 4.5 and RCP 8.5 (2021–2099) relative to the baseline (1986–2015).
Agriculture 10 00593 g009
Figure 10. Temporal changes in future yields under RCP 4.5 and RCP 8.5 (2021–2099) relative to the baseline (1986–2015).
Agriculture 10 00593 g010
Figure 11. Temporal changes in future CWP under RCP 4.5 and RCP 8.5 (2021–2099) relative to the baseline (1986–2015).
Agriculture 10 00593 g011
Table 1. Calibrated soil properties and descriptions in the model.
Soil Texture (0–100 cm)PWPFCSATTAWKsat
(vol. %)(vol. %)(vol. %)(mm/m)(mm/Day)
Loamy sand8.014.046.060.01560.0
Sandy clay loam17.727.543.098.0214.0
Sandy loam11.519.043.375.0804.4
Table 2. Statistical evaluation of HadGEM2-ES downscaled by RCA4 on historical data (1976–2005).
Statistical ParametersR2RMSE (mm)MAE (mm)NSE
Rainfall (before bias correction)0.543.272.25−0.11
Rainfall (after bias correction)0.750.520.430.76
Minimum temperature0.840.920.720.74
Maximum temperature0.850.890.680.75
Table 3. Changes in rainfall, minimum and maximum temperatures for future periods under Representative Concentration Pathway (RCP) 4.5 and 8.5 scenarios relative to mean of the baseline period (1986–2015).
Climatic ParametersBaseline (1986–2015)Relative Changes
RCP 4.5RCP 8.5
2021–20402041–20702071–20992020–20402041–20702071–2099
Rainfall (mm)1340−140 (−10.4%)45 (3.4%)−110 (−8.2%)−130 (−9.7%)−110 (−8.2%)−130 (−9.7%)
Minimum temperature (°C)22.30.9 (4.0%)1.4 (6.3%)2.4 (10.8%)1.4 (6.3%)2.4 (10.8%)4.2 (18.4%)
Maximum temperature (°C)31.61.2 (3.8%)1.9 (6.1%)2.7 (8.5%)1.5 (4.8%)2.8 (8.9%)4.4 (13.9%)
Publisher’s Note: MDPI stays neutral with regard to jurisdictional claims in published maps and institutional affiliations.

