Article

Impacts of the Winter Pea Crop (Instead of Rapeseed) on Soil Microbial Communities, Nitrogen Balance and Wheat Yield

by
Cyrine Rezgui
1,
Wassila Riah-Anglet
1,*,
Marie Benoit
2,
Pierre Yves Bernard
1,
Karine Laval
1 and
Isabelle Trinsoutrot-Gattin
1
1
UniLaSalle, AGHYLE Research Unit UP 2018.C101, Rouen Team, 3 Rue du Tronquet, F-76134 Mont-Saint Aignan, France
2
ISARA, Higher Education Institution, 69007 Lyon, France
*
Author to whom correspondence should be addressed.
Agriculture 2020, 10(11), 548; https://doi.org/10.3390/agriculture10110548
Submission received: 21 October 2020 / Revised: 4 November 2020 / Accepted: 12 November 2020 / Published: 14 November 2020
(This article belongs to the Special Issue Plant–Soil Interactions and Agroecosystem Functioning)

Abstract

:
Due to legume-based systems improving several aspects of soil fertility, the diversification of agrosystems using legumes in crop succession is gaining increasing interest. The benefits of legumes aroused the interest of farmers in the association of the Economic and Environmental Interest Group (EEIG), who introduced the idea of using the winter pea instead of rapeseed in their crop succession. The aim of this study is to evaluate the effects of the winter pea compared to those of rapeseed, as a head crop of the rotation, on soil microbial communities, enzyme activities, nitrogen (N) balance and yields. The field experiment involved two farmer plots that were selected within the EEIG. In each plot, two crop successions, including winter pea–wheat and rapeseed–wheat with fertilized and unfertilized strips, were examined for two years. Three times a year, under the wheat crop, composite soil samples were collected at depths of 0–20 cm, for microbial abundance and enzyme activity analyses, and twice a year at a depth of 0–60 cm, for the measuring of the mineral N. The results showed that the rapeseed–wheat succession maintained or enhanced soil bacterial and fungal biomasses and their enzyme activities. The winter pea–wheat succession enriched the soil’s mineral N content more consistently than the rapeseed–wheat succession. The mineral N enhancement’s effect was maintained under the wheat crop. Overall, the impact of the winter pea was positive on the soil’s N dynamics, but wheat yields were equivalent regardless of the previous crop (winter pea or rapeseed with and without fertilization). In the Normandy region, as rapeseed requires a large amount of N fertilizer and pesticide to maintain the yield and quality of crop products, it is suitable to favor the introduction of the winter pea as the head crop of the rotation, which indirectly allows for a reduction in the costs of input production and use, the working time of farmers and environmental pollution.

1. Introduction

In Europe, innovative practices have been identified as prominent measures for increasing the resilience of the agricultural system [1,2,3,4], developing adaptation strategies to mitigate the impact of climate change [5,6] and improving ecosystem services [7]. Among these practices, crop rotation has emerged as a way of reducing the impact of agricultural management on environmental changes. Consequently, the Common Agricultural Policy (CAP) of the European Commission (2011) considered the diversification of crop rotations as a key measure for establishing a more sustainable agriculture. The design of crop rotation has many agronomic, economic and environmental benefits compared to monoculture cropping [8,9]. It is well accepted that optimized crop rotation has various benefits, not only for growers but also for the environment, as increasing crop diversity can enhance the heterogeneity of the soil nutrients pool [10], soil physical structure [11] and functional microorganisms at different spatial scales [12,13], which lead to improved soil health, crop yields [14] and a decreased requirement for synthetic fertilizer [15].
In this context, legume crops play an important role and can provide a variety of services that are consistent with the principles of sustainability [16]. Indeed, legumes are advantageous for soils due to their symbiotic relationship with nitrogen-fixing bacteria [17]. The presence of compatible rhizobia combined with N-limited conditions promotes symbiosis—the most efficient way for legumes to acquire more N. Compared to non-nodulated plants, symbiosis provides a competitive advantage by increasing N levels up to 5-fold [18,19]. Thus, the symbiotic fixation of N2 provides between 40% and 90% of the legume’s N requirement. This mechanism is highly dependent on nitrate concentration; for example, the symbiotic fixation of peas stops when the soil nitrate concentration reaches the equivalent of 40 kg ha−1 and restarts as soon as the concentration is decreased [20]. This study also showed that these fluctuations have no impact on yield or seed protein content.
Crop rotation with grain legumes can improve productivity and yield quality by increasing the protein content of the following crop due to increased soil available N from biological fixation after legumes [21,22]. The availability of N after a legume crop is greater than after a non-legume crop [23,24]. In fact, compared to wheat harvests, higher soil mineral N concentrations have been reported after harvesting pea, chickpea, barley and lupine crops [25,26,27]. Angus et al. [22] showed that wheat crops usually yield more when grown after legumes (peas, faba beans, chickpeas, lentils, lupins, etc.) than after wheat. More specifically, different crops can produce various residues and root exudates, which are considered to be the main factors to boost soil microbial diversity and activity, increase soil microbial biomass and carbon (C) and facilitate N cycling [12,28,29,30]. Some non-mycorrhizal plants, such as canola and mustard, cannot establish symbiotic relationships with some functional rhizobacteria; thus, they require more mineral fertilizer [31], which could change the soil physicochemical state in the long term. However, their implementation in rotation can suppress both arbuscular mycorrhizal fungal populations and the mycorrhizal formation process for the following crop, restricting their functions in soil [32].
The diversification of agrosystems by increasing the numbers of cultivated species and the use of legumes in crop rotation is attracting increasing interest. The benefits of this crop aroused the interest of the farmers of the EEIG, who are interested in improving their practices, productivity and the soil health of their farms. They opted for the introduction of winter pea crops to replace rapeseed in crop rotation so as to develop the economic, environmental and social performance of their farms. The winter pea has several advantages including weed control, water stress management, a reduced risk of Aphanomyces euteiches, reduced insects and pests and improved soil cover and farmers’ working time management [33]. These advantages are mainly due to the staggered stages of winter pea cropping compared to spring pea cropping [34].
The present study focused on the evaluation of the impact of the introduction of the winter pea compared to rapeseed on the following cereal crops in Normandy. We hypothesized that the two previous crops (winter pea–wheat and rapeseed–wheat) would distinctly (i) affect soil microbial communities and their activities in relation to C and N turnover, (ii) impact the N balance and loss in the environment and (iii) affect the following crop (wheat yield) in different ways. For this purpose, the abundance of total, bacterial and fungal biomasses and soil enzyme activities involved in the C and N cycles were monitored at three sampling dates and the N balance at two sampling dates during the two crop successions.

2. Materials and Methods

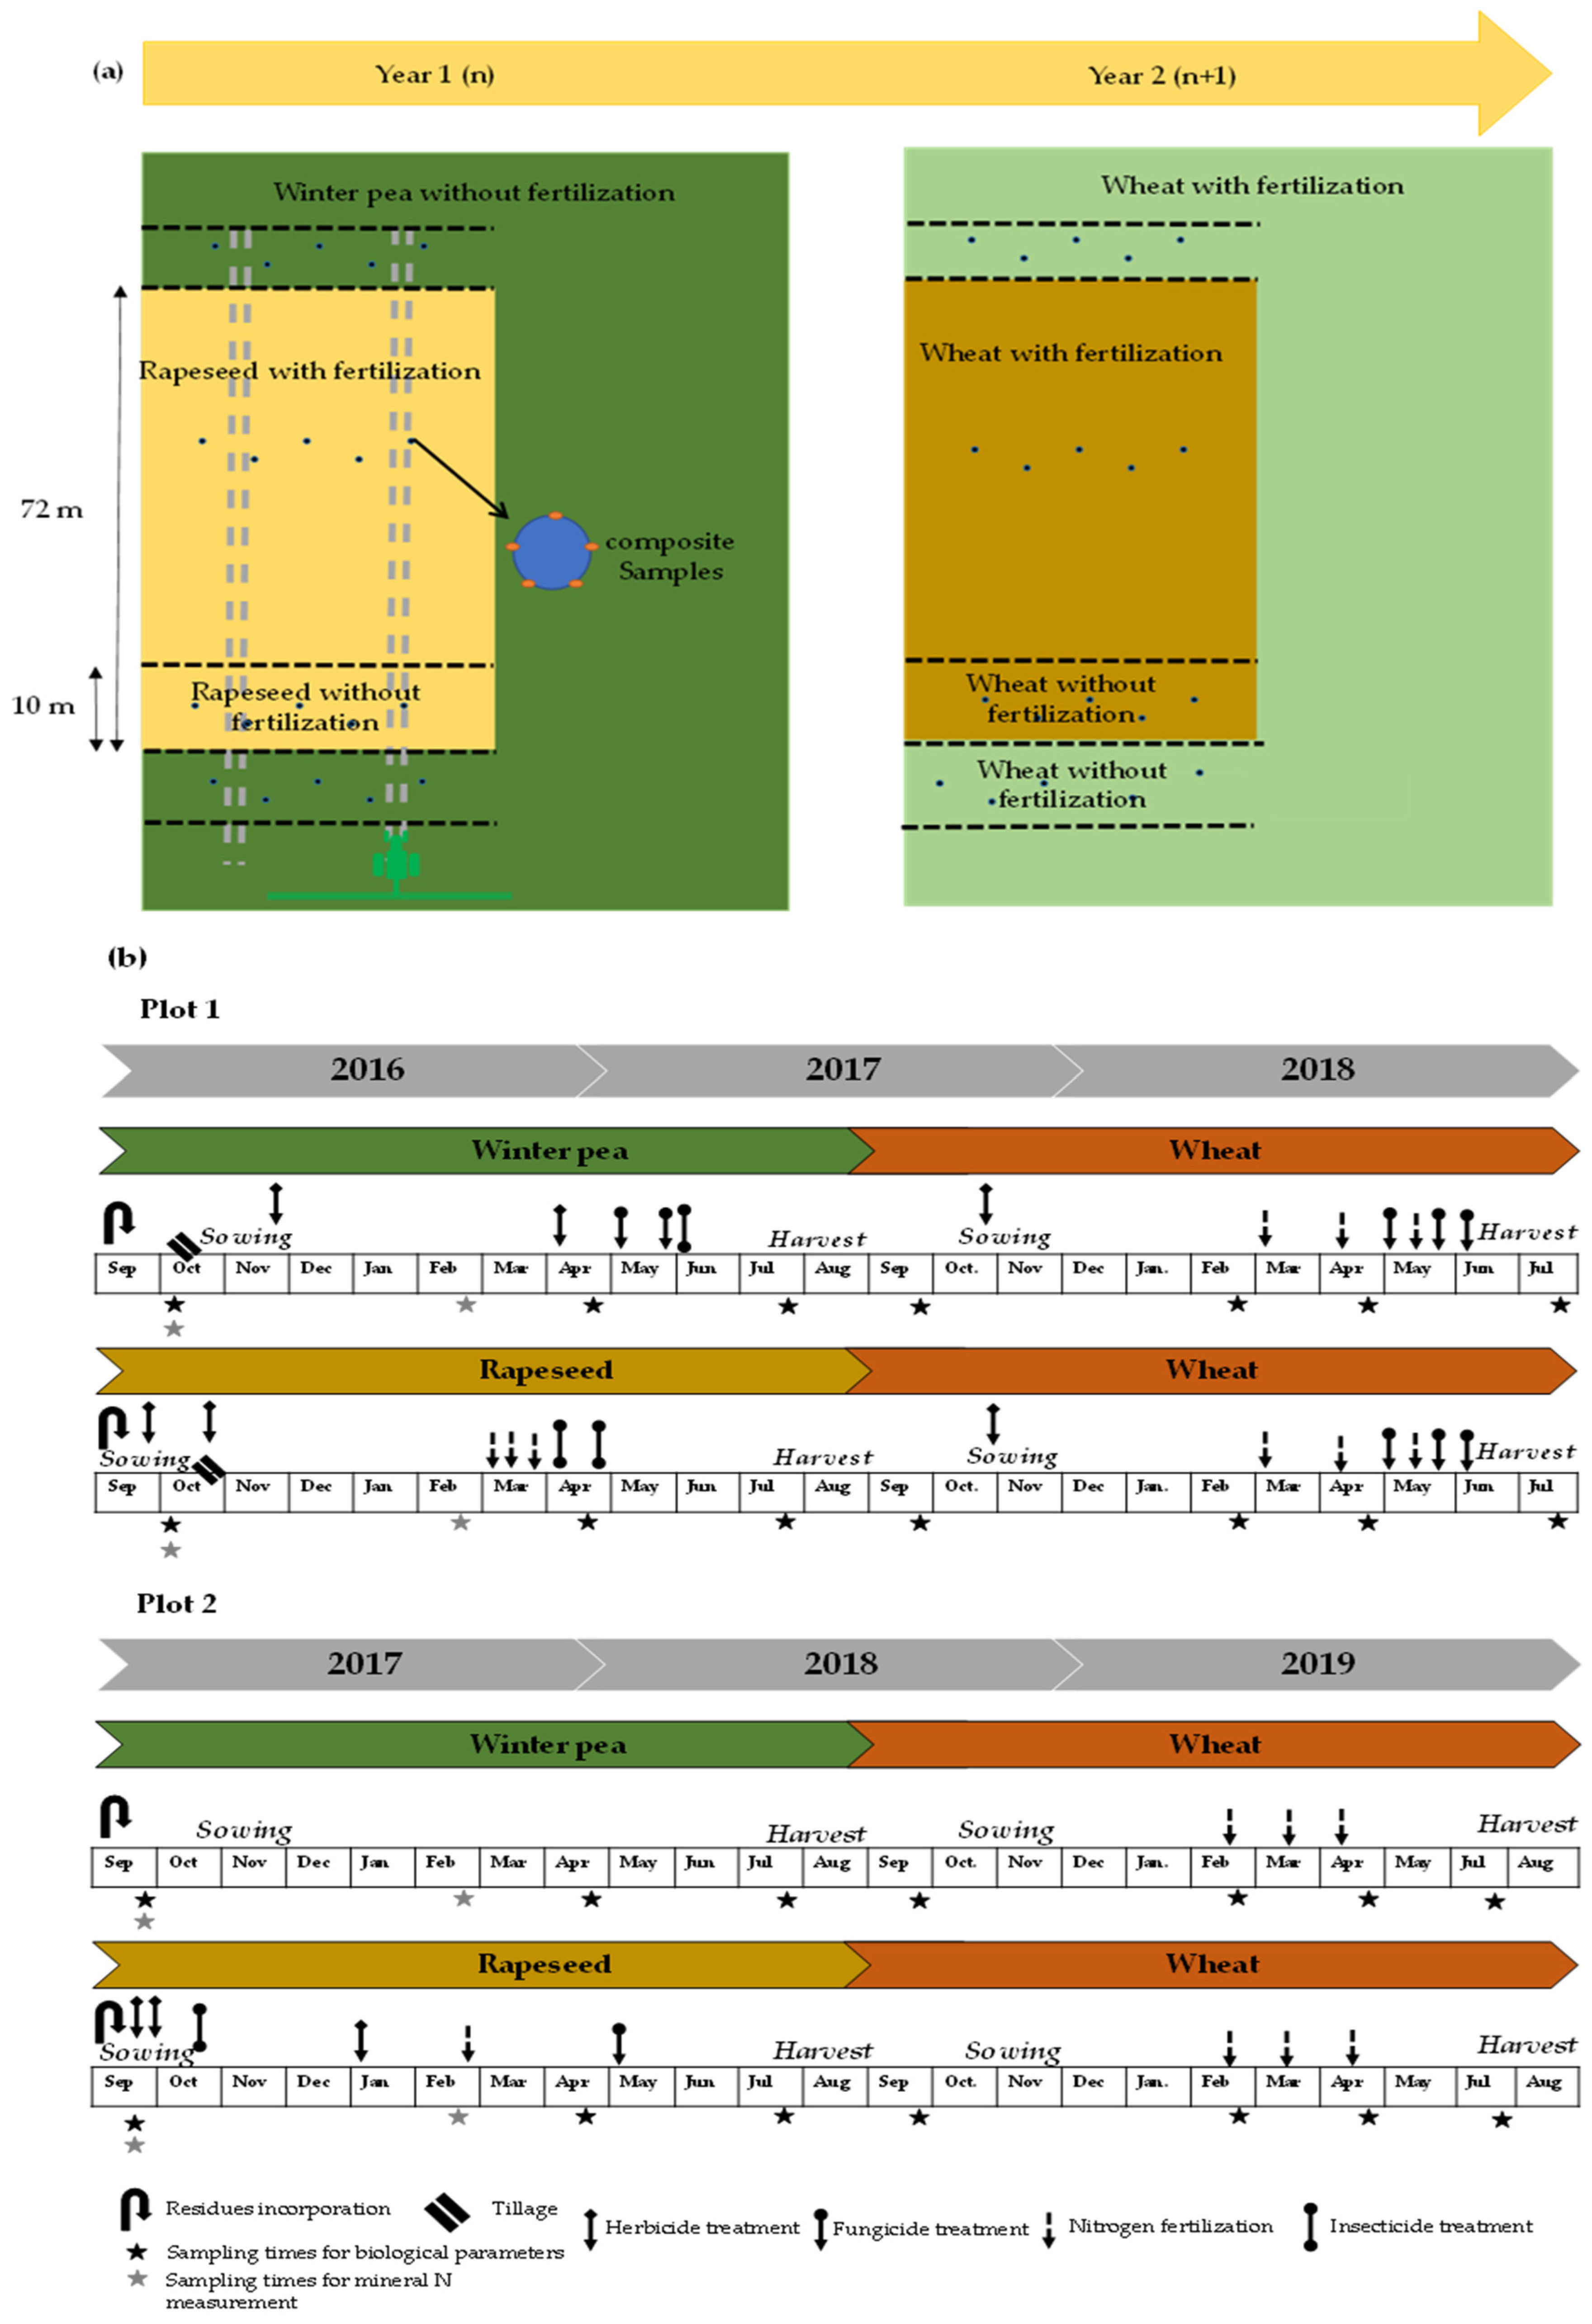
2.1. Experimental Design and Soil Sampling

The present study was conducted in two plots (49°46′48.62″ N, 01°41′25.08″ E; 49°45′48.30″ N, 1°27′23.39″ E) in real agricultural context to evaluate the effects of the introduction of the winter pea and rapeseed on crop succession. The study was carried out in Pays de Bray, which is in the Normandy region of Northwestern France. This area has a temperate oceanic climate. The mean daily maximum and minimum air temperatures range from 13 to 24 °C (June–July) and 5 to 10 °C (January–February). The precipitation varied by an average of 752 mm in 2016, 625 mm in 2017, 738 mm in 2018 and 807 mm in 2019.
The two agricultural plots were located on two different farms that were owned by members of the EEIG. The plots were chosen because of their soil characteristics, which were representative of the common pedological types of soil in Normandy (Table 1). The soil at plot 1 was sandy loam based on the French soil textural classification GEPPA (Groupe d‘Etude pour les Problèmes de Pédologie Appliquée). This soil had 17.15 ± 3.82 g kg−1 of total C and 1.28 ± 0.20 g kg−1 of total N. The soil at plot 2 was loamy clay, which had 28.35 ± 2.97 g kg−1 of total C and 1.45 ± 0.36 g kg−1 of total N. The two soils exhibited alkaline pH (water) levels around 7.5 ± 0.12.
For the experimental design, each plot was divided into two blocks including fertilized and unfertilized strips (10 m) (Figure 1a). Over a two-year period (2016–2018 for the first plot and 2017–2019 for the second), the winter pea–wheat and rapeseed–wheat successions of each plot were examined; the crop establishment and crop management plans are presented in Figure 1b.

2.2. Soil Sample Collection

The sampling procedure was similar across the two plots. For each plot, five composite soil samples were collected from depths of 0–20 cm and 0–60 cm for the measurement of biological and mineral N, respectively. Each composite soil sample comprised five soil cores. At the time of sampling, a total of 40 (two plots × four treatments × five replicates) and 20 composite samples (two plots × two depth × five replicates) were collected for biological and mineral N analysis, respectively. Samples were sieved at 2 mm and subsequently homogenized. Fresh soil stored at −20 °C was used for biological analyses, and air-dried soil was used for physical and chemical analyses. Soil sampling was carried out four times a year under crops in spring (March–April), summer (July–August), autumn (September–October) and winter (February).

2.3. Soil Physical and Chemical Characterization

Moisture content was recorded after drying 30 g of soil at 105 °C for 24 h. Soil texture was determined using five grams of air-dried soil that had been treated with HCl solution to remove soil carbonate before adding H2O2 at 33% to eliminate soil organic matter, and finally sodium hexametaphosphate solution was used to break up the soil particles. Particle size distributions (%) were measured by laser granulometer Malvern Mastersizer (Malvern Instruments, Malvern, UK) [35]. Soil pH in H2O was measured with a glass electrode in 1:2:5 suspension (NF ISO 10390:2005).
For total organic carbon (TOC), samples were air-dried and sieved at 200 µm. TOC was analyzed using the TOC-Analyzer (Schimatzu-TOC-5050A, Kyoto, Japan). The total carbon (TC) was measured by the combustion of 50 mg of soil at 900 °C, which allowed it to convert to CO2. The released gas was measured with an infrared cell. For inorganic carbon (IC), 50 mg of soil was initially treated with phosphoric acid to dissolve the IC. Finally, the organic carbon (org C) was determined by subtracting the IC from the TC [35].
Total nitrogen (TN) was quantified using the Kjeldahl method. This method is based on the digestion of organic N into ammonium ions (NH4+) with concentrated sulfuric acid (H2SO4), which is then followed by a distillation step. This step consisted of collecting the vapor released from the digested soil sample in an Erlenmeyer flask that contained sulfuric acid and drops of red methyl. Next, an acid-base titration step by adding alkalin (NaOH) was completed.
The determination of the concentration of the total mineral N involved the extraction of the mineral N from 25 g of soil using 100 mL of 1 M KCl. Soil samples were shaken for one hour with 100 mL of 1 M KCl and filtered using Whatman no. 40 filter paper. Filtered soil solutions were stored at −20 °C ± 2 °C until analysis. Three replicates were performed for each treatment.

2.4. Total DNA Extraction and Real-Time PCR Amplification

Nucleic acids were extracted from 0.5 g of soil using a FastDNA SPIN Kit for soil (MP-Biomedicals, Santa Ana, CA, USA), following the instructions from the manufacturer. Three replicates were performed for each treatment. The soil DNA concentrations was assessed by fluorimetry using the Fluorescent DNA quantitation Kit Hoechst 33258 (Biorad, Hercules, CA, USA), following the manufacturer’s instructions. The DNA solutions were stored at at −20 °C until use [36].
The 18S rDNA amplifications for fungal biomass estimation by 18S rDNA real-time qPCR were carried out with a total volume of 25 µL. The qPCR mix was prepared as follows: 5 ng of soil microbial DNA, 0.5 µM of each primer (FU18S1 5′-GGAAACTCACCAGGTCCAGA-3′ and Nu-SSU-1536 5′-ATTGCAATGCYCTATCCCCA-3′) [37], 25 µL of LightCycler1 480 DNA SYBR Green I Master mix (Roche, Basel, Switzerland) and 0.25 mg·mL−1 BSA (GeneON Bioscience, Ludwigshafen, Germany). Standard curves were obtained using serial dilutions of linearized plasmids containing the cloned 18S rRNA gene of Fusarium graminearum, and the results are expressed as 18S rDNA gene copy number per gram of dry soil. The amplification protocol (40 cycles of PCR, 20 s at 95 °C, 30 s at 62 °C and 30 s at 72 °C) was performed using LightCycler 480 real-time PCR system (Roche, Basel, Switzerland)). The efficiency of the qPCR ranged from 93% to 98%.
The 16S rDNA amplifications for bacterial biomass estimation by 16S rDNA real-time PCR were carried out under the same conditions as the 18S rDNA PCR, with the exception of the primers (63f 5′-CAGGCCTAACACATGCAAGTC-3′ [38] and BU16S4 5′-CTGCTGCCTCCCGTAGG-3′), which were derived from 341F [39]. The efficiency of the qPCR ranged from 98% to 100%. Standard curves were obtained using serial dilutions of linearized plasmids that contained the cloned 16S rRNA genes from the Pseudomonas aeruginosa, and the results are expressed as 16S rDNA gene copy number per gram of dry soil. Two independent qPCR assays were performed for the bacterial and fungal dsDNA estimation. Three replicates were performed for each treatment.

2.5. Enzyme Activities

β-D-glucosidase (GLU; EC: 3.2.1.21), N-acetyl-β-glucosaminidase (NAG; EC: 3.2.1.30) and arylamidase (ARYLN; EC: 3.5.1.5) activities are involved in the decomposition of different substrates with varying complexity in relation to C and N cycling. Soil potential enzyme activity measurements were performed in 96-well microplates in triplicate using the procedure detailed in the ISO 20130:2018. In brief, for GLU and NAG activities, four-gram soil samples were mixed for 10 min at 250 rpm with 25 mL water. Soil solutions were incubated respectively with 4-nitrophenyl β-D-glucopyranoside 0.05 M (301.3 g·mol−1, Sigma-Aldrichn, Merck KGaA, Darmstadt, Germany) and 4-N-acetyl-β-D-glucosaminide 0.01 M (342.3 g mol−1, Sigma-Aldrichn, Merck KGaA, Darmstadt, Germany). The reaction was stopped with 0.5 M CaCl2 and 0.1 M Tris at pH 12, each plate was centrifuged for five minutes at 1500× g and absorbance was measured on a Varioskan Flash-Thermo microplate reader. The amounts of p-nitrophenol were obtained by measuring the absorbance at λ = 405 nm, with comparison to calibration curves. For ARYLN activity, four-gram soil samples were mixed for 10 min at 250 rpm with 25 mL with Trizma base (50 mM, pH 7.5). Soil solutions were incubated with L-leucine β-naphthylamide hydrochloride 0.008 M (292.8 g·mol−1, Sigma-Aldrichn, Merck KGaA, Darmstadt, Germany). The β-naphthylamine produced was extracted with acidified ethanol and converted to an azo compound by reacting with p-dimethylaminocinnamaldehyde (DMCA) (DMCA: 175.23 g·mol−1 and ethanol 96%). The amount of β-naphthylamine was obtained by measuring the absorbance at λ = 540 nm and comparing it with calibration curves. Three replicates were performed for each treatment. Activities of soil enzymes were expressed as n moles of hydrolyzed substrate per minute per one gram of dry soil corresponding to mU g−1 dry soil. For each soil sample, the geometric mean (GMea) of enzyme activities was calculated as described by García-Ruiz et al. [40]:
GMea = 3√GLU × NAG × ARYLN

2.6. STICS Simulation

The Simulateur mulTIdisciplinaire pour les Cultures Standard, or multidisciplinary simulator for standard crops (STICS) soil crop model was used for simulating yield, soil mineral N content, leaching and gaseous N emissions driven by daily climatic data [41]. Daily values for minimum and maximum temperature, solar radiation, average wind speed and relative humidity were available for the experimental periods at each plot. Soil parameters described above were provided as basic information for both plots. Information on field management, such as previous crops, sowing and harvest date, crop variety and density, sowing depth, soil tillage, fertilizer management and crop residue management, were also provided to set up the simulations. The simulation task was designed to simulate two successive crops (winter pea–wheat and rapeseed–wheat) in different soil conditions. Only single-year simulation was considered in this study. Simulations were set up using the initial values for the first year of simulations and used estimates of the initial values to simulate the subsequent years separately [42]. However, because of operability, the year simulation was driven by initializing the model each year of the simulation period using the same initial values.

2.7. Statistical Analysis

Statistical tests were carried out to evaluate the effects of the sampling dates (autumn, spring and summer), two treatments (with and without fertilization) and the two successive crops (winter pea–wheat and rapeseed–wheat) on soil physicochemical parameters, the total microbial biomass (dsDNA), the total bacterial (16S rDNA gene copy number) and fungal (18S rDNA gene copy number) communities, enzyme activities (GLU, NAG and ARYLN), GMea and mineral N content in the two studied soil plots. The measured data were compared by using Tukey’s test with significant differences at 5% (p < 0.05).
Principal component analyses (PCA) were performed to analyze the changes in all the measured data for each plot under wheat to evaluate the effects of the two tested successions (winter pea–wheat and rapeseed–wheat) with and without fertilization treatments in plots 1 and 2. The calculations were performed using R (The R Development Core Team, 2019; http://www.R-project.org).

3. Results

3.1. Effect of the Implementation of the Two Crop Successions

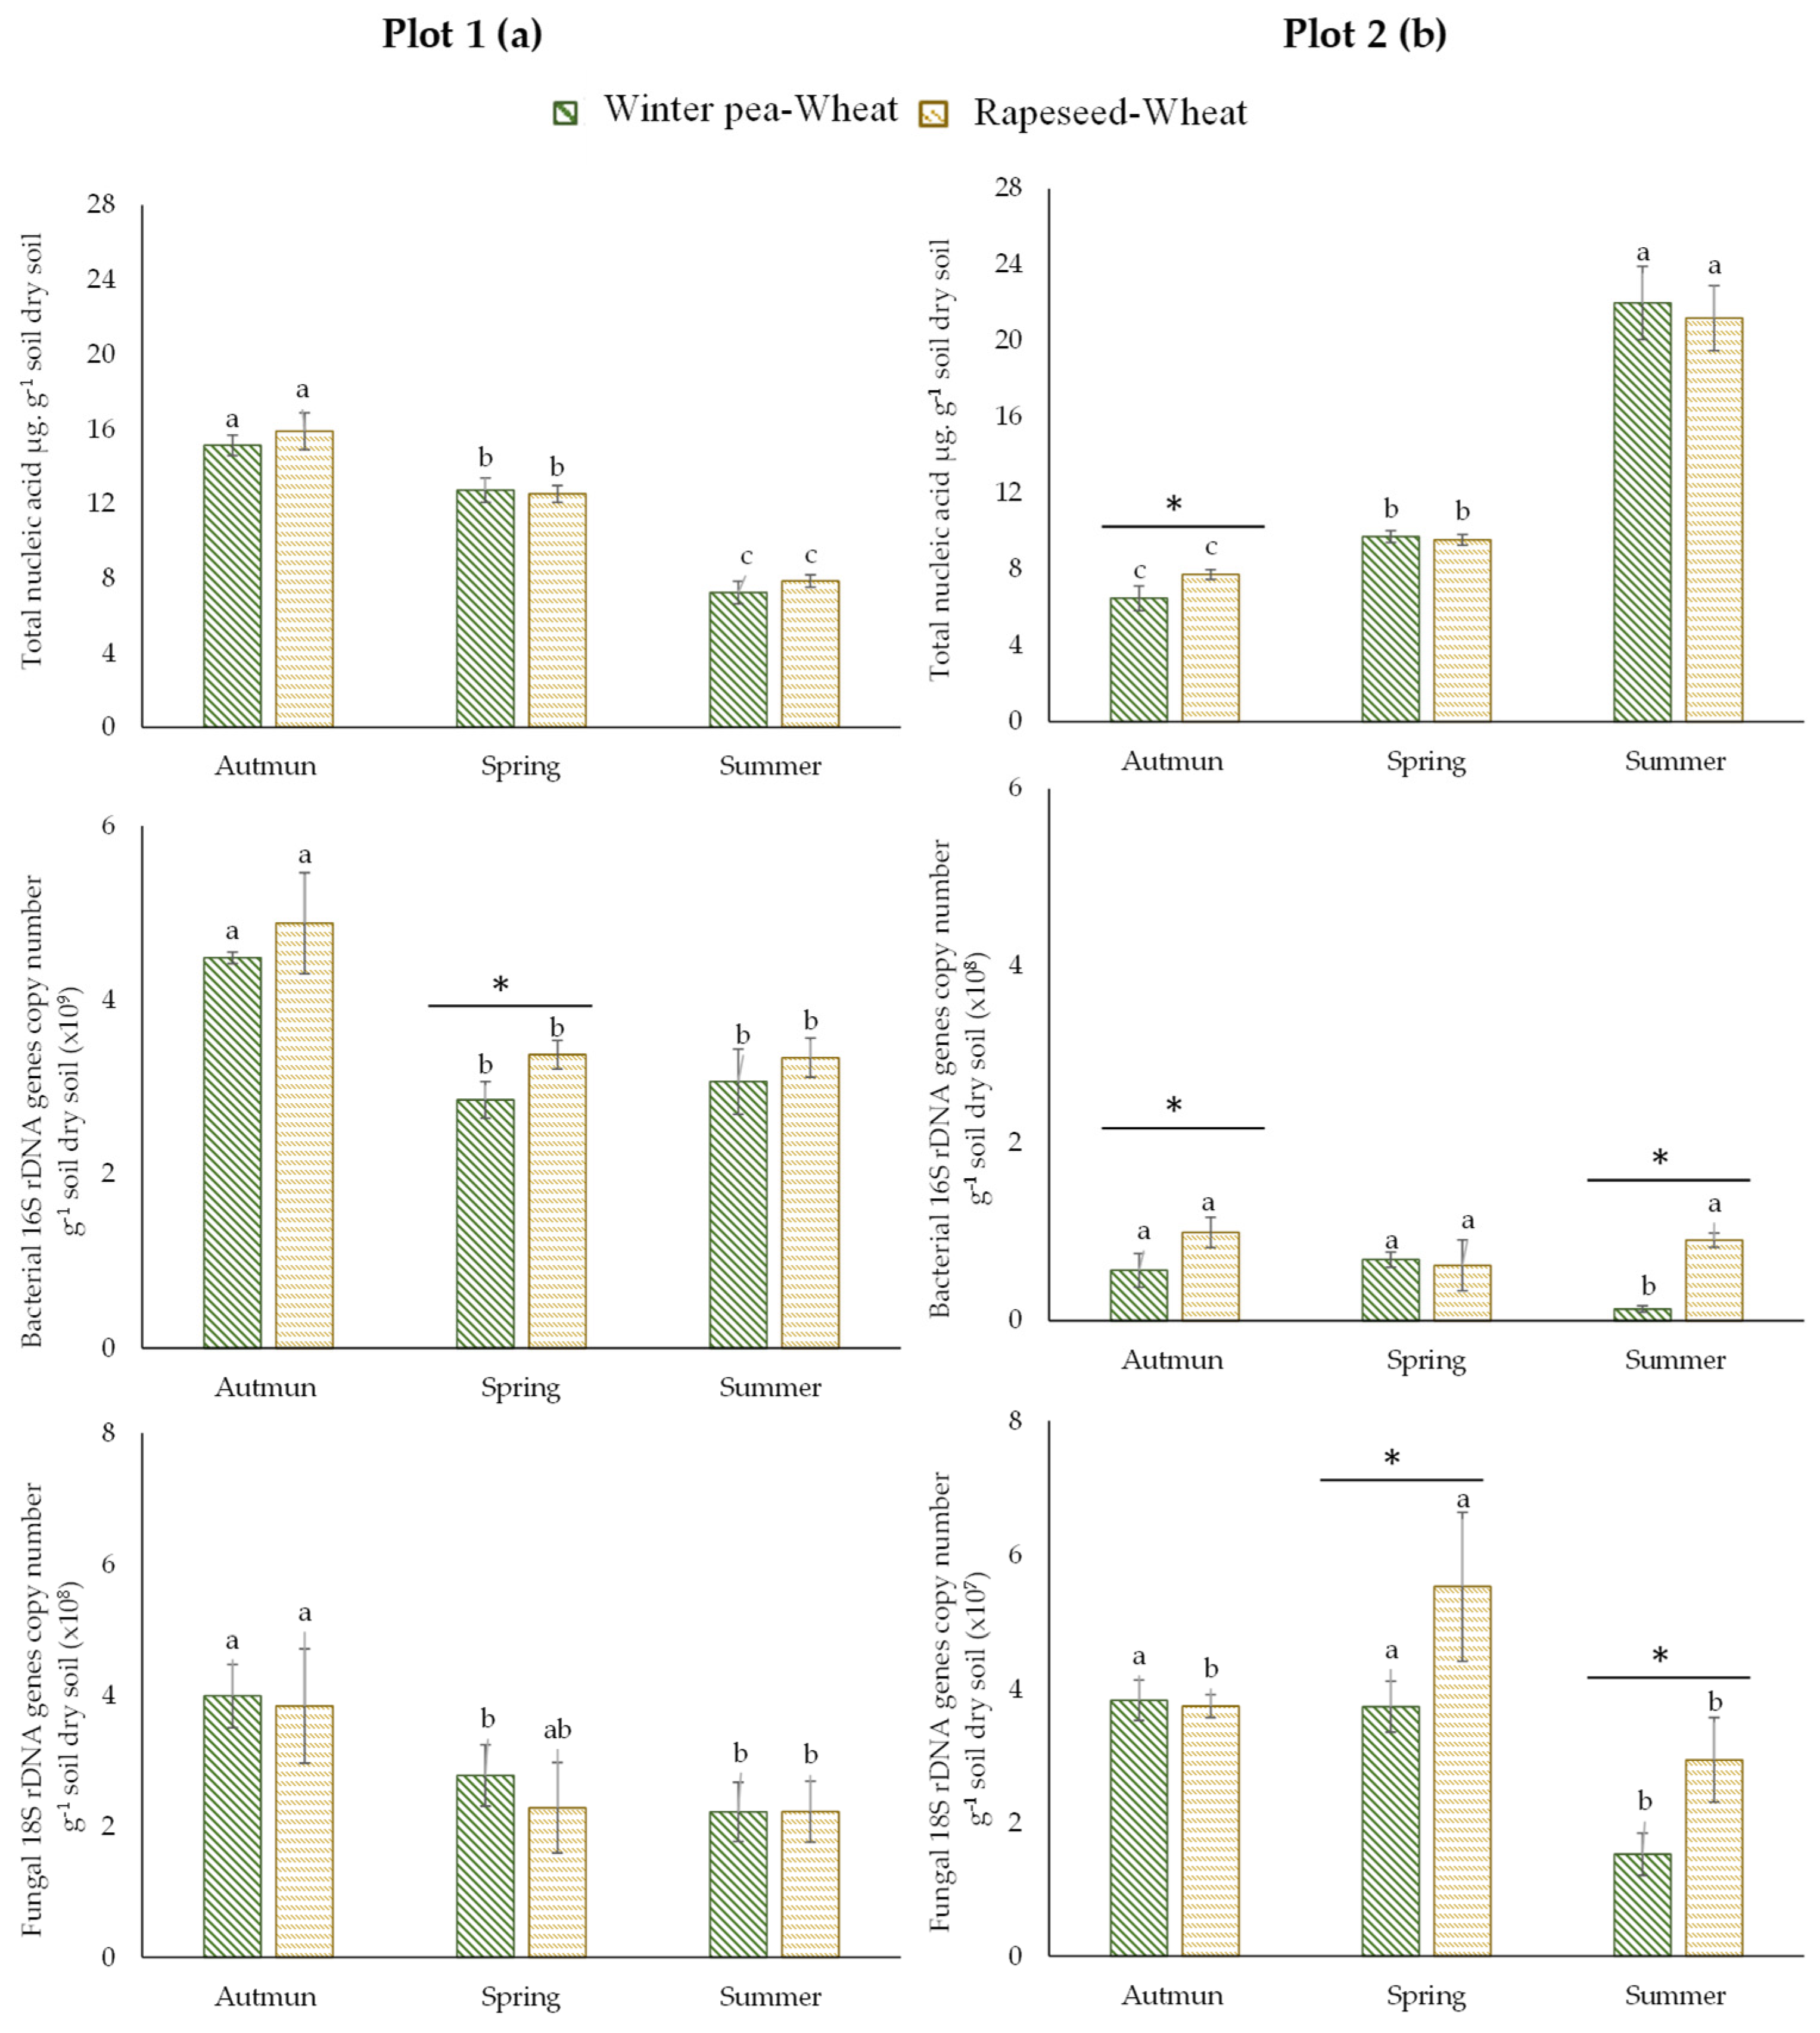
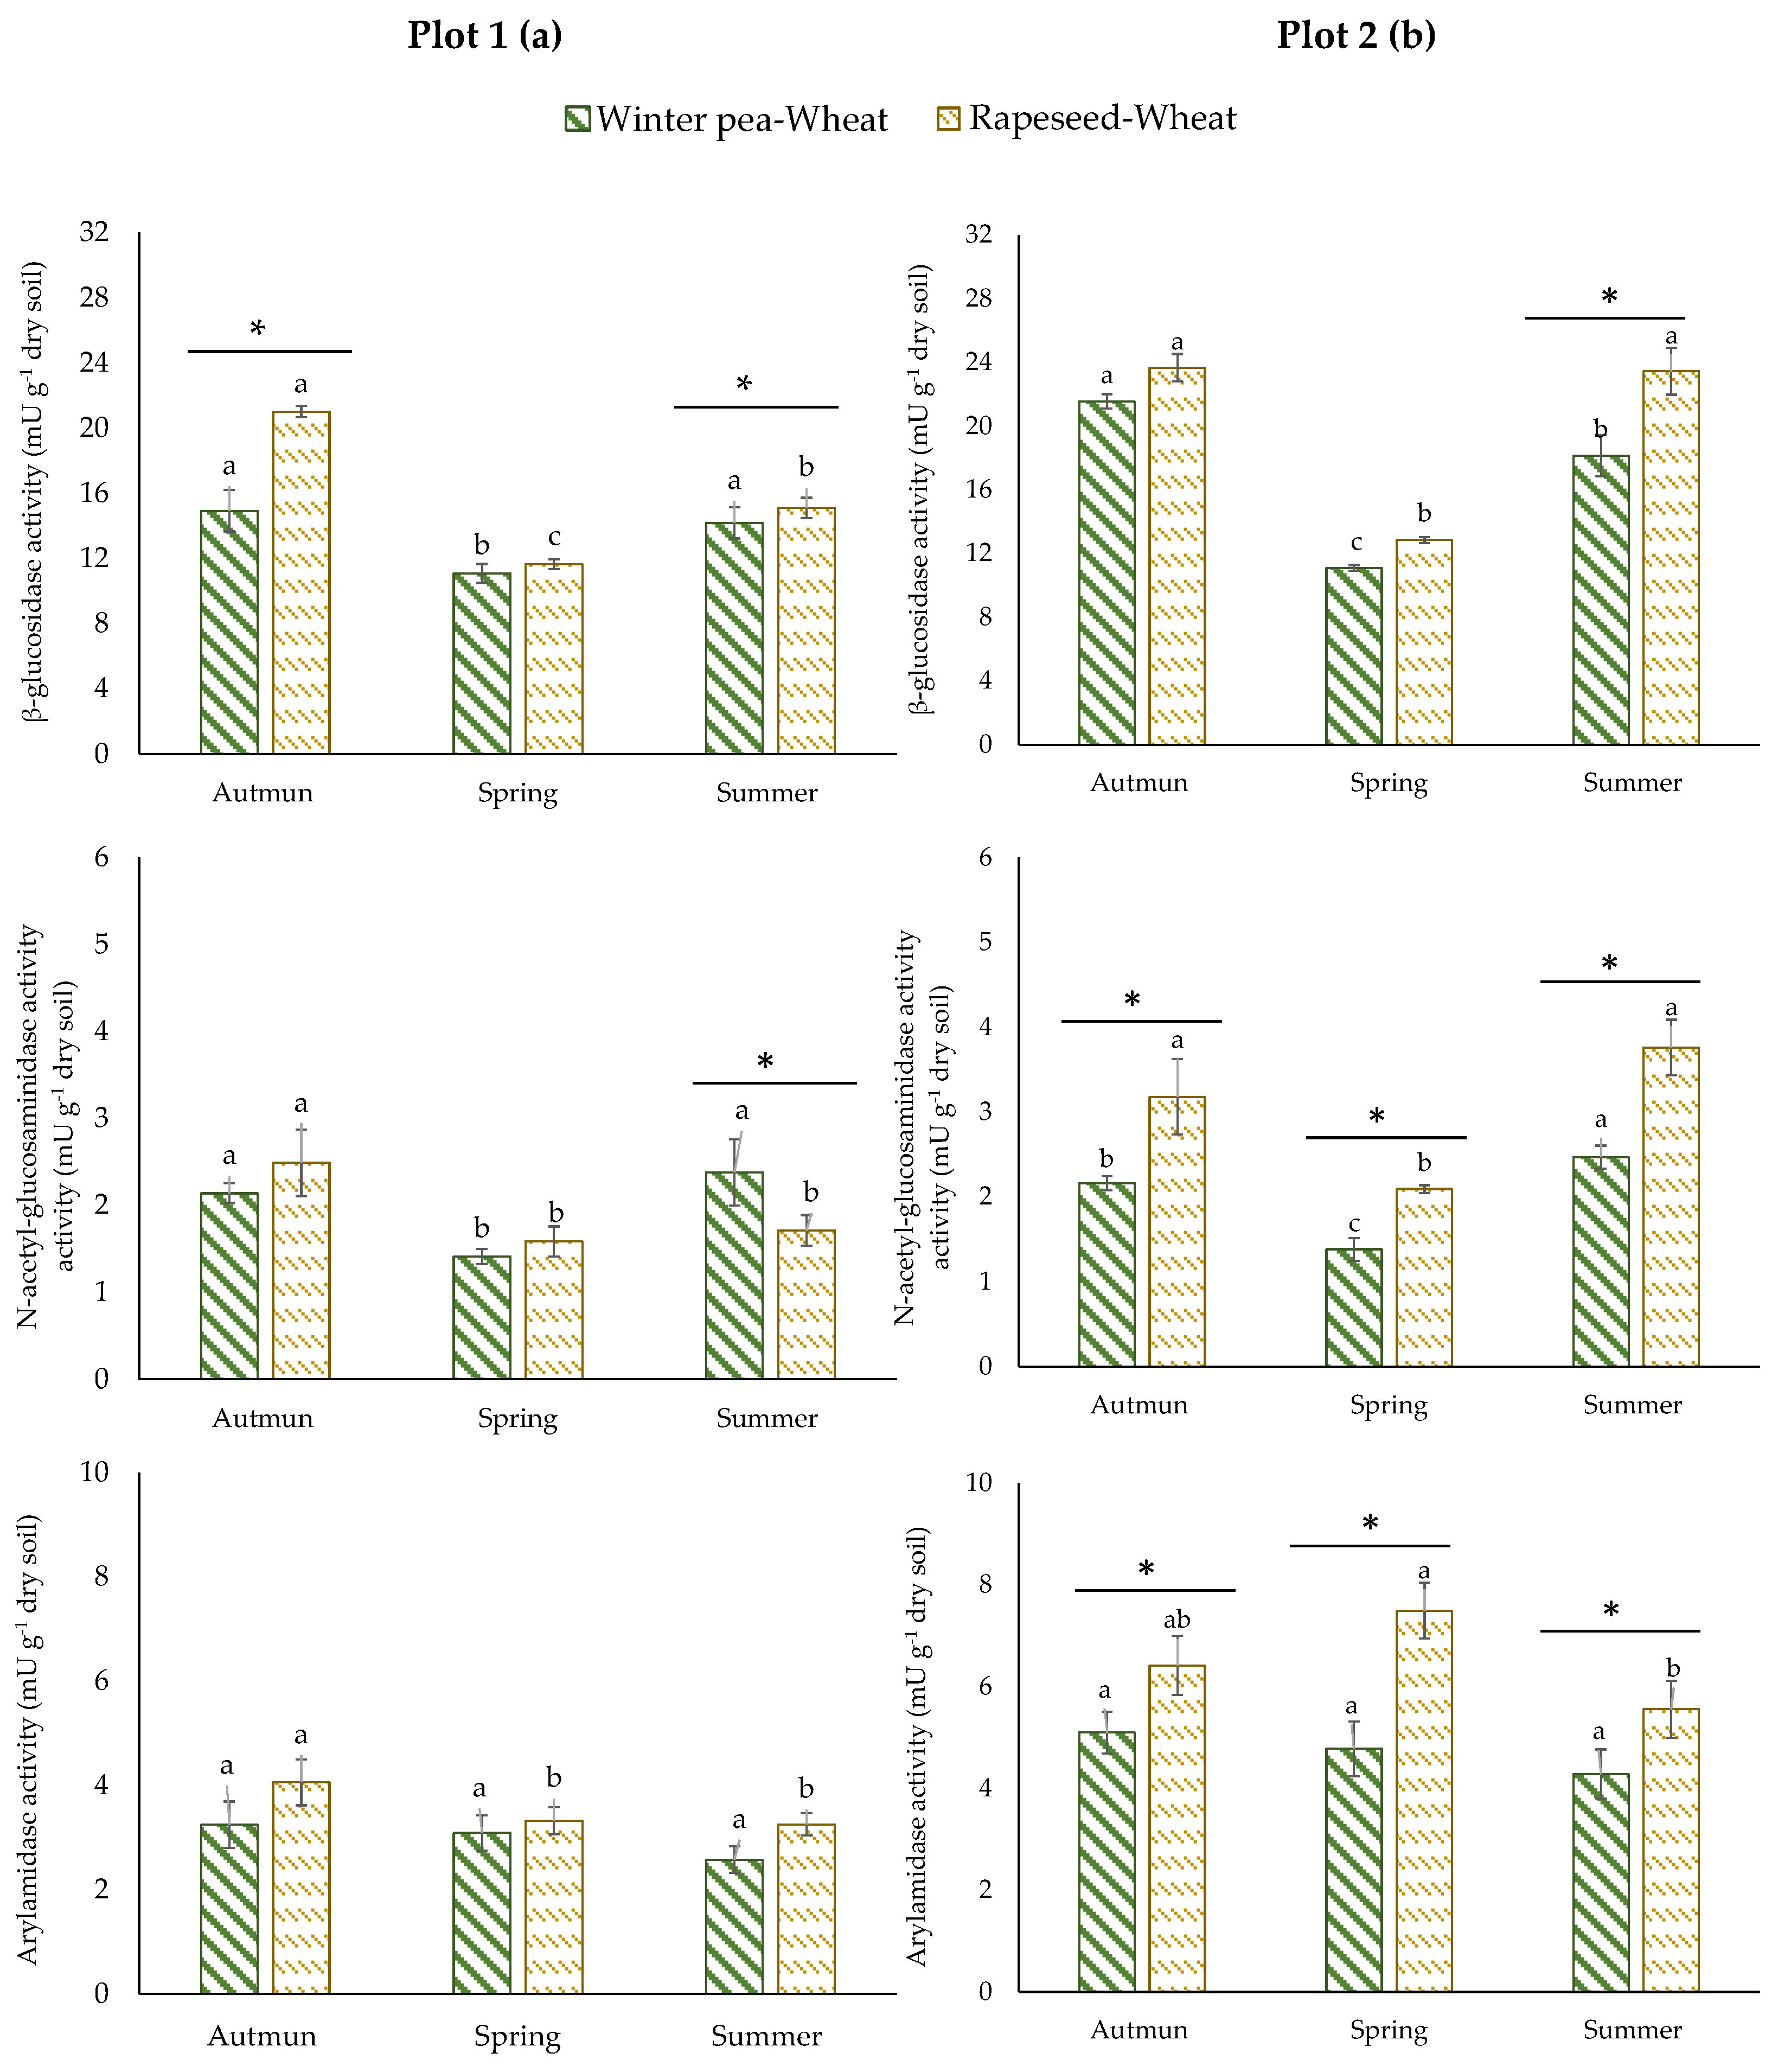
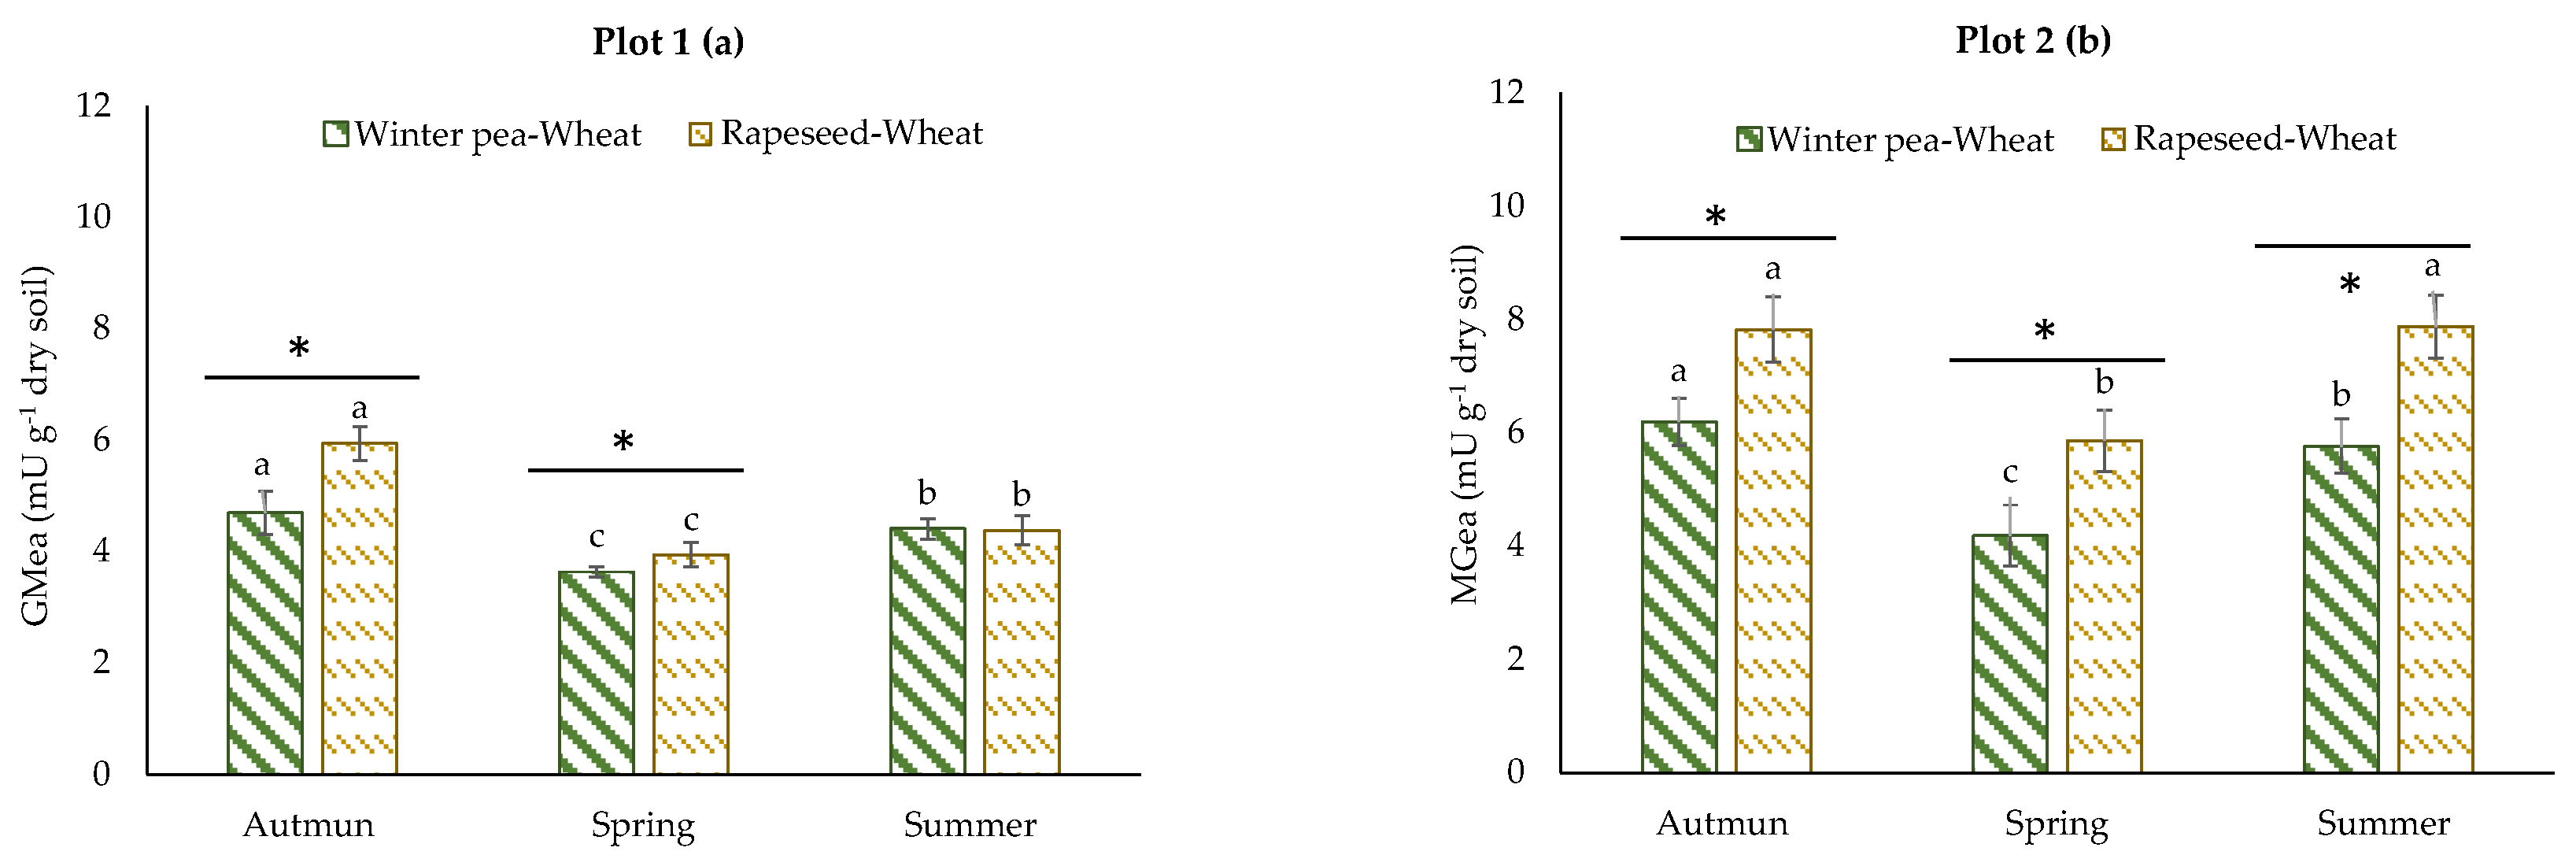
3.1.1. Soil Microbial Abundances and Enzyme Activities in the Two Successions

For the first plot (plot 1), the total and fungal biomasses did not differ statistically between the two studied successions (winter pea–wheat, rapeseed–wheat; Figure 2a). In contrast, bacterial biomass was significantly higher in rapeseed–wheat succession in spring. The second plot (plot 2) showed more variability than the first one. Total biomass, determined by the quantification of the extracted DNA from soil, was significantly higher in autumn in the rapeseed–wheat succession (Figure 2b). Our results showed that bacterial and fungal biomasses were more important in the rapeseed–wheat succession. Furthermore, microbial communities were dominated by bacteria in both successions.
The results of enzyme activities showed different responses according to plots. In plot 1, no significant difference in ARYLN activity was identified for the two successions (Figure 3a). Rapeseed–wheat succession showed higher activity of GLU in autumn and lower activity of NAG in summer. For plot 2, a unique variation pattern was observed for enzyme activities (Figure 3b). They were consistently and significantly higher in the rapeseed–wheat succession at all sampling times.
The GMea of the assayed enzymes was used as an integrating index of soil enzyme activities. The GMea level was, on average, 1.2-fold greater in plot 2 (Figure 4b) than in plot 1 (Figure 4a). The GMea was significantly higher in the rapeseed–wheat rotation at all sampling times in plot 2; in plot 1, the same result was obtained, with the exception of the summer sampling date. For most of the measured microbial parameters, the sampling date was the dominant factor and showed significant variability over the growing period of wheat.

3.1.2. Soil Mineral N Content in the Two Successions

For mineral N, we have chosen to present the results of the two successions with a classic management (with fertilization) because these results are more meaningful to farmers. Soil mineral N content in the two successions is presented in Figure 5. With either plot considered, the mineral N content in the winter pea–wheat succession was higher than in the rapeseed–wheat succession, with the exception of plot 1 in winter. The difference in autumn reached 48% and 35% for plot 1 and plot 2, respectively.

3.2. Effect of Fertilizing Inputs along Crop Rotations

To evaluate the effect of fertilization on biological soil parameters, we have chosen to present the results obtained in summer after the input of fertilization (Figure 1b).

The Fertilization Effect on Microbial Abundances and Enzyme Activities

Microbial abundances were not affected by fertilization treatment (Table 2), except for bacterial biomass in plot 1, which was higher in unfertilized wheat (34.68 × 10⁸ ± 0.96 × 10⁸ copy number of 16S rDNA genes g−1 dry soil) than in fertilized wheat (32.51 × 10⁸ ± 1.02 × 10⁸ copy number of 16S rDNA genes g−1 dry soil).
The three tested enzymes did not respond in a similar way to fertilization treatment (Table 2). For both plots, GLU activity was slightly higher in fertilized wheat compared to unfertilized wheat (from 16.67 ± 0.38 to 14.51 ± 0.54 in plot 1 and from 20.50 ± 0.53 to 18.81 ± 0.90 mU g−1 dry soil in plot 2). In contrast, ARYLN activity significantly decreased in wheat after fertilization treatment. NAG activity showed different variation patterns between the two plots; it was affected by fertilization treatment in plot 1 but no effect was shown in plot 2. Despite the presence of statistically significant differences in some cases, the fertilization treatment did not have a marked effect on the biological parameters of the two studied plots.

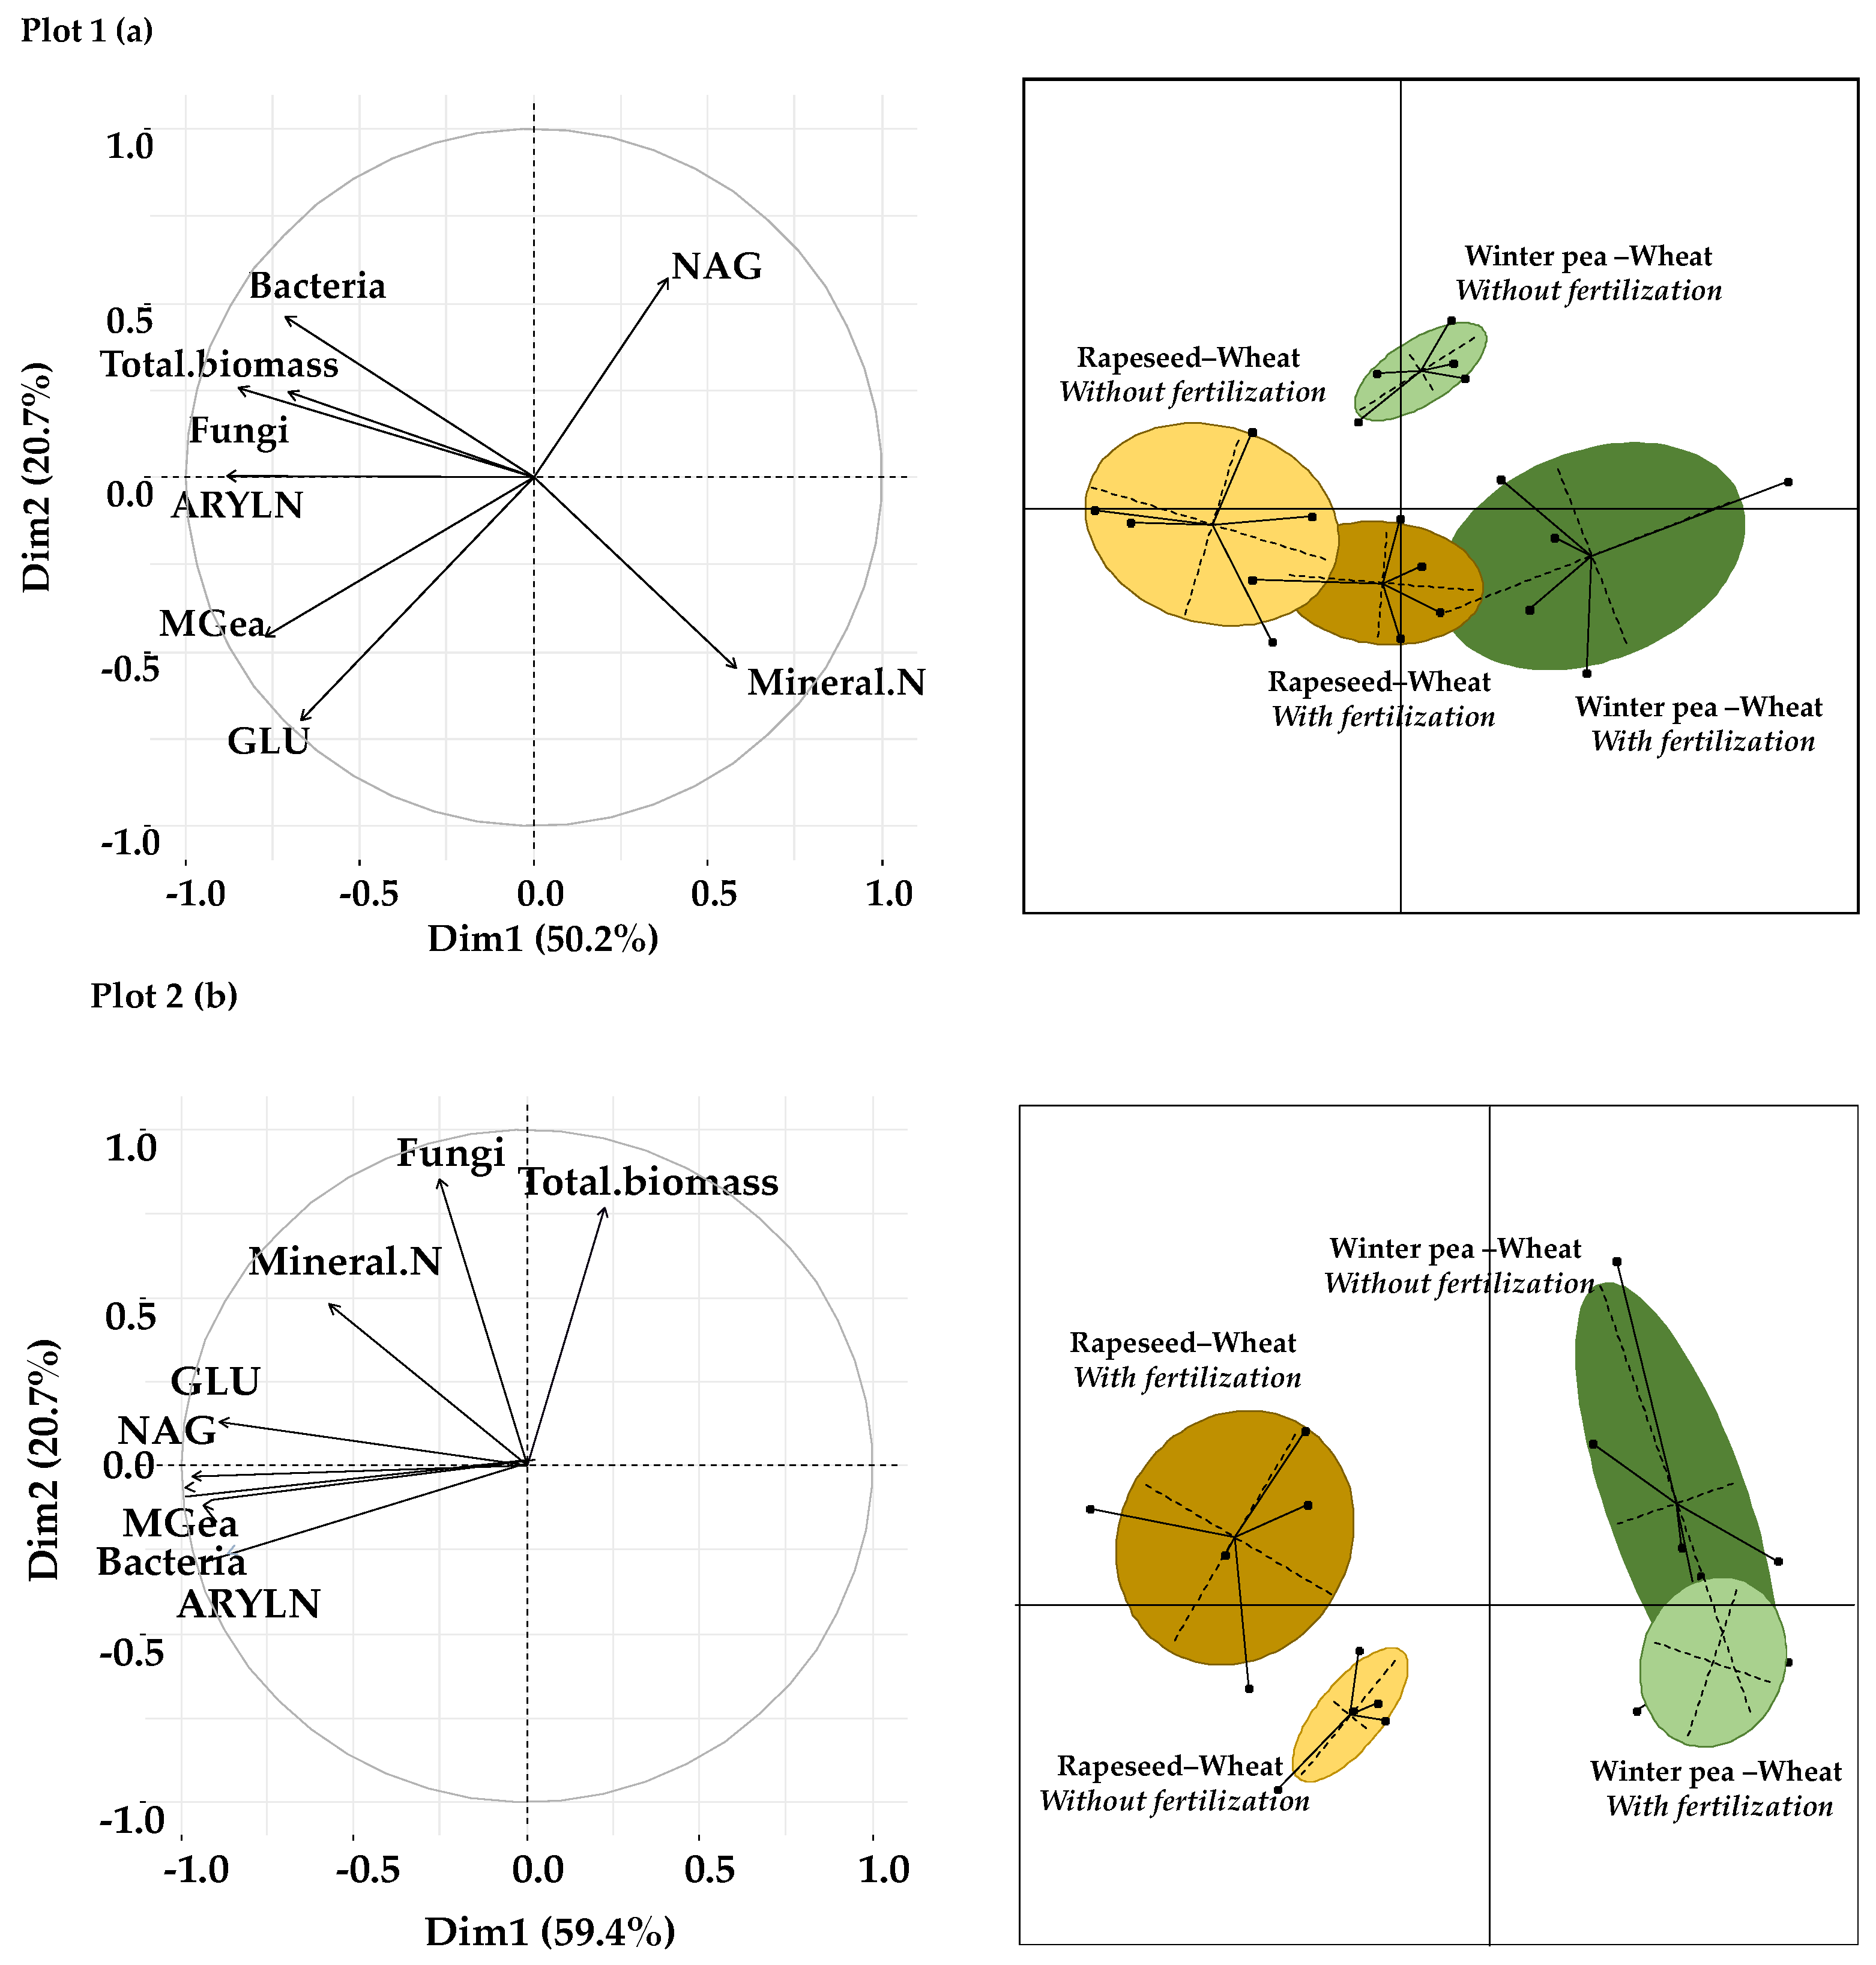
3.3. Effect of Crop Successions and Fertilizing Inputs on Soil Microbial Communities, Enzyme Activities and Mineral N Content

The effect of the two tested successions (winter pea–wheat and rapeseed–wheat) and fertilization treatments (with and without fertilization) on microbial abundances, soil enzyme activities and mineral N content was carried out by PCA under wheat crops in the two plots (Figure 6a,b).
For plot 1, the first two axes in Figure 6a explain 71% of the total variability, as illustrated by the separation of samples into four distinct groups. The winter pea–wheat successions are separated from the rapeseed–wheat successions along the first axis of PCA based on microbial abundances and mineral N content. The second axis clearly separates the fertilized winter pea–wheat and rapeseed–wheat successions from the unfertilized winter pea–wheat and rapeseed–wheat successions.
Concerning plot 2, the first axis (PC1) and the second axis (PC2) of Figure 6b explain 80% of the total variability, as illustrated by the separation of samples into three distinct groups. The PC1 separates fertilized samples from unfertilized samples of the winter pea–wheat succession based on enzyme activities and bacterial abundance. These two clusters are discriminated from those of the rapeseed–wheat succession along the PC2, which indicates the effects of succession systems.

3.4. STICS Simulation of N Balance and Yields for Each Crop

Soil nitrate, mineral N content, leaching, gaseous N emissions and crop yields were simulated for the two plots (Table 3) using independent simulation [42] of the STICS soil crop model. For plot 1, the initial and final NO3 content was significantly higher for winter pea and rapeseed crops compared to wheat. For plot 2, the initial and final NO3 content varied greatly between crops.
For the two plots, the highest final NO3 values were obtained under the winter pea crop. The prediction of soil mineral N content showed an increase of around 4% for plot 1 and 13% for plot 2 in succession with the pea crop. The simulations of N2 and N2O losses showed slightly higher gaseous N emissions under rapeseed and wheat for the two plots. N leaching was observed only in plot 2 in successions including the winter pea. Yields were significantly underestimated in the STICS model and gave a very poor prediction compared to the observed yields. The observed yields of wheat were slightly higher in plot 2 compared to plot 1. For each plot, the observed yields of wheat were, overall, equivalent, regardless of the previous crop (winter pea or rapeseed).

4. Discussion

4.1. Effect of Crop Successions on Microbial Abundances and Enzyme Activities

Crop rotations or succession can directly or indirectly influence soil microbial communities and their activities [43]. In the present work, winter pea–wheat and rapeseed–wheat successions were evaluated and showed different variation patterns on the kinetics of soil microbial abundances and activities in the two plots considered. This variability was explained by several factors related to soil type (p < 0.05), soil chemical characteristics (p < 0.05) and sampling times (p < 0.05) along a growing period of wheat. In accordance with our findings, several authors have reported the significant effects of these factors as well as spatiotemporal heterogeneity of microbial communities in soil [44,45,46,47].
Crop rotations or successions have been well documented as a driving factor that influences soil microbial communities [48,49]. Soil fungal [50] and bacterial communities are influenced by crop sequence [48,51] and vary with different crops in a rotation sequence [52]. Our results achieved an agreed outcome in agricultural soils, namely the domination of bacteria in cultivated plots regardless of the crop rotation system [53,54]. This is due to the high sensitivity of fungi to soil disturbance, which leads to the destruction of hyphae and a reduction in the number of propagules in soils [54,55]. We expected a higher microbial abundance in the winter pea–wheat succession because several authors have shown that the presence of legumes in crop rotation contributes to the growth of microbial populations through their N-rich plant biomass. Adding legumes to a crop sequence has been shown to increase bulk soil C pools, which support a greater abundance of microbiota [56]. In our study, microbial abundances were unaffected by the crop species in plot 1, while, in plot 2, both bacteria and fungi were more abundant under the rapeseed–wheat succession, especially in summer. These findings may reflect the large differences in basal microbial communities and are directly related to the different management histories [57]. Adopting crop rotations to enhance microbial diversity may require the use of specific crop combinations that are expected to affect soil microbial diversity more than others due to plant-specific root exudates and C sources. Venter et al. [56] showed, for two distinct grain–legume rotations, that the crop rotations including rice–mung bean and maize–wheat increased microbial richness, while the pea–wheat rotation decreased microbial richness.
The differing growth of crops in terms of both rhizodeposition characteristics (e.g., the amount and composition) and the N and C requirement revealed in our conditions no specific change in the measured hydrolytic enzyme activities in plot 1. This lack of response could be linked to the availability of the substrates and the nutrient-limiting conditions as perceived by microorganisms, which can be strongly impacted by other factors such as the temperature and moisture content of the soil [58,59,60]. We supposed that the influence of meteorology surpassed the influence of crops in plot 1. The enzyme activities were much higher in plot 2. This was surprising; the high clay constituent of our soil suggested a stabilization of the extracellular part of these enzymes as reported in the literature [61,62]. The significantly higher values found in the GMea of plot 2 in the rapeseed–wheat rotation could be due to the high bacterial and fungal biomasses (r = 0.75, p < 0.05). This finding is in accordance with several works that report strong correlations between microbial abundances and enzyme activities in soils [63,64]. For example, Chung et al. [65] reported that the NAG activity was mainly driven by the fungal community, which is in line with our results (r = 0.76, p < 0.05). The higher NAG activities found in winter pea–wheat rotation in the two plots may also be linked to the legacy of the winter pea crop, because it was reported that the structure of the Nod factor of rhizobia (symbiont of legumes) could act as an oligomer of NAG enzymes [66].

4.2. Soil N Content in the Two Succession Systems

Mineral N content was highest in winter pea–wheat compared to rapeseed–wheat succession in autumn, which is due to the mineralization of pea residues. The amount of N resulting from the mineralization of winter pea residues and its availability for the following crop depends on the amount of N in pea residues and the organic N proportion that is mineralized by soil microorganisms [67]. The C to N ratio of crop residues is considered a significant indicator to assess the potential of mineralization of crop residues [68,69]. Given their lower C to N ratio, the mineralization of aerial residues of the pea is faster than that of other crops. It is well known that the addition of legumes in crop rotations is likely to have positive impacts on the soil and N dynamic [70].
Most authors acknowledge that N derived from the roots can play a significant role in the N and soil dynamic [71]; only a few studies have considered either root N content or N rhizodeposition (mainly on pea) in cropping systems because of this being a challenge to assess [72,73,74,75]. Several factors can also be highly influential for the soil and N dynamic within crop rotations. For example, the proportion of N mineralized residues in a given environment and over a given period is influenced by soil temperature and humidity, whatever the species in the crop rotation [68,76]. For example, higher temperatures result in rapid mineralization of residues, and the mineral N can therefore be leached by heavy rains [77]. The combination of these factors could explain the lowest amount of mineral N content in winter. However, in our study, the mineral N measured at harvest of wheat crop was no different between the two previous crops, indicating that there had been efficient use of the available mineral N by wheat across the 60 cm soil profile. The higher N availability after a winter pea crop appeared to be significantly manifested beyond the wheat crop. In fact, the mineral N was, on average, equivalent to 92.66 kg ha−1 ± 0.20 under barley as the previous crop of wheat in plot 1 (result not shown). The same type of result has been observed in rapeseed after pea crops, wheat after pea and chickpea after lentil [21,28,30,78].

4.3. The Fertilization Effect on Soil Microbial Communities and Enzyme Activities

In the literature, it has been reported that N fertilization affects microbial growth and activities, which directly alter soil organic carbon (SOC) turnover and subsequently lead to changes in C and N pool sizes [79,80]. Studies have reported large variations in the effects of N fertilization on microbial biomass. However, our results indicated no marked effects of N inputs on the microbial biomass determined by the quantification of the total extracted DNA from soils. N fertilization caused reductions of 15–35% in microbial biomass determined by the quantification of microbial biomass carbon [81,82,83]. However, a meta-analysis published by Geisseler and Scow [84] reported that N fertilization increased microbial biomass by 15% in agricultural soils. In the present study, N inputs decreased bacterial abundance only under wheat in plot 1 (Table 2). This result is in accordance with studies that conclude that bacterial abundance declines remarkably across N fertilizer inputs [85,86]. This reducing effect is achieved through the changing of soil chemical properties like the pH and soil organic matter, which indirectly affect microbial communities [79,80,87]. Shen et al. [88] showed that soil pH has the same trend as bacterial abundance across N soil gradient content. Our results showed a positive correlation between bacterial abundance and soil pH (r = 0.33, p < 0.05)—a major driver in shaping soil bacterial communities [89]. Several studies showed that long-term mineral N fertilization induced a decrease or an increase in fungal abundance [90,91,92]. However, N fertilization did not affect fungal biomass in our study.
The effects of N fertilization on enzyme activities have been studied and generally show diverse variations in patterns and magnitude [84,93,94,95,96,97,98]. In this study, enzymes responded differently to N fertilization. The GLU activity increased in accordance with the consensus that is evident in the literature regarding the response of this enzyme to N fertilization. The N supply appears to sustain soil microorganisms, producing extracellular enzymes associated with hydrolytic C-acquisition [71,97,99]. A meta-analysis based on 8–26 agricultural sites revealed that N fertilization significantly increased GLU activity but had no significant effect on N-acquiring enzymes [84]. In our case, a decrease was observed for ARYLN activity in the two plots, while no effect for NAG activity under N inputs was observed for plot 2 and a decrease was observed for plot 1. For the NAG enzyme, studies have reported divergent variation patterns of this activity in response to N inputs. However, NAG activity was stimulated by 14% or suppressed by 24% as a result of N fertilization across different agricultural sites [100,101]. The response of NAG and ARYLN activities to N fertilization underlines the complex relationship between microbial N-acquiring extracellular enzyme activities and N availability [102]. Some authors explained the decrease in NAG and ARYLN activities by the inhibitor effect of the mineral N on enzyme production and activity [103,104]. Others have suggested that extracellular enzyme activities fluctuate frequently due to complex environmental conditions and microbial nutrient demand [105]. In our study, despite these significant differences, it is unlikely that these activities will lead to major changes in C and N fluxes.

4.4. The N Balance and Crop Yields

The multiparameter study concerning the introduction of the winter pea as the head crop of the rotation or succession significantly modified the soil mineral N content, and this modification persisted over time. Indeed, this significant effect was observed from the end of the first year (i.e., under the winter pea crop) and remained effective during the second year under the wheat crop. In accordance with the observed results, the simulation of the N balance by the STICS model showed that winter pea–wheat succession enriched the mineral N content of the soil compared to rapeseed–wheat succession. Moreover, our results highlighted an overestimation of mineral N for both plots. Simulations also showed that rapeseed is more efficient than the winter pea in reducing the nitrate content by plant uptake. In fact, due to its rapid growth and its greater rooting depth, rapeseed is more effective in reducing nitrate leaching [106]. Although legumes are less effective, they can be useful in reducing nitrate leaching if the plant cover is sufficiently dense and uniform—as demonstrated in the published literature [107].
Despite the relevant use of the STICS model for numerous cropping systems in the main French soils, the simulated yields of the winter pea, rapeseed and succeeding wheat crops showed biases of underestimation in comparison to observed yields. The underestimation of yield could be explained by the history of the crops on the plots. It therefore appears necessary to know the history (of at least two to three years) of each modeled plot in order to refine the simulation unit on a smaller scale. In addition, the absence of metadata that characterized some elements of the technical itinerary or the health status of the crop, as well as the absence of data that characterized the physical environment or the water and nitrogen conditions in the soil, led to the deletion of some data essential for simulation [108,109].
Overall, the impact of the previous crop was positive and wheat yields were equivalents whatever the previous crop (winter pea or rapeseed). These wheat yields were more important in plot 2 than in plot 1 due to agro-pedoclimatic conditions. However, the wheat yield was considerably affected by a drought in 2018. In contrast, the wheat yield for the year 2019 escaped drought, which explains the difference in yield between the two plots. Indeed, the plot systems were set up one year apart, which allowed environmental conditions that permitted pests and pathogens to proliferate and attack the crops in plot 1, as reported by the farmer.

5. Conclusions

In the context of the growing demand for protein, increasing rarefaction of non-renewable resources, the need to preserve the environment (water, air and soil quality) and economic instability, introducing the winter pea into rotations could be a possible way of responding to these challenges, particularly in the Normandy region. From an agronomic point of view, the objective of this study was to evaluate the effect of changing the crop rotation head (winter pea or rapeseed) on the biological state of the soil. The results revealed strong spatiotemporal variability in the responses of soil microbial communities and highlighted the importance of the pedoclimatic context in determining the abundance and activity of soil microbial communities. Indeed, the comparison of the two successions (winter pea–wheat and rapeseed–wheat) led to different results depending on the plot considered. Moreover, under the environmental conditions of our study, the crop succession that included the pea enriched the soil with mineral N compared to the succession with rapeseed. These results highlighted the positive effect of the winter pea on mineral N availability during pea cropping period and for subsequent crops (wheat and barley). These findings partially supported our research hypotheses. On the one hand, the availability of mineral N for the following crops was higher in the successions that included the winter pea. On the other hand, the abundance of microbial communities and levels of enzyme activities were equivalent (plot 1) or higher (plot 2) in the successions that included rapeseed.
Under the conditions of our study, wheat yields after a winter pea crop (92 q ha−1 for plot 1 and 125 q ha−1 for plot 2) were equivalent to those obtained after a rapeseed crop. Rapeseed, however, required a large amount of N fertilizer (96 kg N ha−1 for plot 1 and 47 kg N ha−1 for plot 2). The results confirmed the ability of a winter pea crop to reach its productivity potential without the use of N fertilizers. Moreover, if we consider the policy established for supporting protein crops in France (minimum level of 100 € ha−1 of pea from 2010 and 111.5 € ha−1 from 2017), a winter pea crop would improve the gross profit margin for the succession brought back to the year and economic sustainability. Indeed, this crop increases the nitrogen autonomy, which reduces or avoids the purchase of mineral fertilizers and reduces the farmers’ working time related to fertilization interventions. All these factual observations lead us to conclude that the introduction of the winter pea crop in the rotation is systematically economically valuable.

Author Contributions

C.R.: experiment execution, data analysis, presentation of results and original draft manuscript preparation; W.R.-A.: contribution to the original draft manuscript preparation; review, and editing, M.B.: identification of the research topic, study design, STICS analysis and review; P.Y.B.: STICS analysis and manuscript review; I.T.-G. and K.L.: identification of the research topic, resources, review, editing and supervision. All authors have read and agreed to the published version of the manuscript.

Funding

This research was funded by the Normandy region and was supported by the Vivepois project.

Acknowledgments

The authors would like to thank François D’Hubert of the Chambre d’Agriculture of Normandy and the farmers of the association of Economic and Environmental Interest Group (EEIG).

Conflicts of Interest

The authors declare no conflict of interest. The funders had no role in the design of the study; in the collection, analyses or interpretation of data; in the writing of the manuscript or in the decision to publish the results.

References

  1. Smith, M.; Busi, M.; Ball, P.; Van Der Meer, R. Factors influencing an organisation’s ability to manage innovation: A structured literature review and conceptual model. Int. J. Innov. Manag. 2008, 12, 655–676. [Google Scholar] [CrossRef] [Green Version]
  2. Lin, Y.S. Fostering creativity through education—A conceptual framework of creative pedagogy. Creat. Educ. 2011, 2, 149. [Google Scholar] [CrossRef] [Green Version]
  3. Paustian, M.; Theuvsen, L. Adoption of precision agriculture technologies by German crop farmers. Precis. Agric. 2017, 18, 701–716. [Google Scholar] [CrossRef]
  4. Mills, J.; Reed, M.; Skaalsveen, K.; Ingram, J. The use of Twitter for knowledge exchange on sustainable soil management. Soil Use Manag. 2019, 35, 195–203. [Google Scholar] [CrossRef] [Green Version]
  5. Olesen, J.E.; Trnka, M.; Kersebaum, K.C.; Skjelvåg, A.O.; Seguin, B.; Peltonen-Sainio, P.; Rossi, F.; Kozyra, J.; Micale, F. Impacts and adaptation of European crop production systems to climate change. Eur. J. Agron. 2011, 34, 96–112. [Google Scholar] [CrossRef]
  6. Renard, D.; Tilman, D. National food production stabilized by crop diversity. Nature 2019, 571, 257–260. [Google Scholar] [CrossRef] [PubMed]
  7. Hauck, J.; Schleyer, C.; Winkler, K.J.; Maes, J. Shades of Greening: Reviewing the Impact of the new EU Agricultural Policy on Ecosystem Services. Cases J. 2014, 1. [Google Scholar] [CrossRef]
  8. Hatfield-Dodds, S.; Schandl, H.; Newth, D.; Obersteiner, M.; Cai, Y.; Baynes, T.; West, J.; Havlik, P. Assessing global resource use and greenhouse emissions to 2050, with ambitious resource efficiency and climate mitigation policies. J. Clean. Prod. 2017, 144, 403–414. [Google Scholar] [CrossRef]
  9. Barbieri, C.; Sotomayor, S.; Aguilar, F.X. Perceived benefits of agricultural lands offering agritourism. Tour. Plan. Dev. 2019, 16, 43–60. [Google Scholar] [CrossRef]
  10. Liu, X.; Herbert, S.J.; Hashemi, A.M.; Zhang, X.; Ding, G. Effects of agricultural management on soil organic matter and carbon transformation: A review. Plant Soil Environ. 2018, 52, 531. [Google Scholar] [CrossRef] [Green Version]
  11. Reynolds, W.D.; Drury, C.F.; Yang, X.M.; Tan, C.S.; Yang, J.Y. Impacts of 48 years of consistent cropping, fertilization and land management on the physical quality of a clay loam soil. Can. J. Soil Sci. 2014, 94, 403–419. [Google Scholar] [CrossRef]
  12. Tiemann, L.K.; Grandy, A.S.; Atkinson, E.E.; Marin-Spiotta, E.; McDaniel, M.D. Crop rotational diversity enhances belowground communities and functions in an agroecosystem. Ecol. Lett. 2015, 18, 761–771. [Google Scholar] [CrossRef] [PubMed]
  13. Yang, T.; Siddique, K.H.M.; Liu, K. Cropping systems in agriculture and their impact on soil health: A review. Glob. Ecol. Conserv. 2020, 23, e01118. [Google Scholar] [CrossRef]
  14. Wezel, A.; Casagrande, M.; Celette, F.; Vian, J.F.; Ferrer, A.; Peigné, J. Agroecological practices for sustainable agriculture. A review. Agron. Sustain. Dev. 2014, 34, 1–20. [Google Scholar] [CrossRef] [Green Version]
  15. Kelley, K.; Clark, B.; Brown, V.; Sitzia, J. Good practice in the conduct and reporting of survey research. Int. J. Qual. Health Care 2003, 15, 261–266. [Google Scholar] [CrossRef] [Green Version]
  16. Stagnari, F.; Maggio, A.; Galieni, A.; Pisante, M. Multiple benefits of legumes for agriculture sustainability: An overview. Chem. Biol. Technol. Agric. 2017, 4, 2. [Google Scholar] [CrossRef] [Green Version]
  17. Zahran, H.H. Rhizobium-legume symbiosis and nitrogen fixation under severe conditions and in an arid climate. Microbiol. Mol. Biol. Rev. 1999, 63, 968–989. [Google Scholar] [CrossRef] [Green Version]
  18. Regus, J.U.; Gano, K.A.; Hollowell, A.C.; Sofish, V.; Sachs, J.L. Lotus hosts delimit the mutualism–parasitism continuum of Bradyrhizobium. J. Evol. Biol. 2015, 28, 447–456. [Google Scholar] [CrossRef]
  19. Goh, C.H.; Nicotra, A.B.; Mathesius, U. The presence of nodules on legume root systems can alter phenotypic plasticity in response to internal nitrogen independent of nitrogen fixation. Plant Cell Environ. 2016, 39, 883–896. [Google Scholar] [CrossRef] [Green Version]
  20. Voisin, A.S.; Salon, C.; Munier-Jolain, N.G.; Ney, B. Effect of mineral nitrogen on nitrogen nutrition and biomass partitioning between the shoot and roots of pea (Pisum sativum L.). Plant Soil 2002, 242, 251–262. [Google Scholar] [CrossRef]
  21. Gan, Y.T.; Miller, P.R.; McConkey, B.G.; Zentner, R.P.; Liu, P.H.; McDonald, C.L. Optimum plant population density for chickpea and dry pea in a semiarid environment. Can. J. Plant Sci. 2003, 83, 1–9. [Google Scholar] [CrossRef]
  22. Angus, J.F.; Kirkegaard, J.A.; Hunt, J.R.; Ryan, M.H.; Ohlander, L.; Peoples, M.B. Break crops and rotations for wheat. Crop. Pasture Sci. 2015, 66, 523–552. [Google Scholar] [CrossRef]
  23. Jensen, E.S.; Hauggaard-Nielsen, H. How can increased use of biological N2 fixation in agriculture benefit the environment? Plant Soil 2003, 252, 177–186. [Google Scholar] [CrossRef]
  24. Crews, T.E.; Peoples, M.B. Legume versus fertilizer sources of nitrogen: Ecological tradeoffs and human needs. Agric. Ecosyst. Environ. 2014, 102, 279–297. [Google Scholar] [CrossRef]
  25. Kumar, K.; Goh, K.M. Biological nitrogen fixation, accumulation of soil nitrogen and nitrogen balance for white clover (Trifolium repens L.) and field pea (Pisum sativum L.) grown for seed. Field Crops Res. 2000, 68, 49–59. [Google Scholar] [CrossRef]
  26. Cuttle, S.; Mark, S.; Gillian, G. A Review of Leguminous Fertility-Building Crops, with Particular Refence to Nitrogen Fixation and Utilization; Institute of Grassland & Environmental Research: Aberystwyth, UK, 2003. [Google Scholar]
  27. Gollner, G.; Starz, W.; Friedel, J.K. Crop performance, biological N fixation and pre-crop effect of pea ideotypes in an organic farming system. Nutr. Cycl. Agroecosyst. 2019, 115, 391–405. [Google Scholar] [CrossRef] [Green Version]
  28. Gurr, G.M.; Lu, Z.; Zheng, X.; Xu, H.; Zhu, P.; Chen, G.; Yao, X.; Cheng, J.; Zhu, Z.; Catindig, J.L.; et al. Multi-country evidence that crop diversification promotes ecological intensification of agriculture. Nat. Plants 2016, 2, 1–4. [Google Scholar] [CrossRef]
  29. Duchene, O.; Vian, J.F.; Celette, F. Intercropping with legume for agroecological cropping systems: Complementarity and facilitation processes and the importance of soil microorganisms: A review. Agric. Ecosyst. Environ. 2017, 240, 148–161. [Google Scholar] [CrossRef]
  30. Li, Z.; Song, Z.; Singh, B.P.; Wang, H. The impact of crop residue biochars on silicon and nutrient cycles in croplands. Sci. Total Environ. 2019, 659, 673–680. [Google Scholar] [CrossRef]
  31. Ellouze, W.; Esmaeili Taheri, A.; Bainard, L.D.; Yang, C.; Bazghaleh, N.; Navarro-Borrell, A.; Hanson, K.; Hamel, C. Soil fungal resources in annual cropping systems and their potential for management. BioMed Res. Int. 2014. [Google Scholar] [CrossRef]
  32. Njeru, E.M.; Avio, L.; Sbrana, C.; Turrini, A.; Bocci, G.; Bàrberi, P.; Giovannetti, M. First evidence for a major cover crop effect on arbuscular mycorrhizal fungi and organic maize growth. Agron. Sustain. Dev. 2014, 34, 841–848. [Google Scholar] [CrossRef] [Green Version]
  33. Robson, M.C.; Fowler, S.M.; Lampkin, N.H.; Leifert, C.; Leitch, M.; Robinson, D.; Watson, C.A.; Litterick, A.M. The Agronomic and Economic Potential of Break Crops for Ley/Arable Rotations in Temperate Organic Agriculture; Academic Press: Cambridge, MA, USA, 2002; pp. 369–427. [Google Scholar] [CrossRef]
  34. Urbatzka, P.; Graß, R.; Haase, T.; Schüler, C.; Trautz, D.; Heß, J. Grain yield and quality characteristics of different genotypes of winter pea in comparison to spring pea for organic farming in pure and mixed stands. Org. Agric. 2011, 1, 187–202. [Google Scholar] [CrossRef]
  35. Aschi, A.; Aubert, M.; Riah-Anglet, W.; Nélieu, S.; Dubois, C.; Akpa-Vinceslas, M.; Trinsoutrot-Gattin, I. Introduction of Faba bean in crop rotation: Impacts on soil chemical and biological characteristics. Appl. Soil Ecol. 2017, 120, 219–228. [Google Scholar] [CrossRef]
  36. Gangneux, C.; Akpa-Vinceslas, M.; Sauvage, H.; Desaire, S.; Houot, S.; Laval, K. Fungal, bacterial and plant dsDNA contributions to soil total DNA extracted from silty soils under different farming practices: Relationships with chloroform-labile carbon. Soil Biol. Biochem. 2011, 43, 431–437. [Google Scholar] [CrossRef]
  37. Borneman, J.; Hartin, R.J. PCR Primers That Amplify Fungal rRNA Genes from Environmental Samples. Appl. Environ. Microbiol. 2000, 66, 4356–4360. [Google Scholar] [CrossRef] [Green Version]
  38. Marchesi, J.R.; Sato, T.; Weightman, A.J.; Martin, T.A.; Fry, J.C.; Hiom, S.J.; Wade, W.G. Design and evaluation of useful bacterium-specific PCR primers that amplify genes coding for bacterial 16S rRNA. Appl. Environ. Microbiol. 1998, 64, 795–799. [Google Scholar] [CrossRef] [Green Version]
  39. Muyzer, G.; Waal, E.C.; de Uitterlinden, A.G. Profiling of complex microbial populations by denaturing gradient gel electrophoresis analysis of polymerase chain reaction-amplified genes coding for 16S rRNA. Appl. Environ. Microbiol. 1993, 59, 695–700. [Google Scholar] [CrossRef] [Green Version]
  40. García-Ruiz, R.; Ochoa, V.; Viñegla, B.; Hinojosa, M.B.; Peña-Santiago, R.; Liébanas, G.; Linares, J.C.; Carreira, J.A. Soil enzymes, nematode community and selected physico-chemical properties as soil quality indicators in organic and conventional olive oil farming: Influence of seasonality and site features. Appl. Soil Ecol. 2009, 41, 305–314. [Google Scholar] [CrossRef]
  41. Brisson, N.; Gary, C.; Justes, E.; Roche, R.; Mary, B.; Ripoche, D.; Zimmer, D.; Sierra, J.; Bertuzzi, P.; Burger, P.; et al. An overview of the crop model stics. Eur. J. Agron. 2003, 18, 309–332. [Google Scholar] [CrossRef]
  42. Kollas, C.; Kersebaum, K.C.; Nendel, C.; Manevski, K.; Müller, C.; Palosuo, T.; Armas-Herrera, C.M.; Beaudoin, N.; Bindi, M.; Charfeddine, M.; et al. Crop rotation modelling—A European model intercomparison. Eur. J. Agron. 2015, 70, 98–111. [Google Scholar] [CrossRef]
  43. Machinet, G.E.; Bertrand, I.; Chabbert, B.; Recous, S. Decomposition in soil and chemical changes of maize roots with genetic variations affecting cell wall quality. Eur. J. Soil Sci. 2009, 60, 176–185. [Google Scholar] [CrossRef]
  44. Castellanos, T.; Dohrmann, A.B.; Imfeld, G.; Baumgarte, S.; Tebbe, C.C. Search of environmental descriptors to explain the variability of the bacterial diversity from maize rhizospheres across a regional scale. Eur. J. Soil Biol. 2009, 45, 383–393. [Google Scholar] [CrossRef]
  45. Peiffer, J.A.; Spor, A.; Koren, O.; Jin, Z.; Tringe, S.G.; Dangl, J.L.; Buckler, E.S.; Ley, R.E. Diversity and heritability of the maize rhizosphere microbiome under field conditions. Proc. Natl. Acad. Sci. USA 2013, 110, 6548–6553. [Google Scholar] [CrossRef] [Green Version]
  46. Maarastawi, S.A.; Frindte, K.; Geer, R.; Kröber, E.; Knief, C. Temporal dynamics and compartment specific rice straw degradation in bulk soil and the rhizosphere of maize. Soil Biol. Biochem. 2018, 127, 200–212. [Google Scholar] [CrossRef]
  47. Piotrowska-Długosz, A.; Lemanowicz, J.; Długosz, J. The spatial pattern and seasonal changes in the soil phosphorus content in relation to the phosphatase activity: A case study of Luvisols. Arch. Agron. Soil Sci. 2020, 1–15. [Google Scholar] [CrossRef]
  48. Xuan, D.T.; Guong, V.T.; Rosling, A.; Alström, S.; Chai, B.; Högberg, N. Different crop rotation systems as drivers of change in soil bacterial community structure and yield of rice, Oryza sativa. Biol. Fertil. Soils 2012, 48, 217–225. [Google Scholar] [CrossRef]
  49. Valetti, L.; Iriarte, L.; Fabra, A. Effect of previous cropping of rapeseed (Brassica napus L.) on soybean (Glycine max) root mycorrhization, nodulation, and plant growth. Eur. J. Soil Biol. 2016, 76, 103–106. [Google Scholar] [CrossRef]
  50. Zhang, B.; Li, Y.; Ren, T.; Tian, Z.; Wang, G.; He, X.; Tian, C. Short-term effect of tillage and crop rotation on microbial community structure and enzyme activities of a clay loam soil. Biol. Fertil. Soils 2014, 50, 1077–1085. [Google Scholar] [CrossRef]
  51. Larkin, R.P.; Honeycutt, C.W. Effects of Different 3-Year Cropping Systems on Soil Microbial Communities and Rhizoctonia Diseases of Potato. Phytopathology 2006, 96, 68–79. [Google Scholar] [CrossRef] [Green Version]
  52. Vukicevich, E.; Lowery, T.; Bowen, P.; Úrbez-Torres, J.R.; Hart, M. Cover crops to increase soil microbial diversity and mitigate decline in perennial agriculture. A review. Agron. Sustain. Dev. 2016, 36, 48. [Google Scholar] [CrossRef] [Green Version]
  53. Fierer, N.; Craine, J.M.; McLauchlan, K.; Schimel, J.P. Litter Quality and the Temperature Sensitivity of Decomposition. J. Ecol. 2005, 86, 320–326. [Google Scholar] [CrossRef] [Green Version]
  54. Janssen, P.H. Identifying the Dominant Soil Bacterial Taxa in Libraries of 16S rRNA and 16S rRNA Genes. Appl. Environ. Microbiol. 2006, 72, 1719–1728. [Google Scholar] [CrossRef] [Green Version]
  55. Cookson, W.R.; O’Donnell, A.J.; Grant, C.D.; Grierson, P.F.; Murphy, D.V. Impact of Ecosystem Management on Microbial Community Level Physiological Profiles of Postmining Forest Rehabilitation. Microb. Ecol. 2008, 55, 321–332. [Google Scholar] [CrossRef]
  56. Helgason, B.L.; Walley, F.L.; Germida, J.J. Fungal and Bacterial Abundance in Long-Term No-Till and Intensive-Till Soils of the Northern Great Plains. Soil Sci. Soc. Am. J. 2009, 73, 120–127. [Google Scholar] [CrossRef]
  57. Venter, Z.S.; Jacobs, K.; Hawkins, H.-J. The impact of crop rotation on soil microbial diversity: A meta-analysis. Pedobiologia 2016, 59, 215–223. [Google Scholar] [CrossRef]
  58. de Morais Pereira, J.; Baretta, D.; Bini, D.; de F. Vasconcellos, R.L.; Cardoso, E.J.B.N. Relationships between microbial activity and soil physical and chemical properties in native and reforested Araucaria angustifolia forests in the state of São Paulo, Brazil. Rev. Bras. Cienc. Solo 2013, 37, 572–586. [Google Scholar] [CrossRef] [Green Version]
  59. Krajewska, B.; Ureases, I. Functional, catalytic and kinetic properties: A review. J. Mol. Catal. B Enzym. 2009, 59, 9–21. [Google Scholar] [CrossRef]
  60. Lebrun, J.D.; Trinsoutrot-Gattin, I.; Vinceslas-Akpa, M.; Bailleul, C.; Brault, A.; Mougin, C.; Laval, K. Assessing impacts of copper on soil enzyme activities in regard to their natural spatiotemporal variation under long-term different land uses. Soil Biol. Biochem. 2012, 49, 150–156. [Google Scholar] [CrossRef]
  61. Mangalassery, S.; Mooney, S.J.; Sparkes, D.L.; Fraser, W.T.; Sjögersten, S. Impacts of zero tillage on soil enzyme activities, microbial characteristics and organic matter functional chemistry in temperate soils. Eur. J. Soil Biol. 2015, 68, 9–17. [Google Scholar] [CrossRef]
  62. Knight, T.R.; Dick, R.P. Differentiating microbial and stabilized β-glucosidase activity relative to soil quality. Soil Biol. Biochem. 2004, 36, 2089–2096. [Google Scholar] [CrossRef]
  63. Allison, S.D. Soil minerals and humic acids alter enzyme stability: Implications for ecosystem processes. Biogeochemistry 2006, 81, 361–373. [Google Scholar] [CrossRef]
  64. Acosta-Martínez, V.; Zobeck, T.M.; Allen, V. Soil Microbial, Chemical and Physical Properties in Continuous Cotton and Integrated Crop–Livestock Systems. Soil Sci. Soc. Am. J. 2004, 68, 1875–1884. [Google Scholar] [CrossRef] [Green Version]
  65. Acosta-Martínez, V.; Acosta-Mercado, D.; Sotomayor-Ramírez, D.; Cruz-Rodríguez, L. Microbial communities and enzymatic activities under different management in semiarid soils. Appl. Soil Ecol. 2008, 38, 249–260. [Google Scholar] [CrossRef]
  66. Chung, H.; Zak, D.R.; Reich, P.B.; Ellsworth, D.S. Plant species richness, elevated CO2, and atmospheric nitrogen deposition alter soil microbial community composition and function. Glob. Change Biol. Bioenergy 2007, 13, 980–989. [Google Scholar] [CrossRef] [Green Version]
  67. Jeon, K.W.; Jarvik, J. Mechanical Engineering of the Cytoskeleton in Developmental Biology; Academic Press: Cambridge, MA, USA, 1994. [Google Scholar]
  68. Guinet, M.; Nicolardot, B.; Durey, V.; Revellin, C.; Lombard, F.; Pimet, E.; Bizouard, F.; Voisin, A.S. Fixation symbiotique de l’azote et effet précédent: Toutes les légumineuses à graines se valent-elles ? Innov. Agron. 2019, 74, 55–68. [Google Scholar]
  69. Nicolardot, B.; Recous, S.; Mary, B. Simulation of C and N mineralisation during crop residue decomposition: A simple dynamic model based on the C:N ratio of the residues. Plant Soil 2001, 228, 83–103. [Google Scholar] [CrossRef]
  70. Justes, E.; Mary, B.; Nicolardot, B. Quantifying and modelling C and N mineralization kinetics of catch crop residues in soil: Parameterization of the residue decomposition module of STICS model for mature and non mature residues. Plant Soil 2009, 325, 171–185. [Google Scholar] [CrossRef]
  71. Tiemann, L.K.; Billings, S.A. Indirect effects of nitrogen amendments on organic substrate quality increase enzymatic activity driving decomposition in a Mesic grassland. Ecosystems 2011, 14, 234–247. [Google Scholar] [CrossRef]
  72. Peoples, M.B.; Brockwell, J.; Herridge, D.F.; Rochester, I.J.; Alves, B.J.R.; Urquiaga, S.; Boddey, R.M.; Dakora, F.D.; Bhattarai, S.; Maskey, S.L.; et al. The contributions of nitrogen-fixing crop legumes to the productivity of agricultural systems. Symbiosis 2009, 48, 1–17. [Google Scholar] [CrossRef]
  73. Mayer, J.; Buegger, F.; Jensen, E.S.; Schloter, M.; Heß, J. Estimating N rhizodeposition of grain legumes using a 15N in situ stem labelling method. Soil Biol. Biochem. 2003, 35, 21–28. [Google Scholar] [CrossRef]
  74. Wichern, F.; Mayer, J.; Joergensen, R.G.; Müller, T. Release of C and N from roots of peas and oats and their availability to soil microorganisms. Soil Biol. Biochem. 2007, 39, 2829–2839. [Google Scholar] [CrossRef]
  75. Wichern, F.; Eberhardt, E.; Mayer, J.; Joergensen, R.G.; Müller, T. Nitrogen rhizodeposition in agricultural crops: Methods, estimates and future prospects. Soil Biol. Biochem. 2008, 40, 30–48. [Google Scholar] [CrossRef]
  76. Jones, D.L.; Nguyen, C.; Finlay, R.D. Carbon flow in the rhizosphere: Carbon trading at the soil–root interface. Plant Soil 2009, 321, 5–33. [Google Scholar] [CrossRef]
  77. Kraljevic, D.; Sumanovac, L.; Plascak, I. Wheat and barley yield affected by the rotation of oilseed rape as the preceding crop. Cereal Res. Commun. 2008, 36, 1511–1514. [Google Scholar]
  78. Chen, B.; Liu, E.; Tian, Q.; Yan, C.; Zhang, Y. Soil nitrogen dynamics and crop residues. A review. Agron. Sustain. Dev. 2014, 34, 429–442. [Google Scholar] [CrossRef] [Green Version]
  79. Yang, L.; Han, R.; Sun, Y. Effects of Exogenous Nitric Oxide on Wheat Exposed to Enhanced Ultraviolet-B Radiation. Am. J. Plant Sci. 2013, 4, 1285. [Google Scholar] [CrossRef] [Green Version]
  80. Yuan, S.; Schuster, A.; Tang, C.; Yu, T.; Ortogero, N.; Bao, J.; Zheng, H.; Yan, W. Sperm-borne miRNAs and endo-siRNAs are important for fertilization and preimplantation embryonic development. Development 2016, 143, 635–647. [Google Scholar] [CrossRef] [Green Version]
  81. Guo, Z.; Han, J.; Li, J.; Xu, Y.; Wang, X. Effects of long-term fertilization on soil organic carbon mineralization and microbial community structure. PLoS ONE 2019, 14, e0211163. [Google Scholar] [CrossRef] [Green Version]
  82. Treseder, K.K. Nitrogen additions and microbial biomass: A meta-analysis of ecosystem studies. Ecol. Lett. 2008, 11, 1111–1120. [Google Scholar] [CrossRef] [PubMed] [Green Version]
  83. Liu, L.; Greaver, T.L. A global perspective on belowground carbon dynamics under nitrogen enrichment. Ecol. Lett. 2010, 13, 819–828. [Google Scholar] [CrossRef] [PubMed]
  84. Ramirez, K.S.; Craine, J.M.; Fierer, N. Nitrogen fertilization inhibits soil microbial respiration regardless of the form of nitrogen applied. Soil Biol. Biochem. 2010, 42, 2336–2338. [Google Scholar] [CrossRef]
  85. Geisseler, D.; Scow, K.M. Long-term effects of mineral fertilizers on soil microorganisms: A review. Soil Biol. Biochem. 2014, 75, 54–63. [Google Scholar] [CrossRef]
  86. Zhou, J.; Guan, D.; Zhou, B.; Zhao, B.; Ma, M.; Qin, J.; Jiang, X.; Chen, S.; Cao, F.; Shen, D.; et al. Influence of 34-years of fertilization on bacterial communities in an intensively cultivated black soil in northeast China. Soil Biol. Biochem. 2015, 90, 42–51. [Google Scholar] [CrossRef]
  87. Zhou, J.; Jiang, X.; Wei, D.; Zhao, B.; Ma, M.; Chen, S.; Cao, F.; Shen, D.; Guan, D.; Li, J. Consistent effects of nitrogen fertilization on soil bacterial communities in black soils for two crop seasons in China. Sci. Rep. 2017, 7, 3267. [Google Scholar] [CrossRef] [Green Version]
  88. Carrara, J.E.; Walter, C.A.; Hawkins, J.S.; Peterjohn, W.T.; Averill, C.; Brzostek, E.R. Interactions among plants, bacteria, and fungi reduce extracellular enzyme activities under long-term N fertilization. Glob. Chang. Biol. Bioenergy 2018, 24, 2721–2734. [Google Scholar] [CrossRef]
  89. Shen, C.; Xiong, J.; Zhang, H.; Feng, Y.; Lin, X.; Li, X.; Liang, W.; Chu, H. Soil pH drives the spatial distribution of bacterial communities along elevation on Changbai Mountain. Soil Biol. Biochem. 2013, 57, 204–211. [Google Scholar] [CrossRef]
  90. Ochoa-Hueso, R.; Collins, S.L.; Delgado-Baquerizo, M.; Hamonts, K.; Pockman, W.T.; Sinsabaugh, R.L.; Smith, M.D.; Knapp, A.K.; Power, S.A. Drought consistently alters the composition of soil fungal and bacterial communities in grasslands from two continents. Glob. Chang. Biol. Bioenergy 2018, 24, 2818–2827. [Google Scholar] [CrossRef]
  91. Johnson, N.C.; Wilson, G.W.T.; Wilson, J.A.; Miller, R.M.; Bowker, M.A. Mycorrhizal phenotypes and the Law of the Minimum. New Phytol. 2015, 205, 1473–1484. [Google Scholar] [CrossRef]
  92. Zhou, J.; Jiang, X.; Zhou, B.; Zhao, B.; Ma, M.; Guan, D.; Li, J.; Chen, S.; Cao, F.; Shen, D.; et al. Thirty four years of nitrogen fertilization decreases fungal diversity and alters fungal community composition in black soil in northeast China. Soil Biol. Biochem. 2016, 95, 135–143. [Google Scholar] [CrossRef]
  93. Ye, T.; Li, Y.; Zhang, J.; Hou, W.; Zhou, W.; Lu, J.; Xing, Y.; Li, X. Nitrogen, phosphorus, and potassium fertilization affects the flowering time of rice (Oryza sativa L.). Glob. Ecol. Conserv. 2019, 20, e00753. [Google Scholar] [CrossRef]
  94. Burns, R.G.; DeForest, J.L.; Marxsen, J.; Sinsabaugh, R.L.; Stromberger, M.E.; Wallenstein, M.D.; Weintraub, M.N.; Zoppini, A. Soil enzymes in a changing environment: Current knowledge and future directions. Soil Biol. Biochem. 2013, 58, 216–234. [Google Scholar] [CrossRef]
  95. Henry, H.A.L. Reprint of “Soil extracellular enzyme dynamics in a changing climate” Special Issue: Interactions of soil minerals with organic Components and Microorganisms VII and Enzymes in the Environment IV. Soil Biol. Biochem. 2013, 56, 53–59. [Google Scholar] [CrossRef]
  96. Giacometti, C.; Cavani, L.; Baldoni, G.; Ciavatta, C.; Marzadori, C.; Kandeler, E. Microplate-scale fluorometric soil enzyme assays as tools to assess soil quality in a long-term agricultural field experiment. Appl. Soil Ecol. 2014, 75, 80–85. [Google Scholar] [CrossRef]
  97. Zhang, X.; Dong, W.; Dai, X.; Schaeffer, S.; Yang, F.; Radosevich, M.; Xu, L.; Liu, X.; Sun, X. Responses of absolute and specific soil enzyme activities to long term additions of organic and mineral fertilizer. Sci. Total Environ. 2015, 536, 59–67. [Google Scholar] [CrossRef] [PubMed]
  98. Jian, S.; Li, J.; Chen, J.; Wang, G.; Mayes, M.A.; Dzantor, K.E.; Hui, D.; Luo, Y. Soil extracellular enzyme activities, soil carbon and nitrogen storage under nitrogen fertilization: A meta-analysis. Soil Biol. Biochem. 2016, 101, 32–43. [Google Scholar] [CrossRef] [Green Version]
  99. Holík, L.; Hlisnikovský, L.; Honzík, R.; Trögl, J.; Burdová, H.; Popelka, J. Soil microbial communities and enzyme activities after long-term application of inorganic and organic fertilizers at different depths of the soil profile. Sustainability 2019, 11, 3251. [Google Scholar] [CrossRef] [Green Version]
  100. Chen, Y.; Liu, J.; Liu, S. Effect of long-term mineral fertilizer application on soil enzyme activities and bacterial community composition. Plant Soil Environ. 2018, 64, 571–577. [Google Scholar] [CrossRef]
  101. Saiya-Cork, K.R.; Sinsabaugh, R.L.; Zak, D.R. The effects of long-term nitrogen deposition on extracellular enzyme activity in an Acer saccharum forest soil. Soil Biol. Biochem. 2002, 34, 1309–1315. [Google Scholar] [CrossRef]
  102. Billings, S.A.; Ziegler, S.E. Altered patterns of soil carbon substrate usage and heterotrophic respiration in a pine forest with elevated CO2 and N fertilization. Glob. Chang. Biol. Bioenergy 2008, 14, 1025–1036. [Google Scholar] [CrossRef]
  103. Sinsabaugh, R.L.; Lauber, C.L.; Weintraub, M.N.; Ahmed, B.; Allison, S.D.; Crenshaw, C.; Contosta, A.R.; Cusack, D.; Frey, S.; Gallo, M.E.; et al. Stoichiometry of soil enzyme activity at global scale. Ecol. Lett. 2008, 11, 1252–1264. [Google Scholar] [CrossRef]
  104. Kader, M.A.; Yeasmin, S.; Solaiman, Z.M.; De Neve, S.; Sleutel, S. Response of hydrolytic enzyme activities and nitrogen mineralization to fertilizer and organic matter application in subtropical paddy soils. Eur. J. Soil Biol. 2017, 80, 27–34. [Google Scholar] [CrossRef]
  105. Islam, M.O.; Bacchetti, T.; Ferretti, G. Alterations of Antioxidant Enzymes and Biomarkers of Nitro-oxidative Stress in Tissues of Bladder Cancer. Oxid. Med. Cell. Longev. 2019. [Google Scholar] [CrossRef] [PubMed] [Green Version]
  106. Paz-Ferreiro, J.; Trasar-Cepeda, C.; del Carmen Leirós, M.C.; Seoane, S.; Gil-Sotres, F. Intra-annual variation in biochemical properties and the biochemical equilibrium of different grassland soils under contrasting management and climate. Biol. Fertil. Soils 2011, 47, 633–645. [Google Scholar] [CrossRef] [Green Version]
  107. Vamerali, T.; Bona, S.; Mosca, G.; Sambo, P. Is the Root System the Key to Higher Nitrogen Uptake in Rapeseed. In The Supporting Roots of Trees and Woody Plants: Form, Function and Physiology; Springer: Dordrecht, The Netherlands, 2000; pp. 397–404. [Google Scholar] [CrossRef]
  108. Justes, E.; Beaudoin, N.; Bertuzzi, P.; Charles, R.; Constantin, J.; Durr, C.; Hermon, C.; Joannon, A.; Le Bas, C.; Mary, B.; et al. Réduire les fuites de nitrate au moyen de cultures intermédiaires: Conséquences sur les bilans d’eau et d’azote, autres services écosystémiques (Report); Open Archive TOULOUSE Archive Ouverte (OATAO): Toulouse, France, 2012; Available online: http://oatao.univ-toulouse.fr/16383 (accessed on 14 November 2020).
  109. Launay, M. Modélisation du Fonctionnement des Agrosystèmes et des Pathosystèmes Dans un Contexte de Changement Climatique (Habilitation à Diriger des Recherches); École doctorale 410 Sciences et Ingénierie des Ressources Naturelles (SIReNa), Université de Lorraine: Grand Est, France, 2019. [Google Scholar]
Figure 1. Schematic representation of crop succession including (a) plot design implemented in the selected farms (plot 1 and plot 2) and (b) history of crop management plan.
Agriculture 10 00548 g001
Figure 2. Total microbial communities, bacterial and fungal abundance in two crop succession (winter pea–wheat, rapeseed–wheat) at 3 sampling dates in the plot 1 (a) and plot 2 (b). Error bars on data points represent the standard errors of the mean of three replicates (n = 3). Letters indicate statistical significance between the 3 sampling dates and asterisks indicate statistical significance between the two successions (pea–wheat vs. rapeseed–wheat) at p < 0.05 according to Tukey’s test.
Agriculture 10 00548 g002
Figure 3. Enzyme activities in two crop successions (winter pea–wheat, rapeseed–wheat) at 3 sampling dates in the plot 1 (a) and plot 2 (b). Error bars on data points represent the standard errors of the mean of three replicates (n = 3). Letters indicate statistical significance between the 3 sampling dates and asterisks indicate statistical significance between the two successions (pea–wheat vs. rapeseed–wheat) at p < 0.05 according to Tukey’s test.
Agriculture 10 00548 g003
Figure 4. Patterns of the geometric mean of assayed enzymes determined in two crop successions (winter pea–wheat, rapeseed–wheat) at 3 sampling dates in plot 1 (a) and plot 2 (b). Error bars on data points represent the standard errors of the mean of three replicates (n = 3). Letters indicate statistical significance between the 3 sampling dates and asterisks indicate statistical significance between the two successions (winter pea–wheat vs. rapeseed–wheat) at p < 0.05 according to Tukey’s test.
Agriculture 10 00548 g004
Figure 5. Effects of crop successions with fertilization on soil mineral N rate (0–60 cm) at two sampling dates (autumn and winter) in the two studied plots: (a) plot 1, (b) plot 2. Error bars on data points represent the standard errors of the mean of three replicates (n = 3). Letters indicate statistical significance between the sampling dates (autumn and winter) and asterisks indicate statistical significance between the two successions (winter pea–wheat vs. rapeseed–wheat) at p < 0.05 according to Tukey’s test.
Agriculture 10 00548 g005
Figure 6. Principal component analysis of microbial abundance and enzyme activities and mineral N content in the two studied plots: (a) plot 1, (b) plot 2. GLU: β-D-glucosidase, NAG: N-acetyl-β-glucosaminidase, ARYLN: arylamidase, MGea: geometric means.
Agriculture 10 00548 g006
Table 1. Soil physicochemical properties in the two studied plots.
Plot 1Plot 2
Soil texture
 Clay (%)6.56 ± 0.32 b32.36 ± 2.16 a
 Silt (%)68.10 ± 1.52 a49.81 ± 1.77 b
 Sand (%)25.34 ± 1.81 a17.84 ± 1.53 b
pHwater7.40 ± 0.01 b7.58 ± 0.07 a
Total C (g kg−1 air dried soil)17.15 ± 3.82 b28.35 ± 2.97 a
Total N (g kg−1 air dried soil) 1.28 ± 0.20 a1.45 ± 0.36 a
Organic C (g kg−1 air dried soil)13.65 ± 2.22 b26.89 ± 2.13 a
Letters indicate significant difference between plot 1 and plot 2 at p < 0.05 according to Tukey’s test. The results are presented as the mean of three replicates (n = 3) ± the standard errors.
Table 2. Total, bacterial and fungal biomasses in the two studied plots in year 2 (wheat).
Plot 1Plot 2
With Fertilization Without Fertilization With Fertilization Without Fertilization
Total nucleic acid (µg g−1 dry soil)7.54 ± 0.56 a8.72 ± 0.30 a21.60 ± 1.77 a22.02 ± 3.29 a
Bacteria (copy number of 16S rDNA genes g−1 dry soil) (×108)32.51 ± 1.02 b34.68 ± 0.96 a0.52 ± 0.41 a0.51 ± 0.38 a
Fungi (copy number of 18S rDNA genes g−1 dry soil) (×107)22.13 ± 4.32 a26.78 ± 5.05 a2.23 ± 0.88 a2.68 ± 0.78 a
β-glucosidase activity (mU g−1 dry soil)16.67 ± 0.38 a14.51 ± 0.54 b20.50 ± 0.53 a18.81 ± 0.90 b
Arylamidase activity (mU g−1 dry soil)2.86 ± 0.16 b3.18 ± 0.18 a4.77 ± 0.18 b5.24 ± 0.26 a
N-acetyl-glucosaminidase activity (mU g−1 dry soil)2.00 ± 0.08 b2.53 ± 0.39 a3.16 ± 0.12 a3.18 ± 0.08 a
Letters indicate significant difference in crop succession with and without fertilization at p < 0.05 according to Tukey’s test. The results are presented as the mean of three replicates (n = 3) ± the standard errors.
Table 3. STICS simulation of databases of the two plots for each crop.
Plot 1 Plot 2
Winter PeaWheatRapeseedWheatWinter PeaWheatRapeseedWheat
2016–20172017–20182016–20172017–20182017–20182018–20192017–20182018–2019
Simulation period (month)Nov–JulOct–JulSep–AugOct–JulOct–AugOct–AugAug–JulOct–Aug
Rainfall (mm)382474470676718474777474
Initial soil NO3 (kg N ha−1)2459029510211312814790
Final soil NO3 (kg N ha−1)140118136111134127110117
N2 and N2O losses (kg ha−1) 118820016418
N leached (kg N ha−1)000023000
Yield grain simulation (t ha−1) 3.486.343.076.293.119.403.779.15
Yield grain observed (t ha−1)6.009.504.009.203.5012.503.8712.00
Publisher’s Note: MDPI stays neutral with regard to jurisdictional claims in published maps and institutional affiliations.

