Abstract
Maize cultivation faces some challenges, particularly in terms of low biodiversity in fields. Since maize is a highly efficient and economic crop, it is cultivated on large areas in Germany, with a high share in crop rotation, especially where cattle farming takes place. Such landscapes provide less habitat and food resources for small vertebrates and arthropods. Intercropping maize with flowering partners might have a positive effect on the environment and might promote biodiversity in agricultural ecosystems. Therefore, in two-year field experiments on three sites in south-western Germany, plants were tested for their suitability as intercropping partners in maize crops (Medicago sativa, Melilotus officinalis, Vicia sativa, Tropaeolum majus, Cucurbita pepo, and Phaseolus vulgaris). Almost all tested partners produced flowers, except M. officinalis. Intercropping maize with P. vulgaris or T. majus achieved comparable dry matter yields as sole maize, without changes in the biomass quality. For maize-intercropping, site adapted weed control and practicable sowing technique are mandatory, which already exist for P. vulgaris and T. majus. The study shows that intercropping maize with biodiversity-enhancing flowering partners can provide an applicable alternative to sole maize cropping and enhance biodiversity. The large production areas of maize have great potential for ecological improvements in agriculture.
Keywords:
maize; Zea mays L.; biodiversity; intercropping; silage; growth; yield; quality; legume; non-legume 1. Introduction
Modern agriculture has to face several challenges in the next decades. It has to secure an adequate supply of food, feed, fuel, and fiber for a growing world population under the current situation that 24 billion Mg of fertile soil are annually lost due to erosion, and an increasing land desertification [1,2]. Additionally, there is a loss of biodiversity, which is partly caused by expansion and intensification of modern agriculture [3]. In landscapes dominated by agriculture, a loss of pollinators and wildflowers as their food resources among other things can be observed [4]. While 90% of the plants are dependent on animal pollination, 58 out of 130 crop pollinating bee species in the EU are threatened. Pollinators contribute up to 35% to the global crop yields and if their numbers continue to decline, global food supply can no longer be guaranteed [5]. For their survival, pollinators need habitat diversity [6]. In most agricultural landscapes, the structural diversity declines or no longer exists [7].
To counteract these current problems, future cropping systems should be productive and sustainable in ecological, economic, and social ways. Therefore, intercropping could make a valuable contribution.
Intercropping is the practice of cultivating more than one crop simultaneously on the same area of land. There are some different forms of intercropping, like strip-, row-, mixed-, or relay-intercropping, just to mention the most popular ones [8]. The advantages of intercropping range from ecological and economic to social benefits. Gebru [9] listed the most common advantages of intercropping, which can be found in literature; it prevents soil from erosion and desiccation by more ground coverage, yields can be more stable in unsteady seasons and higher under normal growing conditions, and there is an income diversification by different crops and different working peaks.
Intercropping has always been the most widespread form of cropping system in (sub-) tropical and developing countries. Maize (Zea mays L.) is one of the most cultivated plants in these regions and ensures the food supply of the population. With 48.5 million Mg harvested in 2018 in the least developed countries, maize (grain and silage) ranked in second place after paddy rice, before wheat [10].
For these developing countries intercropping maize is the common practice. Maize is mostly intercropped with legumes (Phaseolus vulgaris L., Glycine max (L.) MERR., Arachis hypogaea L.), vegetables (Solanum tuberosum L., Raphanus sativus var. sativus L., Spinacia oleracea L., Cucurbita spp. L.), or cereals like wheat (Triticum aestivum L.) [10,11,12,13,14,15,16,17,18]. Mostly, legume crops were intercropped due to their ability for biological nitrogen fixation [19].
In the industrialized countries maize-intercropping is generally not used. Knörzer et al. [20] showed that in Africa and Asia the small farm structure and the land scarcity make intercropping common.
Especially the cropping of maize related to some negative environmental effects due to its growth habits and cropping system. Maize has a slow initial development and late canopy closure, which encourage erosion and nitrate leaching into groundwater bodies [20,21,22,23,24].
Maize cultivation covers large areas of land. In Germany, 2.6 million ha out of 11.7 million ha of arable land were cropped with maize in 2018, 84% for silage maize production [25]. In the federal state of Baden-Württemberg, 17% of the 814,600 ha arable land were cultivated with silage maize and 7% with maize for grain use in the same year [26].
Therefore, intercropping could be an option to increase the biodiversity in agricultural ecosystems [27]. The additional cropped plants will elongate the flowering period which could offer a food basis and create habitats for small vertebrates and some arthropods (hymenoptera, coleoptera, lepidoptera, and diptera). Additional ground coverage by the partner can reduce nitrate leaching and erosion. A study from Denmark with silage maize showed that intercropping with Festuca rubra (L.) could reduce nitrate leaching by 15–37% (depending on soil type and crop rotation) [28]. Yields comparable to those in monocropping are achievable, as shown in Iran. Javanmard et al. [29] showed that intercropping of maize with vetch (Vicia villosa ROTH), bitter vetch (Vicia ervilia (L.) WILLD.), berseem clover (Trifolium alexandrinum L.), and common bean (Phaseolus vulgaris L.) resulted in higher biomass yields due to the use of different soil layers by the root systems of the different intercropping partners By increasing the crude protein of the harvest material, the purchase of protein feed might be reduced. Especially for the regions in Baden-Württemberg, such as the Markgräfler Land, Bruchsal-Mannheim-Heidelberg, Kraichgau, Stuttgart-Heilbronn, Main-Tauber-Kreis, and Upper Swabia with a high biogas plant and/or livestock density and maize cultivation in general and also high nitrate loads in the groundwater, maize intercropping could be an interesting alternative [30].
Therefore, if maize cultivation uses large areas of land, and the current cultivation system has negative effects on the environment (monoculture, late canopy closing, nitrate leaching, limited habitats, and food resources), and small vertebrates and arthropods, then intercropping partners that provide an additional flowering aspect and ground coverage can be beneficial for biodiversity. To the best of our knowledge, there are only few approaches to create a biodiversity aspect in silage maize with Phaseolus beans or flowering mixtures [31,32,33,34,35]. Therefore, the objectives of this study were to: (i) test different legume and non-legume plants for their suitability for intercropping systems with maize, and to enhance the flowering aspect in silage maize stands; (ii) determine the effects of these partners on maize growth and yield; and (iii) determine the effects on composition of the harvested biomass.
2. Materials and Methods
2.1. Site Conditions and Climate
The field experiments were carried out from 2018 to 2019 on two experimental sites at the Centre for Agricultural Technology Augustenberg (Ettlingen and Forchheim am Kaiserstuhl) and at the experimental station Tachenhausen of the Nuertingen-Geislingen University in Southwest Germany (Table 1).

Table 1.
Site characteristics of the three experimental sites Ettlingen (ET), Tachenhausen (TH), and Forchheim am Kaiserstuhl (FAK).
The weather in 2018 was dry and hot, with only 261 mm precipitation during the main growing season (March to October) at ET (deficit of 270 mm, compared to the mean long-term annual precipitation), 388 mm at TH (deficit of 153 mm) and 290 mm at FAK (deficit 371 mm). Spring 2019 was more favorable than in 2018. April was rather warm, while May was cold. Summer was warm again. During the main growing season in 2019 482 mm precipitation occurred in ET (deficit 49 mm), 597 mm in TH (deficit 76 mm), while with 585 mm in FAK, a precipitation plus of 56 mm was documented. Climate charts can be found in the Appendix A (Figure A1, Figure A2 and Figure A3).
2.2. Experimental Design
At ET, the previous crops were sweet corn (Zea mays L.) in summer 2017 and a mixture of Sinapsis alba (L.) and Raphanus sativus var. oleiformis (Pers.) as green manure over winter. In TH 2017, winter wheat (Triticum aestivum L.) and in 2018 spring barley (Hordeum vulgare L.) were grown as previous crops followed by a fallow over both winter times. In FAK in both years, the previous crop was potato (Solanum tuberosum L.), also followed by fallow over winter.
ET was only rated in 2018. Therefore, a split-split-plot design with three replicates was used. The three factors tested were; the amount of nitrogen fertilizer (N-Level, main plot), the placement of the IFP seeds (seed placement, subplot 1) and nine different intercropped flowering partners (2018) (IFP, subplot 2). The three levels of nitrogen fertilization consist of 0%, 50%, and 100% of the required nitrogen demand of a sole silage maize crop. The seed placement of the IFP was either between the maize rows (BR) or in the maize rows (IR). Therefore, the IFP was sown close to the maize rows, which should simulate a simultaneous sowing of maize and IFP. Sowing rates of the IFP were set according to the amount used to establish a sole crop stand (Table 2). The flowering partners for intercropping were chosen according to their flowering properties and the attractiveness/food supply for insects. Nitrogen fertilization took place on 25 April 2018 and 19 April 2019. The required fertilizer nitrogen amount in 2018 was 172 kg ha−1 under 100% and 86 kg ha−1 under 50%. The used fertilizer was ALZON 46 (46% total-nitrogen as urea with 2-cyanoguanidine and 1,2,4-triazole as nitrification inhibitor). Fertilizer amount was based on accepted local fertilization recommendations, taking residual soil nutrient from soil tests into account.
Table 2.
The used intercropped flowering partners (IFPs), varieties, sowing rates, and the 1000-grain mass.
At TH and FAK, a randomized complete block design with four replicates, and nine (2018) and 12 (2019) IFP treatments were used, respectively. In TH and FAK, no nitrogen was applied (0% N), and the IFP were only sown in the maize rows (IR).
Maize and IFP were sown on the same day (ET 3 May 2018, TH 28 May 2018 and 15 May 2019, FAK 9 May 2018 and 14 May 2019). Maize (Zea mays L., cv. “Figaro”) was sown at 0.03 m sowing depth, with a row distance of 0.75 m and a planting density of 8 plants m−2 by a four-row pneumatic precision planter. Each plot consisted of four rows of maize. Four rows of IFP were sown after maize sowing by a plot seeder (type “Hege 80 PNI,” Zürn Harvesting GmbH & Co. KG. Schöntal-Westernhausen, Germany, sowing width = 3 m, 4 rows with 0.75 m inter-row spacing). The sowing rate of 8 maize plants m−2 was chosen to enable the comparison to the maize–common bean intercropping treatments. In this system, maize is typically established with 8 plants m−2.
At the conventional managed location ET in 2018 weed control was done in treatment M, MS1, MS2, MB1 and MB2 with a mixture of 2.8 L ha−1 Pendimethalin (455 g active ingredient L−1) and 1.0 L ha−1 Dimethenamid-P (720 g a.i. L−1) as pre-emergence treatment. Treatment MN was treated in pre-emergence with 1.75 L ha−1 Pendimethalin (455 g a.i. L−1). Treatment MA and MC were treated in post-emergence with 2.2 L ha−1 Pendimethalin (455 g a.i. L−1). At TH in 2018 only treatment M, MB1 and MB2 were treated with 2.8 L ha−1 Pendimethalin (455 g a.i L−1) and 1.0 L ha−1 Dimethenamid-P (720 g a.i. L−1) as pre-emergence treatment and treatment MA was treated with 2.2 L ha−1 Pendimethalin (455 g a.i. L−1) in post-emergence. In 2019, herbicide application for M, MB1, MB2, and MA were the same as in 2018, additionally MV was treated with 2.2 L ha−1 Pendimethalin (455 g a.i L−1) in post-emergence and treatment MN with 1.75 L ha−1 Pendimethalin (455 g a.i. L−1) in pre-emergence. No chemical weed control was done in MS1, MS2, MS3, MM1, and MM2. Under organic management hoeing was carried out in 2018 three times (26 May 2018, 28 May 2018, and 5 June 2018). In 2019, the experimental site was two times cultivated by tine harrow (24 May 2019 and 27 May 2019) and three times hoed (1 June 2019, 13 June 2019, and 18 June 2019). In TH and FAK, hand weeding was done on demand. Applications of Trichogramma brassicae (Latreille) against Ostrinia nubilis (Hübner) were done according to the recommendations [36].
Plots were 12 m (ET), 11 m (TH), 10 m (FAK) long, and 3 m broad, consisting of a total of four rows maize and four rows of IFP per plot. Core plots for chopping were 10 m (ET), 9 m (TH), 8 m (FAK) long, and 1.5 m broad including two maize and IFP rows and leaving two rows of maize and IFP on the left and the right of the plot as a border. The complete experiments were enclosed to the right and the left by border plots (four maize rows, 0.75 cm row spacing) in order to protect the experiments from external influences.
Harvest was done by a plot harvester (type “BAURAL SF 2000”, Zürn Harvesting GmbH & Co. KG, Schöntal-Westernhausen, Germany, cutting width = 1.50 m) at dough stages of maize (ET 13 August 2018, TH 31 August 2018 and 17 September 2019, FAK 24 August 2018 and 5 September 2019).
2.3. Data Collection and Statistical Analysis
The dates of beginning and end of flowering of maize and the IFP were determined. For maize flowering was the time of anthesis (♂: from tassel visible until flowering completed; ♀: tip of ear emerging from leaf sheath until stigmata completely dry; [37]), for IFP when the first flowers were present until no more flowers were present. Prior to harvest plant height from soil surface to tassel tip of maize was measured. To determine the share of maize and IFP in the harvested biomass in ET a section harvest of 1.5 m × 0.67 m, in TH 1.5 m × 1.0 m and in FAK 1.5 m × 0.33 m was cut two weeks before harvest. Cutting height was the height at which the plot harvester later cuts the crops (0.15 m). All plant biomass in this area (maize, IFP, and weeds) was cut. The total weights of the fractions were determined, and the dry matter yield (DMY) and dry matter content (DMC) were determined gravimetrically after oven drying the material at 105 °C for 48 h.
Due to the high number of plots in ET in 2018 only 0% and 100% nitrogen fertilizer levels and only IR sowing were rated in combination with the IFP. Common vetch (MV) was not included due to a high weed infestation. In plots with the summer squashes I and II (MS1, MS2) no squash grew up, and were excluded from statistical analysis. In FAK treatment MA in 2018, and in 2019, the treatments MA, MC, MS1, MS2, and MM1 were not tested. The alfalfa in treatment MA was damaged due to mechanical weed management, also the yellow sweet clover (MC). Both squashes (MS1, MS2) had no biomass contribution to the yield due to the flat growth habits. The field emergence of the squashes in mixture I (MM1) was uneven with large gaps. Such strong weed infestation as seen in ET did not occur in TH and FAK. In addition, weeds that had survived the chemical and mechanical weed treatments in TH and FAK could be controlled by hand weeding due to the smaller scope of the test compared to ET. The sites in TH and FAK also did not had as much weed potential as ET.
At harvest all plants of all core plots were chopped by plot harvester (0.15 m above surface level). The chopper gravimetrically determined the fresh weight of the biomass. Two samples of 2 kg of each plot were extracted; one sample was dried for 48 h at 105 °C to determine the DMY and DMC, and the other sample was dried for 48 h at 60 °C for chemical analysis.
Chemical analyses of the plant material were done for the parameter’s crude protein (CP), crude fat (CL), crude fiber (CX), and crude ash (CA). The analyses were done as described in Bassler [38]. The nitrogen-free extracts (NfE) was calculated as the difference between 100% and the sum of the percentage amount of CP, CF, CX, and CA. Biogas and methane yield were calculated after the formula of Schattauer and Weiland [39]. The calculation of the feed parameters gross energy (GE), metabolizable energy (ME) and net energy for lactation (NEL) for dairy cattle feeding were done after Steinhöfel et al. [40]. Soil mineral N (NO3-N) analyses “after harvest” (direct after chopping) and at “end of vegetation period” (= end of growing season, when the weather causes a plant growth stop) were done separately for the three soil layers, 0–30 cm, 30–60 cm, and 60–90 cm. After drying (105 °C), milling (<2 mm), and homogenization, 100 mL of CaCl2 were added to 25.0 g of soil material. After overhead shaking (30 min, 30 rpm), the suspension was filtered and the NO3-N was determined by continuous-flow analysis [41,42].
Statistical analyses were done with the free software R (version 3.6.2) as mixed-model. After finding significant differences via F-Test, differences between treatments were compared at α = 5% using Tukey’s Honestly Significant Difference (HSD) test. For creating the letter, the display package “multcomp” was used [43].
The experimental design was a randomized complete block design with four replicates for TH and FAK, where only IFP treatments were tested. For analyzing the growth, yield and quality parameters the used, fitted model was
where yij is the response, μ the general effect, ri the fixed effect of the i-th replicate, gj the fixed effect of the j-th IFP, and eij the residual error of yij.
In ET, the experimental design was a three-times replicated split-split-plot. The main plots were the level of nitrogen fertilization (0%, 50%, and 100%). The subplots 1 were the position of the IFP (BR vs. IR). Subplots 2 were the different IFP treatments. For analyzing the growth, yield, and quality the used, fitted model was
where yijkl is the response, μ the general effect, ri the fixed effect of the i-th replicate, dj the fixed effect of the j-th nitrogen level, ok the fixed effect of the k-th seed placement, gl the fixed effect of the l-th IFP, rdij the random interaction between the i-th replicate and the j-th nitrogen level, rdoijk the random interaction between the i-th replicate, the j-th nitrogen level and the k-th seed placement, dgjl the random interaction between the j-th nitrogen level and the l-th IFP, ogkl the random interaction between the k-th seed placement and the l-th IFP, dogikl the random interaction between the i-th nitrogen level, the k-th seed placement, and the l-th IFP and eijkl is the residual error of yijkl.
Normal distribution and homogeneity of variance were checked graphically.
Due to the weather extreme the statistical analyses were done for each year separate; the significant effect of the year masked the variance within the IFP. The analyses were done separately for each experimental location due to the differences in management and the differences in experimental set-up (ET: conventional, three-factorial, TH: conventional, one-factorial and FAK: organic, one-factorial). Pearson’s coefficient of correlation for ET in 2018 were calculated using the R package “corrplot” [44].
3. Results
3.1. Flowering Period, Plant Growth, and Soil Nitrate Content
Experiments showed that maize flowering started between 60 and 70 days after sowing (DAS) and lasted for a short period between nine (FAK 2018) and 21 days (ET 2018) (Table 3). Beside of yellow sweet clover (MC), all IFP provided an additional period with flowers. Alfalfa (MA) was buried during the mechanical weeding process in FAK. Common vetch (MV) had the earliest flowering initiation of all IFP at all locations and years. On average, 40 DAS flowering started. However, flowering did not last for a long time in 2018 in ET and TH. After nine and 28 days of flowering, the common vetch was infested by Erysiphaceae (TUL. & C. TUL.) spp. and the plants died. Since the flowers of summer squashes I–III (MS1, MS2, MS3) and nasturtium (MN) were below the cutting height of the crop chopper, these IFP build up flowers even after maize harvest. In case of the common beans (MB1, MB2), it was observed that the first flowers appeared very late, more than 60 DAS. They even flower after maize anthesis and sometimes shortly before harvest.
Table 3.
Days after sowing (DAS) until begin of flowering (SBF) and end of flowering (SEF), and the whole flowering time of maize and the different intercropped flowering partner (IFP) treatments (Δ = flowering period in days) for Ettlingen (ET), Tachenhausen (TH), and Forchheim am Kaiserstuhl (FAK) in 2018 and TH and FAK in 2019. The flowering periods of maize in the intercropping treatments corresponded to those of the maize in the control. For reasons of simplicity, the intercropped treatments only show the flowering periods of the IFP.
The combined cultivation of maize and IFP did not affected the final height of maize in ET 2018 (Table 4). At ET no significant influence of N-level (p = 0.055) or intercropped seed placement (p = 0.326) on final maize plant height were observed in 2018 (Table 4). The IFP also did not show differences on plant height (p = 0.817). At TH (p = 0.943) and FAK (p = 0.225), there were also no significant changes in plant height in 2018 (Table 5 and Table 6). In 2019, TH (p < 0.001) and FAK (p < 0.001) had significant differences in plant height. At TH, the highest values for maize plant height were found in the control, without any intercropping partner (M) with 341 cm, while the height of the maize in the intercropping plots with nasturtium (MN), summer squash I and II (MS1, MS2), and mixture I (MM1) was not significantly different from the control (M). In FAK, only common vetch (MV) and mixture II (MM2) were significantly different from the control (M), with 253 cm and 259 cm compared to 291 cm (Table 6).
Table 4.
Growth parameters plant height (cm), dry matter yield (DMY, Mg ha−1), dry matter content (DMC, %), and the share of maize, intercropped flowering partners (IFP), and weed of the DMY from section harvest (%); for the three factor levels N-level, seed placement of IFP and the different IFP treatments at Ettlingen (ET) in 2018.
Table 5.
Growth parameters plant height (cm), dry matter yield (DMY, Mg ha−1), dry matter content (DMC, %), and the share of maize and intercropped flowering partners (IFP) of the DMY from section harvest (%); for the different IFP treatments at Tachenhausen (TH) 2018 and 2019.
Table 6.
Growth parameters plant height (cm), dry matter yield (DMY, Mg ha−1), dry matter content (DMC, %) and the proportion of maize, intercropped flowering partners (IFP) and weed of the DMY from section harvest (%); for the different IFP treatments at Forchheim am Kaiserstuhl (FAK) 2018 and 2019.
In 2018, the DMY was significantly influenced by N fertilization in ET (p = 0.004) (Table 4). Full fertilizer application yielded the highest DMY, while there was no difference whether 100% of the required N is applied or 50% (Table 4). In 2018, no differences were measured whether the IFP was sown in the rows or between. The strongest influence on DMY was caused by the IFP used (p < 0.001). Significant lower yields compared to the control (M) were found by intercropping with alfalfa (MA), yellow sweet clover (MC) and common vetch (MV). Intercropping with nasturtium (MN) or common beans (MB1, MB2) showed no significant difference compared to 15.6 Mg ha−1 DMY in the control. At TH significant IFP influences on DMY in both years were determined (p = 0.003 and <0.001) (Table 5). In 2018, common vetch (MV) showed with 11.5 Mg ha−1 the lowest DMY, which were not different from the control (M) in 2018, while in 2019 common vetch (MV) and mixture II (MM2) had significant lower DMY compared to the control (M), with 17.9 Mg ha−1. Significant differences in the DMY were only found in 2019, not in 2018 (Table 6). Significantly lower DMY were found for common vetch (MV), summer squash III (MS3), and mixture II (MM2) in 2019.
The fractioning of the plant biomass in ET 2018 showed no significant influence of the N-Level on the share of maize, IFP and weed (p = 0.504, p = 0.067 and p = 0.198) (Table 4). The use of an IFP did not reduce the share of maize (p = 0.341). The IFP with the highest share in the harvested biomass were the common beans (MB1, MB2). They had a share of 3.45 and 4.28%, while nasturtium (MN) with 0.61% had a low share of the harvested biomass. With a share of more than 87.0% maize was the main yield component. At TH in 2018 a significant influence by IFP on the share of maize biomass was observed (p < 0.001) (Table 5). The smallest proportions of maize were found with 94.5% when intercropped with common vetch (MV). In 2019 there was also a significant influence of the IFP on the maize proportion (p < 0.001). Smallest maize proportion was found under intercropping with both mixtures (MM1, MM2) and with common bean I (MB1). FAK in 2018 showed no significant influence on maize proportion by IFP (p = 0.221) (Table 6). In this year also there was a weed share between 1.55% (MS2) and 6.67% (MB2). The highest proportion of IFP in the harvested biomass was found in common vetch (MV) in 2018 and mixture II (MM2) in 2019 at 5.78% and 3.96%, respectively. Both years and all locations showed that intercropping maize leads to maize proportions of >81.8% in the harvested biomass.
In 2018, in ET, the soil NO3-N content was mainly influenced by the N-level (p < 0.001), in 0–30 cm and 30–60 cm depth after harvest, and at end of vegetation period, respectively. IFP showed in ET no influence after harvest (Figure 1). The seed placement also did not show an influence at any layer and both dates.
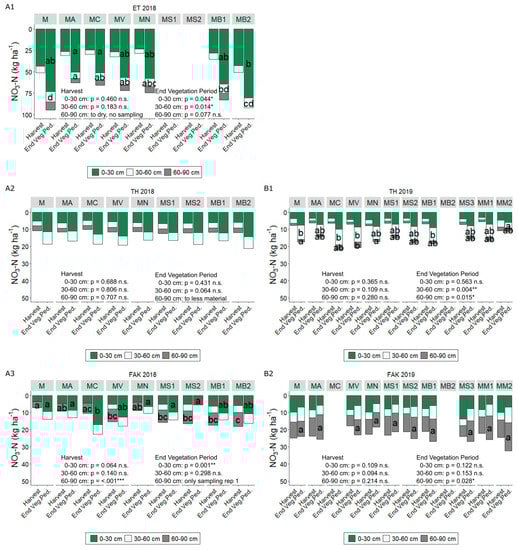
Figure 1.
NO3-N (kg ha−1) of soil samplings for the different intercropped flowering partner (IFP) treatments (M Maize (Control), MA Maize + Alfalfa, MC Maize + Yellow sweet clover, MV Maize + Vetch, MN Maize + Nasturtium, MS1 Maize + Summer Squash I, MS2 Maize + Summer Squash II, MB1 Maize + Common Bean I, MB2 Maize + Common Bean II, MS3 Maize + Summer Squash III, MM1 Maize + Mixture I, MM2 Maize + Mixture II) in Ettlingen (ET) (2018 A1), Tachenhausen (TH) (2018 A2, 2019 B1) and Forchheim am Kaiserstuhl (FAK) (2018 A3, 2019 B2) after harvest and at the end of the vegetation period (End.Veg.Ped.; =end of growing season, when the weather causes a plant growth stop) for the three depths 0–30 cm (green bars), 30–60 cm (white bars), and 60–90 cm (gray bars). Bars with the same letter within one depth and one sampling date indicate non-significant differences (HSD-test, α = 5%).
At the end of the vegetation period, the layers from 0–30 cm and 30–60 cm showed significant differences by the IFP used (p = 0.044 and p = 0.014) (Figure 1). Common bean II (MB2) had the significant highest amount with 80.4 kg ha−1 NO3-N in the upper layer, while in the middle layer both beans (MB1, MB2) did not differ significantly from the control (M). In TH, no significant influence by IFP on soil NO3-N content was found in any soil layers, for the two dates and in 2018. In 2019, mixture II (MM2) had significant lower NO3-N contents with 3.14 kg ha−1 compared to 8.41 kg ha−1 NO3-N in the control (M) at the end of the vegetation period in 30–60 cm. Also, at the 60–90 cm layer common vetch (MV) had higher NO3-N contents than control (M), 3.25 compared to 1.49 kg ha−1 NO3-N.
Differences at FAK after harvest in 2018 were only detectable in the deepest layer. Common vetch (MV) and common bean II (MB2) showed increased contents of 103% and 125% compared to the control (M), respectively. At the end of the vegetation period, intercropping with yellow sweet clover (MC) showed NO3-N contents of 17.1 kg ha−1, while the control had 9.48 kg ha−1 in the upper layer.
3.2. Quality Parameters
In 2018, the DMC was neither significantly influenced by N-level (p = 0.536), nor by seed placement of the IFP (p = 0.294) (Table 4). Only the IFP itself had a significant influence on the DMC (p = 0.012). With 34.0% nasturtium intercropping (MN) showed the highest DMC, which did not differ from the control. All DMC were in a range were ensiling could take place. At FAK (Table 6), no differences were found in 2018 (p = 0.096), but the DMC for some IFP were over the recommended ensiling maximum of 40% DMC due to the hot and dry weather, which accelerated the ripening. For TH in 2018, significant differences were observed (p = 0.003), DMC of yellow sweet clover (MC) intercropped plots were significantly higher from the control (M). In 2019, no significant differences were found between the IFP.
The N-level had a significant influence on the content of CP in the biomass at harvest time (p < 0.001) (Appendix A Table A1). With increasing N-level there was a significant increase in CP. The highest content was achieved at 100% N-level, with 8.91%. The placement of the IFP seeds did not have an influence on CP (p = 0.236), while the influence of IFP was significant (p < 0.001). The only statistical influence between the IFP could be found between common vetch (MV), with 9.97% and all the other IFP (Figure 2). Control (M) achieved 7.08%. In 2018 at TH, nasturtium (MN) and both summer squashes (MS1, MS2) had lower CP contents than the control. In the second season, nasturtium (MN) and summer squash I and III (MS1, MS3) showed once again significantly reduced CP contents compared to the control (6.09%), while mixture II (MM2) showed an increase.
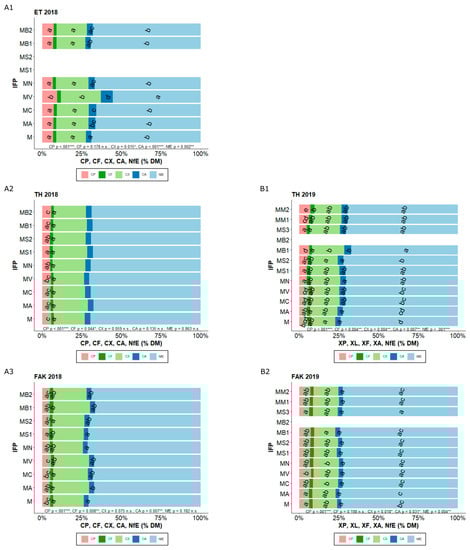
Figure 2.
CP (crude protein), CF (crude fat), CX (crude fiber), CA (crude ash), and NfE (nitrogen-free extracts) content (% of DM) for the different intercropped flowering partner (IFP) treatments (M Maize (Control), MA Maize + Alfalfa, MC Maize + Yellow sweet clover, MV Maize + Vetch, MN Maize + Nasturtium, MS1 Maize + Summer Squash I, MS2 Maize + Summer Squash II, MB1 Maize + Common Bean I, MB2 Maize + Common Bean II, MS3 Maize + Summer Squash III, MM1 Maize + Mixture I, MM2 Maize + Mixture II) in Ettlingen (ET) (2018 A1), Tachenhausen (TH) (2018 A2, 2019 B1), and Forchheim am Kaiserstuhl (FAK) (2018 A3, 2019 B2). Bars with the same letter within one parameter indicate non-significant differences (HSD-test, α = 5%).
For FAK in both years, CP differences were measured (Figure 2), while in 2018, the summer squash I (MS1) had lower CP contents than the control. In 2019, common vetch (MV) had higher CP contents. No other intercropping treatment showed significant changes.
Neither the N-level (p = 0.407, p = 0.694, and p = 0.324) nor the seed placement (p = 0.854, p = 0.725, and p = 0.870) had significant influences on CF, CX, and CA content in ET 2018 (Table A1). The IFP also did not have an influence on the CF content (p = 0.178) (Figure 2). Common vetch intercropping (MV) showed higher CX contents than the control (M), while nasturtium (MN) and both beans (MB1, MB2) had comparable CA contents with the control. The NfE content was influenced by the N-level (p = 0.003) but not by the seed placement of the IFP (p = 0.959) (Appendix A Table A1). A high fertilization leads to lower NfE contents. The NfE behaved in the opposite way to the CP. Common vetch (MV) showed the significant lowest NfE contents in ET (Figure 2). In TH there were no significant differences between the IFP in 2018 for CF, CX, CA, and NfE, while in 2019, significant differences were observed for all parameters. For CF, none of the IFP differs from the control, while for CX and CA common bean I (MB1) had significantly higher amounts. For the NfE, all IFPs, except alfalfa intercropping (MA), had lower contents than the control. In FAK, only CF (p = 0.008) and CA (p = 0.007) showed significant differences in 2018. For CF, common bean I (MB1) showed higher contents than the control (M), while for CA, alfalfa (MA) had higher contents. In the second year, CX, CA, and NfE (p = 0.018, p = 0.031, and p = 0.004) showed significant differences, but none of the IFP was different from the control, except the summer squash III (MS3), which had a lower amount of NfE.
For use as feedstock in biogas plants, besides the DMY, the amount of produced biogas and methane are important factors. Only the N-level had a significant influence on the biogas yield (p < 0.001) (Appendix A Table A1). Significant decreases in biogas yields were found for 100% N fertilization compared to 0 and 50%, respectively, while the N-Level had no influence on methane yield (p = 0.714). Placement of IFP seed showed no influence on biogas and methane yield (p = 0.546 and p = 0.733) (Appendix A Table A1). The IFP had an influence on these two parameters in ET 2018 (p = 0.025 and p = 0.016) (Figure 3). Common vetch (MV) showed significantly lower biogas and methane yields, compared to the control (M). While the control achieved yields of 556 L kg−1 oDMC (organic DMC) for biogas and 300 L kg−1 oDMC for methane, intercropping with common vetch (MV) reduced these values to 539 L kg−1 and 294 L kg−1 oDMC, respectively. For TH, the response of the IFP on biogas and methane yield depended on the experimental year, while in 2018, biogas and methane yield were significantly increased by intercropping with common bean I (MB1), and in 2019, both yields were significantly decreased by intercropping with common bean I (MS1). In FAK, there were no significant differences on the biogas or methane yield for any of the IFP used, neither in 2018 nor in 2019.
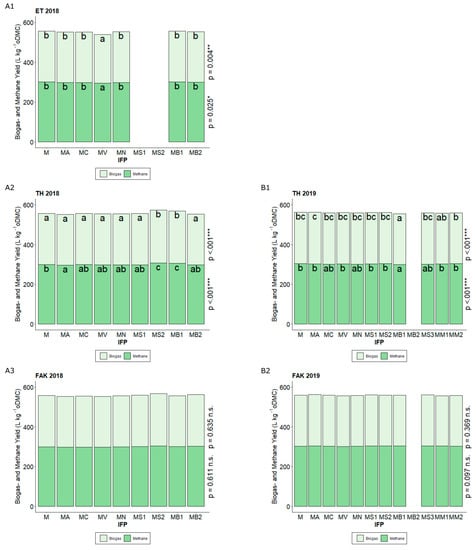
Figure 3.
Biogas and Methane yields (L kg−1 oDMC) for the different intercropped flowering partner (IFP) treatments (M Maize (Control), MA Maize + Alfalfa, MC Maize + Yellow sweet clover, MV Maize + Vetch, MN Maize + Nasturtium, MS1 Maize + Summer Squash I, MS2 Maize + Summer Squash II, MB1 Maize + Common Bean I, MB2 Maize + Common Bean II, MS3 Maize + Summer Squash III, MM1 Maize + Mixture I, MM2 Maize + Mixture II) in Ettlingen (ET) (2018 A1), Tachenhausen (TH) (2018 A2, 2019 B1), and Forchheim am Kaiserstuhl (FAK) (2018 A3, 2019 B2). The upper end of each colored section in the stacked bars shows the respective value for the parameter’s biogas and methane. Bars with the same letter within one parameter indicate non-significant differences (HSD-test, α = 5%).
In dairy cattle feeding, GE, ME, and NEL are important factors for evaluating the quality of the silage. At ET in 2018, there was only a significant influence of the N-level on the content of GE (p = 0.021), ME and NEL were not influenced by the level of N fertilization. The seed placement of the IFP had no influence on the feeding quality parameters (Appendix A Table A1). All three parameters showed that intercropping with common vetch (MV) significantly decreased the contents in ET.
In TH in 2018, ME and NEL showed significant differences, but no differences were found between the control (M) and any of the other IFP. The only significant difference was found between summer squash I intercropping (MS1) and common vetch intercropping (MV) (Figure 4). In 2019, except for the alfalfa intercropping (MA), all intercropping treatments had significant lower GE contents than the control (M). For ME and NEL, only intercropping with common bean I (MB1) showed significantly decreased contents. In FAK, no differences were observed in 2018 for any parameters. In 2019, only the GE showed significant changes. While intercropping with alfalfa (MA), yellow sweet clover (MC), common vetch (MV), and nasturtium (MN) did not differ significantly from the control (M), the use of the other IFPs significantly reduced the GE.
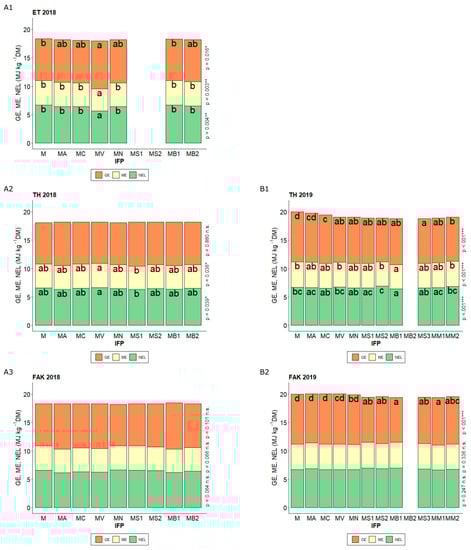
Figure 4.
GE (gross energy), ME (metabolizable energy), and NEL (net energy for lactation) (MJ kg−1 DM) for the different intercropped flowering partner (IFP) treatments (M Maize (Control), MA Maize + Alfalfa, MC Maize + Yellow sweet clover, MV Maize + Vetch, MN Maize + Nasturtium, MS1 Maize + Summer Squash I, MS2 Maize + Summer Squash II, MB1 Maize + Common Bean I, MB2 Maize + Common Bean II, MS3 Maize + Summer Squash III, MM1 Maize + Mixture I, MM2 Maize + Mixture II) in Ettlingen (ET) (2018 A1), Tachenhausen (TH) (2018 A2, 2019 B1) and Forchheim am Kaiserstuhl (FAK) (2018 A3, 2019 B2). The upper end of each colored section in the stacked bars shows the respective value for the parameter’s GE, ME, and NEL. Bars with the same letter within one parameter indicate non-significant differences (HSD-test, α = 5%).
4. Discussion
4.1. Influence of IFP on Maize Cropping
The following discussion will clarify the suitability of each IFP and offer suggestions for maize intercropping.
The single IFP provided a flower abundance for different periods of time and offer a food source for different insect species. This can make a major contribution for biodiversity promotion. With a flowering start before maize anthesis, alfalfa is an interesting partner to increase the flower abundance in maize crops. The literature showed that alfalfa is pollinated by wild bees, provides a pollen source for 29 species of wild bees and is a food resource for bumblebees [45,46,47]. Therefore, maize–alfalfa intercropping creates a flower/food abundance over a very long period. Yellow sweet clover per se is a pollen source for six wild bee species [46], which would have made this IFP interesting for biodiversity conservation. However, the results showed that yellow sweet clover did not flower at any location during the two years of the experiment. Literature showed that yellow sweet clover is not able to flower when shaded [48]. Additionally, this species has single- and two-year genotypes; the single year genotypes will already flower in the year of sowing and the two-year genotypes will only flower in the second year [49]. Since sweet clover is a plant species that has hardly been researched in breeding, no guarantee can be provided which flowering genotype or which mixing ratio the seed contains. The earliest flower abundance after sowing was supplied by common vetch, even earlier than alfalfa. The flowering period ends at about the same time as maize anthesis starts. Common vetch is pollinated by wild and honeybees, bumblebees, and is also a food resource for bumblebees [45,46,47]. Nasturtium, with a long flowering period which continued after the silage maize harvest, provides an interesting aspect for biodiversity. It will flower until the first frost or until soil tillage [50]. Therefore, it might be a habitat over a long time. A maize–nasturtium crop flowers 50 DAS, two weeks before the flowering of a sole maize crop. Nasturtium is pollinated by honey and wild bees, and also Syrphidae used it as a host [51]. In the region of maize origin, the traditional cropping system for maize was a combined cultivation of maize with summer squashes, common beans and others, the so called MILPA system. The summer squashes are pollinated by honey and wild bees and tolerate some shading [45,52], which makes them interesting for maize intercropping for biodiversity reasons. Flowering starts quite late, 1–2 weeks before maize anthesis, but as already observed for nasturtium, it continues even after harvest, until frost or soil tillage. Intercropping of maize and common beans is already done in practice. In 2019, 4000 ha were cultivated in Germany [53]. Common beans as the other main partner in the MILPA system are mainly self-pollinating, although insect pollination can enhance the seed yield [54,55,56]. Wild bees, butterflies, flies and bugs were observed to pollinate common beans [57]. The two-year experiments showed that common beans tend to a quite late flowering start. Mostly they started flowering after the maize started. Both mixtures (MM1, MM2) combined the mentioned flower abundance characteristics of two different IFP; summer squash II and common bean I (MM1), common vetch and common bean I (MM2). Especially for MM1 this leads to a prolonged flower abundance after end of maize anthesis by the squash, MM2 leads to an early flower abundance due to the common vetch.
An important aspect in maize intercropping is a system adapted weed control. Weed compete with maize (a water requiring crop) for nutrients and water, especially in dry years. In most tropic and sub-tropic countries, where intercropping in smallholder farm systems is the main agricultural practice, weed management is done by hand. However, if maize intercropping should take place on larger scales for a high economic performance, a weed control by common agricultural techniques must be possible. If weed control cannot be done, weeds form a major competition for maize, especially at sites with a high weed infestation. This has been shown for several IFP. Intercropping maize with alfalfa or sweet yellow clover leads to a weed share of 12.5% and 10.8% at ET, mainly consisting of C. album. ET is a typical maize location. Redwitz and Gerowitt [58] showed that fields that had, in previous years, a high share of maize in the crop rotation have an increased potential for infestation with C. album. The chemical weed treatment under conventional conditions consisted of a reduced amount of Pendimethalin. According to the manufacturer, the practical application rate of Pendimethalin should not be less than 3.5 L ha−1 (455 g a.i. L−1) for an adequate C. album control in both pre- and post-emergence. It is also highly recommended that the application should take place not later than the three-leaf stage of the broadleaved weeds; most effective is the pre-emergence application [59]. Additionally, at TH the weed potential was not that high as in ET. Under organic conditions hoeing covered the alfalfa and the sweet yellow clover with soil, which the small plants did not tolerate. Very few or none of the plants managed to grow from the heaped-up soil. The opposite was observed for maize–common vetch intercropping, where an adequate weed management is only possible under organic management. The hoeing in FAK worked well and the common vetch showed no difficulties growing out of the heaped-up soil, otherwise than alfalfa or yellow sweet clover. Under conventional management, especially at ET with its high weed infestation potential, weed management was difficult. In the first experimental year at ET, maize–common vetch plots had a high infestation with C. album. Although the same herbicide application as for maize–alfalfa and maize–yellow sweet clover took place in the second year in post-emergence, weeds could not be controlled successfully, for the reasons stated above. At TH, with a low infestation potential, the weed control used worked well. The advantage of nasturtium over alfalfa, yellow sweet clover and common vetch is the availability of an adapted weed management by a pre-emergence application of Pendimethalin, which controlled the weed infestation better, than a post-emergence application. The reduced amount of active ingredient can be a disadvantage in this intercropping system, especially on sites with a high weed potential. Under organic weed management, the nasturtium showed no negative effect when buried under heaped-up soil during mechanical weed management. Afterwards, the nasturtium plants grew up from the heaped-up soil. Plant protection in maize–squash intercropping is practicable under organic conditions, while the chemical plant protection is challenging. Most of the registered maize herbicides, which are also allowed in squashes, can only be applied as inter-row application, which requires special equipment. For common beans, mechanical weed control or the application with Pendimethalin and Dimethenamid-P enabled an effective weed control.
To achieve high DMY, a good maize development and growth must be enabled. An important growth parameter for high DMY is the final plant height of the maize [60,61,62,63,64]. Intercropping of maize with alfalfa mostly showed no differences in plant height, except for TH in 2019. Studies from Canada also showed no change in plant height by intercropping maize with alfalfa compared to a sole maize stand [60]. This was confirmed by the DMY results 2019 in TH. On the other hand, ET showed a reduction in DMY but no change in plant height. This can be attributed to the high weed infestation (due to the reduced amount of active ingredient and late application date) and the resulting competition by a high weed share [65]. For grain maize–yellow sweet clover intercropping, Abdin et al. [60] showed that no reduction in plant height is expected. This was confirmed by our results, only TH 2019 forms an outlier with a significantly reduced maize plant height. In maize–yellow sweet clover, plant height was not affected by IFP, but the same effect on weeds was observed as mentioned above under maize–alfalfa intercropping. The non-significant change in plant height and DMY also make nasturtium an interesting partner for intercropping in maize. Also, no changes in DMY compared to sole maize cropping were found for intercropping maize with common beans. Experiments from Northern Germany also showed no differences in DMY [35]. In Great Britain, no significant differences in DMY between maize (10 plants m−2) and maize–bean (7.5:5 plants m−2) were observed [31]. In contradiction to the four previously mentioned intercropping treatments, intercropping with common vetch showed reduction in the final plant height of maize, depending on the year. The reduction in plant height was not significant in the first year at the locations in our study. In the second-year, significant height reductions for maize plants intercropped with common vetch were observed at TH and FAK. Also, the DMY was reduced. Common vetch is a plant which leaches allelopathic substances during decomposition of its biomass [66]. In 2018 it was observed at all locations that, after a short time period, the vetch was infested with mildew and died. Root excretions and leaching’s (vanillin acid, p-coumaric acid, ferulic acid) of above-ground common vetch biomass is shown to inhibit the germination of wheat, as well as plant growth and development [66]. Their study concluded that wheat produced more root biomass than above ground biomass, due to the allelopathic substances. This change in above/below biomass ratio is a reaction which should promote plant growth. Since these effects has also been observed in rice [67], it is obvious that such effects also might occur in maize, which, like wheat and rice, belongs to the Poaceae. The squashes showed different growth behavior and influence on DMY, which indicates a great variability in the species, which could be shown by squash III in FAK 2019. Squash I and II showed no change in maize plant height and DMY, but squash III in FAK reduced the final maize plant height. While squash I and II produced fruit weights of 0.1 and 0.2–0.4 kg respectively, squash III can achieve fruits of 2–4 kg [68]. The production of fruits with a high weight requires nutrients and water, which are no longer available for maize. To the best of our knowledge, there are no experiments on maize–squash intercropping for silage usage. Most maize–squash experiments are done with maize for grain production. A study from traditional smallholder farm systems in Africa showed, that there were no differences in grain yield by intercropping with squashes; as long as the sowing rate of squashes meets 20% of the maize sowing rate [69]. Our experiment used 1.6 seeds m−2, which equals 20% of the sowing rate of 8 maize seeds m−2. Therefore, no changes were expected, which was proved by no changes in DMY. But the study from Mashingaidze et al. [69] also showed, that no differences in grain yields can only be achieved in years where a high infestation with Sphaerotheca fuligniea took place. The infestation inhibits the formation of fruits. In years without infestation, fruits are formed, and the squash plants compete with maize for nutrients. This leads to the conclusion that larger fruits have a higher competitiveness and, therefore, a greater influence on maize. This is in line with the results of squash III. This squash formed bigger fruits than the other two squashes and showed significant reductions in final DMY of the MSIII plots and yield relevant parameters. Also, the sowing of a mixture of maize and squash is a challenge. The 1000 grain-mass varies widely within the genus Cucurbita. While squash I and II had a 1000-grain mass of 55 g and 27 g, respectively, squash III had 102 g and was suitable for a combined seeding with maize as a mixture.
Prevention of the water bodies due to soil NO3-N leaching by IFP could not be fully proven. Under maize–alfalfa intercropping the soil NO3-N content was significantly reduced in the layer of 30–60 cm depth compared to the control at vegetation end in ET 2018. It could be observed that the alfalfa continued growing after harvest. It is therefore reasonable to assume that the IFP continued absorbing soil NO3-N. Although, nasturtium continues to grow after harvest and provides a flower abundance, it did not show significant differences in the soil NO3-N content in the single experimental years or sites, except for a reduction in 30–60 cm at the end of the vegetation period in ET 2018.
The IFP or a ‘pollution’ by a high weed share can also cause changes in the chemical composition of the harvested material. Most often the CP and CA content were changed. For biogas production and cattle feeding, the following important parameters should also not change to a disadvantageous content: CP (too long decomposition time in biogas plant, in dairy cattle to much CP causes high milk urea concentration, or CP is sometimes degraded to fast and, therefore, has a low utilization), CX (difficult digestion in biogas plant and dairy cattle stomach), CA (reduction in digestion space of the biogas plant and no substances that can be converted for energy and feeding purpose). An increase in NfE has no negative effects, due to the fact that highest methane concentration can be achieved by this parameter and cows can convert most energy from these, respectively. The matrix of correlation coefficients in ET for 2018 showed that there is a negative correlation of CP on the NfE content (rp = −0.68) (Figure 5). This trend can be explained due to the fact, that NfE are the nitrogen-free extracts. If there is an increase in CP, less amount of the dry matter can consist of NfE. This was proven 2018 in ET where intercropping with common vetch increased the CP contents significantly, while the NfE decreased significantly. Such a trend could also be observed in TH 2019 for mixture I (MM2), which also contains vetch. CP can build high contents of methane, but it is a slowly degradable ingredient in biogas plants. This has been shown by the correlation coefficients for biogas (rp = −0.76) and methane (rp = −0.47). A high content in CP reduces the biogas contents due to the long retention time. But the higher the content of CP, the more methane could be built. Also, the CA content influences the final yields of biogas and methane. If the content of CA in the biogas substrate is too high, ash can settle at the bottom of the fermenter, reducing the digestion space and thus the yields. Therefore, the matrix showed a significantly negative influence of CA on biogas (rp = −0.90) and methane (rp = −0.75). Results from 2019 in TH verified these findings. An increase in CA by intercropping with common bean I leads to increased CA contents and decreased biogas and methane contents. The nutrition parameters GE, ME and NEL are mainly influenced by CP and CX. CX showed a negative influence on GE (rp = −0.50), ME (rp = −0.99) and NEL (rp = −0.99), CP had a negative influence on ME (rp = −0.50) and NEL (rp = −0.50). This negative influence of CX was also proved, in 2019 in TH, an increase in CX by intercropping with common bean I significantly reduced GE, ME, and NEL due to the low nutritive value of CX.
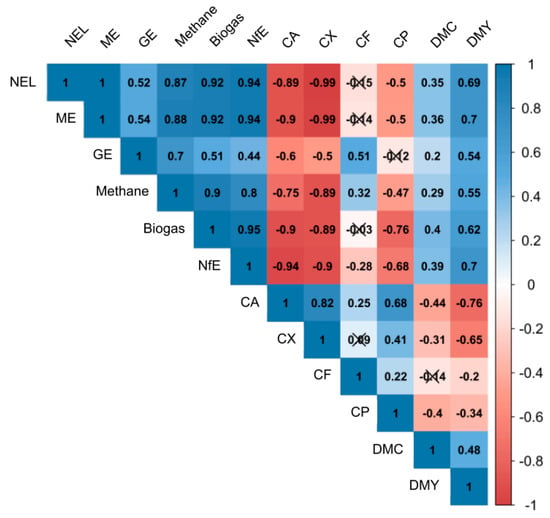
Figure 5.
Pearson’s coefficient of correlation within and across yield and quality parameters at ET in 2018, averaged over the parameters N-Level, seed placement of the intercropped flowering partners (IFP) and IFP. Non-significant coefficients (p < 0.05) are crossed out.
Significantly higher CA contents were observed for ET and FAK in 2018 under maize–alfalfa, maize yellow sweet clover and maize–common vetch intercropping. This can be attributed to the high share of weed in the harvested biomass. Most of the weed consisted of C. album, which has a CA content of 23.3% [70]. Adedapo et al. [70] also showed that C. album has high contents of CX (16.7%) and CA (23.3%). An increase in these two parameters has negative effects on biogas and methane yield, and on the feed quality parameters, GE, ME and NEL. This was proven by the significant reduction in biogas, methane, GE, ME and NEL in ET 2018. High contents of CA can disturb the biogas process by settling down on the bottom of the fermenter and reduce the space for digestion. In addition, CA does not provide a basis that can be converted into energy, neither in biogas plants nor in cattle feeding. These effects were proven by the highly negative correlations between CA and CX on biogas, methane, GE, ME and NEL shown in Figure 5. Biogas and methane formation depend on the composition and biodegradability of the substrates used [71]. CX did not contribute much to methane yield [72].
The increased CP content could also be attributed to the high weed infestation. In ET 2018, the weed covered area was higher than 50%. C. album has a high CP content [73,74]. Depending on plant age, C. album can accumulate an additional 1.75–5.27% nitrogen, which corresponds to 10.9–32.9% CP [73,74]. The C. album will be chopped together with the maize. A study by Sarabi et al. [75] showed that the control of C. album in maize is absolutely necessary in order to prevent growth inhibition and prevent yield losses. Especially for common vetch intercropping, root extracts from the vetch can increase the CP content. Aarssen et al. [76] showed in an intercropping trial with Avena sativa and common vetch that the vetch root extracts increased the nitrogen content of Avena sativa. These changes were also confirmed by the 2019 results of TH and FAK. In FAK, an increase in CP content was measured, which resulted in a reduced NEL. In contrast, a decrease of the NfE content was measured in TH, which corresponds to an increase in CP and also achieved reduced NEL contents.
The above-mentioned studies from northern Germany and Great Britain showed increased CP contents at unchanged DMY. However, our study could not prove an increase in CP content by intercropping with common beans. This could be ascribed to the sown maize:bean ratio and the weather conditions. The studies from northern Germany and Great Britain used a higher bean and a lower maize proportion. While in our study the sown maize:bean ratio of 8:4.5 plants m−2 resulted in a percentage share of 64% maize and 36% beans seeds, Fischer et al. [35] used maize:bean ratios of 8:6, resulted in a share of 57% maize and 43% beans and Dawo et al. [31] a 7.5:5 ratio (60% maize and 40% bean) and a 5:5 ratio (50% maize and 50% bean). Most studies which proved a higher CP content sown a higher proportion of beans. An additional reason for the missing CP increase in our study, could be the environmental conditions in Southern Germany. Common beans are sensitive to high temperatures. Growing at 32 °C decreases the biomass of P. vulgaris, compared to growing at 25 °C [77,78]. At full flowering, temperatures above optimum (15–30 °C) were shown to affect all enzyme activities of the nitrogen metabolism negatively [79]. This leads to the conclusion that the temperatures during flowering in southern Germany can be above the optimum, which influences the nitrogen metabolism and therefore the formation of CP, while in the cooler climates of northern Germany and Great Britain the nitrogen metabolism is less affected. This was also shown by Porch and Jahn [80]. They showed that at high day/night temperatures (32/27 °C) heat-sensitive P. vulgaris genotypes react with an excessive abscission of their reproductive organs. This gives an explanation, why in hot, dry 2018 no effect on CP could be observed. Another reason for the lack in increase in CP, even in 2019, may be the proportion of beans in the silage. This should be above 20% [81]. This increase could not be achieved at any site in any year (Table 4, Table 5 and Table 6). In addition, it must be noted that different varieties of P. vulgaris or species of Phaseolus beans were used in the above-mentioned experiments. Depending on the genotype used, beans showed a wide range in CP contents. Celmeli et al. [82] showed that the CP content in both landraces and modern cultivars of common beans varied widely (landraces: 16.5–25.2%, modern cultivars: 19.7–24.3%). Thus, in addition to the seeding rate and growth conditions, the selected bean variety can have a significant influence on the CP content of the harvested material. In 2019, the results from TH showed a decrease in biogas and methane, while CX and CA increased and NfE decreased. The correlation matrix in Figure 5 verifies this finding. High CA contents had a negative correlation on biogas and methane (rp = −0.90 and −0.75), also high CX (rp = −0.89 and −0.89). CA and CX are not or only slowly digestible in the biogas plant, while NfE had a positive correlation on biogas and methane (rp = 0.95 and 0.80), respectively. Therefore, the decreasing NfE content leads to decreasing biogas and methane yields. The reduced contents in GE, ME and NEL also could be explained by these increases in CA and CX. Mixture I showed neither in TH nor in FAK differences in DMY or CP. Mt. Pleasant [83] also showed that traditional MILPA systems did not reach higher yields or an increase in CP compared to a sole maize crop. Mixture II (common vetch and common bean II) had significantly lower DMY but higher CP and lower NfE compared to the control. These changes can be ascribed to the mentioned negative effects of common vetch intercropping. Decomposing vetch parts inhibit maize growth (=reduced plant height), while the combination of two legume IFP can increase the CP content. Also, the high weed infestation increased the CP content.
4.2. Requirements on Agricultural Practice and Equipment
Intercropping of maize and IFP has several challenges, like seeding technique and weed control, which will be discussed in detail in the following contents.
When maize and an IFP are sown together in a single working step as mixture via a single seed precision planter, the morphology of the seeds should be similar, e.g., shape, 1000-grain mass. This enables sowing as a seed mixture. A single-step sowing reduces the demand of fossil fuels, reduces soil compaction and saves machinery and labor costs. However, sowing as a mixture requires that both maize and IFP can deal with the weed management. Adapted weed control is important, otherwise there will be too much competition which will lead to yield losses. As seen by Abdin et al. [44], cover crops were not able to suppress weed development adequately, especially on sites with high weed potential. This has been shown in ET in 2018. Reduced amounts of the recommended plant protection agents for maize were used in order to not harm the IFP. These reduced amounts lead to a high pressure of problematic weeds, such as C. album (L.) and Galinsoga spp. (RUIZ & PAV.). Small IFP seeds, like alfalfa, yellow sweet clover, common vetch, and squash I and II are technically not suitable for sowing as a mixture. These IFP also did not permit an adequate chemical weed control under the local site conditions. Some IFP’s had under mechanical weed control problems by burying during hoeing. The only practicable method could be a sowing of IFP via box spreader during the last mechanical weeding step.
Separate sowing enables on the one hand the establishment of a spatially separated crop stand and on the other hand, it is also possible to establish the plants at different times. Thus, maize is sown first and weed control can be done (chemically or mechanically). Afterward, IFP are sown in the maize crop. However, this delays the flowering of the IFP. In case of a spatially separated establishment of the IFP between the maize rows, no mechanical weed control can take place, if the IFP seed is sown immediately after the maize sowing. In both cases, establishment in a second step is necessary, which costs time and fossil resources. Special machines for maize and IFP sowing in one step are not yet widely used. A box spreader on the maize seed drill also means that no mechanical inter-row weed treatment can take place. It should be clear, when sowing as mixture, the use of a partner additionally reduces the share of maize in the crop, if the proportion of maize in the seeding mixture is not increased. This is caused by the seed separation at the sowing disc of the precision planter. The seeds will randomly get into the holes of the seed disc. This means that at the adjusted sowing rate (e.g., 10 plants m−2), it is not possible to identify exactly the distribution pattern of maize and IFP within the row, this will happen randomly. Since maize forms the major share of biomass for most of the observed IFP treatments, except for the common bean, it must be ensured by a high maize proportion and a low IFP proportion that the maize seed ratio is not “thinned” by the IFP. In general, if an intercropping mixture is sown in one working step, the proportion of the IFP should be kept as high as possible for biological promotion and as low as possible so the maize will not be “thinned”.
5. Conclusions
Maize row-intercropping with flowering plants represents an alternative to sole maize cropping, due to the fact that cropping partners can mitigate negative environmental impacts. Some cropping partners proved to be unsuitable for row-intercropping in maize crops. Maize–alfalfa, maize–yellow sweet clover, and maize–common vetch cannot be recommended due to the difficulties in weed control and sowing as a seed mixture. Common vetch and mixtures which contain common vetch also are not recommended due to the assumed allelopathic effects of the decomposing biomass. Maize–squash could be an interesting alternative under mechanical weed control, while maize–nasturtium showed to be an alternative to sole maize cropping under conventional and organic farming, also the maize–bean crop could be an option. The yields and qualities of maize–nasturtium and maize–bean biomass are comparable with sole maize cropping, while the flowers provide a pollen source. Nasturtium could also be possible for grain maize production because no plant parts contaminate the grain. Intercropping maize with nasturtium requires additional studies on chemical weed control and the sowing rate of nasturtium. If a combined sowing of maize and IFP in a single step can be done, there will be no additional consumption of fossil fuels and no increased soil compaction compared to sole maize cropping. However, this requires that the seeds be sown as a mixture. This means that the seeds should be similar in their morphology. This can already be achieved by maize–bean. When maize and IFP are sown separately, plants can be used whose seed morphology differs from maize. In this case the seeds are also located between the maize rows and no mechanical weed control or inter-row band application of herbicides can take place. A later sowing of the IFP after finishing all weed control measures (chemical or mechanical), would be possible. However, this would delay the flowering time of the IFP, and an additional flower abundance before maize flowering can no longer be enabled. By sowing in one working step as a seed mixture, the share of IFP should be kept as low as possible to enable a high proportion of maize. The use of IFP must therefore be well planned a priori, in terms of the benefits for biodiversity, shade tolerance of the IFP, the competitive situation for maize (water, nutrients), the sowing technique, the possibility of weed control, and the possible influences on final biomass. It is suggested that maize intercropping, as already practiced by ambitious farmers, should be further explored by research.
Author Contributions
Conceptualization, K.S., C.S., M.M.-L. and K.M.; methodology, V.S.S., C.S., M.M.-L. and K.S.; software, V.S.S.; validation, V.S.S., M.M.-L. and C.S.; formal analysis, V.S.S.; investigation, V.S.S., C.S., M.M.-L. and K.S.; data curation, V.S.S. and C.S.; writing—original draft preparation, V.S.S.; writing—review and editing, V.S.S., M.M.-L., C.S., S.W., K.S. and K.M.; visualization, V.S.S.; supervision, V.S.S., M.M.-L. and C.S.; project administration, V.S.S., C.S., M.M.-L., K.S., S.W. and K.M.; funding acquisition, K.S. and K.M. All authors have read and agreed to the published version of the manuscript.
Funding
This research was funded by the Ministry of Rural Affairs and Consumer Protection Baden-Württemberg (MLR) within the project “Diversifizierung des Silo- und Energiemaisanbaus im konventionellen und ökologischen Landbau”.
Acknowledgments
The authors would like to thank Jan E. Neuweiler of the State Plant Breeding Institute, University Hohenheim for statistical support; Conny Hüber for information about pollinators; Marwin Dauth, Khaliun Sukhbaatar, and Sabine Hubert for data collection and the staff of the LTZ Augustenberg for making this joint research project possible.
Conflicts of Interest
The authors declare no conflict of interest. The funders had no role in the design of the study; in the collection, analyses, or interpretation of data; in the writing of the manuscript, or in the decision to publish the results.
Appendix A

Figure A1.
Climate chart of the experimental location Ettlingen (ET) for 2018 (a) and 2019 (b). The monthly cumulative sum of precipitation (mm, blue bars), the average air temperature (°C, solid, red line), the mean long-term annual precipitation (mm, filled, green diamonds), and the average long-term air temperature (°C, dashed, orange line). (Data source: Meteorological station Rüppur, 3.5 km linear distance to experimental site).

Figure A2.
Climate chart of the experimental location Tachenhausen (TH) for 2018 (a) and 2019 (b). The monthly cumulative sum of precipitation (mm, blue bars), the average air temperature (°C, solid, red line), the mean long-term annual precipitation (mm, filled, green diamonds), and the average long-term air temperature (°C, dashed, orange line). (Data source: meteorological station Tachenhausen, 0.5 km linear distance to experimental site).

Figure A3.
Climate chart of the experimental location Forchheim am Kaiserstuhl (FAK) for 2018 (a) and 2019 (b). The monthly cumulative sum of precipitation (mm, blue bars), the average air temperature (°C, solid, red line), the mean long-term annual precipitation (mm, filled, green diamonds), and the average long-term air temperature (°C, dashed, orange line). (Data source: meteorological station Herbolzheim, 9.3 km linear distance to experimental site).
Table A1.
CP (crude protein), CL (crude fat), CX (crude fiber), CA (crude ash), NfE (nitrogen-free extracts) content (% of DM), biogas and methane yield (L kg−1 oDMC) and GE (gross energy), ME (metabolizable energy), and NEL (net energy for lactation) (MJ kg−1 DM) for the different N-Levels and seed placement of the intercropped flowering partners (IFP) in ET 2018.
| CP | CF | CX | CA | NfE | Biogas | Methane | GE | ME | NEL | |||||
|---|---|---|---|---|---|---|---|---|---|---|---|---|---|---|
| (% DM) | (L kg−1 oDMC) | (MJ kg−1 DM) | ||||||||||||
| N-Level | ||||||||||||||
| 0% | 6.62 | A | 2.01 | 21.5 | 4.46 | 70.5 | B | 554 | B | 298 | 18.1 | A | 10.6 | 6.39 |
| 50% | 7.83 | B | 2.23 | 21.6 | 4.65 | 68.9 | AB | 552 | B | 299 | 18.3 | B | 10.6 | 6.37 |
| 100% | 8.91 | C | 2.09 | 21.2 | 4.73 | 68.3 | A | 549 | A | 298 | 18.3 | AB | 10.6 | 6.40 |
| p-value | <0.001 *** | 0.407 | 0.694 | 0.324 | 0.003 ** | <0.001 *** | 0.714 | 0.021 * | 0.849 | 0.855 | ||||
| Seed placement | ||||||||||||||
| BR | 7.68 | 2.10 | 21.3 | 4.6 | 69.2 | 552 | 299 | 18.2 | 10.6 | 6.40 | ||||
| IR | 7.89 | 2.11 | 21.6 | 4.63 | 69.5 | 551 | 298 | 18.2 | 10.6 | 6.37 | ||||
| p-value | 0.236 | 0.854 | 0.725 | 0.87 | 0.959 | 0.546 | 0.733 | 0.842 | 0.754 | 0.763 | ||||
Values with the same letter within one parameter indicate non-significant differences within the three factor levels (N-Level and Seed placement) (HSD-test, α = 5%). *** p ≤ 0.001, ** p ≤ 0.01, * p ≤ 0.05.
References
- Mirzabaev, A.; Wu, J.; Evans, J.; Garcia-Oliva, F.; Hussein, I.A.G.; Iqbal, M.H.; Kimutai, J.; Knowles, T.; Meza, F.; Nedjroaoui, D.; et al. Desertification. In Climate Change and Land: An IPCC Special Report on Climate Change, Desertification, Land Degradation, Sustainable Land Management, Food Security, and Greenhouse Gas Fluxes in Terrestrial Ecosystems; IPCC: Ginevra, Switzerland, 2019. [Google Scholar]
- FAO Desertification and land Degradation. Available online: http://www.fao.org/in-action/action-against-desertification/overview/desertification-and-land-degradation/en/ (accessed on 20 March 2020).
- Norris, K. Agriculture and biodiversity conservation: Opportunity knocks. Conserv. Lett. 2008, 1, 2–11. [Google Scholar] [CrossRef]
- Bélanger, J.; Pilling, D.; Commission on Genetic Resources for Food and Agriculture; Food and Agriculture Organization of the United Nations. The State of the World’s Biodiversity for Food and Agriculture; FAO: Rome, Italy, 2019; ISBN 978-92-5-131270-4. [Google Scholar]
- Bailes, E.J.; Ollerton, J.; Pattrick, J.G.; Glover, B.J. How can an understanding of plant–pollinator interactions contribute to global food security? Curr. Opin. Plant Biol. 2015, 26, 72–79. [Google Scholar] [CrossRef] [PubMed]
- Secretariat of the Convention on Biological Diversity. Biodiversity and Agriculture: Safeguarding Biodiversity and Securing Food for the World; Secretariat of the Convention on Biological Diversity: Montreal, QC, Canada, 2008; ISBN 978-92-9225-111-6. [Google Scholar]
- Schönhart, M.; Schauppenlehner, T.; Schmid, E.; Muhar, A. Analysing the maintenance and establishment of orchard meadows at farm and landscape levels applying a spatially explicit integrated modelling approach. J. Environ. Plan. Manag. 2011, 54, 115–143. [Google Scholar] [CrossRef]
- Mousavi, S.R.; Eskandari, H. A general overview on intercropping and its advantages in sustainable agriculture. J. Appl. Environ. Biol. Sci. 2011, 1, 482–486. [Google Scholar]
- Gebru, H. A Review on the Comparative Advantages of Intercropping to Mono-Cropping System. J. Biol. 2015, 5, 28–38. [Google Scholar]
- FAO. FAOSTAT—Crops. Available online: http://www.fao.org/faostat/en/#data/QC (accessed on 20 March 2020).
- Batugal, P.A.; de la Cruz, A.; Libunao, W.H.; Khwaja, A.M. Intercropping potato with maize in lowland Philippines. Field Crop. Res. 1990, 25, 83–97. [Google Scholar] [CrossRef]
- Li, L.; Sun, J.; Zhang, F.; Li, X.; Rengel, Z.; Yang, S. Wheat/maize or wheat/soybean strip intercropping: II. Recovery or compensation of maize and soybean after wheat harvesting. Field Crop. Res. 2001, 71, 173–181. [Google Scholar] [CrossRef]
- Tsubo, M.; Mukhala, E.; Ogindo, H.O.; Walker, S. Productivity of maize-bean intercropping in a semi-arid region of South Africa. Water SA 2003, 29, 381–388. [Google Scholar] [CrossRef]
- Muoneke, C.O.; Ogwuche, M.A.O.; Kalu, B.A. Effect of maize planting density on the performance of maize/soybean intercropping system in a guinea savannah agroecosystem. Afr. J. Agric. Res. 2007, 2, 667–677. [Google Scholar]
- Awal, M.A.; Koshi, H.; Ikeda, T. Radiation interception and use by maize/peanut intercrop canopy. Agric. For. Meteorol. 2006, 139, 74–83. [Google Scholar] [CrossRef]
- Mushagalusa, G.N.; Ledent, J.-F.; Draye, X. Shoot and root competition in potato/maize intercropping: Effects on growth and yield. Environ. Exp. Bot. 2008, 64, 180–188. [Google Scholar] [CrossRef]
- Seran, T.H.; Brintha, I. Review on Maize Based Intercropping. J. Agron. 2010, 9, 135–145. [Google Scholar] [CrossRef]
- Ali, M.R.; Rahman, M.S.; Asaduzzaman, M.; Hossain, M.M.; Mannan, M.A. Intercropping Maize with Different Vegetables. Bangladesh Agron. J. 2015, 18, 49–52. [Google Scholar] [CrossRef][Green Version]
- Canadian Organic Growers Inc. Alfalfa, Clovers and Forage Mixtures. Available online: https://eap.mcgill.ca/MagRack/COG/COGHandbook/COGHandbook_3_1.htm (accessed on 29 October 2018).
- Knörzer, H.; Müller, B.U.; Guo, B.; Graeff-Hönninger, S.; Piepho, H.-P.; Wang, P.; Claupein, W. Extension and evaluation of intercropping field trials using spatial models. Agron. J. 2010, 102, 1023–1031. [Google Scholar] [CrossRef]
- Schepers, J.S.; Moravek, M.G.; Alberts, E.E.; Frank, K.D. Maize Production Impacts on Groundwater Quality. J. Environ. Qual. 1991, 20, 12–16. [Google Scholar] [CrossRef]
- Sogbedji, J.M.; van Es, H.M.; Yang, C.L.; Geohring, L.D.; Magdoff, F.R. Nitrate Leaching and Nitrogen Budget as Affected by Maize Nitrogen Rate and Soil Type. J. Environ. Qual. 2000, 29, 1813–1820. [Google Scholar] [CrossRef]
- ECPA. Soil Biodiversity and Agriculture; European Crop Production Association: Bruxelles, Belgium, 2010.
- Vogel, E.; Deumlich, D.; Kaupenjohann, M. Bioenergy maize and soil erosion—Risk assessment and erosion control concepts. Geoderma 2016, 261, 80–92. [Google Scholar] [CrossRef]
- DESTATIS—Statistisches Bundesamt Ackerland Nach Hauptfruchtgruppen und Fruchtarten. Available online: https://www.destatis.de/DE/Themen/Branchen-Unternehmen/Landwirtschaft-Forstwirtschaft-Fischerei/Feldfruechte-Gruenland/Tabellen/ackerland-hauptfruchtgruppen-fruchtarten.html (accessed on 19 March 2020).
- Statistisches Landesamt Baden-Württemberg Bodennutzung—Anbauflächen aller Kultur- und Nutzungsarten seit 2010. Available online: https://www.statistik-bw.de/Landwirtschaft/Bodennutzung/LF-NutzngKultFrucht.jsp (accessed on 17 March 2020).
- Norris, S.L.; Blackshaw, R.P.; Critchley, C.N.R.; Dunn, R.M.; Smith, K.E.; Williams, J.; Randall, N.P.; Murray, P.J. Intercropping flowering plants in maize systems increases pollinator diversity. Agric. For. Entomol. 2018, 20, 246–254. [Google Scholar] [CrossRef]
- Manevski, K.; Børgesen, C.D.; Andersen, M.N.; Kristensen, I.S. Reduced nitrogen leaching by intercropping maize with red fescue on sandy soils in North Europe: A combined field and modeling study. Plant Soil 2015, 388, 67–85. [Google Scholar] [CrossRef]
- Javanmard, A.; Nasab, A.D.M.; Javanshir, A.; Moghaddam, M.; Janmohammadi, H. Forage yield and quality in intercropping of maize with different legumes as double-cropped. J. Food Agric. Environ. 2009, 7, 163–166. [Google Scholar]
- LUBW. Grundwasserüberwachungsprogramm—Ergebnisse der Beprobung 2017; LUBW Landesanstalt für Umwelt Baden-Württemberg: Karlsruhe, Germany, 2018. [Google Scholar]
- Dawo, M.I.; Wilkinson, J.M.; Sanders, F.E.; Pilbeam, D.J. The yield and quality of fresh and ensiled plant material from intercropped maize (Zea mays) and beans (Phaseolus vulgaris). J. Sci. Food Agric. 2007, 87, 1391–1399. [Google Scholar] [CrossRef]
- Nurk, L.; Graß, R.; Pekrun, C.; Wachendorf, M. Effect of sowing method and weed control on the performance of maize (Zea mays L.) intercropped with climbing beans (Phaseolus vulgaris L.). Agriculture 2017, 7, 51. [Google Scholar] [CrossRef]
- Nurk, L.; Graβ, R.; Pekrun, C.; Wachendorf, M. Methane yield and feed quality parameters of mixed silages from maize (Zea mays L.) and common bean (Phaseolus vulgaris L.). Bioenergy Res. 2017, 10, 64–73. [Google Scholar] [CrossRef]
- von Redwitz, C.; Glemnitz, M.; Hoffmann, J.; Brose, R.; Verch, G.; Barkusky, D.; Saure, C.; Berger, G.; Bellingrath-Kimura, S. Microsegregation in Maize Cropping—A Chance to Improve Farmland Biodiversity. Gesunde Pflanz. 2019, 71, 87–102. [Google Scholar] [CrossRef]
- Fischer, J.; Böhm, H.; Heβ, J. Maize-bean intercropping yields in Northern Germany are comparable to those of pure silage maize. Eur. J. Agron. 2020, 112, 125947. [Google Scholar] [CrossRef]
- ISIP. Maiszünsler in Mais—Prognose und Befallserhebungen. Available online: https://www.isip.de/isip/servlet/isip-de/entscheidungshilfen/mais (accessed on 19 March 2020).
- Meier, U. Growth Stages of Mono- and Dicotyledonous Plants: BBCH Monograph; Open Agrar Repositorium: Quedlinburg, Germany, 2018. [Google Scholar]
- Bassler, R. VDLUFA-Methodenbuch, Band III. Die Chemische Untersuchung von Futtermitteln. 3. Aufl., 2. Ergänzungslieferung 1988 und 3. Ergänzungslieferung 1993; VDLUFA-Verlag: Darmstadt, Germany, 1988. [Google Scholar]
- Schattauer, A.; Weiland, P. Grundlagen der anaeroben Fermentation. In Handreichung Biogasgewinnung und–Nutzung; Fachagentur Nachwachsende Rohstoffe eV: Gülzow, Germany, 2004; pp. 25–35. [Google Scholar]
- Steinhöfel, O.; Krieg, D.; Hanschmann, G.; Mietke, H.; Richardt, W.; Hoffmann, M. Futterbewertung für Wiederkäuer—Untersuchung und Bewertung von Futtermitteln für Wiederkäuer; Sächsische Landesanstalt für Landwirtschaft: Dresden, Germany, 2008. [Google Scholar]
- VDLUFA. Bestimmung von mineralischem Stickstoff (Nitrat und Ammonimu) in Bodenprofilen (Nmin-Labormethode). In Band I—Die Untersuchung von Böden; VDLUFA: Darmstadt, Germany, 1991. [Google Scholar]
- Käsmarker, R. Verfahren zur Bestimmung des Nitratstickstoffgehaltes in Böden im Rahmen der SchALVO; Landwirtschaftliches Technologiezentrum Augustenberg: Karlsruhe, Germany, 2018. [Google Scholar]
- Hothorn, T.; Bretz, F.; Westfall, P.; Heiberger, R.M.; Schuetzenmeister, A.; Scheibe, S.; Hothorn, M.T. Package ‘multcomp’. In Simultaneous Inference in General Parametric Models; Project for Statistical Computing: Vienna, Austria, 2016. [Google Scholar]
- Wei, T.; Simko, V. Package “Corrplot”. Statistican. Available online: ftp://xyz.lcs.mit.edu/pub/CRAN/web/packages/corrplot/corrplot.pdf (accessed on 17 March 2020).
- McGregor, S.E. Insect Pollination of Cultivated Crop Plants; Agricultural Research Service, US Department of Agriculture: Washington, DC, USA, 1976; Volume 496.
- Westrich, P. Die Wildbienen Baden-Württembergs, 1: Allgemeiner Teil: Lebensräume, Verhalten, Ökologie und Schutz; Ulmer: Ulm, Germany, 1989. [Google Scholar]
- Schindler, M.; Schumacher, W. Auswirkungen des Anbaus vielfältiger Fruchtfolgen auf wirbellose Tiere in der Agrarlandschaft (Literaturstudie). In Schriftenreihe des Lehr-und Forschungsschwerpunktes USL; Universitäts- und Landesbibliothek Bonn: Bonn, Germany, 2007; Volume 147. [Google Scholar]
- Ogle, D.; St John, L.; Tilley, D. Plant Guide for Yellow Sweetclover (Melilotus officialis (L.) Lam.) and White Sweetclover (M. alba Medik.); USDA-Natural Resources Conservation Service, Idaho Plant-Materials Center: Aberdeen, UK, 2008.
- Turkington, R.A.; Cavers, P.B.; Rempel, E. The Biology of Canadian Weeds: 29. Melilotus alba Desr. and M. officinalis (L.) Lam. Can. J. Plant Sci. 1978, 58, 523–537. [Google Scholar] [CrossRef]
- Christenhusz, M.J. Tropaeolum Majus. Curtis’s Bot. Mag. 2012, 29, 331–340. [Google Scholar] [CrossRef]
- Comba, L.; Corbet, S.A.; Hunt, L.; Warren, B. Flowers, nectar and insect visits: Evaluating British plant species for pollinator-friendly gardens. Ann. Bot. 1999, 83, 369–383. [Google Scholar] [CrossRef]
- Plants for A Future Cucurbita Pepo Pumpkin, Field pumpkin, Ozark Melon, Texas Gourd PFAF Plant Database. Available online: https://pfaf.org/user/plant.aspx?LatinName=Cucurbita+pepo (accessed on 29 October 2018).
- Mund, F. Mais-Stangenbohnen—Ein Gemenge der Zukunft? Available online: https://www.topagrar.com/acker/aus-dem-heft/mais-stangenbohnen-ein-gemenge-der-zukunft-11860265.html (accessed on 3 November 2020).
- Douka, C.; Nganhou, S.N.; Doummen, F.N.; Mengue, A.M.M.M.; Tamesse, J.L.; Fohouo, F.-N.T. Diversity of Flowering Insects and Their Impact on Yields of Phaseolus Vulgaris L. (Fabaceae) in Yaoundé (Cameroon). J. Agric. Crop. 2018, 4, 105–111. [Google Scholar]
- Ramos, D.; Bustamante, M.M.C.; Silva, F.D.; Carvalheiro, L.G. Crop fertilization affects pollination service provision—Common bean as a case study. PLoS ONE 2018, 13. [Google Scholar] [CrossRef]
- Raggi, L.; Caproni, L.; Carboni, A.; Negri, V. Genome-Wide Association Study Reveals Candidate Genes for Flowering Time Variation in Common Bean (Phaseolus vulgaris L.). Front. Plant Sci. 2019, 10. [Google Scholar] [CrossRef]
- Kingha, B.M.T.; Fohouo, N.T.; Ngakou, A.; Bruuml, D. Foraging and pollination activities of Xylocopa olivacea (Hymenoptera, Apidae) on Phaseolus vulgaris (Fabaceae) flowers at Dang (Ngaoundere-Cameroon). J. Agric. Ext. Rural Dev. 2012, 4, 330–339. [Google Scholar]
- Redwitz, C.V.; Gerowitt, B. Welche Faktoren fördern das Auftreten von Chenopodium album auf norddeutschen Maisflächen? Jul. Kühn Arch. 2014, 443, 165. [Google Scholar]
- BASF. Stomp® Aqua. Available online: https://www.agrar.basf.de/de/Produkte/Produktdetails/Stomp%C2%AE-Aqua.html (accessed on 6 August 2020).
- Abdin, O.; Coulman, B.E.; Cloutier, D.; Faris, M.A.; Zhou, X.; Smith, D.L. Yield and yield components of corn interseeded with cover crops. Agron. J. 1998, 90, 63–68. [Google Scholar] [CrossRef]
- Gitelson, A.A.; Viña, A.; Arkebauer, T.J.; Rundquist, D.C.; Keydan, G.; Leavitt, B. Remote estimation of leaf area index and green leaf biomass in maize canopies. Geophys. Res. Lett. 2003, 30, 1248. [Google Scholar] [CrossRef]
- Law-Ogbomo, K.E.; Remison, S.U. Growth and Yield of Maize as Influenced by Sowing Date and Poultry Manure Application. Not. Bot. Horti Agrobot. Cluj Napoca 2009, 37, 199–203. [Google Scholar]
- Gao, S.; Niu, Z.; Huang, N.; Hou, X. Estimating the Leaf Area Index, height and biomass of maize using HJ-1 and RADARSAT-2. Int. J. Appl. Earth Obs. Geoinf. 2013, 24, 1–8. [Google Scholar] [CrossRef]
- Li, W.; Niu, Z.; Chen, H.; Li, D.; Wu, M.; Zhao, W. Remote estimation of canopy height and aboveground biomass of maize using high-resolution stereo images from a low-cost unmanned aerial vehicle system. Ecol. Indic. 2016, 67, 637–648. [Google Scholar] [CrossRef]
- Abouziena, H.F.; El-Metwally, I.M.; El-Desoki, E.R. Effect of Plant Spacing and Weed Control Treatments on Maize Yield and Associated Weeds in Sandy Soils. Am. Eurasian J. Agric. Environ. Sci. 2008, 4, 9–17. [Google Scholar]
- Zohaib, A.; Tabassum, T.; Anjum, S.A.; Abbas, T.; Nazir, U. Allelopathic Effect of Some Associated Weeds of Wheat on Germinability and Biomass Production of Wheat Seedlings. Planta Daninha 2018, 35, 89. [Google Scholar] [CrossRef][Green Version]
- Zohaib, A.; Anjum, S.A.; Jabbar, A.; Tabassum, T.; Abbas, T.; Nazir, U. Allelopathic effect of leguminous weeds on rate, synchronization and time of germination, and biomass partitioning in rice. Planta Daninha 2017, 35, 32. [Google Scholar] [CrossRef]
- KCB-Samen GmbH KCB Samen. Available online: https://www.kcb-samen.ch/ (accessed on 15 April 2020).
- Mashingaidze, A.B.; van der Werf, W.; Lotz, L.A.P.; Kropff, M.J.; Nyakanda, C. Crop yield and weed growth in maize-pumpkin intercropping. In Improving Weed Management and Crop Productivity in Maize Systems in Zimbabwe; Tropical Resource Management Papers; Wageningen University: Wageningen, The Netherlands, 2004; ISBN 90-6754-820-0. [Google Scholar]
- Adedapo, A.; Jimoh, F.; Afolayan, A. Comparison of the nutritive value and biological activities of the acetone, methanol and water extracts of the leaves of Bidens pilosa and Chenopodium album. Acta Pol. Pharm. 2011, 68, 83–92. [Google Scholar]
- Bartuševics, J.; Gaile, Z. Influence of Maize Hybrid and Harvest Time on Yield and Substrate Composition for Biogas Production. In Proceedings of the Research for Rural Development 2009, Jelgava, Latvia, 22 May 2009; Volume 15, pp. 44–49. [Google Scholar]
- Amon, T.; Kryvoruchko, V.; Amon, B.; Zollitsch, W.; Pötsch, E. Biogas production from maize and clover grass estimated with the methane energy value system. In Proceedings of the Conference, Engineering the Future (AgEng’04), Leuven, Belgium, 12–14 September 2004. [Google Scholar]
- Qasem, J.R.; Hill, T.A. Growth, development and nutrient accumulation in Senecio vulgaris L. and Chenopodium album L. Weed Res. 1995, 35, 187–196. [Google Scholar] [CrossRef]
- Gqaza, B.M.; Njume, C.; Goduka, N.I.; George, G. Nutritional assessment of Chenopodium album L.(Imbikicane) young shoots and mature plant-leaves consumed in the Eastern Cape Province of South Africa. Int. Proc. Chem. Biol. Environ. Eng. 2013, 53, 97–102. [Google Scholar]
- Sarabi, V.; Nassiri-Mahallati, M.; Nezami, A.; Rashed Mohassel, M.H. Effects of common lambsquarters (Chenopodium album L.) emergence time and density on growth and competition of maize (Zea mays L.). Aust. J. Crop Sci. 2013, 7, 532–537. [Google Scholar]
- Aarssen, L.W.; Hall, I.V.; Jensen, K.I.N. The Biology of Canadian Weeds. 76. Vicia angustifolia L., V. cracca L., V. sativa L., V. tetrasperma (L.) Schreb. and V. villosa Roth. Can. J. Plant Sci. 1986, 76, 711–737. [Google Scholar] [CrossRef]
- Lin, T.-Y.; Markhart, A.H. Temperature Effects on Mitochondrial Respiration in Phaseolus acutffolius A. Gray and Phaseolus vulgaris L. Plant Physiol. 1990, 94, 54–58. [Google Scholar] [CrossRef]
- Lin, T.-Y.; Markhart, A.H. Phaseolus acutifolius A. Gray is More Heat Tolerant than P. vulgaris L. in the Absence of Water Stress. Crop. Sci. 1996, 36. [Google Scholar] [CrossRef]
- Hungria, M.; Kaschuk, G. Regulation of N2 fixation and NO3−/NH4+ assimilation in nodulated and N-fertilized Phaseolus vulgaris L. exposed to high temperature stress. Environ. Exp. Bot. 2014, 98, 32–39. [Google Scholar] [CrossRef]
- Porch, T.G.; Jahn, M. Effects of high-temperature stress on microsporogenesis in heat-sensitive and heat-tolerant genotypes of Phaseolus vulgaris. PlantCell Environ. 2001, 24, 723–731. [Google Scholar] [CrossRef]
- Gelencsér, T. Mais und Bohnen als Mischkultur. Available online: https://www.bioaktuell.ch/pflanzenbau/ackerbau/mischkulturen/mais-und-bohnen-als-mischkultur.html (accessed on 8 July 2020).
- Celmeli, T.; Sari, H.; Canci, H.; Sari, D.; Adak, A.; Eker, T.; Toker, C. The nutritional content of common bean (Phaseolus vulgaris L.) landraces in comparison to modern varieties. Agronomy 2018, 8, 166. [Google Scholar] [CrossRef]
- MtPleasant, J. Food yields and nutrient analyses of the three sisters: A Haudenosaunee cropping system. Ethnobiol. Lett. 2016, 7, 87–98. [Google Scholar] [CrossRef]
Publisher’s Note: MDPI stays neutral with regard to jurisdictional claims in published maps and institutional affiliations. |
© 2020 by the authors. Licensee MDPI, Basel, Switzerland. This article is an open access article distributed under the terms and conditions of the Creative Commons Attribution (CC BY) license (http://creativecommons.org/licenses/by/4.0/).