Article

The In-Silico Development of DNA Markers for Breeding of Spring Barley Varieties That Are Resistant to Spot Blotch in Russia

by
Irina V. Rozanova
1,2,*,
Nina M. Lashina
3,
Vadim M. Efimov
2,4,
Olga S. Afanasenko
3 and
Elena K. Khlestkina
1,2,4
1
N.I. Vavilov All-Russian Research Institute of Plant Genetic Resources (VIR), 190000 St. Petersburg, Russia
2
Institute of Cytology and Genetics, Siberian Branch of the Russian, Academy of Sciences, 630090 Novosibirsk, Russia
3
All-Russian Research Institute for Plant Protection, 196608 St. Petersburg, Russia
4
Computational Genomics Laboratory, Department of Natural Sciences, Novosibirsk State University, Pirogova, 1, 630090 Novosibirsk, Russia
*
Author to whom correspondence should be addressed.
Agriculture 2020, 10(11), 505; https://doi.org/10.3390/agriculture10110505
Submission received: 30 September 2020 / Revised: 25 October 2020 / Accepted: 26 October 2020 / Published: 28 October 2020
(This article belongs to the Section Crop Protection, Diseases, Pests and Weeds)

Abstract

:
The fungal pathogen Cochliobolus sativus Drechs. Ex Dastur, anamorph Bipolaris sorokiniana (Sacc.) Shoemaker is one of the most common barley pathogens worldwide and causes spot blotch and root rot in barley. Spot blotch is considered to be the major biotic stress hampering the commercial production of barley. During high disease severity, which occurs in the northwestern region of Russia once every three to four years, yield losses for barley may reach 40%. An increase in common root rot severity results in yield losses that can reach 80%. The goal of the current study was to identify significant markers that can be employed as diagnostic DNA markers to breed C. sativus pathogen-resistant varieties of barley. In 94 spring barley cultivars and lines, the resistance of seedlings and adult plants to the impact of C. sativus on their leaves and roots was investigated. Five genomic regions associated with resistance to Spot blotch were identified (on chromosome 1H (50–61.2 cM), 2H (68.7–69.68 cM), 3H (18.72–26.18 cM), 7H (7.52–15.44 cM)). No significant loci were determined to be associated with root rot. According to obtained data, 11 significant SNPs were converted into KASP markers and 6 markers located on chromosome 3H were determined to possess good accuracy and the potential to be employed in marker-assisted selection.

1. Introduction

The fungal pathogen Cochliobolus sativus Drechs. Ex Dastur, anamorph Bipolaris sorokiniana (Sacc.) Shoemaker is one of the most common barley pathogens worldwide and causes spot blotch and root rot in barley [1,2,3].
Spot blotch is considered to be the major biotic stress hampering the commercial production of barley. Spot blotch is distributed across all barley-growing areas. During high disease severity, which occurs in the northwestern region of Russia once every three to four years, yield losses for barley may reach 40% [4]. Severe spot blotch epidemics lasting one to two weeks prior to maturity may reduce barley yields by 10–20%, while epidemics lasting three to four weeks may reduce yields by 20–30%, including a 10–15% reduction in kernel weight [5].
The C. sativus pathogen is dangerous in areas with warm, wet climates [6]. A prolonged period (16 h or more) of leaf surface wetness is one of the key factors affecting disease spread and severity [5]. The important indicator of competitive ability among modern cultivars is disease resistance [7]. The sources of spot blotch resistance genes can be found in different regions. Bonman et al., studied the origin of resistance to spot blotch accessions at NSGC (National Small Grains Collection) in 2005 [6]. These researchers reported that high resistance to spot blotch is most often found in varieties that originate in the northern part of the USA. Additionally, moderate adult-plant spot blotch resistance was found in eastern Asia [6]. Using accession CI-7117-77 from the northern American collection, the resistant line NDB112 was bred [8]. Durable resistance from this line was utilized in barley breeding for over 40 years. The resistant cultivars Cree, Manker, and Morex were developed and became prevalent in barley production in the northern states of the USA in 1990 [9,10]. Bykova et al., 2017 reported nine spring barley cultivars from Siberian and northern Russian breeding centres with seedling resistance to at least two different isolates of C. sativus [11]. The development of barley cultivars that are resistant to spot blotch is relevant for many regions of the Russian Federation, where the crop losses caused by this disease may reach 30% in northwestern Russia [12] and 37% in the Mordovia region (average disease severity in the phase of barley wax ripeness measured in 2001–2010) [13]. Reduced levels of spot blotch development were reported in dry years only as reported in 2005–2016 monitoring in the Kirov region [14].
C. sativus also causes common root rot. An increase in common root rot severity resulted primarily in a reduction of spikes per plant and seeds per spike, thereby contributing to yield loss, which can reach 80% [15]. An increase in root rot harmfulness was registered in the central region of the European part of Russia in dry and hot weather, which causes anaerobic conditions and soil crust. The wide distribution of root rot was observed in conditions of drought in 2010. In that period, the disease was reported in all observed areas, with frequencies ranging from 57 to 76% in separate fields [13]. During nine years between 2005 and 2016, strong root rot development was observed nine times in the Kirov region [14]. Root rot is the most common disease in the forest-steppe zone of western Siberia [16].
Although both diseases are caused by one pathogen, no correlation was found between resistance to spot blotch and resistance to root rot. It was shown that the resistance of leaves and roots is controlled by different genes [3,17]. At present, resistance loci have been identified on all barley chromosomes [11]. Application of QTL analyses for barley resistance to C. sativus since 1995 [18], supplemented later by genome-wide association studies, demonstrated the presence of genomic loci associated with spot blotch resistance on all barley chromosomes [9,11,19,20,21,22,23,24,25,26].
Overall, studies aimed at identifying adult plant resistance to spot blotch are considerably rarer than those investigating seedling resistance. Arabi et al., 2007 showed that both seedlings and adult plants show the same reactions to the same C. sativus isolate [27]. At the same time, Steffenson et al., 1996 showed, for instance, that loci on chromosome 3H for spot blotch resistance in the seedling and adult stages were mapped to different regions [18].
Unlike resistance to some other fungal diseases, which is determined by oligogenes, resistance to C. sativus has a polygenic nature, which impedes the application of marker-assisted selection. Nevertheless, the development of DNA markers associated with resistance is very desirable [18], and since 1996, markers have been developed for the selection of spot blotch-resistant barley plants [28,29]. However, to date, there are no convenient markers for practical breeding. Recently, the 50K Illumina SNP array was introduced to barley genome-wide association studies [4,11], thereby broadening the selection of genomic polymorphisms suitable for conversion to markers useful for breeding programs. In an earlier study utilizing the 50K SNP array for analysis of the Siberian spring barley collection, we identified several SNPs associated with seedling resistance to spot blotch [11]. The current study attempted to convert significant SNPs to KASP markers and apply them to independent sample analysis. The phenotyping was extended to additional C. sativus isolate testing and spot blotch resistance testing of adult plants, as well as to the assessment of resistance to common root rot.

2. Materials and Methods

2.1. Plant Material and Genotyping Data

The research was based on a study of the Siberian spring barley collection, which was described previously [11], as well as on independent barley accessions described in Table S1 [4]. Additional information on 50K Illumina SNP-array loci was extracted from Cantalapiedra et al., 2015 [30] and the BARLEYMAP resource available online: http://floresta.eead.csic.es/barleymap (accessed on 6 April 2020). The independent barley accession set resistance data were available from Novakazi et al., 2019 [4]. DNA of accessions presented in the independent sample set was extracted using a Qiagen kit (Qiagen GmbH, Germany, DNeasy Plant Mini Kit 250) according to the instructions of the manufacturer.

2.2. Pathogen Isolates and Culture Conditions

For spot blotch (at the adult stage) and root rot (seedling stage) evaluation, C. sativus isolate O18.2, which originated from Omsk (Siberia region of Russia), was employed. Artificial infection in the field for evaluating adult plants was developed by using a single conidial isolate Ch3 (northwestern Russia, Leningrad region). The data obtained in this study were compared with data from a previous research, where the isolates Ch3 and Kr2 (South of European part of Russia, Krasnodar region) were used for seedling evaluation [11]. Methods of cultivation and isolate maintenance were described in a previous report [11].

2.3. Resistance to Spot Blotch

  • Experimental design
Plant growing and disease assessment of seedling resistance to spot blotch was described in our previous paper [11]. Plants were inoculated by spraying with conidial suspension (10,000 conidia/mL) 12–14 days after planting (two- or three-leaf stage).
A study of adult plant resistance of 96 barley genotypes was conducted on the experimental plots of VIR (St. Petersburg, Pushkin). The rows were 1-metre-long, with 20 seeds being planted per row. The distance between rows was 30 cm. The susceptible variety Harrington was planted at every 10 varieties as a control. Plants in stage BBCH 30 (BBCH is a scale for determining the developmental stages of cereals) were inoculated by spraying with suspension at a concentration of 20,000–25,000 conidia per mL. To improve the contact of conidia with the leaf surface, 100 μL/L of surfactant Tween 20 was added to the suspension.
  • Disease evaluation
Infection responses (IRs) of seedlings were measured 10 days after inoculation at the two- to three-leaf stage using the one-to-nine rating scale of Fetch and Steffenson [31]. The lesion size and the degree of associated chlorosis were the basis of this scale, which was described in our previous paper [11]. A susceptible cultivar, Harrington, was selected as a high-IR control.
The infection responses to spot blotch exhibited by adult plants were reported in the phase of milk-wax ripeness (BBCH 73–83) as a percentage of leaf area infected with disease on the upper and lower leaves. The average disease severity was determined for ten plants of each barley accession. A four-class rating scale for assessing disease severity was employed: R—highly resistant (1–10.5%); MR—moderately resistant (11–20%); MS—moderately susceptible (21–39%); and S—susceptible (40–80%).

2.4. Resistance to Root Rot

  • Experimental design
Laboratory experiments were performed in a climate-controlled room at a temperature of 23 °C and a light period (9000 lux) of 16 h. The seeds of the tested accessions were germinated on moistened filter paper in Petri dishes in the dark for two to three days. Sprouted grains were placed on sterile sand moistened with distilled water in 200 mL plastic pots (100 g of sand in each) and inoculated with 10 mL per pot of suspension at a concentration of 50,000 conidia/mL (5000 spores per 1 g of sand). As a control, the same number of plants of each accession was employed without inoculation. Harrington cultivar susceptible to root rot were utilized as infection controls. The experiment was conducted in three replicates with 15 plants of each accession in one replicate (total of 45 plants for each accession).
  • Disease evaluation
At 14 days after inoculation, when the plants were in the phase of two to three leaves, the damage of barley samples by root rot was measured. The plants were carefully removed from the sand, the roots were thoroughly washed with water, and the degree of damage to roots and coleoptiles was visually assessed using a five-point scale.
This scale of assessment of seedling root rot caused by C. sativus is based on the brown lesion size and color of coleoptile. Low IRs of 0–1 (small light brown lesions not measuring more than 0.5 cm on the roots and single strokes on coleoptile) correspond to resistance (R), a score of 2 (light brown lesions on the roots up to 1 cm long, strokes on coleoptile strongly marked) indicates moderate resistance (MR), a score of 3 (light brown/black lesions on the roots up to 1.5 cm long and light brown color of coleoptile) demonstrates moderate susceptibility (MS), and scores of 4 (strong brown/black lesions on the roots up to 2 cm long; strong brown colour of coleoptile; brown/black lesions) and 5 (strong brown/black on the roots longer than 2.5 cm in length, black lesions on coleoptile, seedling dies), correspond to accessions that are susceptible (S) and highly susceptible (HS), respectively, to root rot. Types of reactions were reported only if the susceptible cultivar Harrington exhibited high IRs.

2.5. Association Analysis

Association analysis was performed using the TASSEL 5 package [32]. In total, four statistical tests were employed for this study, including a general linear model (GLM) without population structure and accounting for population structure across the Q-matrix and principal component analysis (PCA) and a mixed linear model with kinship matrix (MLM + K). In this study, the newly obtained phenotypic data were utilized along data obtained previously [11], and new data were analyzed with the same models as the old data to compare them. Genotyping data were analysed using the barley 50K Illumina iSelect SNP array at the Traitgenetics GmbH (Gatersleben, Germany), and a set of 27 319 markers were selected for the next analysis after quality control [11].
To detect significant SNPs, two corrections were employed: (i) the 5% Bonferroni threshold was set at 1.8309 × 10⁻⁶, which meant that the significance level (0.05) was divided by the total number of tests (27,319), and (ii) the false discovery rate (FDR) was calculated for each isolate in each model. The suggestive level corresponded to p < 10−4, which implied that the significance of an association was sufficiently high but did not exceed the threshold value.

2.6. Conversion to KASP Markers

When the candidate SNPs were detected, their reference sequence was obtained using the http://plants.ensembl.org/index.html database. Next, sequences were analyzed with the UGENE program. Polymorphic DNA alleles with flanking sequences measuring 101 bp were presented using the format in which two allele states at investigated SNPs were divided by the symbol “/” and enclosed in square brackets. The known polymorphic base pairs were identified using standard nomenclature. The 11 markers, which were converted into the KASP markers, were chosen based on the obtained data. KASP genotyping was conducted by LGC Genomics (UK). Primers sequences are presented in the Table S5.

3. Results

3.1. Phenotyping

The results of the investigation of the seedling and adult resistance to spot blotch isolates are presented in Table S2. According to the Fetch and Steffenson rating scale, 19% of genotypes were resistant, 34% of genotypes were moderately resistant to isolate O18.2 at the seedling stage, 5% of genotypes were resistant, and 18% were moderately resistant to isolate Ch3 at the adult plant stage. The obtained results were compared with previous data obtained for seedling resistance for two isolates: Ch3 and Kh2 [11]. Three genotypes (B-1, Kolchan, Svetik) were resistant to all isolates at both the seedling and adult plant stages. Seven cultivars, Aley, Biom, G-21219, Mutant 68, Omsky golozyorny 2, Severny, and Signal, were resistant to three of four isolates. Twenty per cent of genotypes were resistant, and 11.7% of genotypes were moderately resistant to isolate O18.2 when it was used for seedling evaluation of resistance to root rot (Table S3). One cultivar, Kolchan, was resistant to all isolates and exhibited seedling and adult spot blotch resistance and root rot resistance. One cultivar, Aley, was resistant to common root rot, and one cultivar was resistant to spot blotch at the seedling stage. The results of correlation analysis of data on seedling and adult resistance to different isolates are given in Table 1.
The correlation is shown in the low triangle; the correlation significance is shown in the upper triangle. The significant p-value in all cases was <0.05.

3.2. GWAS Analysis

  • Isolate O18.2. Seedling resistance
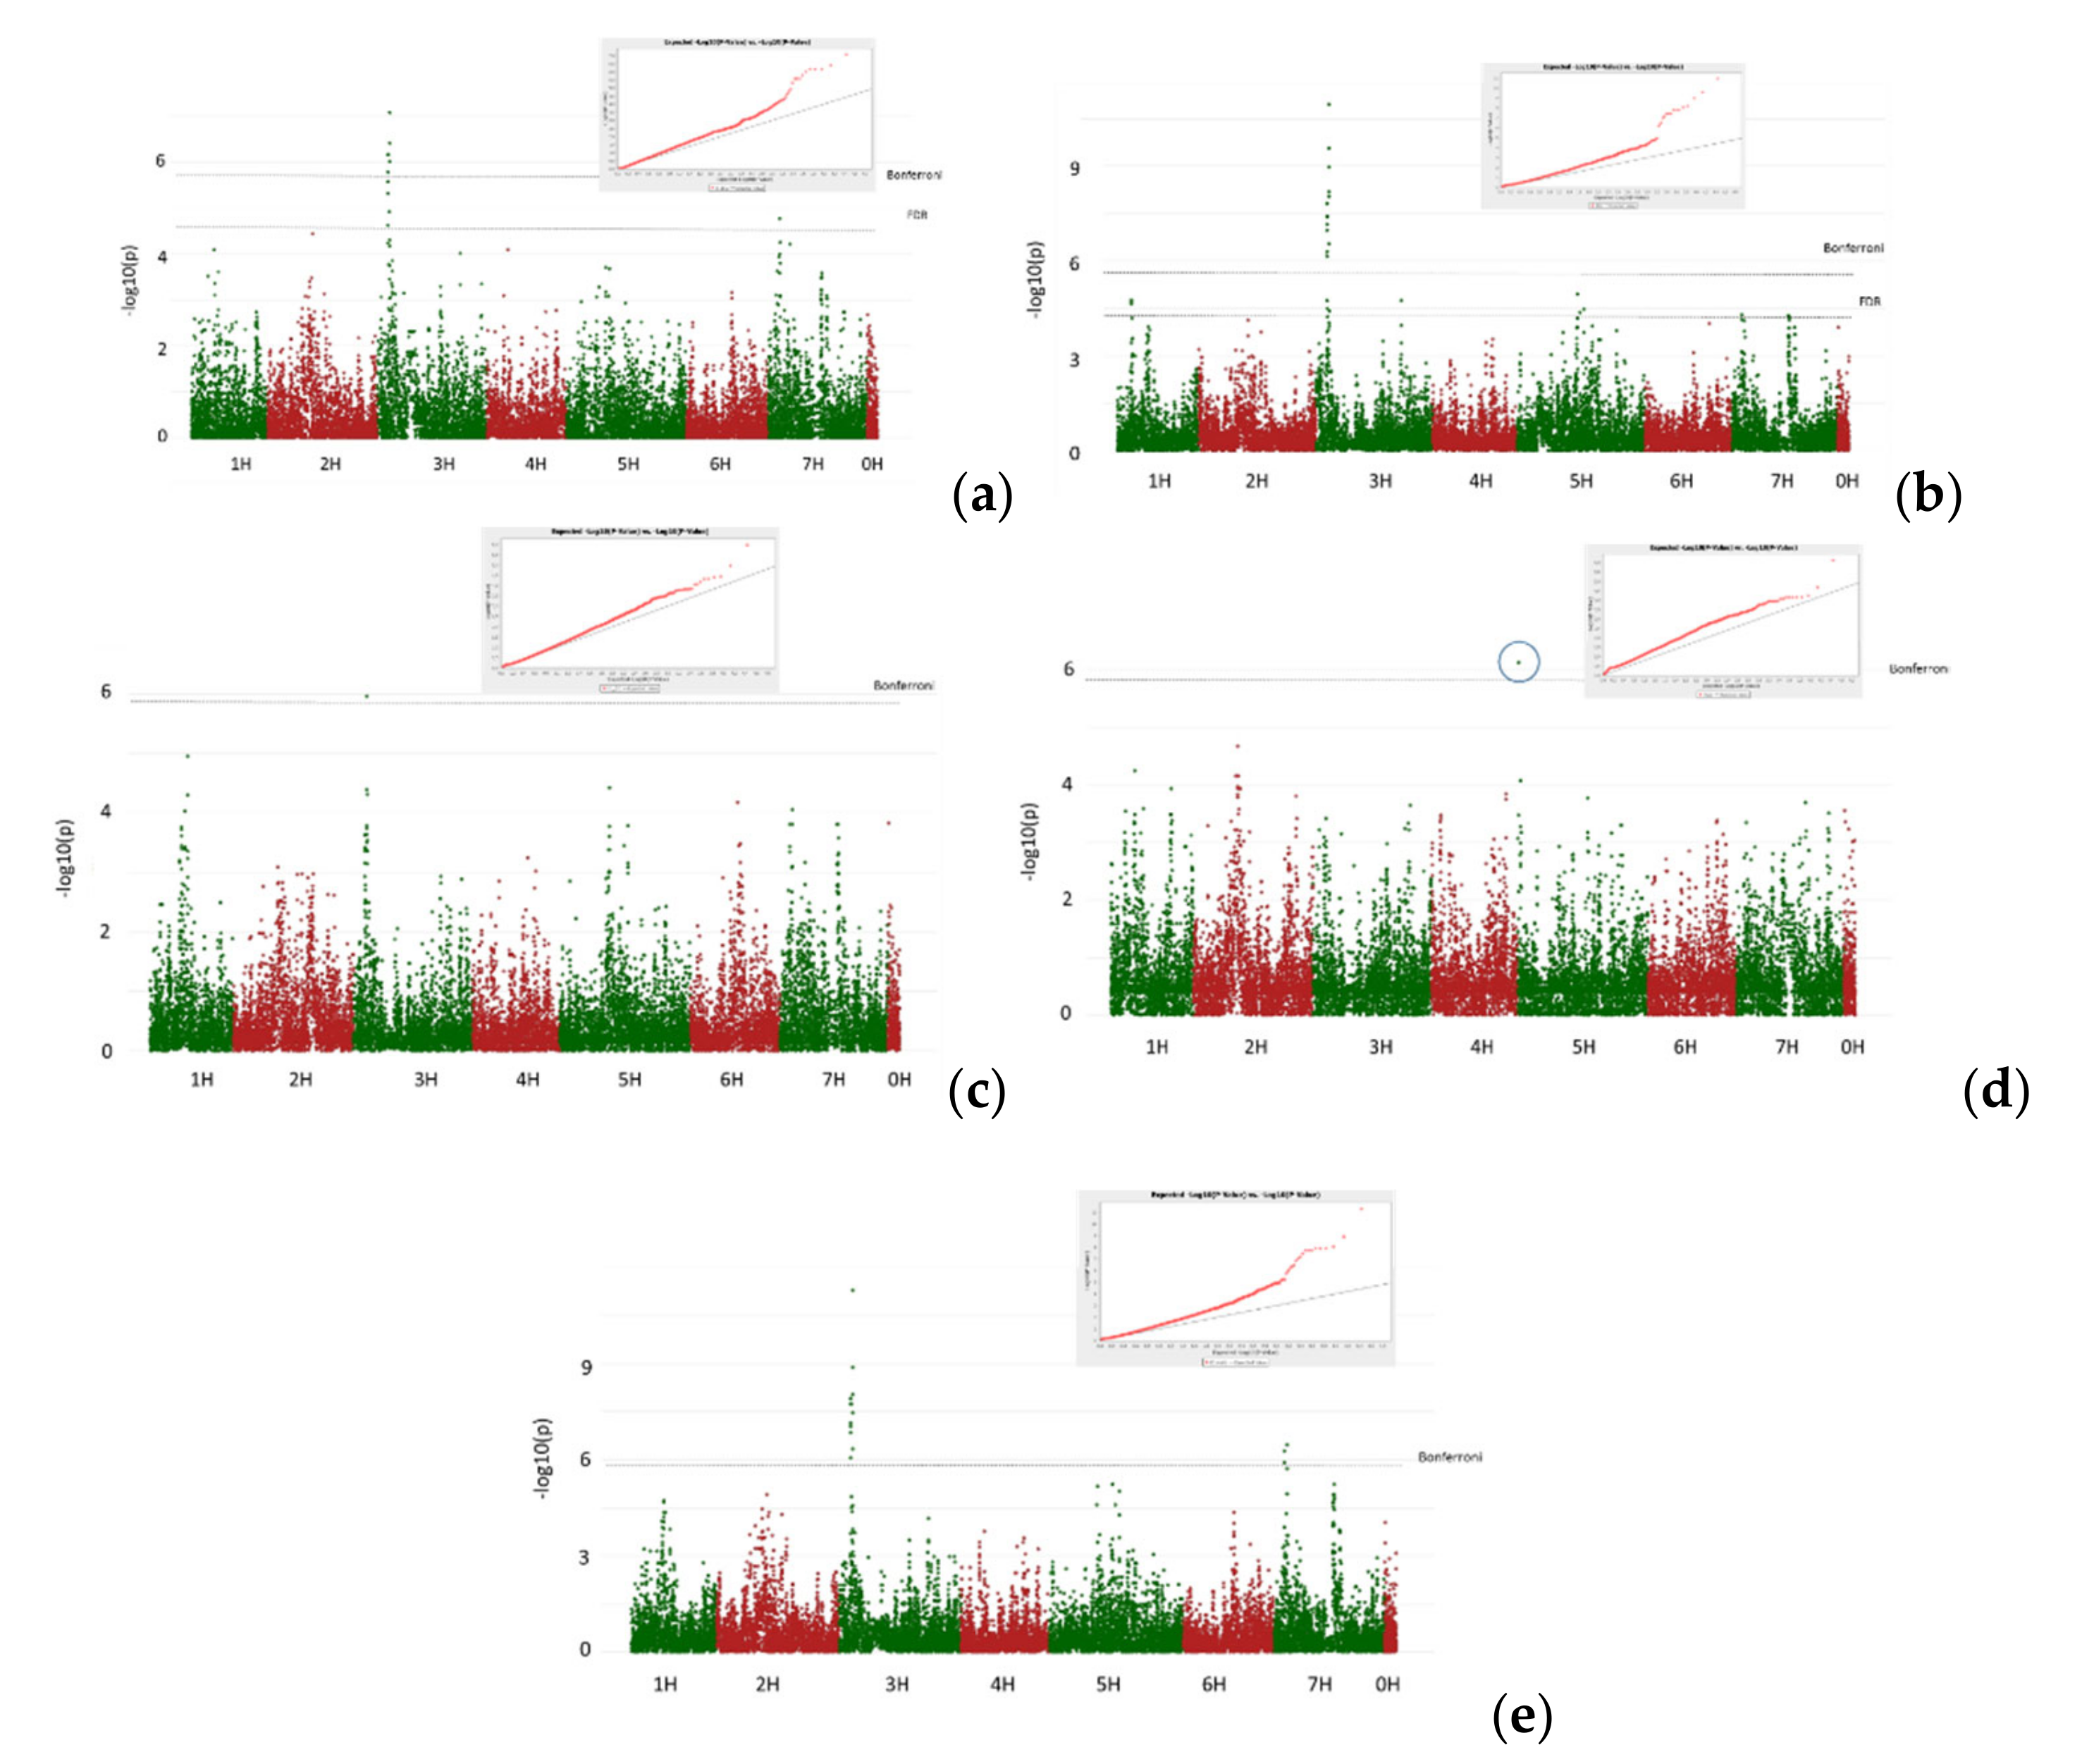
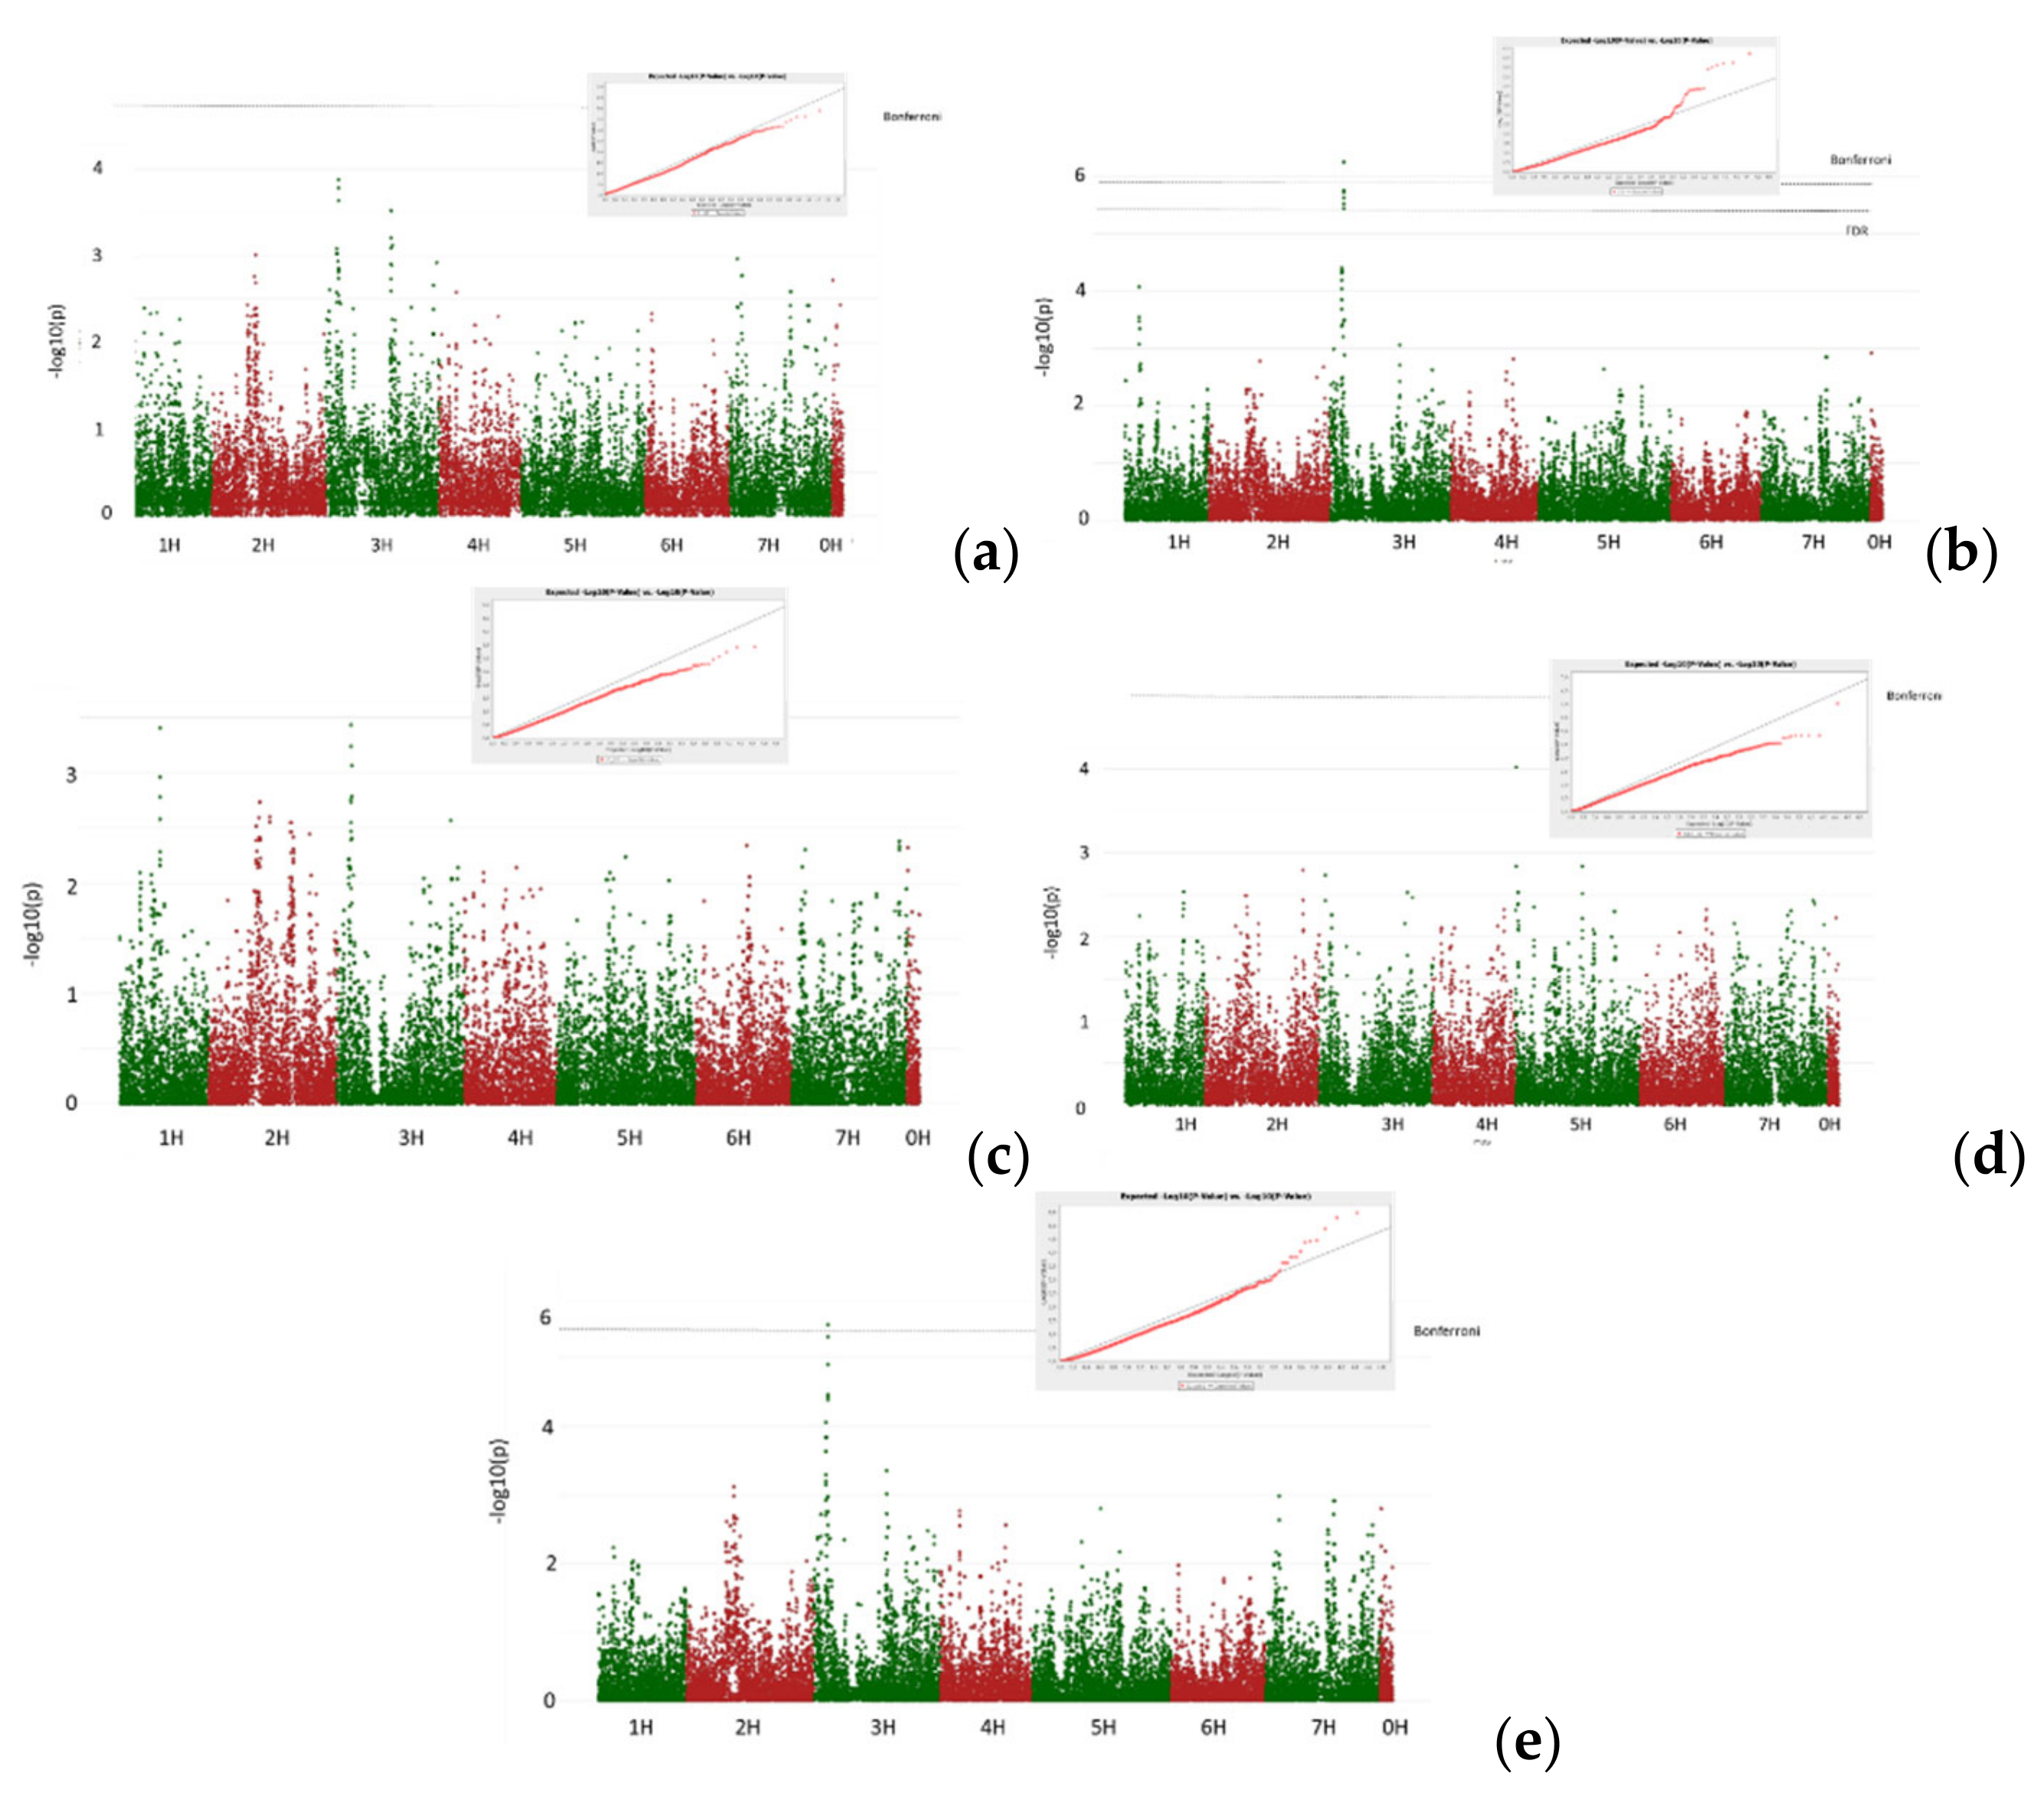
To estimate the significance of the observed associations, the results of every model were first considered in the QQ plot. Ideally, the line representing the observed p-values should match that for the expected p-values. For the O18.2 experiment performed at the seedling stage, the most accurate result was obtained using the GLM + Q, GLM + PCA or MLM + K models, while the GLM model without correction for population structure provided a large number of false-positive SNPs Figure A1. With the help of the GLM + Q model, in total, 47 SNPs were identified, namely, 2 SNPs on chromosome 1H, 17 SNPs on chromosome 3H, 1 SNP on chromosome 7H and 28 SNPs on chromosome 2H, but the locus region is too large, and we suggest that among SNPs of the second chromosome, false-positive SNPs are presented (Figure A2a). With the help of the GLM + PCA model, in total, 14 SNPs were identified, namely, 13 SNPs on chromosome 3H and 1 SNP on chromosome 7H (Figure A3a). No significant SNPs were identified with the MLM + K model (Figure A4a). Results for every model were compared with previous researches (with data of Ch3 and Kr2 isolates) and it was showed that pathogen response locates in the same genomic regions (Figure A2b,c; Figure A3b,c; Figure A4b,c).
In total, 4 genomic regions were identified, namely, on chromosome 1H (50–61.2 cM), 2H (68.7–69.68 cM), 3H (18.72–26.18 cM) and 7H (7.52–15.44 cM). All identified SNPs in the current study are presented in Table S4. The comparison of seedling resistance loci obtained by testing the O18.2 isolate with previous data for other isolates [11] showed that significant genome loci were identified in the same chromosomal regions (Figure 1).
  • Isolate Ch3. Adult resistance
According to the results of GLM + Q and GLM + PCA, only one significant SNP on chromosome 5H at the interval 1.12–1.22 cM was revealed (Figure 1). No significant SNPs were identified using MLM analysis with the kinship matrix (MLM + K model).
  • Common root rot
No significant SNPs were revealed in these studies.

3.3. PCA

The principal component analysis (PCA) was calculated for all phenotypic disease evaluation data regarding spot blotch. The principal component analysis for genotypic data was calculated through the distance matrix [33] using the software package JACOBI4 [34]. To calculate the distance matrix between barley varieties, we re-coded the barley genome from a two-letter code to a numerical code. After the re-coding, 0 was assigned to the effector allele, and 1 was assigned to the non-effector allele, and their intermediate forms were coded as 0.5. For example, the AA allele is reflected as 1, AG as 0.5, and GG as 0. Both sets of main components were taken as blocks in two-block partial least-squares (2B-PLS) analysis (first set is phenotypic block, second set is genotypic block).
“Phenotype-genotype” covariation was calculated as a set of linear bi-components. The first three linear bi-components capture 93% of the sum covariation. Therefore, three first components were analyzed.
Correlation coefficients are shown for all investigated isolates, both for seedlings and for adult plants. We consider bi-components simultaneously, both for phenotyping and for genotyping, to process the data for a more complete investigation. The phenotypic part reflects the totality of all phenotypic reactions in the infection response investigation. It was observed that seedling resistance to every isolate correlates with the first phenotypic bi-component, as well as the resistance of adult plants. Additionally, the resistance of adult plants correlates with the second phenotypic bi-component.
Therefore, using the phenotypic bi-component data as the phenotypic reaction in the GWAS analysis, we can obtain markers associated with resistance to all isolates within the investigated varieties. Therefore, the associated analysis of the first bi-component data was conducted. Model GLM showed that 41 SNPs are significant. Of these SNPs, 22 are on chromosome 1H, 17 SNPs are on chromosome 3H and 2 SNPs are on chromosome 4H. Moreover, according to the QQ plot, this model shows the presence of false-positive markers (Figure A1).
A total of 35 significant SNPs were identified using model GLM + Q (Figure A2e). Of these SNPs, 18 were on chromosome 2H, and 17 were on chromosome 3H. Model GLM + PCA identified 18 SNPs. Sixteen of these SNPs were on chromosome 3H, and 3 SNPs were on chromosome 7H. (Figure A3e). A total of 7 SNPs were identified with the MLM + K model (Figure A4e). Locus markers on chromosome 3H and on chromosome 7H, which were detected using the first bi-component, coincide with the markers previously identified by the authors. The correlation of the first bi-component data with all isolates and with adult plants suggests that these markers may be determined to be diagnostic within the studied isolates.

3.4. PLS Analysis

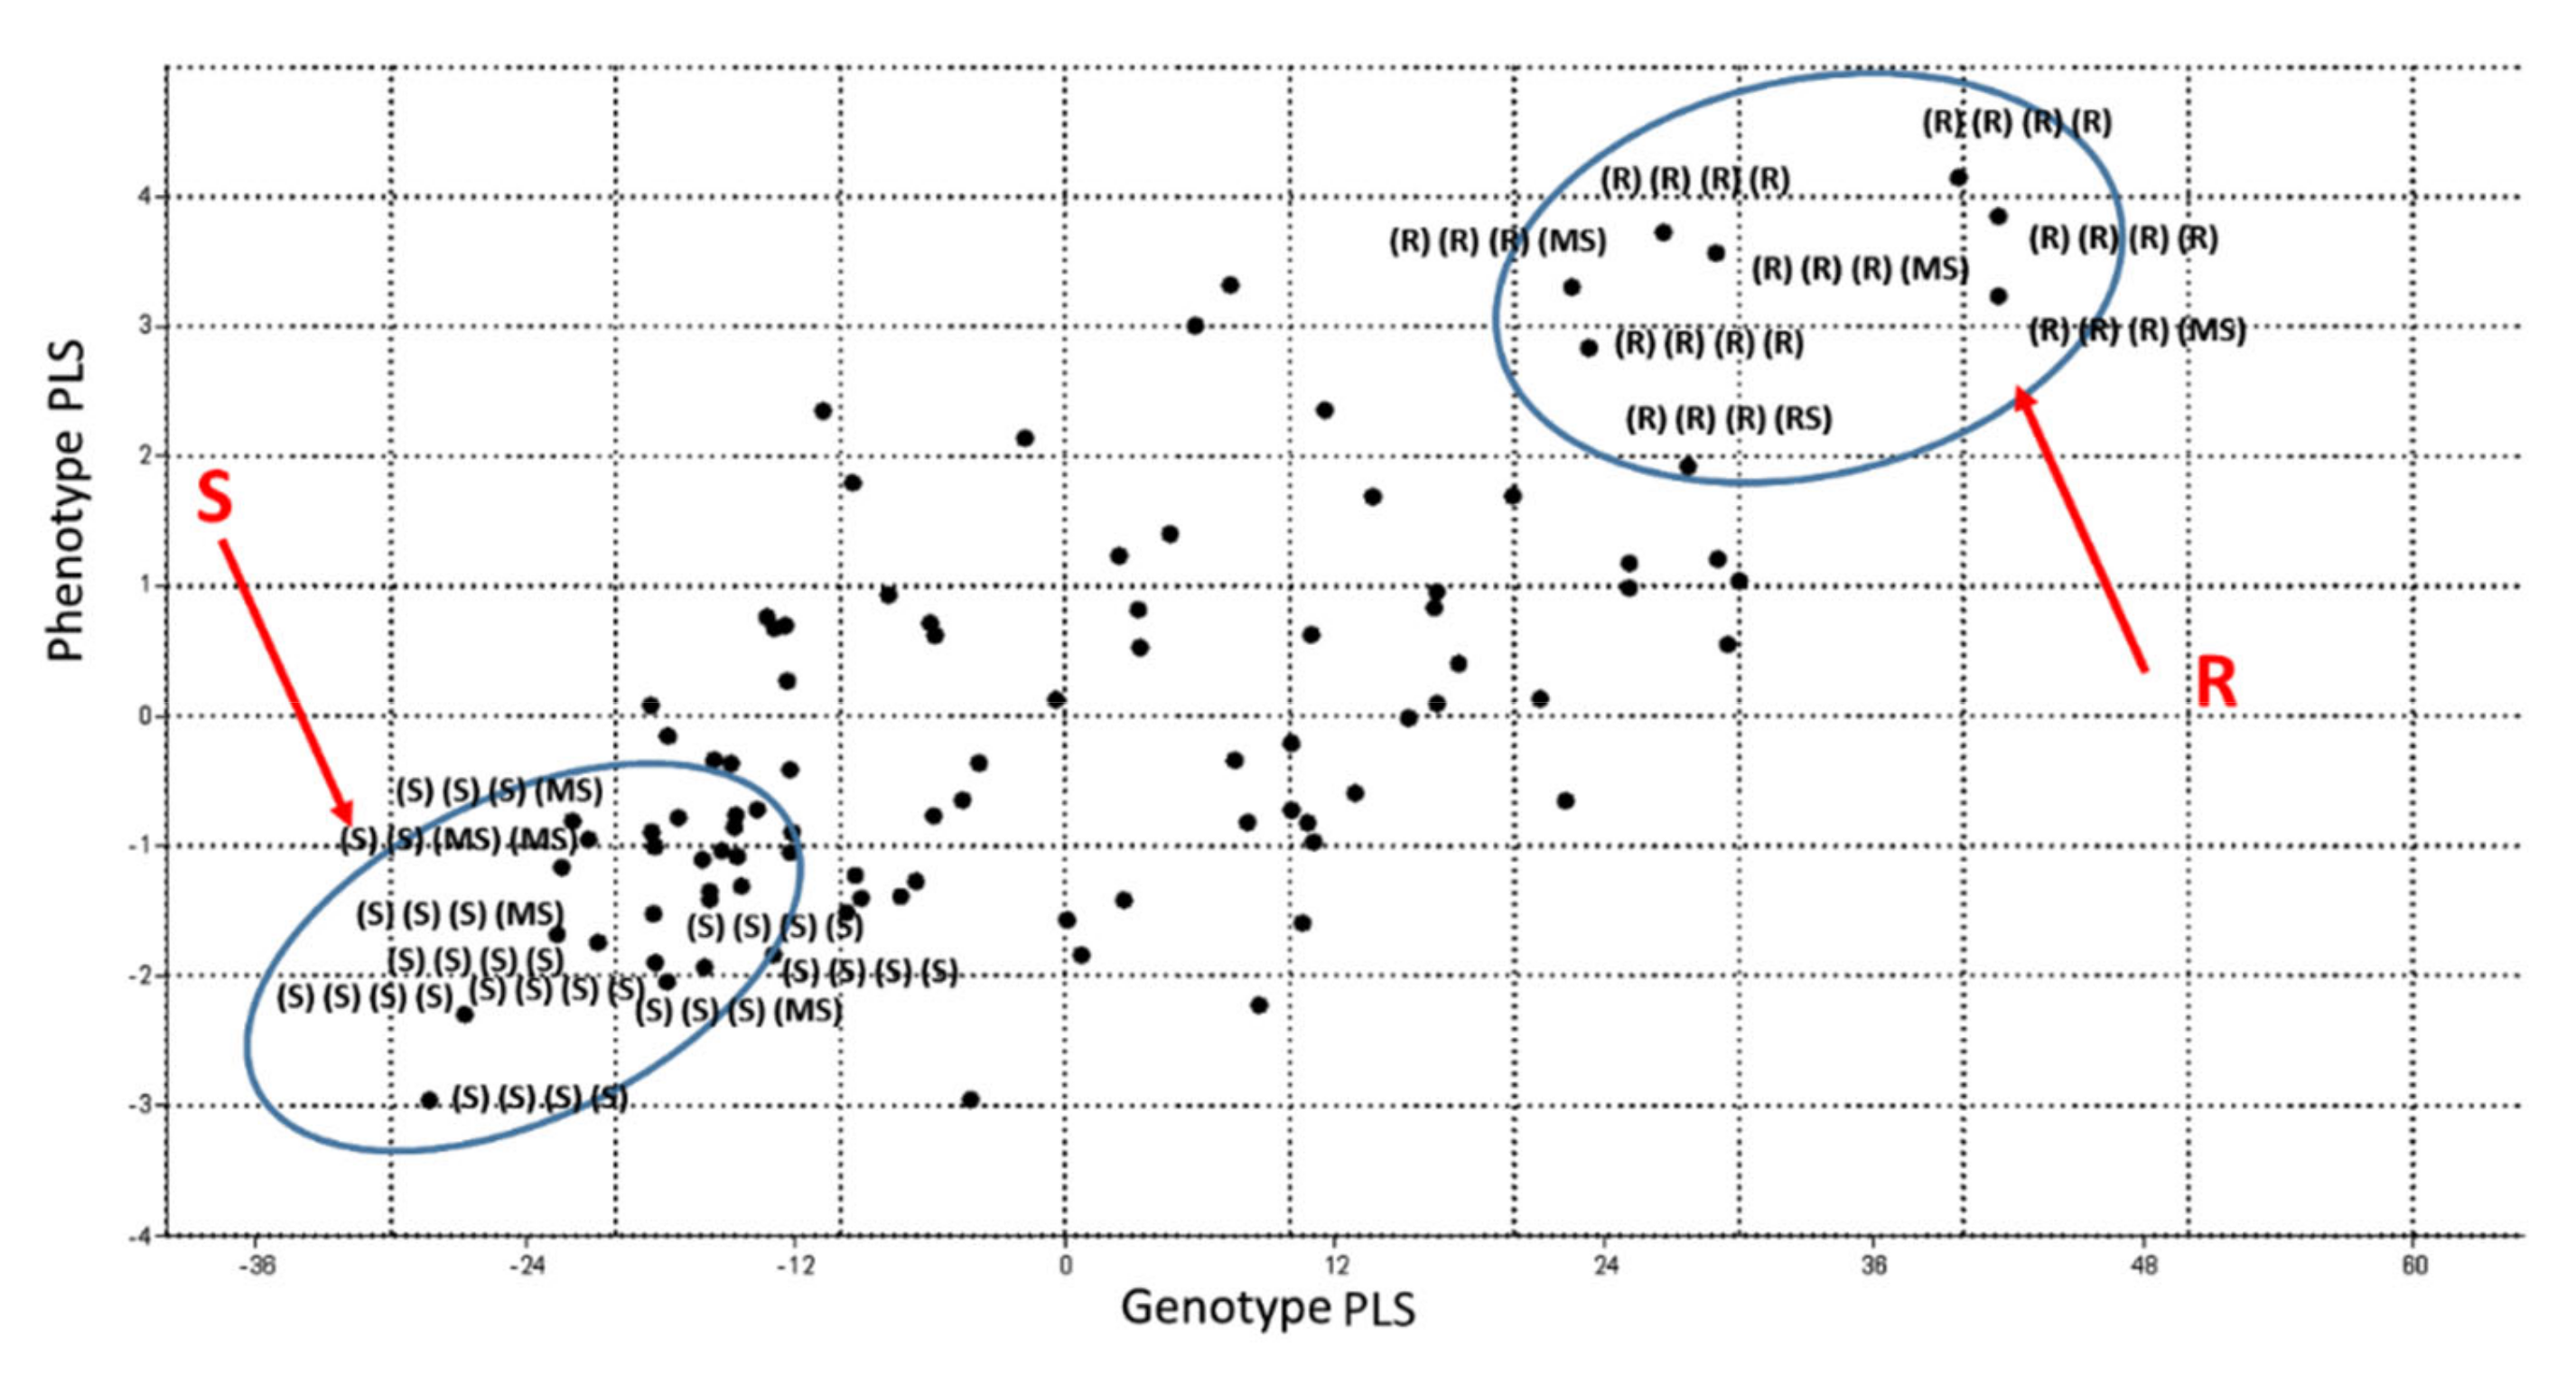
As a result of the PLS analysis applied to the totality of phenotypic traits (resistance to spot blotch) and genotypic data, bi-components were obtained: phenotypic and genotypic, with most corresponding to each other. All phenotypic traits correlate with the first bi-component (Table 2), that is, the first bi-component reflects the overall stability of the studied traits. A correlation plot was constructed between the genotype and the phenotype data of the first bi-component (Figure 2). Considering the resistance of varieties to various pathogen isolates at the stage of seedlings and adult plants, it was observed that varieties that showed primarily resistance are grouped at one end of the correlation line (the circle “R” at Figure 2). Additionally, varieties susceptible to the pathogen in all trials are on the other end of the correlation line (the circle “S” in Figure 2). As a result, two clusters were identified: resistant (eight varieties) and susceptible (30 varieties) varieties to spot blotch (Figure 2). Accordingly, it can be concluded that these varieties possess the genetic background that responds to infection by the studied pathogens.
The SNPs enabling the two clusters R and S to be distinguished (Figure 2) were considered, and of these SNPs, 11 markers were selected for further conversion to KASP markers (Table S4): these SNPs are located on chromosome 1H (50–61.2 cM), chromosome 3H (18.72 cM and 24.63–26.18 cM), chromosome 5H (1.12–1.22 cM) and chromosome 7H (7.52–15.44). Ten out of the 11 SNPs were successfully developed at LGC, and 1 failed (** in Table 3). Despite the identification of significant SNPs on chromosome 2H, these SNPs did not help to clearly distinguish the two clusters R and S (Figure 2).

3.5. KASP Genotyping Results

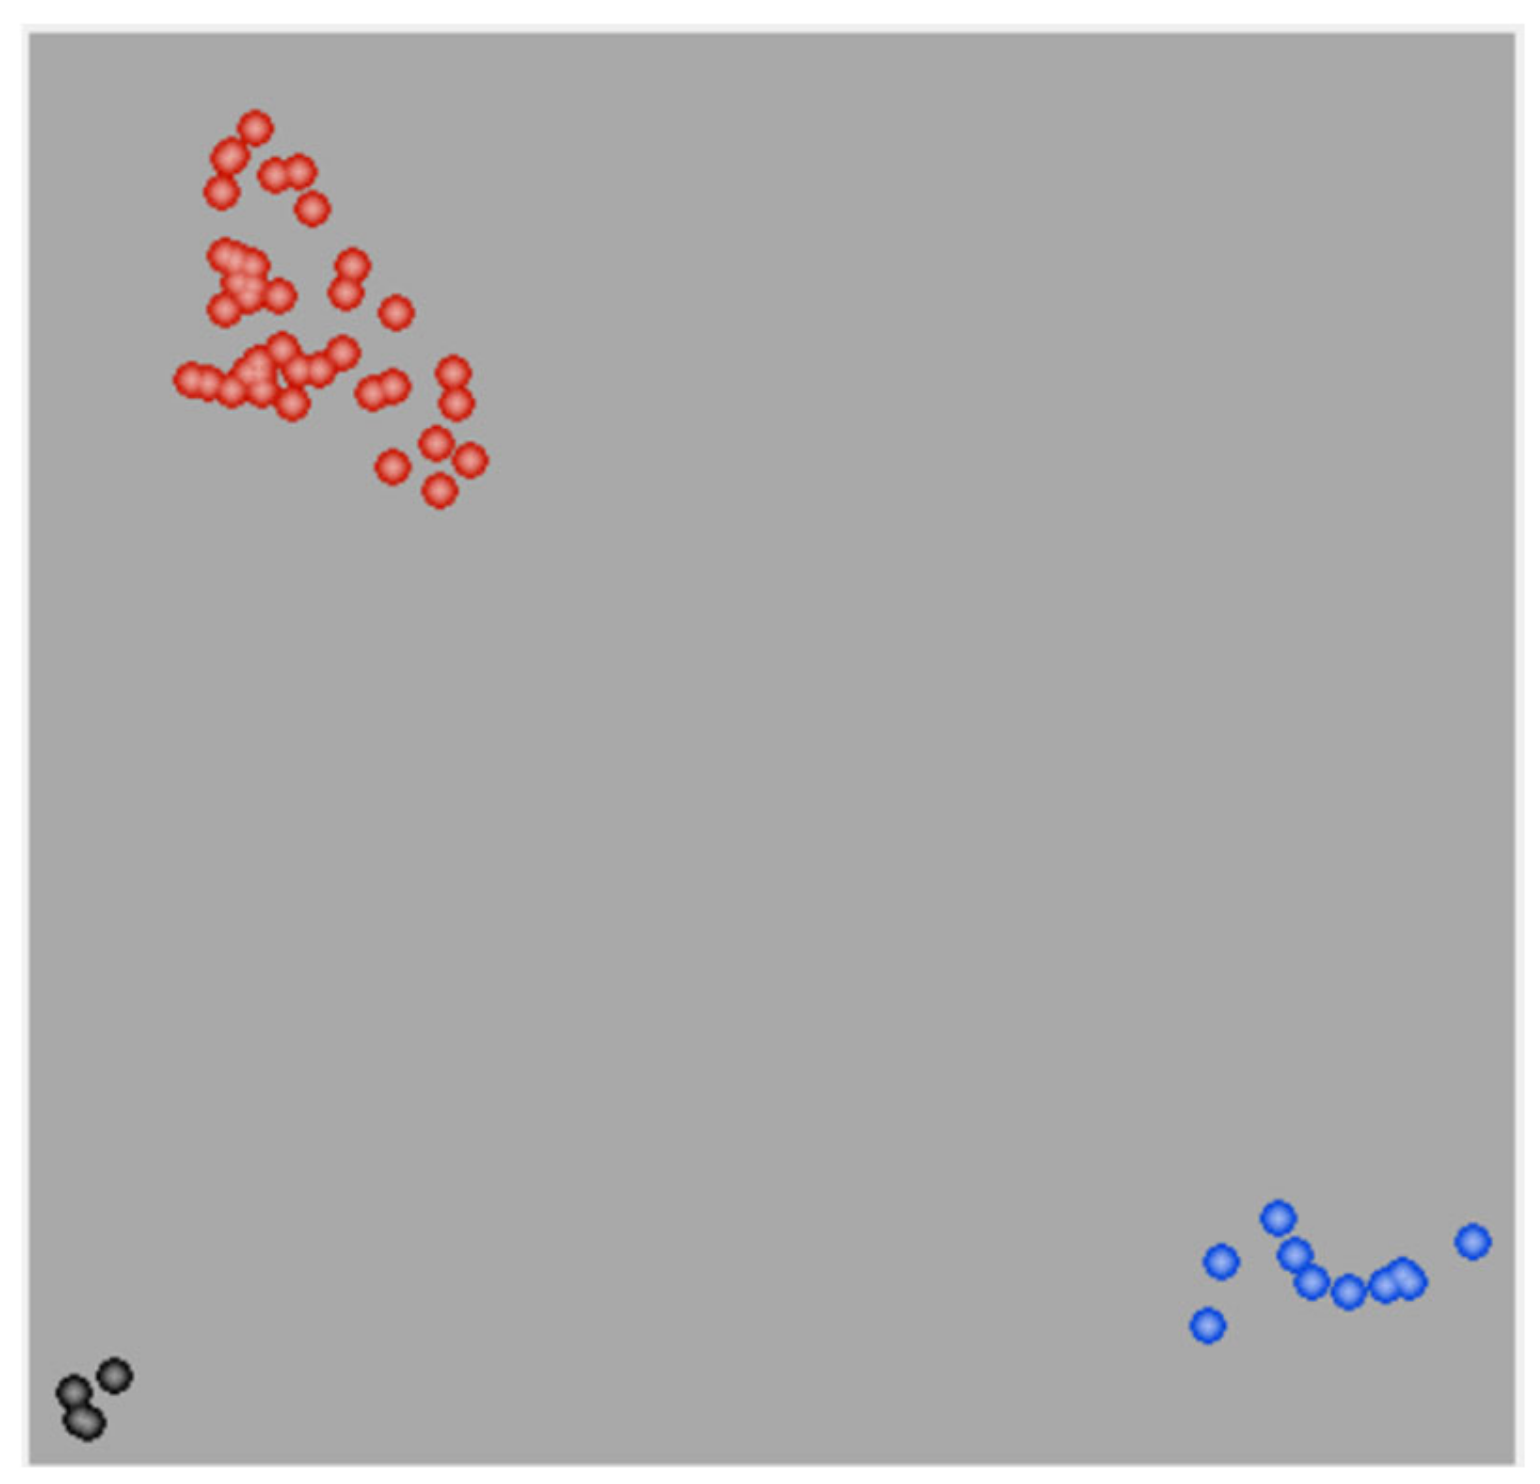
To validate that significant SNPs were converted to KASP markers, independent barley accessions (22 accessions, including 11 resistant and 11 susceptible to spot blotch) were chosen. The results were plotted on a Cartesian plot, where the x-axis shows the FAM signal fluorescence value for each sample associated with one allele and the y-axis shows the HEX signal fluorescence value associated with the second allele (Figure 3).
Using the marker JHI-Hv50k-2016-156842 (Figure 3), we observed that all 11 susceptible varieties had the G allele. Eight of 11 resistant varieties had the A allele, while the other three resistant varieties had the G allele, which was characteristic of a susceptible phenotype. Similarly, we analyzed the results obtained with other KASP markers and concluded that 6 markers located on chromosome 3H had good prediction accuracy (JHI-Hv50k-2016-156842, JHI-Hv50k-2016-157070, JHI-Hv50k-2016-156820, JHI-Hv50k-2016-157182, JHI-Hv50k-2016-156833, JHI-Hv50k-2016-155569) and can be recommended for marker-assisted selection. The correspondence of the allelic state of the marker and phenotypic reaction to infection is presented in Table 4.

4. Discussion

According to previously published studies, no significant correlations were observed between root and leaf infection caused by B. sorokiniana [3,17].
As shown in Table 1, the correlation between seedling resistance to different isolates was high enough (from 0.61 to 0.73). The correlation between the seedling and adult stages was weaker. Adult plants were infected with the Ch3 isolate, and the correlation between the indicators for seedlings infected with Ch3 and similarly infected adult plants was 0.59.
Table 1 shows that the correlation between root rot and spot blotch varies in the region from 0.22 to 0.28.
Several loci were identified in the significant interval of chromosome 1H (50–61.2 cM; Figure 1). In 1996, Steffenson et al. revealed QTLs for adult plant resistance (53.6–61.2 cM; [18]). The locus responsible for seedling resistance was determined to be at 59.7 cM by Roy et al., 2010 [9]. The locus between 40 and 50 cM was identified by Gutierrez et al., 2013 [35]. Later Afanasenko et al., 2015 [36] identified QTLs at the SNP locus BOPA_11_11015 (syn. BOPA1_946–2500; position in iSelect map—54.2 cM) by analysis of bi-parental mapping population Zernogradsky 85 (R)/Ranny 1 and Haas et al., 2016 [26] revealed the locus on 1H chromosome (42.2 cM) on population derived from the wild accession and the cultivar Rasmusson. However, the investigated marker JHI-Hv50k-2016-33568 from the current study showed only slight predictive power (55%), which does not enable it to be utilized in marker-assisted selection. It is possible that this marker could be used as race-specific to certain pathogen isolates.
On chromosome 3H, the QTL associated with resistance to spot blotch was found in a very similar position by Zhou and Steffenson, 2013 [20]. Additionally, the resistance locus was identified for seedlings at position 9.6 cM (Bopa_12_30818) and for adult plants at position 19.2 cM (BOPA_11_20742, BOPA_11_10565). Grewal et al., 2012 [37] detected the resistance locus for seedlings in the interval 24.9–31.1 cM and two QTLs of resistance for adult plants in the interval 23.0–24.9 cM. In the current study, the genomic locus with the most significant SNPs was determined to be on chromosome 3H in intervals of 18.72 and 24.6–26.18 cM. Three of the markers (JHI-Hv50k-2016-156842, JHI-Hv50k-2016-156833, JHI-Hv50k-2016-155569) in which the presence of one or another allele was associated with the resistance/susceptibility of varieties can be employed as diagnostic markers in breeding programs.
According to published data, there is not enough information indicating the locus of resistance on chromosome 5H. Bovill (2010) [38] detected minor QTLs on chromosome 5H in only one year from three years of research (marker P22M50-304). Later, an allele in position 110.25 cM (Rcs-qtl-5H-110.25 cM) for adult plants was described [23]. The locus on chromosome 5H identified in this study is in the interval of 1.12–1.22 cM (JHI-Hv50k-2016-277077). In this independent sampling, the marker showed 100% presence of the G allele in susceptible varieties. However, the A allele was not observed in resistant varieties. One of the reasons for this phenomenon may be that the resistance for this marker is not widespread enough, and the selected independent sampling turned out to be small.
The resistance locus was determined to be on chromosome 7H. Bilgic et al., 2005 [39] showed that seedling resistance is controlled monogenically by the Rcs5 gene on chromosome 7H, while adult plant resistance is controlled by two QTLs: the major locus on chromosome 1H and the minor locus on chromosome 7H. Among the three studied markers, one (JHI-Hv50k-2016-446766) failed to obtain results (N/A). The two remaining variables (JHI-Hv50k-2016-448898 and JHI-Hv50k-2016-451269) showed low predictability (27 and 36%, respectively).
The discovered KASP-markers can be used for selection in hybrid populations obtained using polymorphic parental forms. PCR markers that are easier to use in selection can be developed from the selected KASP-markers in the future.
Selection requires a quick assessment of the breeding material for the presence of the desired allelic resistance in elite lines, regardless of the degree of damage to plants in the field. Accelerating the breeding new varieties is one of the perspectives of this work.

Supplementary Materials

The following are available online at https://www.mdpi.com/2077-0472/10/11/505/s1. Table S1: Set of independent barley accessions for the validation of candidate diagnostic markers for the resistance to C. sativus, Table S2: Results of spot blotch resistance assessment within the Siberian spring barley cultivars collection, Table S3: Results of seedlings common root rot resistance assessment within the Siberian spring barley cultivars collection, Table S4: SNPs associated with resistance to O18.2 isolate, revealed by GLM + PCA and GLM + Q analysis, Table S5: Primers sequences.

Author Contributions

I.V.R. performed GWAS analysis, converting significant SNPs to KASP markers and drafted the manuscript. N.M.L. assessed infection response and participated in drafting the manuscript. V.M.E. participated in PCA and PLS analyzes. E.K.K. and O.S.A. carried out the experimental design, contributed to interpretation of data and to revising the manuscript critically. All authors have read and agreed to the published version of the manuscript.

Funding

This research was funded by the Russian Science Foundation, grant number 16-14-00086.

Acknowledgments

We thank ICG collection “GenAgro” (Novosibirsk, Russia) and personally Tatiana Kukoeva and Yuri Grigoryev, who formed and provided spring barley core collection. We also thank the Traitgenetics GmbH (Gatersleben, Germany) for providing service on genotyping of barley cultivars and lines using 50K Illumina SNP-chip.

Conflicts of Interest

The authors declare no conflict of interest.

Appendix A

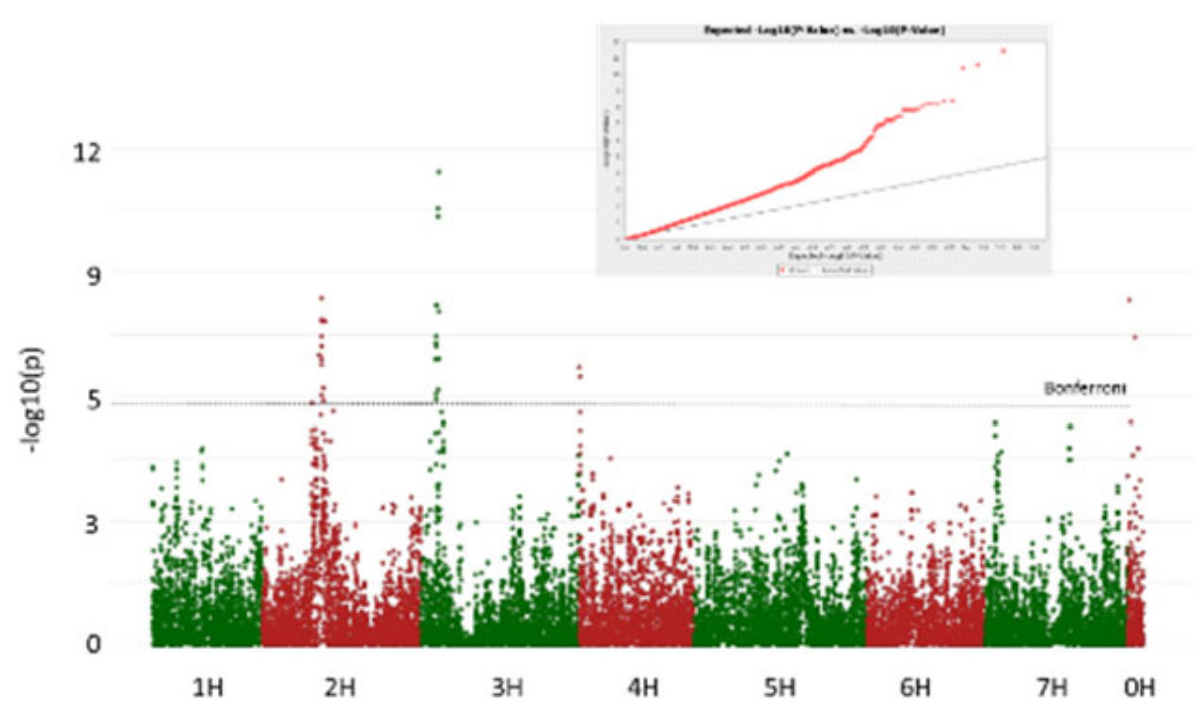
Association mapping results using different models: GLM + Q (GLM + Q-matrix to account for population structure), GLM + PCA (GLM + principal component analyses to account for population structure), MLM + K (MLM with kinship matrix). Dash line named “Bonferroni” corresponds the Bonferroni threshold. Dash line named “FDR” corresponds the FDR (false discovered rate) threshold. QQ plots (quantile-quantile plots) are given for each analysis.
Figure A1. Manhatten plot with QQ-plot for GLM model for first bicomponent data.
Agriculture 10 00505 g0a1
Figure A2. Manhatten plots QQ plots for GLM + Q model for: (a) O18.2 seedling, (b) Ch3 seedling, (c) Kh2 seedling, (d) Ch3 adult, (e) first bicomponent.
Agriculture 10 00505 g0a2aAgriculture 10 00505 g0a2b
Figure A3. Manhatten plot for GLM + PCA model with QQ plot (a) O18.2 seedling, (b) Ch3 seedling, (c) Kh2 seedling, (d) Ch3 adult, (e) first bicomponent.
Agriculture 10 00505 g0a3
Figure A4. Manhatten plot for MLM + K model with QQ plot: (a) O18.2 seedling, (b) Ch3 seedling, (c) Kh2 seedling, (d) Ch3 adult, (e) first bicomponent.
Agriculture 10 00505 g0a4

References

  1. Arabi, M.I.E.; Al-Daoude, A.; Jawhar, M. Interrelationship between spot blotch and common root rot in barley. Australas. Plant Pathol. 2006, 35, 477–479. [Google Scholar] [CrossRef]
  2. Pua, E.C.; Pelletier, R.L.; Klinck, H.R. Seedling blight, spot blotch, and common root rot in Quebec and their effect on grain yield in barley. Can. J. Plant Pathol. 1985, 7, 395–401. [Google Scholar] [CrossRef]
  3. Kutcher, H.R.; Bailey, K.L.; Rossnagel, B.G.; Legge, W.G. Heritability of common root rot and spot blotch resistance in barley. Can. J. Plant Pathol. 1994, 16, 287–294. [Google Scholar] [CrossRef]
  4. Novakazi, F.; Afanasenko, O.; Lashina, N.; Platz, G.J.; Snowdon, R.; Loskutov, I.; Ordon, F. Genome-wide association studies in a barley (Hordeum vulgare) diversity set reveal a limited number of loci for resistance to spot blotch (Bipolaris sorokiniana). Plant Breed. 2019, 139, 521–535. [Google Scholar] [CrossRef] [Green Version]
  5. Clark, R.V. Yield losses in barley cultivars caused by spot blotch. Can. J. Plant Pathol. 1979, 1, 113–117. [Google Scholar] [CrossRef]
  6. Bonman, J.M.; Bockelman, H.E.; Jackson, L.F.; Steffenson, B.J. Disease and insect resistance in cultivated barley accessions from the USDA National Small Grains Collection. Crop Sci. 2005, 45, 1271–1280. [Google Scholar] [CrossRef]
  7. Afanasenko, O.S. Plant genetic protection: Problems and prospects. Zaschita I Karantin Rastenij 2016, 1, 13–16. (In Russian) [Google Scholar]
  8. Wilcoxson, R.D.; Rasmusson, D.C.; Miles, M.R. Development of barley resistant to spot blotch and genetics of resistance. Plant Dis. 1990, 74, 207–210. [Google Scholar] [CrossRef]
  9. Roy, J.K.; Smith, K.P.; Muehlbauer, G.J.; Chao, S.; Close, T.J.; Steffenson, B.J. Association mapping of spot blotch resistance in wild barley. Mol. Breed 2010, 26, 243–256. [Google Scholar] [CrossRef] [Green Version]
  10. Leng, Y.; Wang, R.; Ali, S.; Zhao, M.; Zhong, S. Sources and genetics of spot blotch resistance to a new pathotype of Cochliobolus sativus in the USDA national small grains collection. Plant Dis. 2016, 100, 1988–1993. [Google Scholar] [CrossRef] [Green Version]
  11. Bykova, I.; Lashina, N.; Efimov, V.; Afanasenko, O.; Khlestkina, E. Identification of 50K Illumina-chip SNPs associated with resistance to spot blotch in barley. BMC Plant Biol. 2017, 17, 250. [Google Scholar] [CrossRef] [PubMed]
  12. Radyukevich, T.N.; Bondareva, L.; Kartasheva, L. Assessment of new collection samples of barley accoding to commercially valuable traits in the conditions of north-west of Russia. Perm Agrar. J. 2018, 4, 76–82. [Google Scholar] [CrossRef]
  13. Lapina, V.V.; Smolin, N.V.; Zhemchuzhina, N.S.; Ovchinnikov, A.P. Etiology of root rot and blights of barley in the southern part of the cental non-chernozam region. Bull. Altai State Agrar. Univ. 2014, 3, 34–39. [Google Scholar]
  14. Sheshegova, T.; Shchekleina, L.; Shchennikova, I.; Mart’yanova, A. Dependence of fungal infection development of seasonal dynamics of climate factors. Dostizheniya Nauk. I Tekh. APK 2017, 31, 58–61. (In Russian) [Google Scholar]
  15. Piening, L.J.; Orr, D. Effects of crop rotation on common root rot of barley. Can. J. Plant Pathol. 1988, 10, 61–65. [Google Scholar] [CrossRef]
  16. Gorobej, I. Annual feed crop disease and their phytosanitary control in the forest-steppe of Western Siberia. Ph.D. Thesis, Novosibirsk State University, Novosibirsk, Russia, 2011. [Google Scholar]
  17. Almgren, I.; Gustafsson, M.; Fält, A.S.; Lindgren, H.; Liljeroth, E. Interaction between root and leaf disease development in barley cultivars after inoculation with different isolates of Bipolaris sorokiniana. J. Phytopathol. 1999, 147, 331–337. [Google Scholar] [CrossRef]
  18. Steffenson, B.; Hayes, P.; Kleinhofs, A. Genetics of seedling and adult plant resistance to net blotch (Pyrenophora teres f. teres) and spot blotch (Cochliobolus sativus) in barley. Theor. Appl. Genet. 1996, 92, 552–558. [Google Scholar] [CrossRef]
  19. Berger, G.L.; Liu, S.; Hall, M.D.; Brooks, W.S.; Chao, S.; Muehlbauer, G.J.; Baik, B.K.; Steffenson, B.; Griffey, C.A. Marker-trait associations in Virginia Tech winter barley identified using genome-wide mapping. Theor. Appl. Genet. 2013, 126, 693–710. [Google Scholar] [CrossRef]
  20. Zhou, H.; Steffenson, B.J. Association Mapping of Septoria Speckled Leaf Blotch Resistance in U.S. Phytopathology 2013, 103, 600–609. [Google Scholar] [CrossRef] [Green Version]
  21. Gutiérrez, L.; Germán, S.; Pereyra, S.; Hayes, P.M.; Pérez, C.A.; Capettini, F.; Locatelli, A.; Berberian, N.M.; Falconi, E.E.; Estrada, R.; et al. Multi-environment multi-QTL association mapping identifies disease resistance QTL in barley germplasm from Latin America. Theor. Appl. Genet. 2015, 128, 501–516. [Google Scholar] [CrossRef]
  22. Wang, R.; Leng, Y.; Ali, S.; Wang, M.; Zhong, S. Genome-wide association mapping of spot blotch resistance to three different pathotypes of Cochliobolus sativus in the USDA barley core collection. Mol. Breed. 2017, 37, 44. [Google Scholar] [CrossRef]
  23. Gyawali, S.; Chao, S.; Vaish, S.S.; Singh, S.P.; Rehman, S.; Vishwakarma, S.R.; Verma, R.P. Genome wide association studies (GWAS) of spot blotch resistance at the seedling and the adult plant stages in a collection of spring barley. Mol. Breed. 2018, 38, 62. [Google Scholar] [CrossRef]
  24. Leng, Y.; Zhao, M.; Wang, R.; Steffenson, B.J.; Brueggeman, R.S.; Zhong, S. The gene conferring susceptibility to spot blotch caused by Cochliobolus sativus is located at the Mla locus in barley cultivar Bowman. Theor. Appl. Genet. 2018, 131, 1531–1539. [Google Scholar] [CrossRef] [PubMed]
  25. Visioni, A.; Rehman, S.; Viash, S.S.; Singh, S.P.; Vishwakarma, R.; Gyawali, S.; Al-Abdallat, A.M.; Verma, R.P.S. Genome Wide Association Mapping of Spot Blotch Resistance at Seedling and Adult Plant Stages in Barley. Front. Plant Sci. 2020. [Google Scholar] [CrossRef] [PubMed]
  26. Haas, M.; Menke, J.; Chao, S.; Steffenson, B.J. Mapping quantitative trait loci conferring resistance to a widely virulent isolate of Cochliobolus sativus in wild barley accession PI 466423. Theor. Appl. Genet. 2016, 129, 1831–1842. [Google Scholar] [CrossRef] [PubMed]
  27. Arabi, M.I.E.; Jawhar, M. Molecular and pathogenic variation identified among isolates of Cochliobolus sativus. Aust. Plant Pathol. 2007, 36, 17–21. [Google Scholar] [CrossRef]
  28. Kutcher, H.R.; Bailey, K.L.; Rossnagel, B.G.; Legge, W.G. Identification of RAPD markers for common root rot and spot blotch (Cochliobolus sativus) resistance in barley. Genome 1996, 39, 206–215. [Google Scholar] [CrossRef]
  29. Zhong, S.; Steffenson, B.J. Identification and characterization of DNA markers associated with a locus conferring virulence on barley in the plant pathogenic fungus Cochliobolus sativus. Theor. Appl. Genet. 2002, 104, 1049–1054. [Google Scholar] [CrossRef]
  30. Cantalapiedra, C.P.; Boudiar, R.; Casas, A.M.; Igartua, E.; Contreras-Moreira, B. BARLEYMAP: Physical and genetic mapping of nucleotide sequences and annotation of surrounding loci in barley. Mol. Breed. 2015, 35, 13. [Google Scholar] [CrossRef]
  31. Fetch, T.G.; Steffenson, B.J. Special Report Rating Scales for Assessing Infection Responses of Barley Infected with Cochliobolus sativus. Plant Dis. 1999, 83, 213–217. [Google Scholar] [CrossRef] [Green Version]
  32. Bradbury, P.J.; Zhang, Z.; Kroon, D.E.; Casstevens, T.M.; Ramdoss, Y.; Buckler, E.S. TASSEL: Software for association mapping of complex traits in diverse samples. Bioinformatics 2007, 23, 2633–2635. [Google Scholar] [CrossRef] [PubMed]
  33. Gower, J.C. Some distance properties of latent root and vector methods used in multivariate analysis. Biometrika 1966, 53, 325–338. [Google Scholar]
  34. Polunin, D.A.; Shtaiger, I.A.; Efimov, V.M. Development of the JACOBI 4 software package for multidimensional analysis of microchip data. Vestnik NGU 2014, 12, 90–98. (In Russian) [Google Scholar]
  35. Gutiérrez, L.; Berberian, N.; Capettini, F.; Falcioni, E.; Fros, D.; Germán, S.; Hayes, P.M.; Huerta-Espino, J.; Herrera, S.; Pereyra, S.; et al. Genome-Wide Association Mapping Identifies Disease-Resistance QTLs in Barley Germplasm from Latin America. In Advance in Barley Sciences; Springer: Dordrecht, The Netherlands, 2013; pp. 209–215. [Google Scholar]
  36. Afanasenko, O.S.; Koziakov, A.V.; Hedlay, P.E.; Lashina, N.M.; Anisimova, A.V.; Manninen, O.; Jalli, M.; Potokina, E.K. Mapping of the Loci Controlling the Resistance to Pyrenophora teres f. teres and Cochliobolus sativus in two Double Haploid Barley Populations. Russ. J. Genet. Appl. Res. 2015, 5, 242–253. [Google Scholar] [CrossRef]
  37. Grewal, T.S.; Rossnagel, B.G.; Scoles, G.J. Mapping quantitative trait loci associated with spot blotch and net blotch resistance in a doubled-haploid barley population. Mol. Breed. 2012, 30, 267–279. [Google Scholar] [CrossRef]
  38. Bovill, J.; Lehmensiek, A.; Sutherland, M.W.; Platz, G.J.; Usher, T.; Franckowiak, J.; Mace, E. Mapping spot blotch resistance genes in four barley populations. Mol. Breed. 2010, 26, 653–666. [Google Scholar] [CrossRef] [Green Version]
  39. Bilgic, H.; Steffenson, B.J.; Hayes, P.M. Comprehensive genetic analyses reveal differential expression of spot blotch resistance in four populations of barle. Theor. Appl. Genet. 2005, 111, 1238–1250. [Google Scholar] [CrossRef]
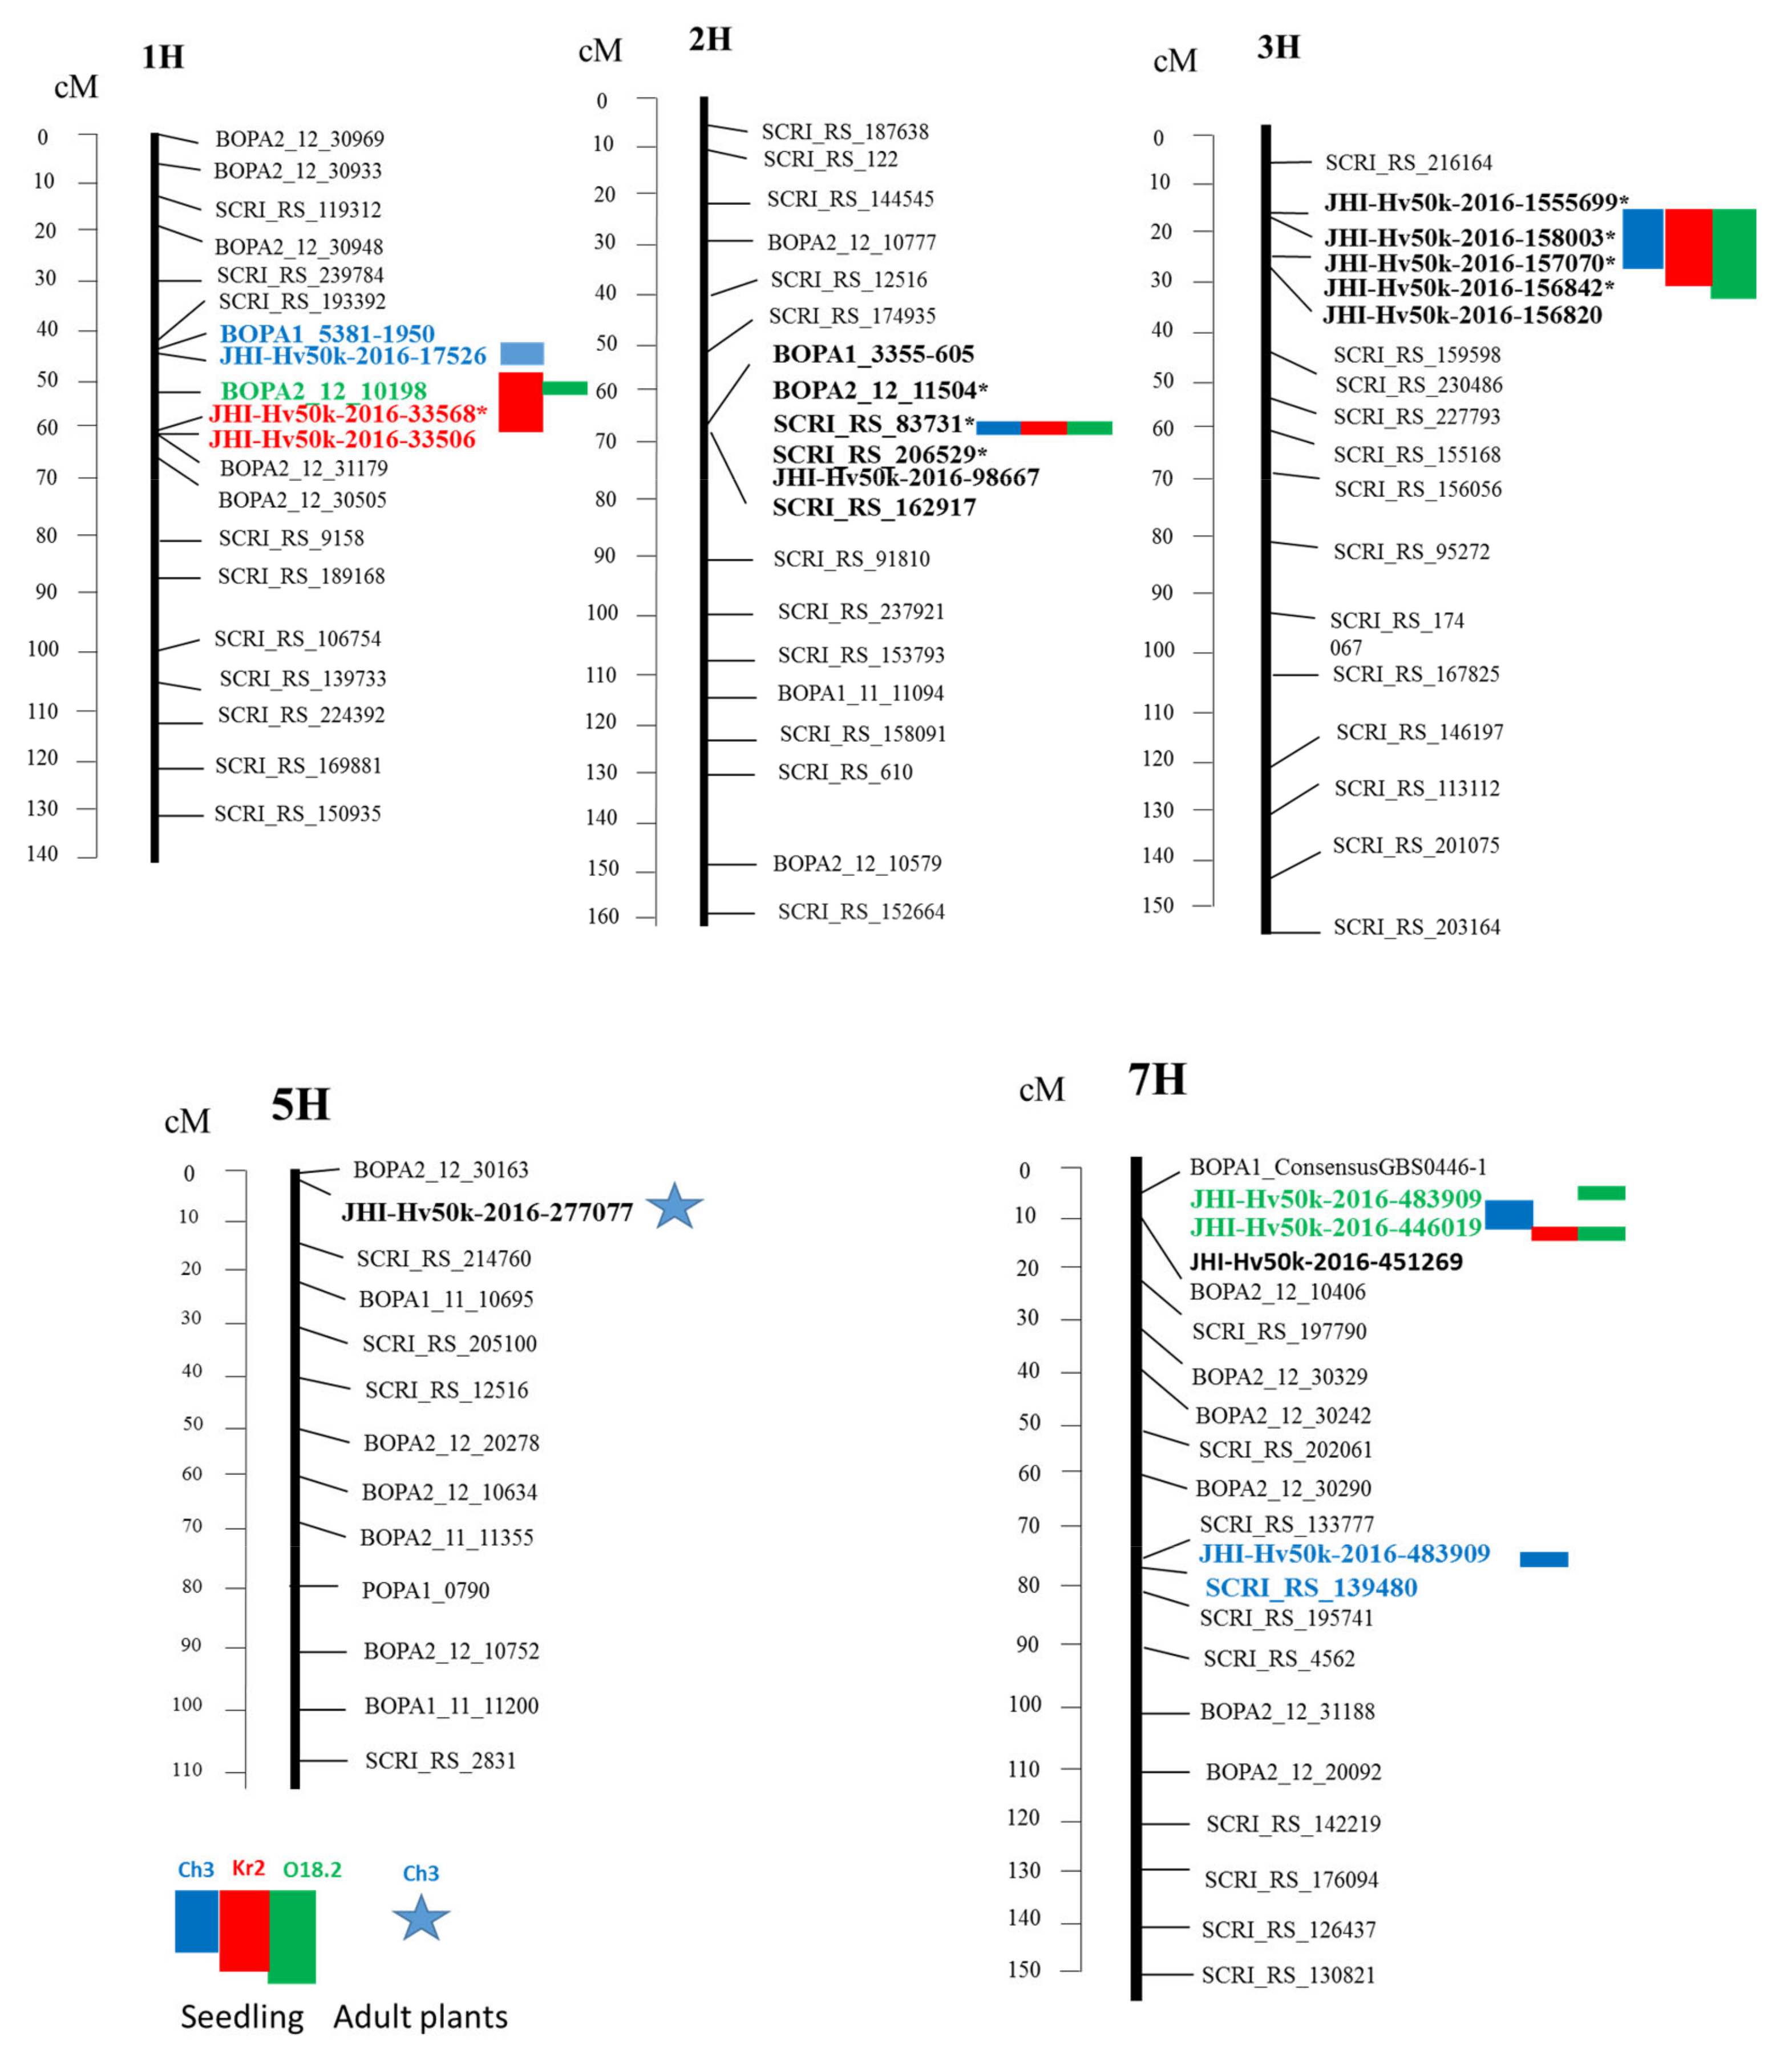
Figure 1. Location of genome fragments on five chromosomes (1H, 2H, 3H, 5H and 7H) associated with resistance to spot blotch by testing different isolates: Kr2 (red), Ch3 (blue), and O18.2 (green); and different phases: seedling (rectangle) and adult plant (star). Black bold markers are markers found with all isolates. * markers were found in previous research (Bykova et al., 2017).
Agriculture 10 00505 g001
Figure 2. Correlation between genotype and phenotype data. Black points are investigated varieties. The letter in brackets means the type of resistance to one isolate for seedling and adult plants. The resistant varieties were Biom, G-21219, Omsky golozyorny 2, Svetik, Severny, Barkhatny, Kolchan, and B-1; the susceptible varieties were Abyssinia, Alag-Erdene, Arna, Avalon, Golozyorny 1, Ilmen, Jngve, Krasnoyarsky 1, Kuryer, L-1, Melius, Merit 57, Mestny Dagestanian, Mestny Ethiopian, Moskovsky 121, Mutant 68, NGB 122412, Nosovsky 11, Nutans 970, Omsky golozyorny 1, Orenburgsky kormovoy, Prikumsky 14, Reyd, Sasha, Symbat, Taganay, Tatum, Temp, Vikont, and Viner mutant.
Agriculture 10 00505 g002
Figure 3. KASP genotyping results with the marker JHI-Hv50k-2016-156842. The red group denotes the G allele, and the blue group denotes the A allele.
Agriculture 10 00505 g003
Table 1. Pearson correlation analysis between resistance to spot blotch and common root rot, as well as between resistance to spot blotch between seedlings and adult plants.
p-ValueSpot Blotch (Kr2) SeedlingSpot Blotch (Ch3) SeedlingSpot Blotch (O18.2) SeedlingSpot Blotch (Ch3) Adult Root Rot (O18.2) Seedling
Correlation
Spot blotch (Kr2) seedling-8.83 × 10−112.82 × 10−141.50 × 10−38.88 × 10−3
Spot blotch (Ch3) seedling0.61-2.27 × 10−169.80 × 10−095.71 × 10⁻³
Spot blotch (O18.2) Seedling0.690.73-1.57 × 10−44.86 × 10−3
Spot blotch (Ch3) Adult0.340.570.43-5.55 × 10⁻⁴
Root rot (O18.2) Seedling0.230.250.220.28-
Table 2. Correlation coefficients of investigated traits with all bi-components. Strong correlation is in bold.
Trait1 Phen1 Gen2 Phen2 Gen3 Phen3 Gen
Spot blotch (Kr2) seedling0.8140.545−0.161−0.1510.2430.25
Spot blotch (Ch3) seedling0.8960.5820.2220.082−0.101−0.105
Spot blotch (O18.2) seedling0.8940.639−0.103−0.121−0.0320.034
Spot blotch (Ch3) Adult0.6460.3590.70.328−0.237−0.229
Table 3. KASP markers.
Name of SNPChrPositionInterval (cM)The Sequence Structure Containing SNP
JHI-Hv50k-2016-33568144689329750–61.2ATTACATTGGATTACTAATTCAGGCCTCGTTCGTTCGACAGGGATTTAGA[A/C]GGGGTTTGGCAGGGATTGAGGTGGATATAATTCCCTACAAGTCATATTCC
JHI-Hv50k-2016-15684231755918918.72–26.18CGTGGTTGCAACAATACTGCTTATCTACGGGAGAGCTTCACGGACAAATC[A/G]CTCCTGGATAGGCTTCATTGTTTCAATGCATTTCCTTTGGGTGGCACTGA
JHI-Hv50k-2016-157070317888495GTTCGATTTGATTCTTTGGGTCGGGTTAATACATATGATTGAAATGTGTT[C/G]GTGCTGACGCTTGTCCTGATCATGTCCATGCAGGTTCATCAACCTGCGGC
JHI-Hv50k-2016-156820317557023TCCACTGTCATCTTTGACAATGCCAGCCTCTCGAGTACCACCTGTAAACC[C/T]CATTCAACGGAATACATGTCAAATGAATGGTCGTCTGGACGGAGAGGATT
JHI-Hv50k-2016-157182317954351TGGACTTTTTTTTGCTTGTGGTTTGGGTGGACAGAATCTGCACAAACAAA[A/T]GTTTTGTCATTTATCATGTATAAAATTTTGTGAGTGTTCTGGTCAACGGG
JHI-Hv50k-2016-156833317558292TTGCTCTTGCAATGGAGGCCATCACTCACCAACAACCTTGACACAAACAA[A/T]AGCAGCCCGGTGCATTTCACCGCATCCGACGGCGACTGCTCGATCATCGA
JHI-Hv50k-2016-15556931525632918.72TCTTCCTGTGTTTACGATCACTGTCGCTCTCTGATTCACTATCAGATTCC[A/G]AGGAAGAATAGCTTCGCCTCCTGTGCTTTCTTGACTTGAGCTTCTTCTCC
JHI-Hv50k-2016-27707755462421.12–1.22GCTGCCAACTCTTCTTTTTGTGCATTCCTTTTGTCCGCGTCCTATTAAC[G/A]AGTGGTTTGATGTGCAGATGTTGGCCAAGAAAGTCGACACTTTAACAAAG
JHI-Hv50k-2016-446766**7108671017.52–15.44TATTCGCTGAAACCTGCTTTCATGAAGATGTCGCTCCAGTCCTTTTCATC[A/C]CGCTGGCGGCCTCTCGTCATCACCAGCTTCAACATATCAACCAGGTGATG
JHI-Hv50k-2016-448898713541902AAGAACCAGTTCACTGCCGAGTAAGTTCCCAATACCCCGAATATTCTGCG[T/C]GGGCCAATAAGTCCCCATATGACGGACGCATCGTAGAACACATGATCAGT
JHI-Hv50k-2016-451269716899719GAAAAAAAGTTCATTGCATGATAAAGAACGGCCAGGAACCAGTAATTAGG[A/T]CTCCTTGGTCAAGAATTATCATACCTTGGCGCCCTCACCTCCTATGAAGA
Table 4. Correspondence of the allelic state of markers and the phenotypic reactions to infection with spot blotch.
SNP NamesChromosomeAllelesResistant VarietiesNucleotide Prediction Percentage in Resistant VarietiesSusceptible VarietiesNucleotide Prediction Percentage in Susceptible Varieties
JHI-Hv50k-2016-335681HCC655%555%
AA56
CA--
JHI-Hv50k-2016-1568423HGG373%11100%
AA80
GA--
JHI-Hv50k-2016-1570703HGG545%11100%
CC40
GC--
JHI-Hv50k-2016-1568203HTT767%272%
AA38
TA-1
JHI-Hv50k-2016-1571823HTT767%272%
AA38
TA-1
JHI-Hv50k-2016-1568333HTT987%455%
AA26
TA--
JHI-Hv50k-2016-1555693HGG545%10100%
AA40
GA21
JHI-Hv50k-2016-2770775HAA00%0100%
GG1011
AG--
JHI-Hv50k-2016-4488987HTT827%11100%
CC30
TC--
JHI-Hv50k-2016-4512697HAA636%873%
TT43
TA1-
Publisher’s Note: MDPI stays neutral with regard to jurisdictional claims in published maps and institutional affiliations.