Article

Intensive Rain Hampers the Effectiveness of Nitrification Inhibition in Controlling N2O Emissions from Dairy Slurry-Fertilized Soils

1
Institute of Agricultural and Environmental Sciences, Estonian University of Life Sciences, 51006 Tartu, Estonia
2
Institute of Ecology and Earth Sciences, University of Tartu, 51014 Tartu, Estonia
*
Author to whom correspondence should be addressed.
Agriculture 2020, 10(11), 497; https://doi.org/10.3390/agriculture10110497
Submission received: 3 September 2020 / Revised: 19 October 2020 / Accepted: 21 October 2020 / Published: 24 October 2020
(This article belongs to the Special Issue Cycling of Carbon, Nutrients, and Greenhouse Gases in Agro-Ecosystems)

Abstract

:
Nitrification inhibitors have been proposed as a tool to mitigate nitrous oxide (N2O) emissions from agriculture, which are caused mainly by fertilization. The nitrification inhibitor 3,4-Dimethylpyrazole phosphate (DMPP) was tested in a winter rapeseed field after dairy slurry application in Central Estonia. N2O emissions were monitored using the closed chamber method. Soil and leachate chemical parameters were also analyzed. N2O emissions increased from pre-slurry application values of 316 and 264 µg m−2 h−1 for the control and treatment plot, respectively, to maximum values of 3130.71 and 4834 µg m−2 h−1, with cumulative emissions during the study period of 12.30 kg ha−1 for the control plot and 17.70 kg ha−1 for the treatment plot. The intense precipitation period that began with the application of the slurry resulted in changes in soil moisture and water-filled pore space (WFPS), modifying the nitrification/denitrification balance. Positive significant correlations (p = 0.016 and p = 0.037, for the control and treatment plot, respectively) were found between N2O fluxes and WFPS. Future studies should consider the role of nitrifier and denitrifier communities in order to better assess in-field nitrification inhibitor effectiveness.

1. Introduction

Climate change is one of the most pressing environmental issues of our time. The urge to reduce emissions of greenhouse gasses (GHG) such as nitrous oxide (N2O) is generally acknowledged [1]. Although N2O only accounts for approximately 6% of total annual anthropogenic GHG emissions, while carbon dioxide (CO2) represents 76%, N2O has a global warming potential 265 times (over 100 year period) that of CO2 [2]. Moreover, it currently constitutes the most important ozone-depleting substance [3].
Anthropogenic sources represent almost 40% of global N2O emissions, of which agriculture accounts for 67–80% of emissions [4]. The main reason that explains the contribution of agriculture to N2O emissions is fertilization, both organic and inorganic, as well as N-fixing crops [4,5]. N2O emissions from the soil are the product of three main processes: nitrification, denitrification, and nitrifier denitrification [6,7,8,9,10,11]. Nitrification is the aerobic oxidation of ammonia or ammonium into nitrates, and it is divided into two steps: the first is the oxidation of ammonium to nitrites, and the second is the oxidation of nitrites to nitrates. Nitrification is carried out by ammonia-oxidizing bacteria (AOB) and ammonia-oxidizing archaea (AOA) [12]. Although recent studies have suggested that AOA populations are more significant than those of AOB [13,14], AOB still remain accepted as the main cause of nitrification [12,15,16,17,18,19], especially in N-rich soils [20], and specifically after ammonia application [17]. The main bacterial genera responsible for each step of nitrification in agricultural soils are Nitrosomonas, especially in N-amended soils [8,21,22], and Nitrobacter [23,24], respectively. Denitrification is the anaerobic reduction of nitrates to dinitrogen, with nitrites, nitric oxide, and nitrous oxide as intermediate products [25]. The main key factors regulating nitrification and denitrification in soils are soil water content, temperature, pH, soil ammonium and nitrate content, and carbon (C) availability [26,27]. Low pH limits both nitrification and denitrification, although nitrification is more sensitive to soil acidity, and will be limited by values below 4.5, while denitrification can still take place at values as low as 3.5 [28,29,30,31]. Ammonium (NH4+) and nitrates (NO3) are the source of nutrients for nitrification and denitrification, respectively [32]. NH4+ availability is the most important factor conditioning autotrophic nitrification [6], while NO3 and C, which are the energy source for denitrifier organisms, are essential for denitrification [30,33]. The water-filled pore space (WFPS) is used as a measure of soil moisture that considers not only soil water content but also soil porosity [10]. As nitrification is an aerobic process and denitrification is anaerobic, their prevalence is directly controlled by oxygen availability in the soil; thus, WFPS is commonly used to estimate the prevalence of each of these processes [34,35,36,37], as well as their importance.
Nitrogen is an essential element for plants, as it is a part of the plant proteins, DNA, and chlorophyll, constituting the most determinant mineral element of crop yield obtained from the soil by plants [38]. Plants are able to use N in the form of NO3 and NH4+, but NO3 is characterized by a low soil retention [39], increasing the chances of losses through leaching. Reducing the production of NO3 will reduce nitrogen losses beyond the root’s reach due to leaching [40]. Reducing the oxidation of NH4+ to NO3 will also indirectly reduce denitrification, as there will be no additional source of NO3 for denitrification, and therefore, losses through N2O and N2 from denitrification will be also reduced. Nitrification inhibitors (NIs) have been proposed as a tool to reduce nitrogen losses from different ecosystems by inhibiting the nitrification process [41]. By slowing down nitrification, NIs stabilize nitrogen in the soil in the form of NH4+, which can be then gradually absorbed by plants [42]. Different chemical compounds are commercially distributed as nitrification inhibitors, although the most commonly used and studied in the last years are dicyandiamide (DCD) and 3,4-dimethylpyrazole phosphate (DMPP). Their effectiveness has been assessed profusely; however, DCD has attracted the most attention (Table S1, [43,44,45]), with the studies dedicated to DMPP being more scarce when considering only croplands. Nevertheless, in recent years, increasing attention has been focused on DMPP due to it not showing effects on non-target soil microorganisms. It has also been reported to be very effective for inhibiting the activity of ammonia-oxidizing bacteria (AOB) and increasing nitrogen use efficiency (NUE) and crop yield [46]. A meta-analysis by Yang et al. [45] established an average reduction of N2O emissions of 47.6% for DMPP, compared to 44.7% for DCD. The effect of the nitrification inhibitor DMPP is based on the delay of the oxidation of ammonium to nitrite (and subsequently to nitrate), by slowing down the activity of the chemoautotrophic bacteria of the genus Nitrosomonas spp. [47,48,49]. Both DMPP and DCD, as well as other NIs including Nitrapyrin and 3,4-dimethylpyrazole succinic (DMPSA), slow down the oxidation of NH4+ to NO2 by inhibiting the activity of the enzyme ammonia monooxygenase (AMO) [41,50]. Although the specific mechanism by which DMPP inhibits the activity is not clear, Ruser and Schulz [41] suggested that the inhibition of nitrification occurs via Cu chelation, reducing the availability of Cu, which is a requirement of ammonia monooxygenase [51,52].
The duration of the effect of manure application on N2O emissions depends on several factors, but it is mainly controlled by precipitation and temperature [53,54]. Increases in N2O emissions after nitrogen (N) application can last for about 6 weeks [55], with 77% of N2O emissions taking place in the first 4 weeks after N fertilization in grasslands [26] and 67% of the total N2O emissions taking place in the 7 weeks after slurry application [56]. On the other hand, the expected effect of DMPP on Nitrosomonas lasts between 6–8 weeks depending mainly on soil temperature and moisture [22].
Rapeseed (Brassica napus L.) is a key crop because it is cultivated for seed oil for human consumption, with animal feed as a byproduct, but also as an energy crop. It is currently the primary raw material for biodiesel production in the EU, accounting for 45% of the total production in 2017 [57]. While rapeseed has been extensively grown for biodiesel production, uncertainties exist regarding the real impact of rapeseed cultivation on climate warming [58]. Astover et al. [59] estimated, based on the ‘BioGrace greenhouse gas calculation tool version 4d’ [60], that rapeseed cultivation had the highest potential emissions per yield, both for global GHG and specifically for N2O emissions, for Estonia. In other studies, significant N2O emissions from rapeseed fields have also been measured [27,61]. Also, in order to fulfill the reduction requirements of the European Green Deal, establishing no net emissions of greenhouse gases by 2050 [62], it is essential to minimize emissions from the production of materials used as biodiesel. For instance, the Revised Renewable Energy Directive (2018/2001/EU) [63] on the promotion of the use of energy from renewable sources requires a reduction of GHG emissions from the use of rapeseed biodiesel of at least 52%. However, Pehnelt and Vietze [58] estimated reductions of GHG emissions for different scenarios smaller than 35% with the use of rapeseed biofuels, highlighting the need to reduce emissions from rapeseed production.
This experiment aimed to assess the effectiveness of the nitrification inhibitor DMPP on reducing N2O fluxes in acid soils in a winter rapeseed field in Central Estonia. The hypothesis was that the application of DMPP would reduce N2O emissions, slowing down the oxidation of NH4+ into NO3 thus increasing the availability of NH4+ in soil for plants.

2. Materials and Methods

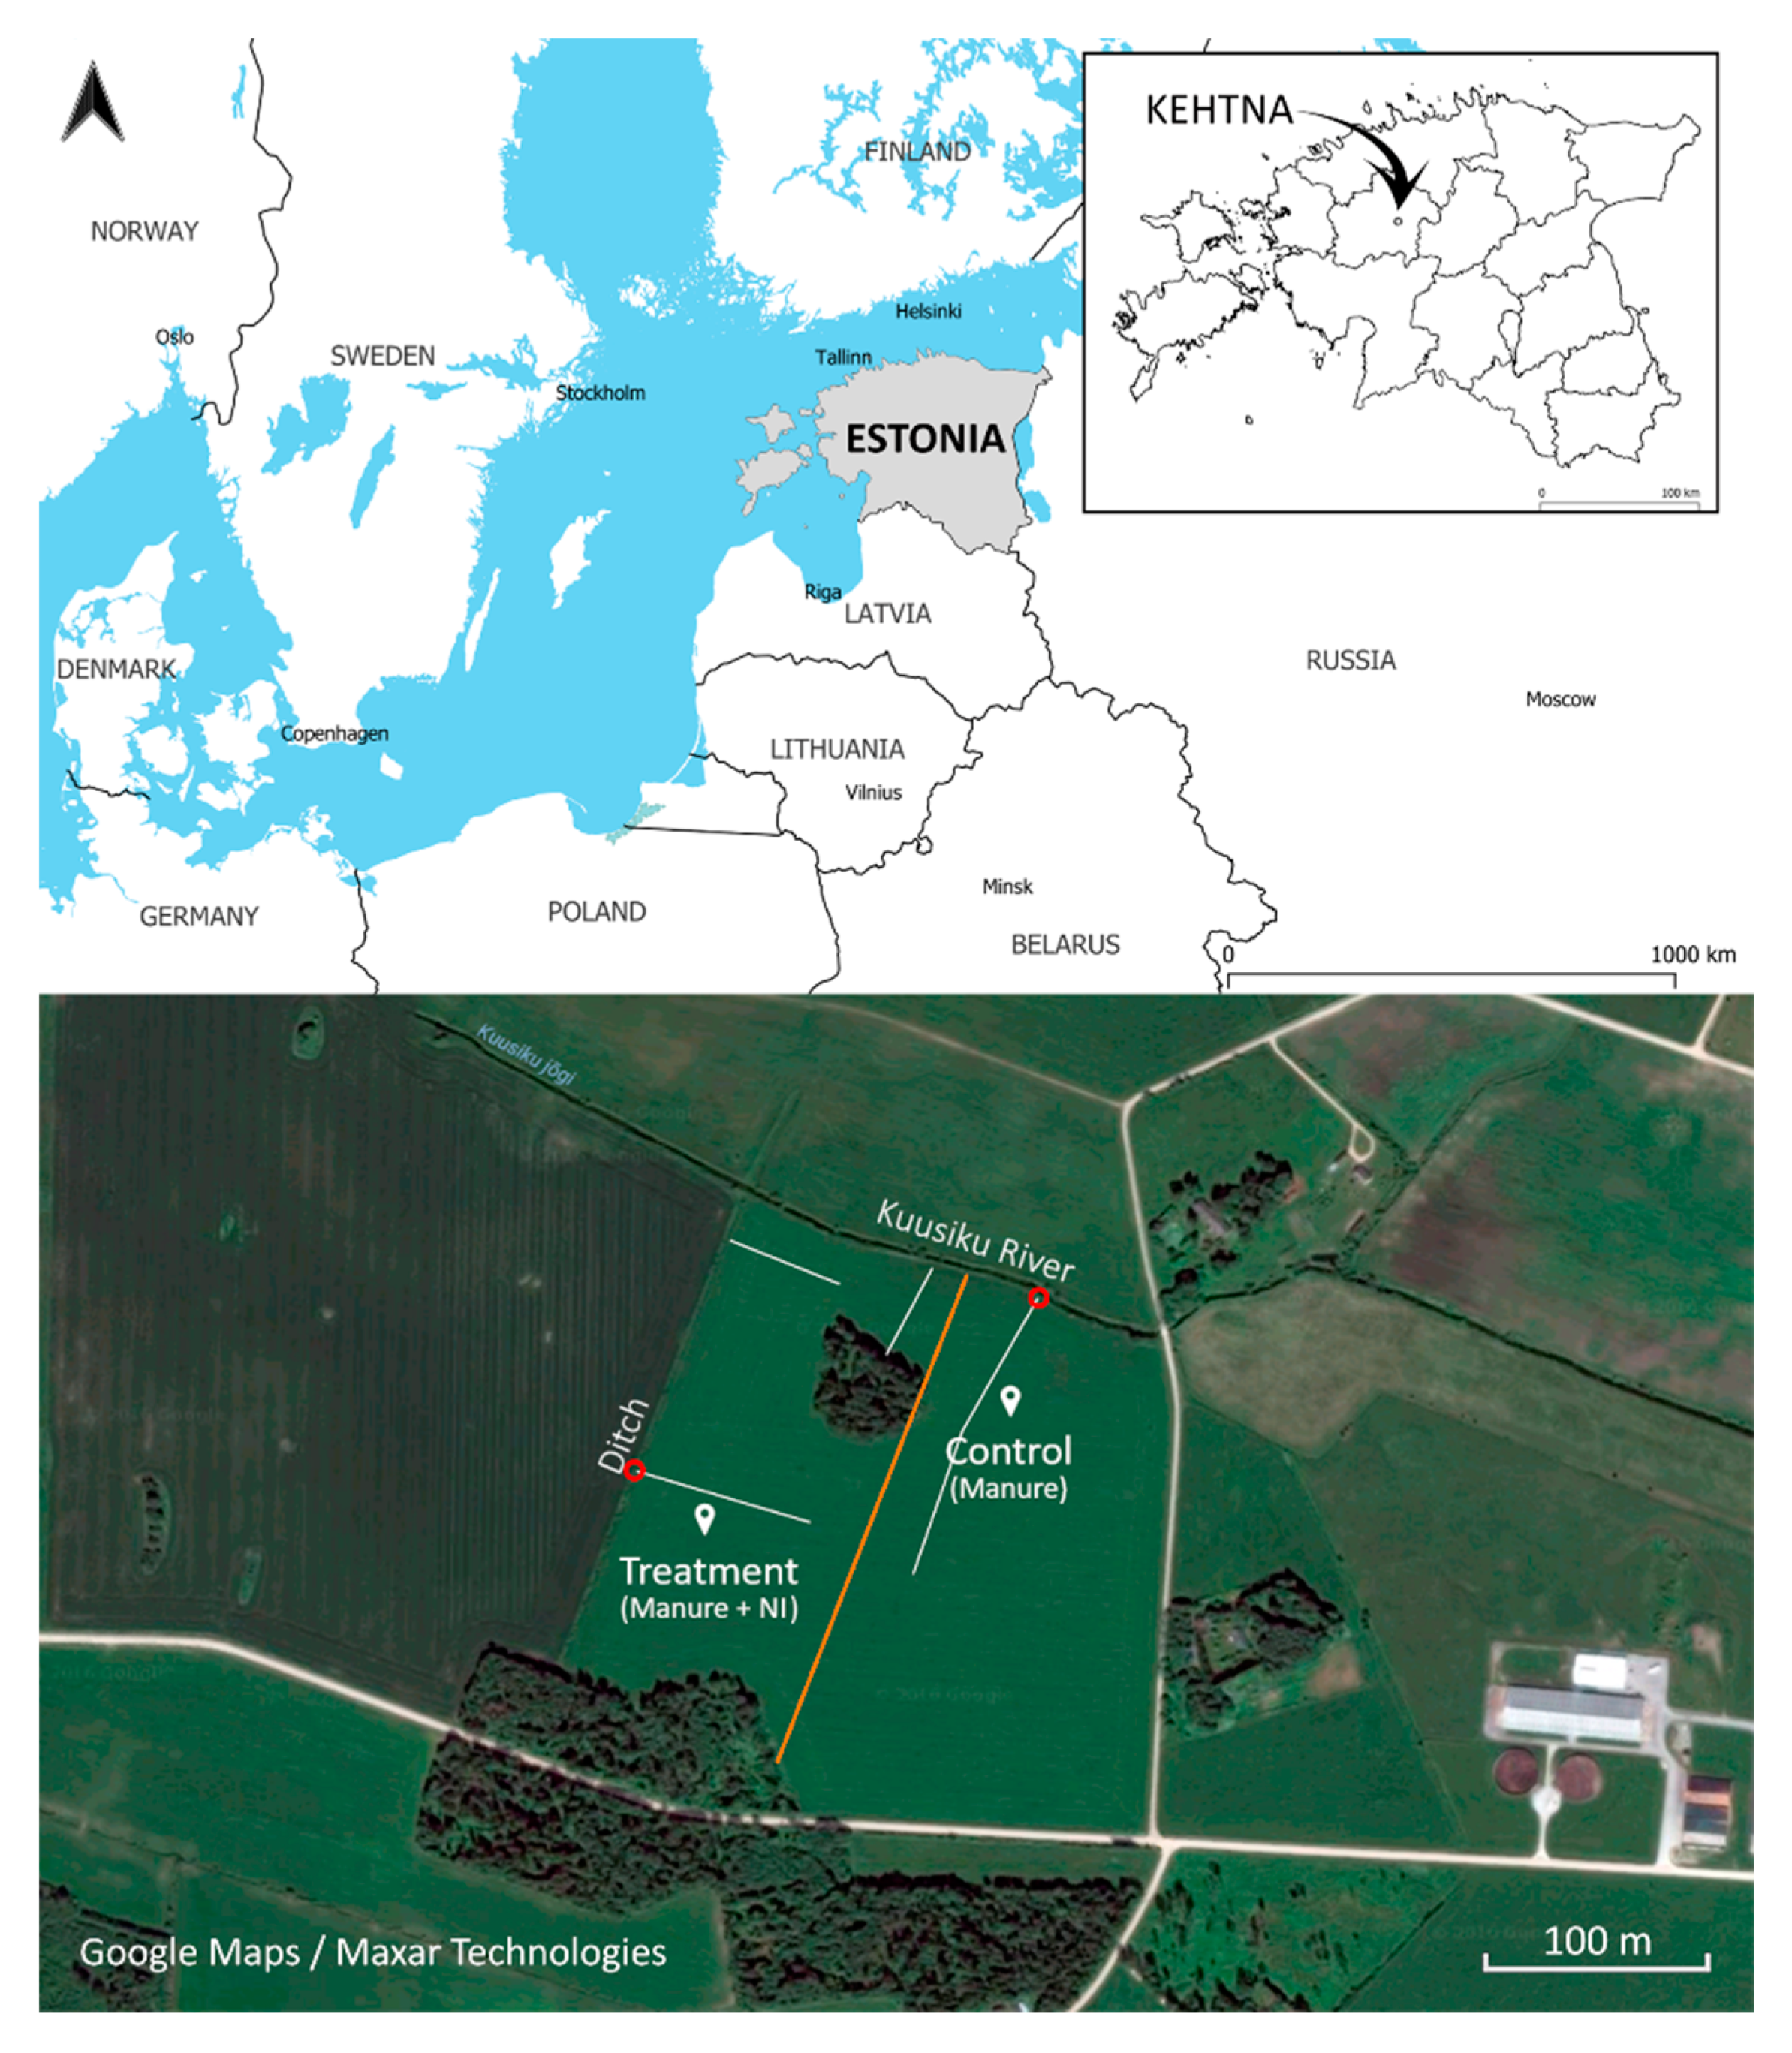
2.1. Study Site and Experiment Set-Up

The experimental site is located in the central part of Estonia (Kehtna parish, Rapla county; 58°55′22″ N 24°50′52″ E; Figure 1). The field has a total size of 18.13 ha and the type of soil is sandy-loam Gleysol (FAO, 2014) (Republic of Estonia Land Board’s Geoportal, https://xgis.maaamet.ee/maps/XGis). The field had been sown the previous year with a grassland mix with a 20% of N-fixing species (Tetraploid Trifolium pratense, 10%; Diploid Trifolium pratense, 5%; Trifolium repens, 5%; Lolium perenne, 35%; Dactylis glomerata, 10%; Festulolium, 20%; Festuca pratensis, 15%; Older Seeds OÜ, Saku, Estonia). In 1964, a drainage system was installed in the field. The drainage system (Figure 1) can be divided according to the direction of the flow: the western section of the field pours into the ditch bordering the west side of the field, while the central and north sections pour to the Kuusiku river in the north. In our study, the field was divided into two different plots: a control, and a treatment plot, with five replications (chambers) each. Soil chemical parameters for both plots are shown in Table 1. The division was based on the direction of the water leaching, allowing us to collect leaching samples from both plots separately. Winter rapeseed (Brassica napus ‘DK Sequoia’) was sown in both plots on the 10th of August of 2016 and harvested on the 26th of August 2017. On the 6th of August of 2016, a dairy slurry with a pH of 8.02 and a content of NH4+ of 6132 mg kg−1 (Table 2) was applied to the field at a rate of 30 t ha−1. The slurry application was done via injection followed by the use of a rotary harrow. On the control plot, the slurry was applied alone; on the treatment plot, the slurry was mixed with the nitrification inhibitor DMPP (BASF, Ludwigshafen, Germany), at a rate of 3 L ha−1. The duration of the study was 50 days, a period covering both the period of increased N2O emissions after slurry application and of the expected action of DMPP.

2.2. Environmental Parameters

At both study plots, the soil temperature was measured at four depths 5, 10, 20, and 30 cm with a four-channel PT1000 temperature sensors (COMET SYSTEM, s.r.o, Rožnov pod Radhoštěm, Czech Republic). Soil moisture and electrical conductivity were measured with a GS3 sensor connected to a ProCheck handheld reader (Decagon Devices, Pullman, WA, USA). Field soil parameters were measured for each plot on all GHG sampling dates.
Water-filled pore space (WFPS) was calculated using the equation [64]:
W F P S   ( % ) = 100 · V W C T P
where VWC is volumetric soil moisture content (m3 m−3), and TP is total porosity (%) calculated as [65]:
T P = 1   B D D p
where BD is bulk density, and Dp particle density (both in g cm−3).
Climatological data (atmospheric pressure, precipitation, humidity, sunshine, air temperature, air temperature at 2 cm of height, soil temperature, minimum soil temperature, maximum soil temperature, visibility and wind direction) were obtained from the Kuusiku weather station (WMO code 26134, 58°58′23.3″ N 24°44′02.4″ E, Estonian Weather Service, https://www.ilmateenistus.ee/ilmateenistus/vaatlusvork/kuusiku-meteoroloogiajaam/), which is located approximately eleven kilometers from the experiment location.

2.3. Soil and Leachate Sampling and Analysis

Soil and leachate samples were collected during the study period. Soil samples from a depth of 0–20 cm were taken in three replications, each one a mix of 10 different randomly collected samples with the aid of a soil probe, from each plot in a 2-m radius around the chambers. Leaching water was collected from the end of the drainage pipes (Figure 1). Soil and leaching water samples were taken initially in a 2-day interval after the application of the slurry, and with smaller frequency afterward. Sampling of leaching water was limited by the water level rising higher than the drainage pipes ends, although it was possible to collect 8 days samples during the first 10 days.
Soil dry matter (DM) was measured by drying soil samples at 105 °C for 16 h. Soil organic matter (OM) was determined by loss-upon-ignition following heating at 500 °C for four hours. Soil pH was determined in a 2.5:1 KCl soil (v:w) suspension. Soil NO3-N and NH4+-N were determined in 2M KCl extract of soil by a flow injection analyzer FIAStar 5000 (Foss Tecator AB, Höganäs, Sweden). Soil available P and K were extracted with ammonium lactate (0.1 M NH4CH3CH(OH)COO + 0.4 M CH3COOH, pH 3.75) [66]. Available P in the extraction solution was determined by flow injection analysis by Tecator ASTN 9/84. Available K was determined from the same solution by the flame photometric method. Total carbon (C), nitrogen (N), and sulphur (S) were determined using a vario MAX CNS Element Analyzer (Elementar Analysensysteme GmbH, Langenselbold, Germany). Leaching water NO3-N and NH4+-N were measured via a flow injection analyzer FIAStar 5000 (Foss Tecator AB, Höganäs, Sweden). Dissolved organic carbon (DOC) concentration was determined according to the EVS-EN 1484 standard with a VARIO TOC analyzer (Elementar Analysensysteme GmbH, Langenselbold, Germany) and dissolved nitrogen (DN) concentration according to the EVS-EN 12260 standard. Leaching soil water DOC and DN concentrations were measured according to the same standards after extraction with H2O.
Slurry DM was determined by oven drying for 2 h at 135 °C [67] and organic matter by loss on ignition [68]. Phosphorus was determined by Stannous Chloride and Ca by the o-Cresolphthalein Complexone method, in Kjeldahl Digest by Fiastar 5000; K by the Flame Photometric method; Mg by Titan Yellow method by Fiastar 5000 ASTN 90/92 and NH4-N using flow injection analyses by Tecator ASN 65-32/84 [69]. Total C, N, and S were determined using a vario MAX CNS Element Analyzer (Elementar Analysensysteme GmbH, Langenselbold, Germany). For the determination of total soluble nitrogen (DN), total soluble carbon (DC), total soluble organic carbon (TOC), and total soluble inorganic carbon (DIC) content in the slurry, H2O was used as extractant with solution in a 1:10 ratio (m/v), extracted for 2 h, and then filtered through a 0.45 µm filter. TOC was determined according to the standard EN 1484:1997, with the instrument VARIO TOC (Elementar Analysensysteme GmbH, Langenselbold, Germany, temperature 850 °C). DN was determined according to the standard EN 12260. Oxidation of the sample containing nitrogen via catalytic combustion occurred in an oxygen atmosphere at >700 °C with nitrogen oxides. The quantification of the nitrogen concentration was carried out by chemiluminescence detection, using VARIO TOC with HORIBA APNA-370 chemiluminescence detector. Dissolved organic, inorganic, total carbon content, and dissolved nitrogen content were expressed on the basis of oven-dried soil. The limit of quantitation for DC, TOC, and DIC was 20 mg kg−1 and for DN 5 mg kg−1.

2.4. Flux Measurements

Nitrous oxide flux measurements were carried out with the closed chamber method [70,71], using white opaque PVC chambers, with a height of 40 cm, a diameter of the collar of 50 cm, and a total headspace volume of 65.5 L. Five chambers were used in each of the plots. Collars were installed on-site 24 h before the first measurement to allow system stabilization. The N2O flux was measured on 17 occasions from the 5th of August until the 22nd of September of 2016. The N2O flux measurements were carried out in a higher frequency during the first two weeks after the application of the slurry, and then with decreasing frequency, becoming weekly for the rest of the period. This was done to capture the expected higher flux variability after the slurry application. Gas samples for N2O measurement were collected over an hour in 20 min intervals (0, 20, 40, 60 min) into 20-mL pre-evacuated (0.04 mbar) bottles.
The nitrous oxide concentration in the collected air samples was determined using the Shimadzu GC-2014 gas chromatography system equipped with ECD, TCD, and FID sensors. The system is based on the automated gas chromatographic system described by Loftfield et al. [72] and located in the lab of the Department of Geography of the Institute of Ecology and Earth Sciences at the University of Tartu in Estonia.
The N2O flux was calculated from the slope of the least-squares linear regression of the N2O concentrations versus time (dC/dt), using the equation [73]:
f = d C d t ·   V A
where f is the gas flux of N2O (µg m−2 h−1); C is the N2O concentration in the chamber air (µg m−3); t is time (h); V is the volume (m3); and A is the surface area (m2) entailed by the chamber.
The adjusted R2 value of the linear regression was used to filter the data, discarding one of the observations if necessary, using the remaining three [73] for flux calculation. Minimum R2 values of 0.90 and 0.99 were used to check the linearity of the measurements for four (n = 4) and three (n = 3) measurement points, respectively. A chamber session was discarded when the R2 value did not meet the criteria, but always leaving a minimum of three chamber measurements.
Cumulative emissions were estimated by the time-integration of daily fluxes after gap-filling by linear interpolation between sampling points [74].

2.5. Statistical Analysis

All statistical analyses were carried out using the R programming language [75]. No additional package was required for the statistical analysis. Unless stated otherwise, the Wilcoxon signed-rank test was used to compare treatments, and the Spearman’s rank correlation to analyze correlations between N2O flux and soil and leachate chemical parameters and environmental data. Box-and-whisker plots are presented following the conventions described by Tukey [76].

3. Results

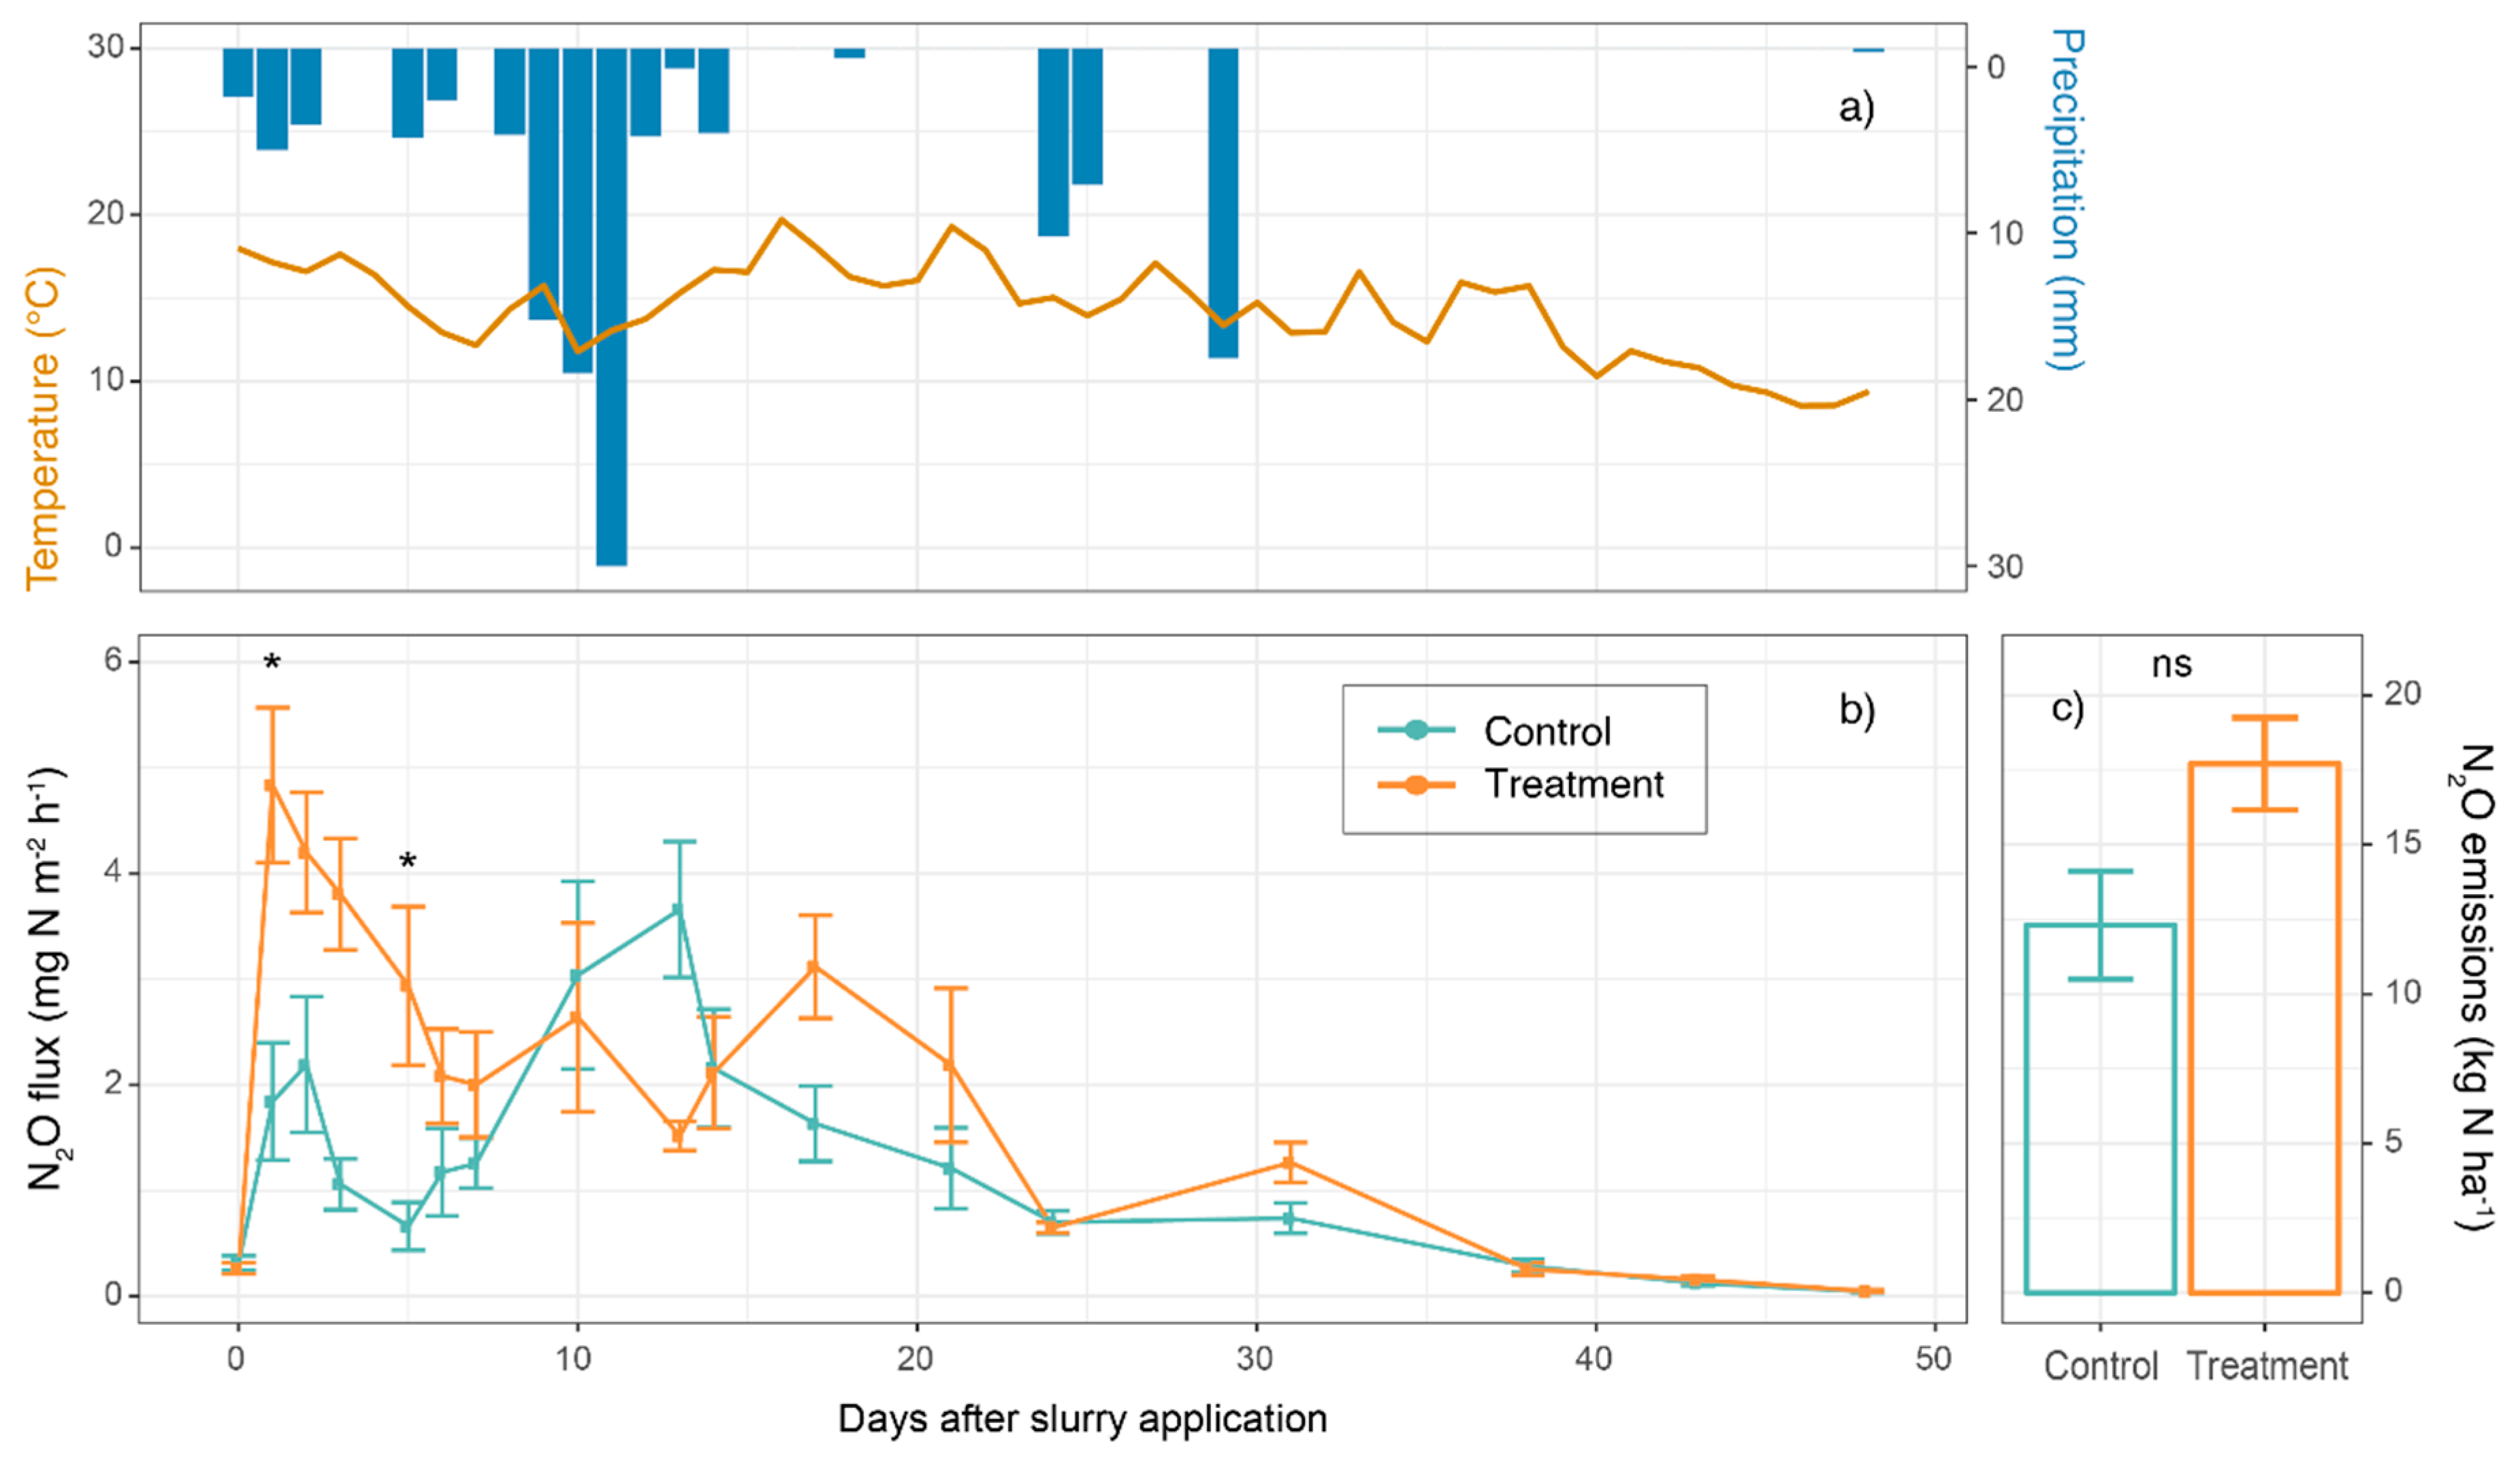
3.1. Nitrous Oxide Flux

Nitrous oxide fluxes raised from the initial non-significantly different values of 316 and 265 µg m−2 h−1 for the control and the treatment plot, respectively, to 4834 ± 733.20 µg m−2 h−1 in the treatment plot and 1843 ± 554.53 µg m−2 h−1 in the control plot, one day after the slurry application (Figure 2). Fluxes from the treatment plot were significantly higher on two of the four-day periods following the application of the slurry. Fluxes were higher in the control plot between the 10th and the 14th day, and after that were again higher in the treatment plot, but differences were not significant. The maximum flux, 3130.71. ± 725.74 µg m−2 h−1, was reached in the control plot on the 13th day. At the end of the studied period, fluxes had stabilized around similar values (43 and 50 µg m−2 h−1 for control and treatment, respectively), and no significant differences between the plots. The total cumulative emissions during the study period were 12.30 ± 1.81 kg ha−1 for the control plot and 17.70 ± 1.54 kg ha−1 for the treatment plot. The final cumulative emissions were not significantly different (p > 0.05).

3.2. Environmental Data

A strong precipitation event was monitored beginning on the same day of the application of slurry and lasting for approximately two weeks, having the biggest intensity on the second week (Figure 2). A total of 105.8 mm of precipitation was recorded during the first two weeks after the slurry application, while only 28.7 mm was recorded during the two weeks prior to the application. Moreover, July was a slightly drier month than the average (75 versus 87 mm for the 1961–1990 period) (Estonian Weather Service, https://www.ilmateenistus.ee/ilmateenistus/vaatlusvork/kuusiku-meteoroloogiajaam/).
Correlation analysis between N2O fluxes and environmental parameters (Table S2) shows that N2O flux was correlated with both air and soil temperature, but this correlation was stronger in the treatment plot (ρ = 0.439 with p = 0.000 for treatment; and ρ = 0.256 with p = 0.021 for control plot; for the average 24-h temperature). A significant correlation between the N2O flux and precipitation recorded at the Kuusiku Weather Station at the moment of the measurement was found only for the treatment plot; however, the correlation was significant (p < 0.01) for both plots for the accumulated precipitation for the 2-h, 24-h, and 72-h periods prior to the moment of measurement. The highest correlation between the N2O flux and precipitation was found for the three-day cumulative precipitation, being stronger in the control than in the treatment plot (ρ = 0.674 for control and ρ = 0.448 for treatment plot, p < 0.001). A strong correlation was found between the average ground temperature for a 24 and 72-h period prior to the measurement for the treatment plot (ρ = 0.439 and ρ = 0.509, p < 0.001). This correlation was much weaker for the control plot (ρ = 0.256, p = 0.021; ρ = 0.235, p = 0.035).

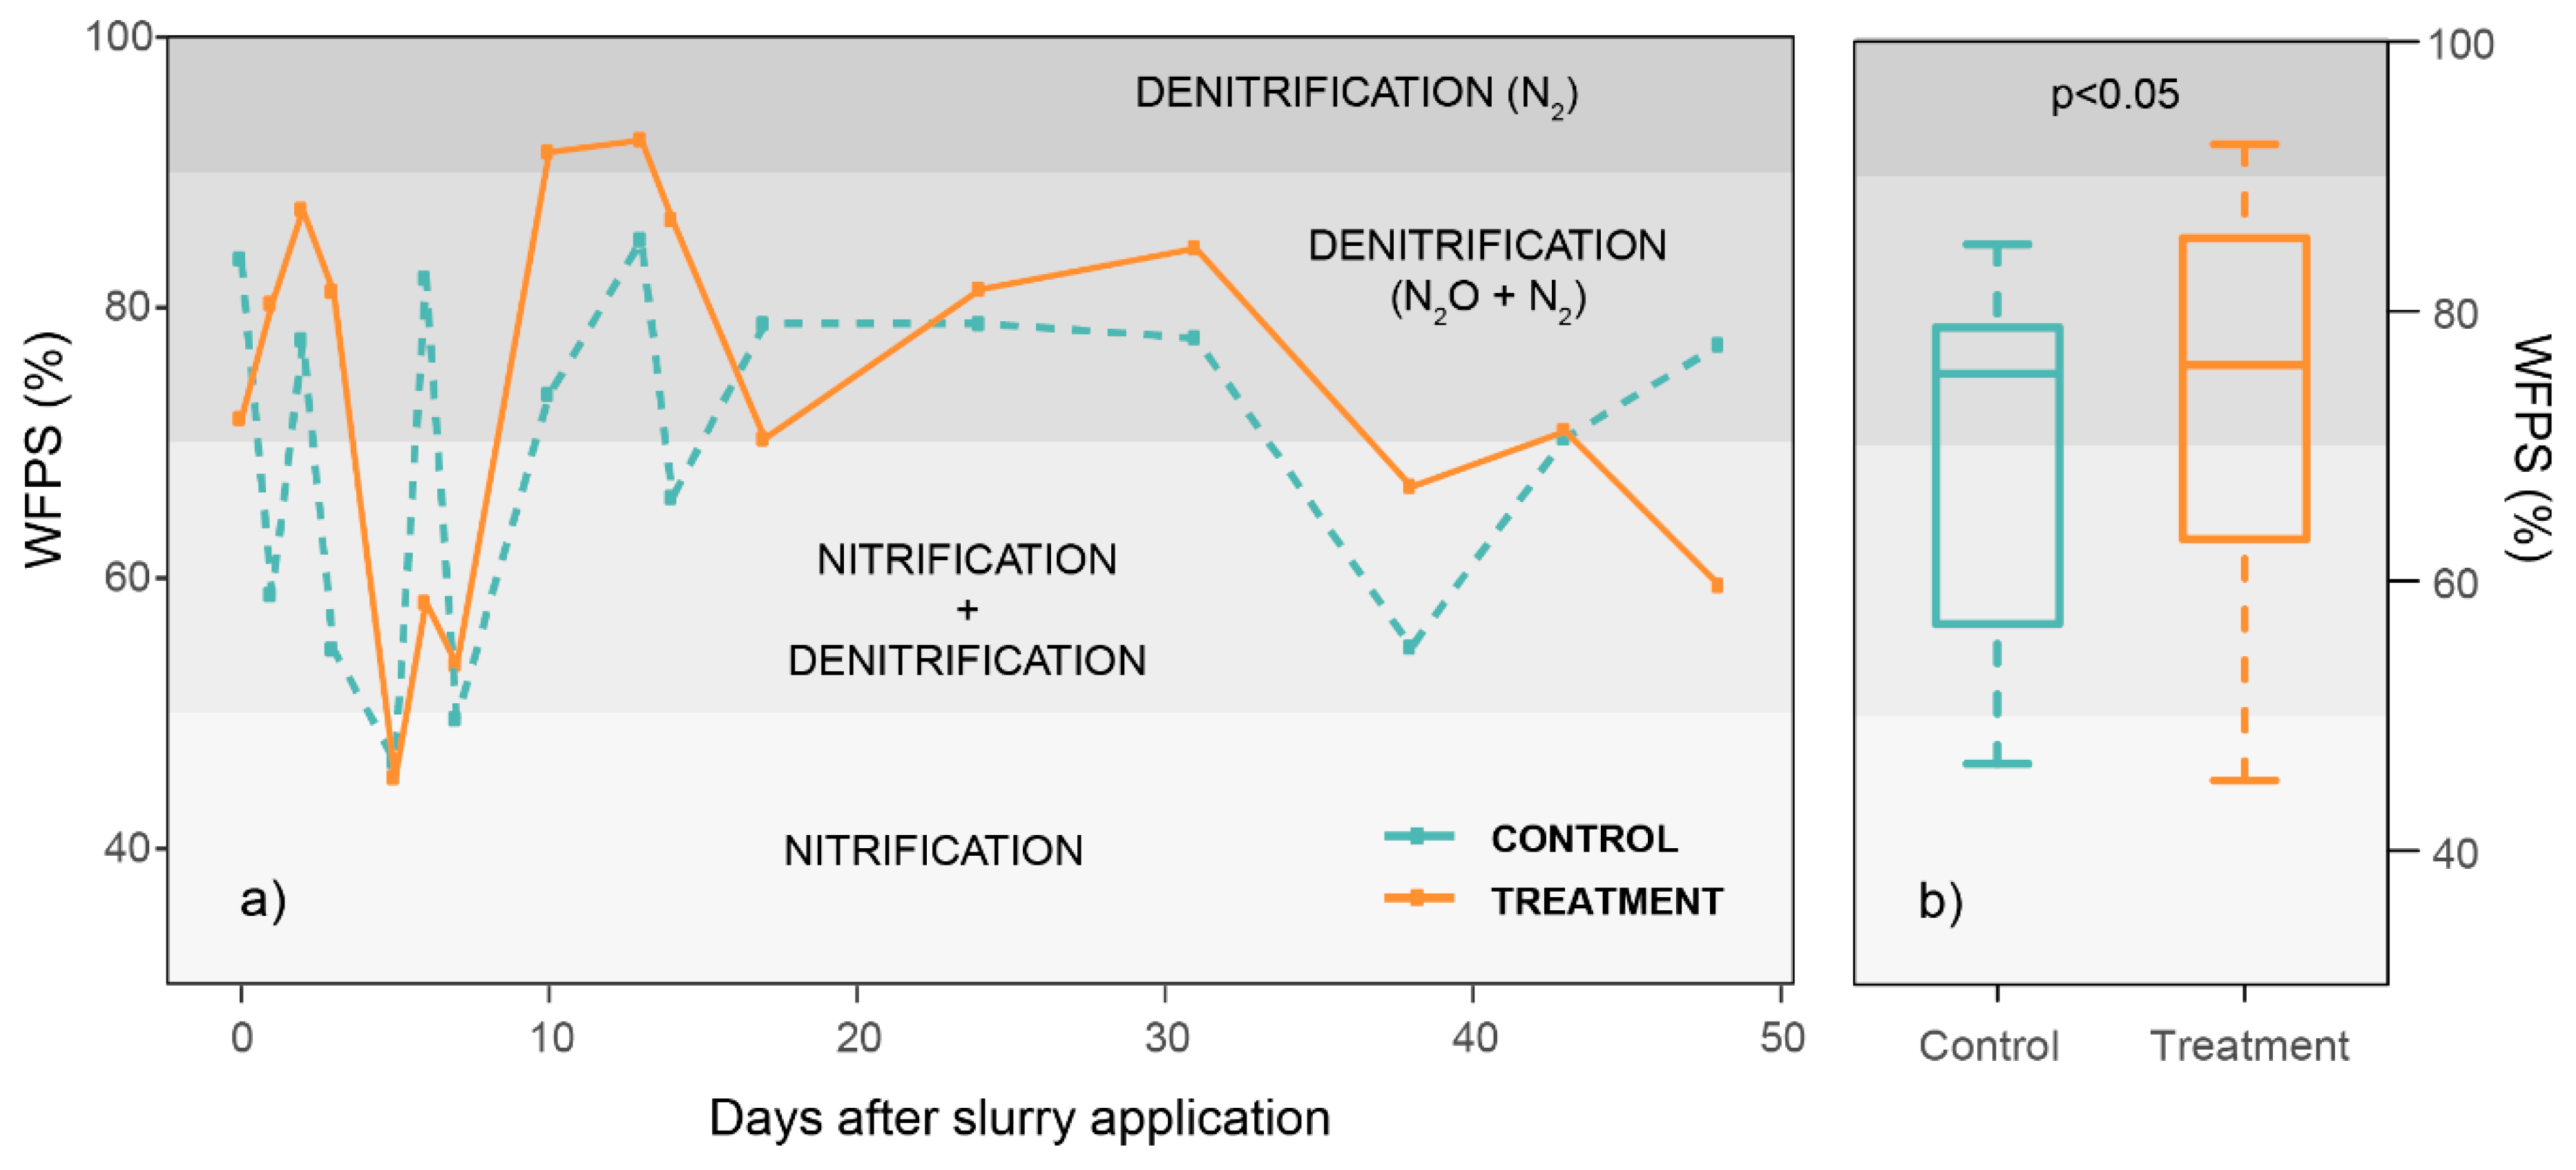
3.3. Soil Parameters

The control and the treatment plots showed different WFPS (p = 0.021) (Figure 3) for the studied period. A correlation analysis between WFPS and N2O flux was tested for the day-of-experiment WFPS, three-day, five-day, and seven-day averaged WFPS prior to the experiment, after linear interpolation of the missing values (Table S2). The correlation between the N2O flux and WFPS was only significant for the control plot for the 3-day averaged measured WFPS (WFPS3d), while it was significant for all considered WFPS periods for the treatment plot. The Spearman’s rank correlation coefficient between N2O flux and WFPS3d was ρ = 0.267 (p = 0.016) and ρ = 0.248 (p = 0.037) for the control and treatment plot, respectively.
The correlation analysis between N2O fluxes and the environmental parameters (Table S2) showed that N2O flux was strongly correlated with temperature for the treatment plot (p = 0.005 for 5 cm depth, and p < 0.001 for depths 10, 20, and 30 cm), but this correlation was not significant for the control plot.

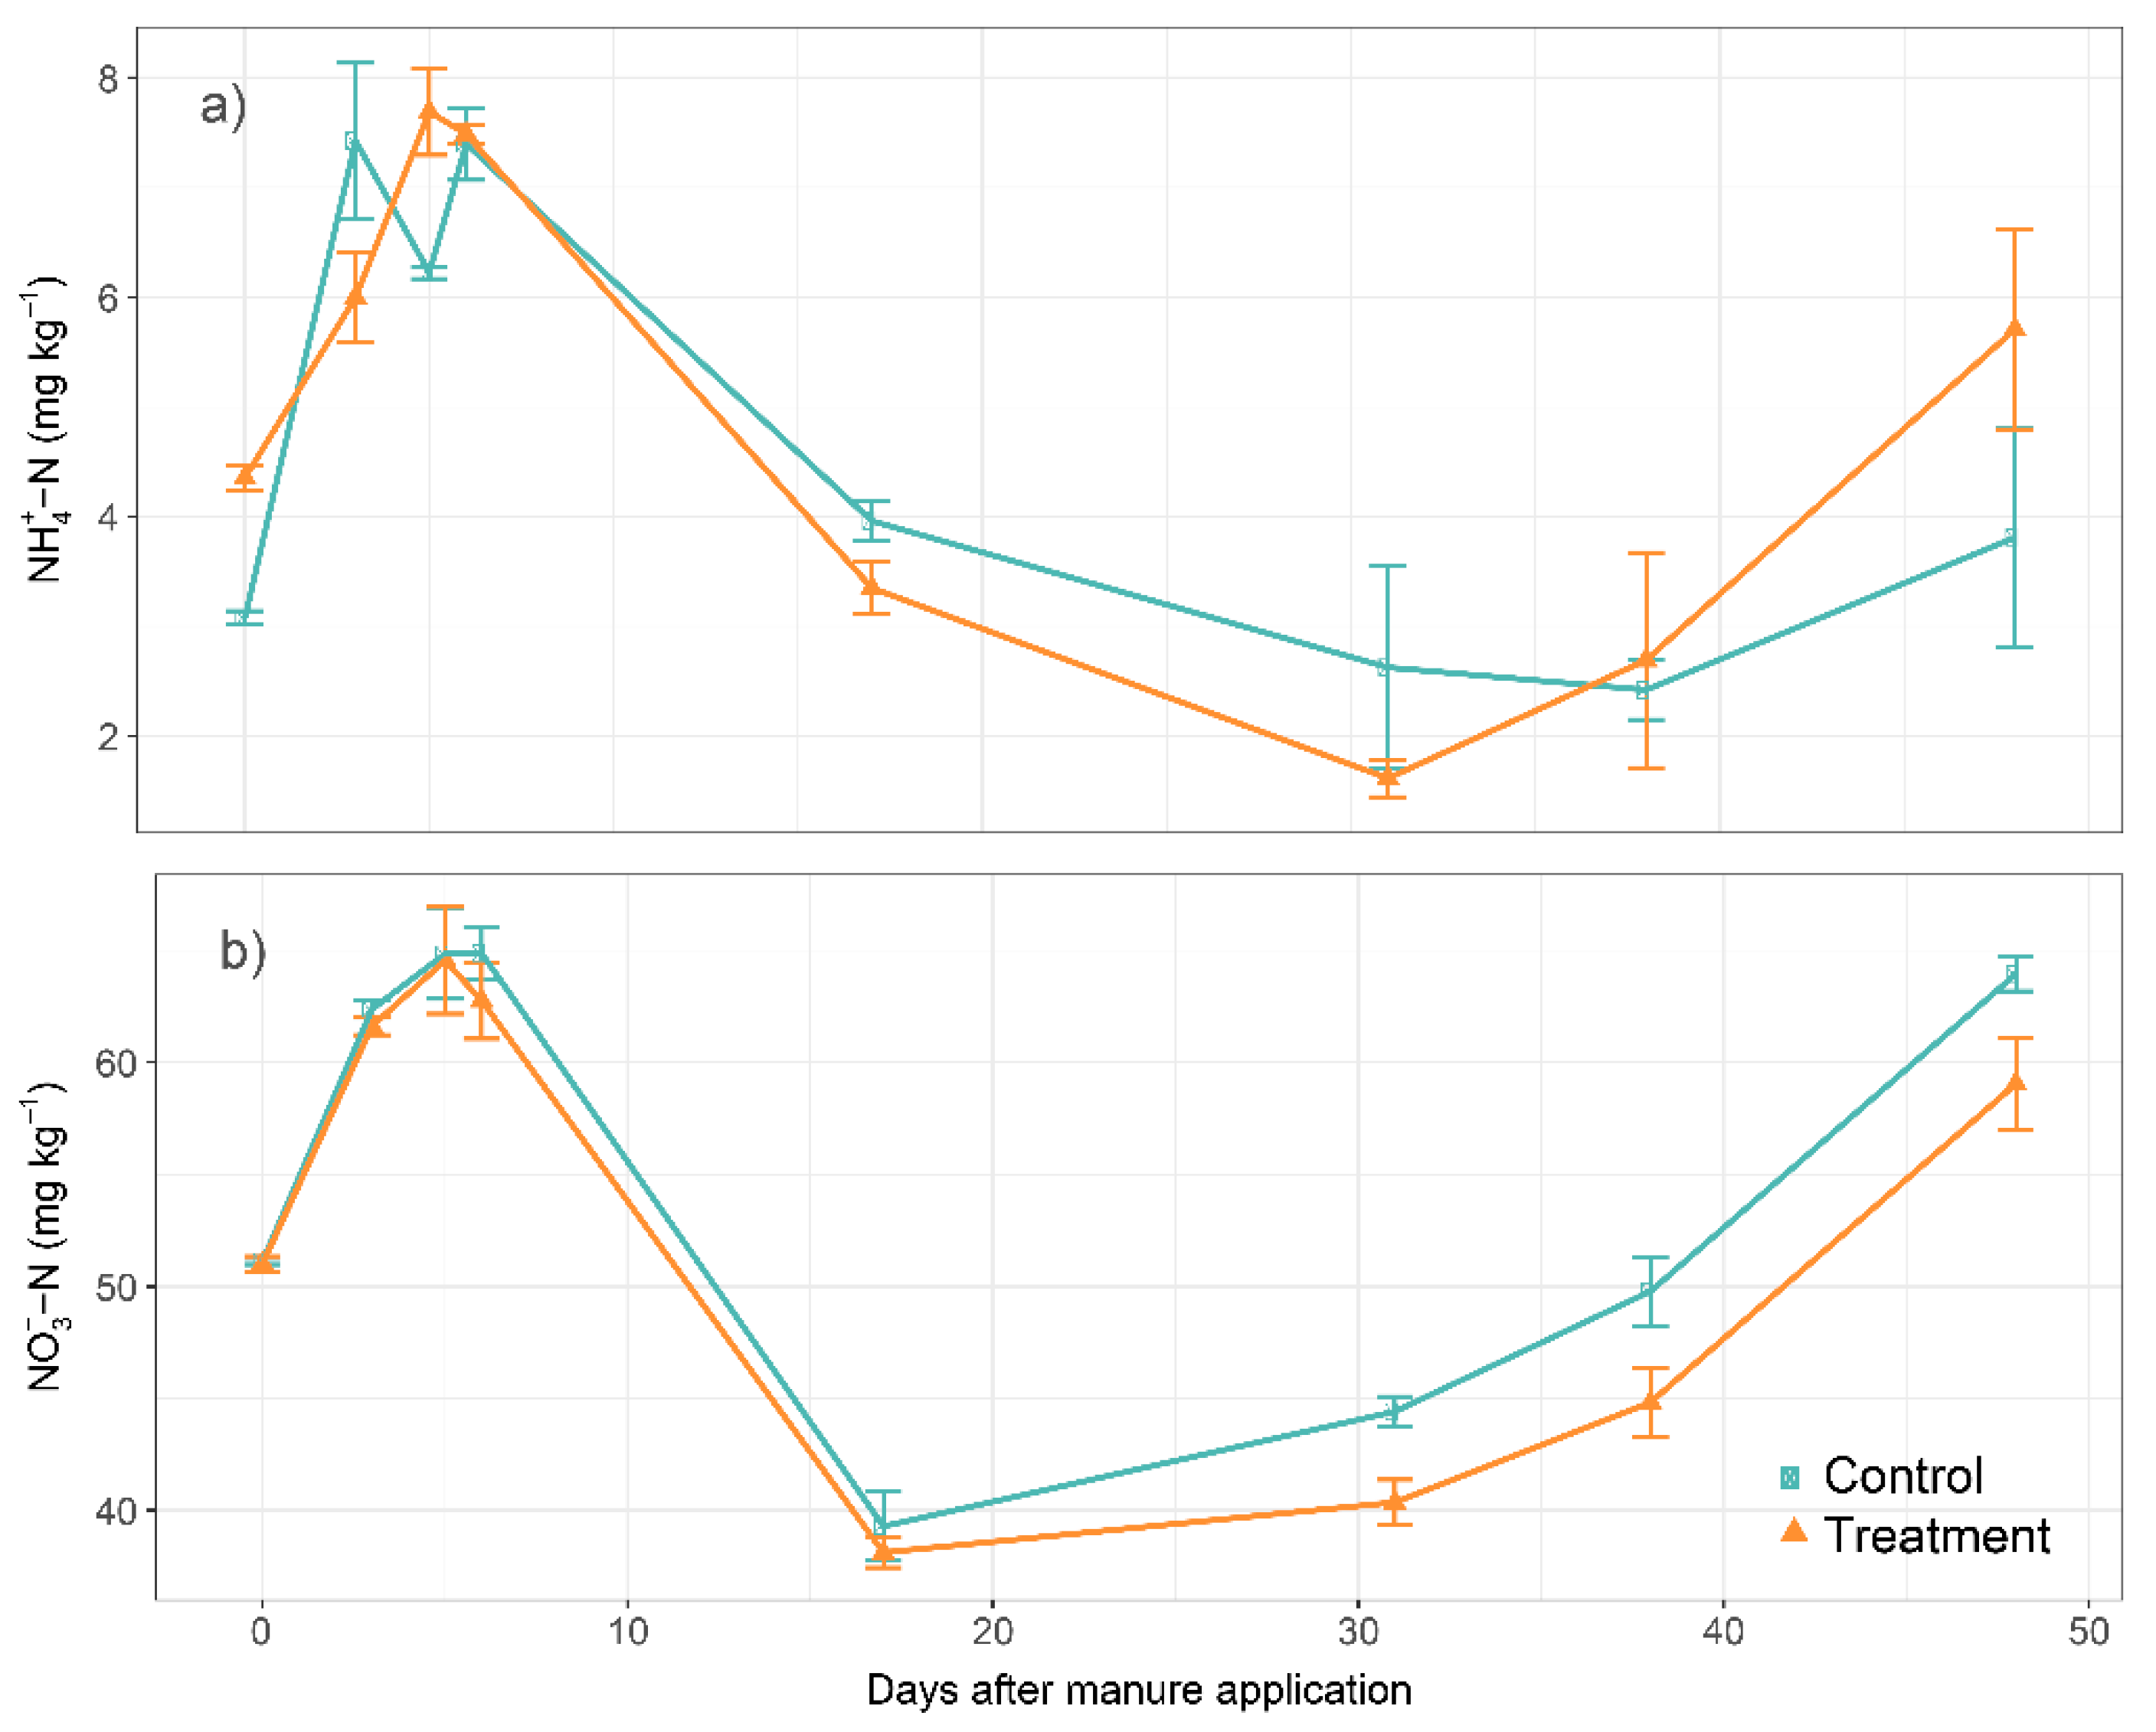
3.4. Soil Chemical Properties

From all analyzed soil parameters (Table 1), only dissolved nitrogen (DN) was statistically different (p = 0.047) between the control and the treatment plot prior to the beginning of the experiment. Initial pH had almost the same value on both plots (4.76 and 4.75) and was not significantly different. After the slurry application, pH increased, but this increase was stronger in the treatment plot, where it remained higher for almost all the studied period, although the difference between the treatment and the control soil pH was not significant.
Nitrate content and ammonium were not significantly different between the plots prior to the slurry application (Table 1), although ammonium content was higher in the treatment plot. No significant differences were found in NO3-N nor NH4+-N content between control and treatment plots during the period (Figure 4). No statistically significant correlation for N2O flux with soil nitrates was found for either plot. The correlation with soil ammonium was only statistically significant for the control plot (ρ = 0.464, p = 0.004).
Soil total carbon was highly correlated with N2O (ρ = 0.546, p < 0.001) for the treatment plot, while such correlation was not significant for the control plot. Negative significant correlation existed with DOC (ρ = −0.397, p = 0.015) for the control plot.

3.5. Leaching

The intense precipitation caused the leachate collection points at both the control and treatment plots to be overflooded by the ditch and the river, respectively, during part of the experiment, limiting the leachate sampling (Figures S1 and S2). Although it was possible to measure the first and last 10 days of the period, no sound conclusions can be drawn about the total losses of nitrogen through leachate for the whole period. Nevertheless, no significant differences were found for NH4+ or NO3 leaching between plots for the dates when data was available (Figures S3 and S4). The correlation analysis (Table S2) between N2O fluxes and leachate properties showed a significant negative correlation in the control plot with the NO3 concentration (ρ = −0.394; p = 0.004) but a positive correlation with NH4+ (ρ = 0.388; p = 0.005), while for the treatment plot a negative correlation was found with NH4+ (ρ = −0.586; p = 0.022) and a positive one with the NO3 concentration (ρ = 0.832; p < 0.001).

4. Discussion

Contrary to the experiment hypothesis, N2O emissions were higher in the plot where the nitrification inhibitor was applied, with significant differences during the initial period. This poses two questions: why the application of the nitrification inhibitor did not reduce N2O fluxes; and why the emissions were higher in the plot where the nitrification inhibitor had been applied. These two questions can be answered according to the information provided by field and climatic data. The most determining factor was the high precipitation event that started on the same day as the slurry and DMPP application, resulting in changes in soil moisture. The effectiveness of NIs in reducing N2O emissions is known to be conditioned by soil moisture and rainfall, soil pH, and temperature [20,51]. Soil moisture, which is directly dependent on precipitation, controls the availability of oxygen, which is one of the key factors regulating denitrification [6]. Higher soil moisture promotes anaerobic conditions in soil and, therefore, a more important role of denitrification, which is not affected by the inhibitory effect of DMPP [12,77]. Nitrification and denitrification, and subsequently N2O production, are controlled by several factors, particularly soil moisture, affected by rainfall and drainage among other aspects. The importance of rainfall and soil water content in N2O emissions has been noted extensively in the literature [78,79,80,81,82], and specifically for denitrification [83,84,85]. A positive relationship between increasing soil water content and increasing N2O emission from both lab and field studies has been explained by an increase in the denitrification activity [37]. Stevens and Luahglin [86] and Lohila et al. [33] established that the restricted availability of oxygen, as well as the presence of NO3 and the availability of labile carbon, are the most important prerequisites for denitrification. Moreover, Loro et al. [87] found that both denitrification activity and N2O emissions from denitrification were correlated with soil water content, but not with NO3 content, when the latter is not limiting. This is in accordance with the findings of Dobbie and Smith [26] that water-filled pore space (WFPS) is the main factor conditioning N2O emissions when soil NO3 concentration and temperature are not limiting. In fact, Dobbie et al. [79] found that the biggest N2O fluxes appeared at WFPS between 70–90%, and Ruser et al. [37] reported a strong increase in N2O emissions for WFPS above 60–70%, suggesting that it was denitrification and not nitrification that was the main process involved in the emissions. At higher values of WFPS, above 90%, the process may switch from the production of N2O to N2 [34,35], but, at lower values of pH like those of the study field soil, the ratio N2:N2O decreases [88,89] due to the sensitivity of nitrous oxide reductase to the pH [90]. According to the WFPS values (Figure 3), both plots were predominantly under denitrification conditions. The significant positive correlation between N2O fluxes and WFPS values found for both plots confirms that the higher fluxes were related to denitrification in both cases. With denitrification being the main source of emissions, the inhibition of nitrification was not effective in reducing N2O emissions. Dobbie et al. [79] also reported a strong positive correlation between the cumulative N2O emissions and the rainfall during the 4-week period beginning one week before the N application. Several studies have reported that rainfall events usually produce immediate peaks in N2O emissions [26,78,91], and that denitrification is the main process responsible for N2O emissions following rainfall events [92,93]. Correlation between N2O emissions and denitrification activity has been found in manured soils [94], and Clemens & Huschka [95] found that denitrification dominates N2O emissions processes after slurry application and suggested that the NO3 present in the soil can be used to oxidize the organic substances present in the slurry. The readily available C in slurries and manures is used for denitrifiers in anaerobic conditions as an energy source [30].
N2O emissions from denitrification could also have been enhanced by the drier soil conditions prior to the moment of the slurry application; total precipitation two weeks before application of the slurry and two weeks after was 28.7 and 105.8 mm, respectively. Rewetting after drought has been observed to boost mineralization and denitrification [96]. It has been documented that denitrifying bacteria recover faster when soils are rewetted after dry periods [97]. Smith et al. [98] found an increase in N2O emissions and denitrification rate after the apparition of anaerobic conditions. Firestone and Davidson [6] established that bold increases in N2O emissions, like those observed after rewetting, are more typical for denitrification than for nitrification, which suggests that denitrification was the main thing responsible for the observed emissions. It has been suggested that rewetting after dry periods increases the concentration of DOC [37]. As the importance of carbon in denitrification has been well established in the literature [95,99,100,101], denitrification in manure slurries is promoted by the readily assimilable C [102]. Moreover, carbon availability can promote anaerobic conditions, even at low WFPS, increasing denitrification potential and N2O emissions and explaining higher emissions found in organic fertilization than in inorganic fertilization [91]. Crop residues present in the field after harvesting the grassland cover (Lolium perenne, Festulolium, Trifolium pratense, Festuca pratensis) from the previous season would have increased C availability and denitrification rates once they were mixed with the soil at the moment of the slurry application; high denitrification rates have been found after plant damage or cutting, and this has been attributed to the increase in C availability in the soil from the decomposition of roots [30,103], which would also be enhanced by the increase in soil moisture due to precipitation. Once it has been established that denitrification was the source of the emission peaks during the studied period, the question of why emissions were higher from the treatment plot than from the control plot during the initial period still needs to be answered. This can be explained by a higher WFPS in the treatment plot for most of the period and therefore higher denitrification rate (Figure 3), resulting in higher N2O emissions, as the activity of N2O reductase should have been inhibited by the low soil pH. The different evolution of WFPS in the treatment plot was a consequence of differences in soil moisture as soil porosity was similar in both plots. Although the plots were established according to the similar soil properties and micro-topographical characteristics, moisture evolution was slightly different in both plots after the intense precipitation. Although the correlation between N2O and precipitation was stronger in the control plot than in the treatment plot for cumulative precipitation (2-h, 1-day, 3-day), this correlation was not significant for precipitation at the moment of the measurement, while it was significant for the treatment plot. Possible explanations could be the distance from the weather station (approximately 11 km), or that the 2-h cumulative precipitation before measurement is a better predictor of soil conditions than a single, momentary precipitation measurement. However, we hypothesize that the correlation between N2O flux and precipitation at the moment of measurement was not significant for the control plot because the influence of precipitation on the N2O flux in the control plot could be delayed in comparison to the treatment plot, which would explain why the peak of N2O emissions for the control plot took place on the 13th day of measurements. The WFPS, initially lower for the treatment plot, became higher in treatment on the first day of measurement, but it was higher again for the control plot on the 6th day (Figure 3), showing that the effect of precipitation was more rapid in the treatment plot, and the correlation between N2O flux and WFPS was significant for the control plot only for 3-day averaged values (WFPS3d), while it was significant in all cases for the treatment plot. Important in-field spatial variability is known to exist both for soil water content and N2O fluxes [7,33], and it is one of the main causes of uncertainty in N2O measurements from agro-ecosystems [32]. Factors such as soil NO3 and NH4+ concentration, labile C content, as well as bulk density, can show a variable spatial distribution, resulting in the spatial variability of nitrification and denitrification rates [104]. Cowan et al. [32] reported differences in N2O flux of 2 orders of magnitude in distances smaller than 10 m in a grassland, and that only 1.1% of the area of the field contributed to over 55% of the total N2O flux, highlighting the importance of hotspots in N2O fluxes. In our study, initial NO3, NH4+, C content, and bulk density were not significantly different between both plots, but differences in soil moisture evolution could explain the difference in temporal behavior regarding N2O fluxes.
The application of slurries results in pronounced increases of NH4+ content in the soil. Afterward, the NH4+ concentration is expected to decrease and NO3 to increase, as NH4+ is oxidized into NO3. The rate at which NH4+ is oxidized into NO3 is an indicator of nitrification activity. The application of a nitrification inhibitor should slow down this process in the treatment plot, retaining N in the form of NH4+ for a longer period than in the control plot. However, soil analyses during the experiment show, after the expected initial increase in NH4+ concentration, that both plots behaved identically regarding the oxidation of NH4+ into NO3 (Figure 4). This means that nitrification was taking place in both plots. This can be attributed to a lack of effectiveness of DMPP in the first days after application. Results from Kong et al. [46] show a time lag in the effect of DMPP on N2O emissions, as well as NH4+ and NO3 evolution in the soil; in a field experiment (cultivation after spraying the plant cover with DMPP) the effect appeared only approximately two weeks after it was applied. This is observed for the N2O emissions, but also for NH4+ and NO3, which show a similar evolution for the first two weeks with and without DMPP. Although a delay in the effectiveness of DMPP is not universal, it could be sometimes masked by an insufficient sampling frequency during the first days after application. Nevertheless, a several days delay in the effect of DMPP can also be observed in the results from Beltran-Rendon et al. [105], De Antoni Migliorati et al. [106] and Kou et al. [107] under a range of different conditions. The slightly higher initial content of NH4+ in the treatment plot may have also contributed to a higher initial nitrification activity in our experiment.
The significant correlation (Table S2) between N2O flux and soil NH4+ content only for the control plot but not for the treatment plot suggests that nitrification was a significant N2O source during the full duration of the experiment in control, but not in the treatment plot. This correlation is also significant for leachate from the control plot, where higher N2O fluxes are correlated with a higher concentration of NH4+, and with a lower concentration of NO3, suggesting a predominance of nitrification, while the opposite trend is observed in the treatment plot (a higher concentration of NO3 and a lower of NH4+ resulted in higher N2O fluxes), suggesting again the predominance of denitrification.
The low pH of the soils, combined with low oxygen availability and high availability of NH4+ after the slurry application, could indicate that nitrifier denitrification was partially responsible for the high N2O emissions, as it has been proposed to be a major pathway for N2O emissions when there is high availability of NH4+ and low oxygen [9,108]. However, the increase of NO3 content in the soils (Figure 4), from the oxidation of the NH4+ incorporated with the slurry, show that nitrifier-denitrification was not the main source of the measured high fluxes.

5. Conclusions

This study showed that the use of nitrification inhibitors does not result necessarily in a reduction in N2O emissions as environmental factors can conceal its effectiveness. High N2O emissions were measured in both the control and treatment plot after slurry application, with high spatial variability inside the plots. An intense precipitation event, beginning the same day of the application of the manure, resulted in an increase of soil moisture and changes in WFPS values. The high WFPS values in combination with the significant correlation between N2O flux and WFPS indicate that the peaks of emissions were the product of denitrification, explaining the absence of a nitrification inhibition effect in the treatment plot. This highlights the importance of climatic factors, and especially precipitation, in the performance of nitrification inhibitors. The relationship between precipitation, soil moisture, and subsequently, nitrification/denitrification activity is well-known, but how this can affect the inhibitory effect is sometimes neglected, as it is in-field spatial variability. Our results emphasize the necessity for further studies of the factors conditioning the action of nitrification inhibitors, with a special focus on in-field application, to achieve maximum effectiveness. Also, microbiological analyses of the populations of nitrifiers and denitrifiers should help to assess the role of each community regarding the effectiveness of nitrification inhibitors. Finally, long-term studies with a repeated application of DMPP should allow us to detect long-term changes in microbial populations and the effect on N2O emissions.

Supplementary Materials

The following are available online at https://www.mdpi.com/2077-0472/10/11/497/s1, Figure S1: Evolution of ammonium (NH4+-N) concentration in leachate (mg L−1), Figure S2: Evolution of nitrate (NO3-N) concentration in leachate(mg L−1), Figure S3: Ammonium (NH4+-N) concentrations in leachate (mg L−1), Figure S4: Nitrate (NO3-N) concentrations in leachate (mg L−1), Table S1: Number of studies on DCD and DMPP included in Akiyama et al. (2009), Abalos et al. (2014), Gilsanz et al. (2016) and Quan et al. (2017), Table S2: Correlations between N2O flux and (a) climatic parameters, (b) soil analysis, (c) field data and (d) leachate analysis.

Author Contributions

Conceptualization, K.S.; methodology, K.S. and K.K.; validation, J.E.-G. and K.S.; formal analysis, J.E.-G. and H.V.; investigation, J.E.-G. and H.V.; resources, K.S., A.A., Ü.M. and K.K.; data curation, J.E.-G.; writing—original draft preparation, J.E.-G. and K.S.; writing—review and editing, J.E.-G., K.S., M.S., Ü.M., K.K., H.V. and A.A.; visualization, J.E.-G.; supervision, K.S., M.S., A.A. and Ü.M.; project administration, K.S.; funding acquisition, K.S., A.A. and Ü.M. All authors have read and agreed to the published version of the manuscript.

Funding

This research was funded by the Estonian Research Council (the IUT2-16 and PRG352 grants) and the EU through the European Regional Development Fund (Centre of Excellence EcolChange, Estonia; and Estonian University of Life Sciences ASTRA project ‘Value-chain based bio-economy’).

Acknowledgments

The authors would like to thank Marko Satsi from Kehtna Mõisa OÜ and BASF SE for their support.

Conflicts of Interest

The authors declare no conflict of interest.

References

  1. IPCC. Global Warming of 1.5 °C. An IPCC Special Report on the Impacts of Global Warming of 1.5 °C above Pre-Industrial Levels and Related Global Greenhouse Gas EMISSION pathways, in the Context of Strengthening the Global Response to the Threat of Climate Change, Sustainable Development, and Efforts to Eradicate Poverty; Intergovernmental Panel on Climate Change: Geneva, Switzerland, 2018; p. 630.
  2. IPCC. Climate Change 2014: Synthesis Report. Contribution of Working Groups I, II and III to the Fifth Assessment Report of the Intergovernmental Panel on Climate Change; Core Writing Team: Geneva, Switzerland, 2014; p. 151. ISBN 978-92-9169-143-2.
  3. Ravishankara, A.R.; Daniel, J.S.; Portmann, R.W. Nitrous oxide (N2O): The dominant ozone-depleting substance emitted in the 21st century. Science 2009, 326, 123–125. [Google Scholar] [CrossRef] [PubMed] [Green Version]
  4. Ussiri, D.; Lal, R. Soil Emission of Nitrous Oxide and Its Mitigation; Springer Netherlands: Dordrecht, The Netherlands, 2013; Volume XVIII, p. 378. [Google Scholar]
  5. Park, S.; Croteau, P.; Boering, K.A.; Etheridge, D.M.; Ferretti, D.; Fraser, P.J.; Kim, K.R.; Krummel, P.B.; Langenfelds, R.L.; van Ommen, T.D.; et al. Trends and seasonal cycles in the isotopic composition of nitrous oxide since 1940. Nat. Geosci. 2012, 5, 261–265. [Google Scholar] [CrossRef]
  6. Firestone, M.K.; Davidson, E.A. Microbiological Basis of NO and N2O Production and Consumption in Soils. In Exchange of Trace Gases between Terrestrial Ecosystems and the Atmosphere; Andreae, M.O., Schimel, D.S., Eds.; John Willey and Sons: New York, NY, USA, 1989; pp. 7–21. [Google Scholar]
  7. Parton, W.J.; Mosier, A.R.; Ojima, D.S.; Valentine, D.W.; Schimel, D.S.; Weier, K.; Kulmala, A.E. Generalized model for N2and N2O production from nitrification and denitrification. Glob. Biogeochem. Cycles 1996, 10, 401–412. [Google Scholar] [CrossRef]
  8. Bremner, J.M. Sources of nitrous oxide in soils. Nutr. Cycl. Agroecosyst. 1997, 49, 7–16. [Google Scholar] [CrossRef]
  9. Wrage, N.; van Groenigen, J.W.; Oenema, O.; Baggs, E.M. A novel dual-isotope labelling method for distinguishing between soil sources of N2O. Rapid Commun. Mass Spectrom. 2005, 19, 3298–3306. [Google Scholar] [CrossRef]
  10. Smith, K.A.; Thomson, P.E.; Clayton, H.; McTaggart, I.P.; Conen, F. Effects of temperature, water content and nitrogen fertilisation on emissions of nitrous oxide by soils. Atmos. Environ. 1998, 32, 3301–3309. [Google Scholar] [CrossRef]
  11. Braker, G.; Ralf, C. Diversity, Structure, and Size of N2O-Producing Microbial Communities in Soils—What Matters for Their Functioning? In Advances in Applied Microbiology; Academic Press: Cambridge, MA, USA, 2011; Volume 75, pp. 33–70. [Google Scholar]
  12. Duan, Y.F.; Kong, X.W.; Schramm, A.; Labouriau, R.; Eriksen, J.; Petersen, S.O. Microbial N Transformations and N2O Emission after Simulated Grassland Cultivation: Effects of the Nitrification Inhibitor 3,4-Dimethylpyrazole Phosphate (DMPP). Appl. Environ. Microbiol. 2017, 83. [Google Scholar] [CrossRef] [Green Version]
  13. Leininger, S.; Urich, T.; Schloter, M.; Schwark, L.; Qi, J.; Nicol, G.W.; Prosser, J.I.; Schuster, S.C.; Schleper, C. Archaea predominate among ammonia-oxidizing prokaryotes in soils. Nature 2006, 442, 806–809. [Google Scholar] [CrossRef]
  14. Taylor, A.E.; Zeglin, L.H.; Wanzek, T.A.; Myrold, D.D.; Bottomley, P.J. Dynamics of ammonia-oxidizing archaea and bacteria populations and contributions to soil nitrification potentials. ISME J. 2012, 6, 2024–2032. [Google Scholar] [CrossRef]
  15. Jia, Z.; Conrad, R. Bacteria rather than Archaea dominate microbial ammonia oxidation in an agricultural soil. Environ. Microbiol. 2009, 11, 1658–1671. [Google Scholar] [CrossRef]
  16. Morimoto, S.; Hayatsu, M.; Takada Hoshino, Y.; Nagaoka, K.; Yamazaki, M.; Karasawa, T.; Takenaka, M.; Akiyama, H. Quantitative Analyses of Ammonia-oxidizing Archaea (AOA) and Ammonia-oxidizing Bacteria (AOB) in Fields with Different Soil Types. Microbes Environ. 2011, 26, 248–253. [Google Scholar] [CrossRef] [PubMed] [Green Version]
  17. Di, H.J.; Cameron, K.C.; Shen, J.P.; Winefield, C.S.; O’Callaghan, M.; Bowatte, S.; He, J.Z. Nitrification driven by bacteria and not archaea in nitrogen-rich grassland soils. Nat. Geosci. 2009, 2, 621–624. [Google Scholar] [CrossRef]
  18. Di, H.J.; Cameron, K.C.; Shen, J.P.; Winefield, C.S.; O’Callaghan, M.; Bowatte, S.; He, J.Z. Ammonia-oxidizing bacteria and archaea grow under contrasting soil nitrogen conditions. FEMS Microbiol. Ecol. 2010, 72, 386–394. [Google Scholar] [CrossRef] [PubMed] [Green Version]
  19. Di, H.J.; Cameron, K.C.; Sherlock, R.R.; Shen, J.-P.; He, J.-Z.; Winefield, C.S. Nitrous oxide emissions from grazed grassland as affected by a nitrification inhibitor, dicyandiamide, and relationships with ammonia-oxidizing bacteria and archaea. J. Soils Sediments 2010, 10, 943–954. [Google Scholar] [CrossRef]
  20. Di, H.J.; Cameron, K.C.; Podolyan, A.; Robinson, A. Effect of soil moisture status and a nitrification inhibitor, dicyandiamide, on ammonia oxidizer and denitrifier growth and nitrous oxide emissions in a grassland soil. Soil Biol. Biochem. 2014, 73, 59–68. [Google Scholar] [CrossRef]
  21. Briones, A.M.; Okabe, S.; Umemiya, Y.; Ramsing, N.B.; Reichardt, W.; Okuyama, H. Influence of different cultivars on populations of ammonia-oxidizing bacteria in the root environment of rice. Appl. Environ. Microbiol. 2002, 68, 3067–3075. [Google Scholar] [CrossRef] [Green Version]
  22. Villar, J.M.; Guillaumes, E. Use of nitrification inhibitor DMPP to improve nitrogen recovery in irrigated wheat on a calcareous soil. Span. J. Agric. Res. 2010, 8. [Google Scholar] [CrossRef] [Green Version]
  23. Gerardi, M.H. Nitrifying Bacteria. In Nitrification and Denitrification in the Activated Sludge Process; John Wiley & Sons, Inc.: New York, NY, USA, 2002; pp. 43–54. [Google Scholar] [CrossRef]
  24. Cabello, P.; Roldán, M.D.; Castillo, F.; Moreno-Vivián, C. Nitrogen Cycle. In Encyclopedia of Microbiology; Academic Press: Cambridge, MA, USA, 2009; pp. 299–321. [Google Scholar] [CrossRef]
  25. Wrage, N.; Velthof, G.L.; van Beusichem, M.L.; Oenema, O. Role of nitrifier denitrification in the production of nitrous oxide. Soil Biol. Biochem. 2001, 33, 1723–1732. [Google Scholar] [CrossRef]
  26. Dobbie, K.E.; Smith, K.A. Nitrous oxide emission factors for agricultural soils in Great Britain: The impact of soil water-filled pore space and other controlling variables. Glob. Chang. Biol. 2003, 9, 204–218. [Google Scholar] [CrossRef]
  27. Vinzent, B.; Fuß, R.; Maidl, F.-X.; Hülsbergen, K.-J. N2O emissions and nitrogen dynamics of winter rapeseed fertilized with different N forms and a nitrification inhibitor. Agric. Ecosyst. Environ. 2018, 259, 86–97. [Google Scholar] [CrossRef]
  28. Halling-Sørensen, B. Process Chemistry and Biochemistry of Nitrification. In Studies in Environmental Science; Halling-Sørensen, B., Jorgensen, S.E., Eds.; Elsevier Science: Amsterdam, The Netherlands, 1993; Volume 54, pp. 55–118. [Google Scholar]
  29. Hansen, R.; Mander, Ü.; Soosaar, K.; Maddison, M.; Lõhmus, K.; Kupper, P.; Kanal, A.; Sõber, J. Greenhouse gas fluxes in an open air humidity manipulation experiment. Landsc. Ecol. 2012, 28, 637–649. [Google Scholar] [CrossRef]
  30. Saggar, S.; Jha, N.; Deslippe, J.; Bolan, N.S.; Luo, J.; Giltrap, D.L.; Kim, D.G.; Zaman, M.; Tillman, R.W. Denitrification and N2O:N2 production in temperate grasslands: Processes, measurements, modelling and mitigating negative impacts. Sci. Total Environ. 2013, 465, 173–195. [Google Scholar] [CrossRef]
  31. Borchard, N.; Schirrmann, M.; Cayuela, M.L.; Kammann, C.; Wrage, M.N.; Estavillo, J.M.; Fuertes, M.T.; Sigua, G.; Spokas, K.; Ippolito, J.A.; et al. Biochar, soil and land-use interactions that reduce nitrate leaching and N2O emissions: A meta-analysis. Sci. Total Environ. 2019, 651, 2354–2364. [Google Scholar] [CrossRef] [PubMed]
  32. Cowan, N.J.; Norman, P.; Famulari, D.; Levy, P.E.; Reay, D.S.; Skiba, U.M. Spatial variability and hotspots of soil N2O fluxes from intensively grazed grassland. Biogeosciences 2015, 12, 1585–1596. [Google Scholar] [CrossRef] [Green Version]
  33. Lohila, A.; Aurela, M.; Hatakka, J.; Pihlatie, M.; Minkkinen, K.; Penttilä, T.; Laurila, T. Responses of N2O fluxes to temperature, water table and N deposition in a northern boreal fen. Eur. J. Soil Sci. 2010, 61, 651–661. [Google Scholar] [CrossRef]
  34. Focht, D.D. Methods for Analysis of Denitrification in Soils. In Soil–Plant–Nitrogen Relationships; Nielsen, D.R., MacDonald, J.G., Eds.; Academic Press: Cambridge, MA, USA, 1978; pp. 433–490. [Google Scholar] [CrossRef]
  35. Davidson, E.A. Fluxes of nitrous oxide and nitric oxide from terrestrial ecosystems. In Microbial Production and Consumption of Greenhouse Gases: Methane, Nitrogen Oxides, and Halomethanes; Rogers, J.E., Whitman, W.B., Eds.; American Society for Microbiology: Washington, DC, USA, 1991; pp. 219–235. [Google Scholar]
  36. Bouwman, A.F. Direct emission of nitrous oxide from agricultural soils. Nutr. Cycl. Agroecosyst. 1996, 46, 53–70. [Google Scholar] [CrossRef]
  37. Ruser, R.; Flessa, H.; Russow, R.; Schmidt, G.; Buegger, F.; Munch, J.C. Emission of N2O, N2 and CO2 from soil fertilized with nitrate: Effect of compaction, soil moisture and rewetting. Soil Biol. Biochem. 2006, 38, 263–274. [Google Scholar] [CrossRef]
  38. Allison, F.E. Nitrogen and Soil Fertility. In Yearbook of Agriculture 1957; United States Department of Agriculture: Washington, WA, USA, 1957; p. 784. [Google Scholar]
  39. Bouchet, A.-S.; Laperche, A.; Bissuel-Belaygue, C.; Snowdon, R.; Nesi, N.; Stahl, A. Nitrogen use efficiency in rapeseed. A review. Agron. Sustain. Dev. 2016, 36. [Google Scholar] [CrossRef]
  40. Yu, L.; Kang, R.; Mulder, J.; Zhu, J.; Dörsch, P. Distinct fates of atmogenic NH4+ and NO3− in subtropical, N-saturated forest soils. Biogeochemistry 2017, 133, 279–294. [Google Scholar] [CrossRef]
  41. Ruser, R.; Schulz, R. The effect of nitrification inhibitors on the nitrous oxide (N2O) release from agricultural soils-a review. J. Plant Nutr. Soil Sci. 2015, 178, 171–188. [Google Scholar] [CrossRef]
  42. Di, H.J.; Cameron, K.C. Inhibition of nitrification to mitigate nitrate leaching and nitrous oxide emissions in grazed grassland: A review. J. Soils Sediments 2016, 16, 1401–1420. [Google Scholar] [CrossRef]
  43. Akiyama, H.; Yan, X.; Yagi, K. Evaluation of effectiveness of enhanced-efficiency fertilizers as mitigation options for N2O and NO emissions from agricultural soils: Meta-analysis. Glob. Chang. Biol. 2009, 16, 1837–1846. [Google Scholar] [CrossRef]
  44. Gilsanz, C.; Báez, D.; Misselbrook, T.H.; Dhanoa, M.S.; Cárdenas, L.M. Development of emission factors and efficiency of two nitrification inhibitors, DCD and DMPP. Agric. Ecosyst. Environ. 2016, 216, 1–8. [Google Scholar] [CrossRef]
  45. Yang, M.; Fang, Y.; Sun, D.; Shi, Y. Efficiency of two nitrification inhibitors (dicyandiamide and 3, 4-dimethypyrazole phosphate) on soil nitrogen transformations and plant productivity: A meta-analysis. Sci. Rep. 2016, 6, 22075. [Google Scholar] [CrossRef] [Green Version]
  46. Kong, X.; Eriksen, J.; Petersen, S.O. Evaluation of the nitrification inhibitor 3,4-dimethylpyrazole phosphate (DMPP) for mitigating soil N2O emissions after grassland cultivation. Agric. Ecosyst. Environ. 2018, 259, 174–183. [Google Scholar] [CrossRef]
  47. Zerulla, W.; Barth, T.; Dressel, J.; Erhardt, K.; Horchler von Locquenghien, K.; Pasda, G.; Rädle, M.; Wissemeier, A. 3,4-Dimethylpyrazole phosphate (DMPP)—A new nitrification inhibitor for agriculture and horticulture. Biol. Fertil. Soils 2001, 34, 79–84. [Google Scholar] [CrossRef]
  48. Guillaumes, E.; Villar, J.M. Effects of DMPP [3,4-dimethylpyrozole phosphate] on the growth and chemical composition of ryegrass (Lolium perenne L.) raised on calcareous soil. Span. J. Agric. Res. 2004, 2. [Google Scholar] [CrossRef] [Green Version]
  49. Trenkel, M.E. Slow-and Controlled-Release and Stabilized Fertilizers: An Option for Enhancing Nutrient Use Efficiency in Agriculture; International Fertilizer Industry Association (IFA): Paris, France, 2010. [Google Scholar]
  50. Byrne, M.P.; Tobin, J.T.; Forrestal, P.J.; Danaher, M.; Nkwonta, C.G.; Richards, K.; Cummins, E.; Hogan, S.A.; O’Callaghan, T.F. Urease and Nitrification Inhibitors—As Mitigation Tools for Greenhouse Gas Emissions in Sustainable Dairy Systems: A Review. Sustainability 2020, 12, 6018. [Google Scholar] [CrossRef]
  51. Barrena, I.; Menéndez, S.; Correa-Galeote, D.; Vega-Mas, I.; Bedmar, E.J.; González-Murua, C.; Estavillo, J.M. Soil water content modulates the effect of the nitrification inhibitor 3,4-dimethylpyrazole phosphate (DMPP) on nitrifying and denitrifying bacteria. Geoderma 2017, 303, 1–8. [Google Scholar] [CrossRef]
  52. Godfrey, L.V.; Glass, J.B. The geochemical record of the ancient nitrogen cycle, nitrogen isotopes, and metal cofactors. Methods Enzym. 2011, 486, 483–506. [Google Scholar] [CrossRef]
  53. Velthof, G.L.; Mosquera, J.; Mosquera, J.; Veld, J.W.H.H.i.t.; Hummelink, E.W.J. Effect of Manure Application Technique on Nitrous Oxide Emission from Agricultural Soils; Alterra Wageningen UR: Wageningen, The Netherlands, 2010; p. 74. [Google Scholar]
  54. Zhu, Y.; Merbold, L.; Leitner, S.; Pelster, D.E.; Okoma, S.A.; Ngetich, F.; Onyango, A.A.; Pellikka, P.; Butterbach-Bahl, K. The effects of climate on decomposition of cattle, sheep and goat manure in Kenyan tropical pastures. Plant Soil 2020, 451, 325–343. [Google Scholar] [CrossRef] [Green Version]
  55. Mosier, A.R. Soil processes and global change. Biol. Fertil. Soils 1998, 27, 221–229. [Google Scholar] [CrossRef]
  56. Lessard, R.; Rochette, P.; Gregorich, E.G.; Pattey, E.; Desjardins, R.L. Nitrous Oxide Fluxes from Manure-Amended Soil under Maize. J. Environ. Qual. 1996, 25. [Google Scholar] [CrossRef]
  57. Flach, B.; Lieberz, S.; Lappin, J.; Bolla, S. EU Biofuels Annual 2018; USDA Foreign Agricultural Service: Washington, DC, USA, 2018. [Google Scholar]
  58. Pehnelt, G.; Vietze, C. Uncertainties about the GHG Emissions Saving of Rapeseed Biodiesel; Friedrich-Schiller University of Jena: Jena, Germany, 2012. [Google Scholar]
  59. Astover, A.; Shanskiy, M.; Lauringson, E. Development and Application of the Methodology for the Calculation of Average Greenhouse Gas Emissions from the Cultivation of Rapeseed, Wheat, Rye, Barley and Triticale in Estonia; Ministry of the Environment of the Republic of Estonia: Tartu, Estonia, 2015.
  60. BioGrace. BioGrace Greenhouse Gas Calculation Tool Version 4d. Available online: http://www.biograce.net/ (accessed on 26 February 2020).
  61. Vinzent, B.; Fuß, R.; Maidl, F.-X.; Hülsbergen, K.-J. Efficacy of agronomic strategies for mitigation of after-harvest N2O emissions of winter oilseed rape. Eur. J. Agron. 2017, 89, 88–96. [Google Scholar] [CrossRef]
  62. European Commission. Communication from the Comission: The European Green Deal; European Commission: Brussels, Belgium, 2019. [Google Scholar]
  63. The European Parliament and of the Council of the European Union. Directive (EU) 2018/2001 of the European Parliament and of the Council of 11 December 2018 on the Promotion of the Use of Energy from Renewable Sources; Council of the European Union: Strasbourg, France, 2018.
  64. Oo, A.Z.; Gonai, T.; Sudo, S.; Thuzar Win, K.; Shibata, A. Surface application of fertilizers and residue biochar on N2O emission from Japanese pear orchard soil. Plantsoil Environ. 2018, 64, 597–604. [Google Scholar] [CrossRef]
  65. Carter, M.R.; Gregorich, E.G. Soil Sampling and Methods of Analysis; CRC Press: Boca Raton, FL, USA, 2007. [Google Scholar] [CrossRef]
  66. Egnér, H.; Riehm, H.; Domingo, W.R. Untersuchungen uber die chemische Bodenanalyse als Grundlage fur die Beurteilung des Nährstoffzustandes der Böden. II. Chemische Extraktionsmethoden zur Phosphor- und Kaliumbestimmung. K. Lantbr. Ann. 1960, 26, 199–215. [Google Scholar]
  67. Association of official analytical chemists (AOAC). Official Methods of Analysis, 15th ed.; Association of Official Analytical Chemists: Washington, DC, USA, 1990. [Google Scholar]
  68. Schulte, E.E.; Hopkins, B.G. Estimation of Soil Organic Matter by Weight Loss-On-Ignition. In Soil Organic Matter: Analysis and Interpretation; Magdoff, F.R., Tabatabai, M.A., Jr., Edward, A.H., Eds.; Soil Science Society of America, Inc.: Madison, WI, USA, 1996; Volume 46. [Google Scholar] [CrossRef]
  69. Ruzicka, J.; Hansen, E.H. Flow Injection Analysis, 2nd ed.; Wiley: New York, NY, USA, 1988. [Google Scholar]
  70. Hutchinson, G.L.; Livingston, G.P. Use of chamber systems to measure trace gas fluxes. In Agricultural Ecosystem Effects on Trace Gases and Global Climate Change; Harper, L.A., Mosier, A.R., Duxbury, J.M., Rolston, D.E., Eds.; American Society of Agronomy: Madison, WI, USA, 1993; pp. 63–78. [Google Scholar] [CrossRef] [Green Version]
  71. Mander, U.; Maddison, M.; Soosaar, K.; Teemusk, A.; Kanal, A.; Uri, V.; Truu, J. The impact of a pulsing groundwater table on greenhouse gas emissions in riparian grey alder stands. Environ. Sci. Pollut. Res. Int. 2015, 22, 2360–2371. [Google Scholar] [CrossRef]
  72. Loftfield, N.; Flessa, H.; Augustin, J.; Beese, F. Automated Gas Chromatographic System for Rapid Analysis of the Atmospheric Trace Gases Methane, Carbon Dioxide, and Nitrous Oxide. J. Environ. Qual. 1997, 26. [Google Scholar] [CrossRef]
  73. Livingston, G.P.; Hutchinson, G.L. Enclosure-based measurement of trace gas exchange: Applications and sources of error. In Biogenic Trace Gases: Measuring Emissions from Soil and Water; Matson, P.A., Harriss, R.C., Eds.; Blackwell Publishing: Oxford, UK, 1995; pp. 14–51. [Google Scholar]
  74. Volpi, I.; Ragaglini, G.; Nassi o Di Nasso, N.; Bonari, E.; Bosco, S. Soil N2O emissions in Mediterranean arable crops as affected by reduced tillage and N rate. Nutr. Cycl. Agroecosyst. 2019, 116, 117–133. [Google Scholar] [CrossRef]
  75. R Core Team. R: A Language and Environment for Statistical Computing; R Foundation for Statistical Computing: Vienna, Austria, 2016. [Google Scholar]
  76. Tukey, J.W. Exploratory Data Analysis; Addison-Wesley Publishing Company: Reading, MA, USA, 1977. [Google Scholar]
  77. Müller, C.; Stevens, R.J.; Laughlin, R.J.; Azam, F.; Ottow, J.C.G. The nitrification inhibitor DMPP had no effect on denitrifying enzyme activity. Soil Biol. Biochem. 2002, 34, 1825–1827. [Google Scholar] [CrossRef]
  78. Flessa, H.; Dörsch, P.; Beese, F. Seasonal variation of N2O and CH4 fluxes in differently managed arable soils in southern Germany. J. Geophys. Res. 1995, 100. [Google Scholar] [CrossRef]
  79. Dobbie, K.E.; McTaggart, I.P.; Smith, K.A. Nitrous oxide emissions from intensive agricultural systems: Variations between crops and seasons, key driving variables, and mean emission factors. J. Geophys. Res. Atmos. 1999, 104, 26891–26899. [Google Scholar] [CrossRef]
  80. Schaufler, G.; Kitzler, B.; Schindlbacher, A.; Skiba, U.; Sutton, M.A.; Zechmeister-Boltenstern, S. Greenhouse gas emissions from European soils under different land use: Effects of soil moisture and temperature. Eur. J. Soil Sci. 2010, 61, 683–696. [Google Scholar] [CrossRef]
  81. Wang, F.; Li, J.; Wang, X.; Zhang, W.; Zou, B.; Neher, D.A.; Li, Z. Nitrogen and phosphorus addition impact soil N(2)O emission in a secondary tropical forest of South China. Sci. Rep. 2014, 4, 5615. [Google Scholar] [CrossRef] [Green Version]
  82. Dhadli, H.S.; Brar, B.S.; Kingra, P.K. Temporal Variations in N2O Emissions in Maize and Wheat Crop Seasons: Impact of N-Fertilization, Crop Growth, and Weather Variables. J. Crop Improv. 2016, 30, 17–31. [Google Scholar] [CrossRef]
  83. Ryden, J.C. Denitrification loss from a grassland soil in the field receiving different rates of nitrogen as ammonium nitrate. J. Soil Sci. 1983, 34, 355–365. [Google Scholar] [CrossRef]
  84. Mori, T.; Ohta, S.; Ishizuka, S.; Konda, R.; Wicaksono, A.; Heriyanto, J.; Hardjono, A. Effects of phosphorus addition on N2O and NO emissions from soils of anAcacia mangiumplantation. Soil Sci. Plant Nutr. 2010, 56, 782–788. [Google Scholar] [CrossRef] [Green Version]
  85. Keil, D.; Niklaus, P.A.; von Riedmatten, L.R.; Boeddinghaus, R.S.; Dormann, C.F.; Scherer-Lorenzen, M.; Kandeler, E.; Marhan, S. Effects of warming and drought on potential N2O emissions and denitrifying bacteria abundance in grasslands with different land-use. FEMS Microbiol. Ecol. 2015, 91. [Google Scholar] [CrossRef] [Green Version]
  86. Stevens, R.J.; Laughlin, R.J. Cattle Slurry Applied Before Fertilizer Nitrate Lowers Nitrous Oxide and Dinitrogen Emissions. Soil Sci. Soc. Am. J. 2002, 66, 647–652. [Google Scholar] [CrossRef]
  87. Loro, P.J.; Bergstrom, D.W.; Beauchamp, E.G. Intensity and Duration of Denitrification following Application of Manure and Fertilizer to Soil. J. Environ. Qual. 1997, 26, 706–713. [Google Scholar] [CrossRef]
  88. Simek, M.; Cooper, J.E. The influence of soil pH on denitrification: Progress towards the understanding of this interaction over the last 50 years. Eur. J. Soil Sci. 2002, 53, 345–354. [Google Scholar] [CrossRef]
  89. Hénault, C.; Bourennane, H.; Ayzac, A.; Ratié, C.; Saby, N.P.A.; Cohan, J.P.; Eglin, T.; Gall, C.L. Management of soil pH promotes nitrous oxide reduction and thus mitigates soil emissions of this greenhouse gas. Sci. Rep. 2019, 9, 20182. [Google Scholar] [CrossRef] [PubMed] [Green Version]
  90. McMillan, A.M.S.; Pal, P.; Phillips, R.L.; Palmada, T.; Berben, P.H.; Jha, N.; Saggar, S.; Luo, J. Can pH amendments in grazed pastures help reduce N2O emissions from denitrification?—The effects of liming and urine addition on the completion of denitrification in fluvial and volcanic soils. Soil Biol. Biochem. 2016, 93, 90–104. [Google Scholar] [CrossRef]
  91. Chen, Z.; Ding, W.; Luo, Y.; Yu, H.; Xu, Y.; Müller, C.; Xu, X.; Zhu, T. Nitrous oxide emissions from cultivated black soil: A case study in Northeast China and global estimates using empirical model. Glob. Biogeochem. Cycles 2014, 28, 1311–1326. [Google Scholar] [CrossRef]
  92. Thornton, F.C.; Shurpali, N.J.; Bock, B.R.; Reddy, K.C. N2O and no emissions from poultry litter and urea applications to Bermuda grass. Atmos. Environ. 1998, 32, 1623–1630. [Google Scholar] [CrossRef]
  93. Cantarel, A.A.M.; Bloor, J.M.G.; Deltroy, N.; Soussana, J.-F. Effects of Climate Change Drivers on Nitrous Oxide Fluxes in an Upland Temperate Grassland. Ecosystems 2010, 14, 223–233. [Google Scholar] [CrossRef]
  94. Calderón, F.J.; McCarty, G.W.; Reeves, J.B. Analysis of manure and soil nitrogen mineralization during incubation. Biol. Fertil. Soils 2005, 41, 328–336. [Google Scholar] [CrossRef]
  95. Clemens, J.; Huschka, A. The effect of biological oxygen demand of cattle slurry and soil moisture on nitrous oxide emissions. Nutr. Cycl. Agroecosyst. 2001, 59, 193–198. [Google Scholar] [CrossRef]
  96. Guo, X.; Drury, C.F.; Yang, X.; Daniel Reynolds, W.; Fan, R. The Extent of Soil Drying and Rewetting Affects Nitrous Oxide Emissions, Denitrification, and Nitrogen Mineralization. Soil Sci. Soc. Am. J. 2014, 78, 194–204. [Google Scholar] [CrossRef]
  97. Smith, M.S.; Parsons, L.L. Persistence of Denitrifying Enzyme Activity in Dried Soils. Appl. Environ. Microbiol. 1985, 49, 316–320. [Google Scholar] [CrossRef] [Green Version]
  98. Smith, M.S.; Firestone, M.K.; Tiedje, J.M. The Acetylene Inhibition Method for Short-term Measurement of Soil Denitrification and its Evaluation Using Nitrogen-131. Soil Sci. Soc. Am. J. 1978, 42. [Google Scholar] [CrossRef]
  99. Firestone, M.K.; Tiedje, J.M. Temporal change in nitrous oxide and dinitrogen from denitrification following onset of anaerobiosis. Appl. Environ. Microbiol. 1979, 38, 673–679. [Google Scholar] [CrossRef] [PubMed] [Green Version]
  100. Paul, J.W.; Beauchamp, E.G. Denitrification and fermentation in plant-residue-amended soil. Biol. Fertil. Soils 1989, 7. [Google Scholar] [CrossRef]
  101. Tenuta, M.; Bergstrom, D.W.; Beauchamp, E.G. Denitrifying enzyme activity and carbon availability for denitrification following manure application. Commun. Soil Sci. Plant Anal. 2008, 31, 861–876. [Google Scholar] [CrossRef]
  102. Petersen, S.O. Nitrous Oxide Emissions from Manure and Inorganic Fertilizers Applied to Spring Barley. J. Environ. Qual. 1999, 28. [Google Scholar] [CrossRef]
  103. Beck, H.; Christensen, S. The effect of grass maturing and root decay on N2O production in soil. Plant Soil 1987, 103, 269–273. [Google Scholar] [CrossRef]
  104. Oenema, O.; Velthof, G.L.; Yamulki, S.; Jarvis, S.C. Nitrous oxide emissions from grazed grassland. Soil Use Manag. 1997, 13, 288–295. [Google Scholar] [CrossRef]
  105. Beltran-Rendon, D.; Rico-Fragozo, K.; Farfan-Caceres, L.; Restrepo-Diaz, H.; Hoyos-Carvajal, L. The effect of nitrification inhibitor 3,4-dimethylpyrazole phosphate (DMPP) on nitrifying organism populations under in vitro conditions. Agric. Sci. 2011, 2, 198–200. [Google Scholar] [CrossRef] [Green Version]
  106. De Antoni, M.M.; Scheer, C.; Grace, P.R.; Rowlings, D.W.; Bell, M.; McGree, J. Influence of different nitrogen rates and DMPP nitrification inhibitor on annual N2O emissions from a subtropical wheat–maize cropping system. Agric. Ecosyst. Environ. 2014, 186, 33–43. [Google Scholar] [CrossRef] [Green Version]
  107. Kou, Y.P.; Wei, K.; Chen, G.X.; Wang, Z.Y.; Xu, H. Effects of 3,4-dimethylpyrazole phosphate and dicyandiamide on nitrous oxide emission in a greenhouse vegetable soil. Plant Soil Environ. 2016, 61, 29–35. [Google Scholar] [CrossRef] [Green Version]
  108. Wrage-Mönnig, N.; Horn, M.A.; Well, R.; Müller, C.; Velthof, G.; Oenema, O. The role of nitrifier denitrification in the production of nitrous oxide revisited. Soil Biol. Biochem. 2018, 123, A3–A16. [Google Scholar] [CrossRef]
Figure 1. The location of the experimental trial at Kehtna parish (Rapla county, 58°55′22″ N 24°50′52″ E) in Central Estonia. The white lines represent the main drainage system collectors. The red circles indicate the ends of drainage pipes where the leachate collection was carried out. The orange line indicates the in-field separation between the control and treatment plot.
Agriculture 10 00497 g001
Figure 2. Measured (a) daily average soil temperature (°C) and daily total precipitation (mm) in the Kuusiku weather station; (b) daily N2O fluxes (mg N m−2 h−1); and (c) total emissions (kg N ha−1) for the full study period (mean and standard error). Stars indicate significant differences for the daily flux between the control and treatment plot for a non-paired Wilcoxon-test (ns: non-significant; *: p < 0.05).
Agriculture 10 00497 g002
Figure 3. The water-filled pore space (WFPS) evolution (a) and distribution of values (b) for the studied period for treatment (orange) and control (blue) plots. Nitrification and denitrification optimal WFPS limits are from Focht [34], Davidson [35], Bouwman [36], Ruser et al. [37], Hansen et al. [29] and Ussiri and Lal [4].
Agriculture 10 00497 g003
Figure 4. Measured soil NO3-N (a) and NH4+-N (b) mean concentration for the treatment and control plots. Error bars represent the standard error.
Agriculture 10 00497 g004
Table 1. The initial (pre-slurry application) main soil chemical parameters for the control and the treatment plot.
ParameterControl PlotTreatment Plot
BD (g cm−3)1.1071.124
pHKCl4.754.76
DM (%)68.3669.04
NO3-N (mg kg−1)51.1150.99
NH4+-N (mg kg−1)3.084.35
P (mg kg−1)40.0961.52
K (mg kg−1)105147
OM (mg kg−1)12.0410.91
N (%)0.660.60
C (%)6.826.09
S (%)0.110.08
DN (mg kg−1)110120
DOC (mg kg−1)370387
BD: bulk density; DM: dry matter; OM: organic matter, DN: dissolved nitrogen; DOC: dissolved organic carbon. Italic characters indicate a significant difference (p < 0.05) according to the Wilcoxon signed-rank test.
Table 2. Chemical parameters of the applied slurry (nutrient content values refer to DM part).
DM (%)pH KClNH4-N (mg kg−1)NO3-N (mg kg−1)P (%)K (%)Mg (%)Ca (%)
7.888.0261320.000.962.370.591.42
OM (%)C (%)N (%)S (%)DN (%)DIC (%)DC (%)DOC (%)
70.9742.022.650.751.671.304.703.40
DM: dry matter; OM: organic matter, DN: dissolved nitrogen; DIC: dissolved inorganic carbon; DC: dissolved carbon; DOC: dissolved organic carbon.
Publisher’s Note: MDPI stays neutral with regard to jurisdictional claims in published maps and institutional affiliations.

