Article

Remedial Application of Urea Eliminates Yield Losses in Wheat Waterlogged during Stem Elongation

1
Jiangsu Key Laboratory of Crop Genetics and Physiology, Jiangsu Key Laboratory of Crop Cultivation and Physiology, Agricultural College of Yangzhou University, Yangzhou 225009, China
2
Co-Innovation Center for Modern Production Technology of Grain Crops, Yangzhou University, Yangzhou 225009, China
*
Author to whom correspondence should be addressed.
Agriculture 2020, 10(1), 23; https://doi.org/10.3390/agriculture10010023
Submission received: 22 December 2019 / Revised: 14 January 2020 / Accepted: 16 January 2020 / Published: 19 January 2020
(This article belongs to the Special Issue Innovative Agronomic Practices for Maximizing Crop Growth and Yield)

Abstract

:
Waterlogging remains a critical constraint to wheat production in areas with high rainfall. Exogenous application of nitrogen (N) can effectively diminish the adverse effects of waterlogging, but varies with specific events. To provide highly efficient remedial strategies, this pot study investigated the effects of urea application following 10 days of waterlogging initialing at the stem elongation stage (Zadoks growth stage, GS33). The remedial measures included foliar spray of urea solution at a single dose (0.108 g urea per pot) at the 0th day after finishing waterlogging (FU1) and twice at the 0th and 7th day (FU2), and soil surface spray of urea solution at single and double doses when soil water content was approximately 80% of field capacity (SU1 and SU2, respectively). Waterlogging significantly reduced grain yield, total N uptake, and N partial factor productivity (by 11%, 18%, and 11%, respectively), but subsequent remedial measures improved these to variable degrees. Reduction in grain yield owing to waterlogging could be effectively alleviated and even eliminated using these remediations. Grain yield and N partial factor productivity were higher under FU2 and SU2 than FU1 and SU1. Among all treatments, plants under SU2 exhibited the highest total N uptake and top-dressing N recovery. Diminished yield losses were attributed to (1) increased kernel number per spike resulting from increased spikelet fertility and kernel number per spikelet and (2) increased photosynthetic production by delaying senescence (improved chlorophyll content and maintained green leaf area) of the top leaves. This study suggests that urea application for a brief period of time following waterlogging during the stem elongation stage has remarkable remedial effects.

1. Introduction

Waterlogging is one of the global abiotic stresses that affect crop yield and quality [1,2]. It has been the critical constraint to crop production in the high rainfall zone of China, Australia, United States, Indian, and Pakistan [3,4,5,6]. Globally, soil waterlogging frequently occurs on 12% of arable land, causing about 20% of reported yield losses [7]. Waterlogging affects 10–15 million ha of wheat annually, resulting in 20–50% yield losses [8]. With global climate change, waterlogging events have become more frequent, severe, and unpredictable [9].
The influences of waterlogging on wheat vary with soil property, meteorological condition, cultivar, growth stage, and exposure duration [10,11,12,13]. Waterlogging at the early growth stages reduces tiller number and inhibits spike development [14,15,16]. Short periods of waterlogging have considerable effects on the growth of young wheat plants by reducing root length and leaf nitrogen concentrations [17]. However, this effect can be partially counterbalanced by subsequent long-term growth of roots and shoot recovery and/or the compensation from increasing kernel weight [18,19]. Thus, yield losses at maturity are limited [20,21]. In contrast, the period from stem elongation to anthesis and post-anthesis has been identified as the critical developmental stage when waterlogging negatively affects wheat [22,23]. Previous studies have reported that waterlogging, when implemented at the late phase, reduces spike weight (including kernels per spike and kernel weight) to different degrees [15,22,24,25,26]. Waterlogging also induces senescence of plants and inhibits photosynthesis and respiration in leaves, causing a decrease in photosynthetic products [12,22,27,28,29]. Therefore, breeding and release of waterlogging tolerance cultivars and soil and crop management practices have been seeking to minimize the impact of waterlogging, in particular during the late period, on crop productivity [1,8,10,30].
Nutrient deficiency, in particular reduced nitrogen uptake, is one of the primary effects of waterlogging stress on wheat [31,32,33]. The application of nitrogen fertilizer has been shown to diminish the effects of waterlogging [34,35,36], and increased rates of top-dressed urea significantly increase wheat grain yield on waterlogged soils [33,37]. Compared with the pre-waterlogging application, the application of nitrogen fertilizers during or immediately following waterlogging is less effective in cotton plants due to the inefficient nutrient ion absorption capacity of impaired roots [38]. In contrast, foliar spraying of nutrients could significantly alleviate the adverse effects of waterlogging on barley seedlings by improving nutrient content in plants and reducing leaf senescence [39]. Similarly, the negative effects of waterlogging after the anthesis stage in wheat could be effectively alleviated by nitrogen spraying [40]. Therefore, appropriate application methods, timing, and rate of fertilizer application should be considered in specific waterlogging events to effectively prevent plant damage.
In China, nearly 4 million ha of wheat is sown in the middle and lower reaches of the Yangtze River, where waterlogging events cause a 20% reduction in yield each wet year [41]. In this region, nearly 60% of rainfall during the wheat growth period occurs from the stem elongation to maturity stages (March to May) when abnormal precipitation events significantly reduce wheat grain yield [41,42]. Thus, in this study, waterlogging at the stem elongation stage and subsequent application of urea were conducted to (1) quantify the benefits of urea application; (2) determine the effects of these treatments on yield components and photosynthetic production; and (3) propose effective strategies minimizing damages.

2. Material and Methods

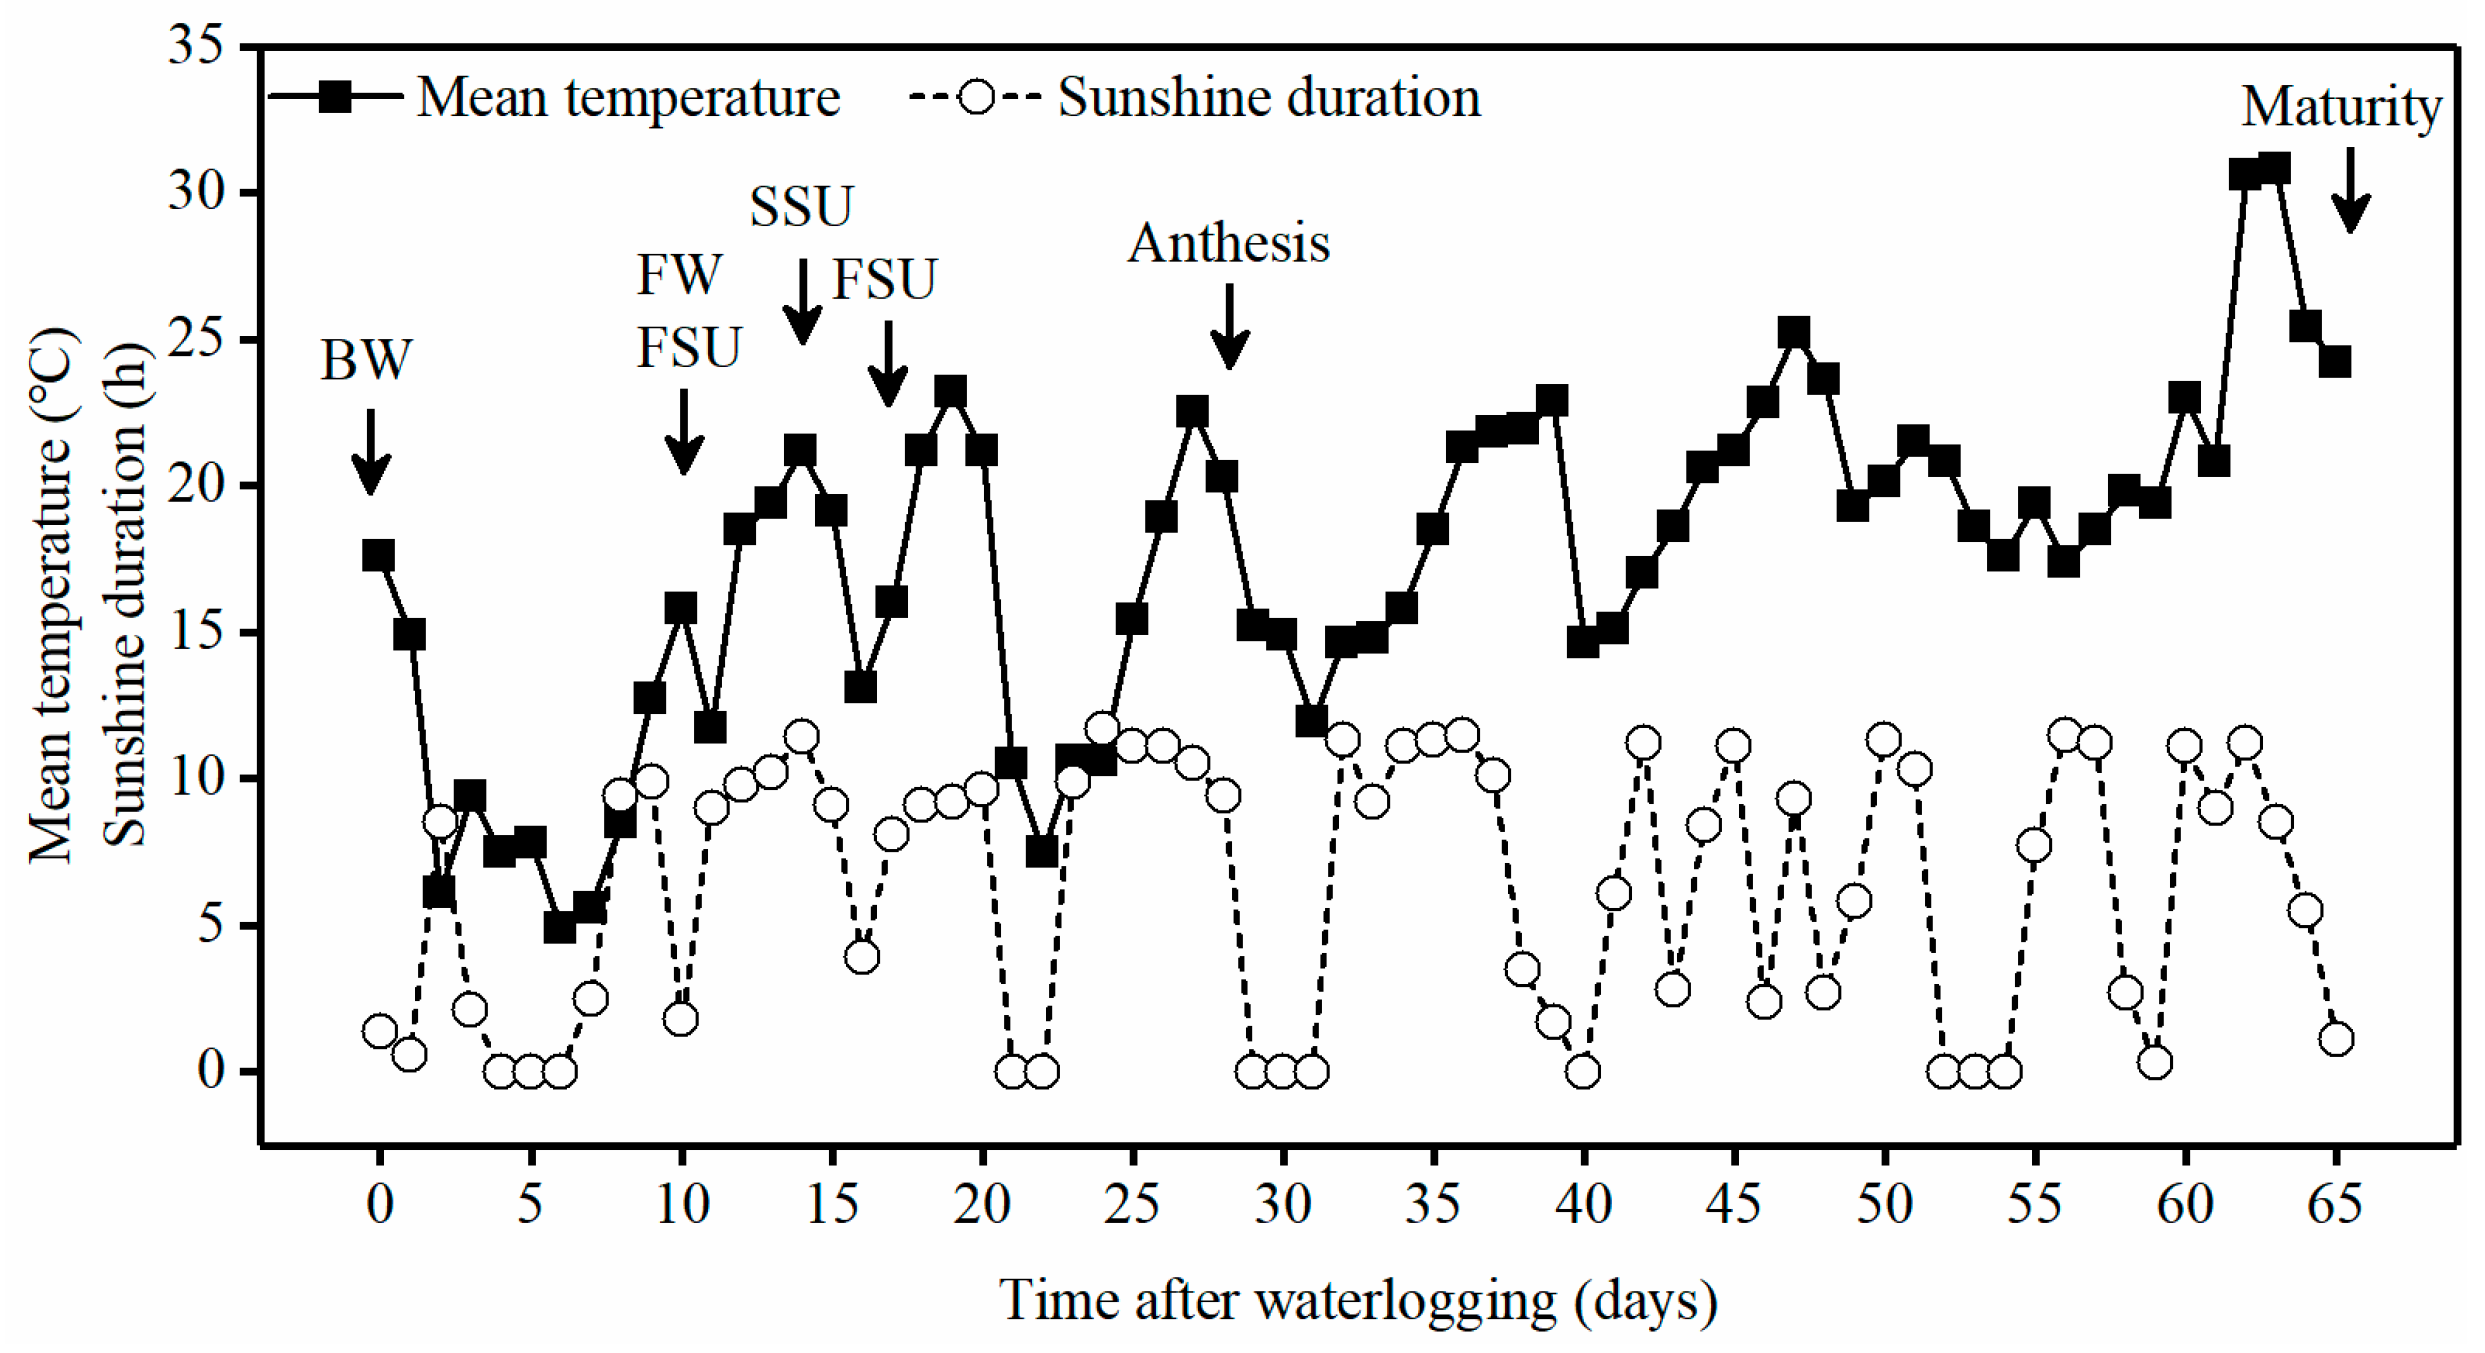
2.1. Growth Conditions

The experiment was conducted from 2017 to 2018 at the Agricultural College of Yangzhou University’s Agricultural Experiment Station (Yangzhou, China), which is located in the middle and lower reaches of the Yangtze River. The tests used polyvinyl chloride pots with a top diameter of 26 cm, a bottom diameter of 18 cm, and a depth of 26 cm. There were eight drainage holes at the base. The upper 0–20 cm of the topsoil was excavated from a local field, dried naturally, and sieved through a 5 mm mesh. Eleven kilograms of the sieved soil was mixed with a pre-prepared 3.3 g inorganic compound fertilizer (containing 15% N, 15% P2O5, and 15% K2O) and 0.66 g urea (containing 46% N). The pots were filled with the soil mixture, watered with 5 L of water, and left for 2–3 days for the soil to settle and for water to drain. The soil was loamy clay. The original soil prior to the experiment contained 11.4 g·kg−1 organic C, 42.3 mg·kg−1 available N, 45.8 mg·kg−1 available P, and 33.9 mg·kg−1 available K.
Eleven wheat seeds were uniformly placed on the soil surface on 3 November 2017, and covered using 1 kg of the original sieved soil. Eight seedlings with similar plant sizes were retained at the three-leaf stage (Zadoks growth stage, GS13). At the four-leaf stage (GS14), each pot was top-dressed with 0.35 g urea, after which 3.3 g compound fertilizer and 0.32 g urea were applied at the stem elongation stage (GS31). Insecticides and fungicides were sprayed to control pests and diseases, but weeds were removed by hand to prevent biotic stresses.
All the pots were placed on flat ground under natural conditions and regularly moved to facilitate drainage. The pots in the water drainage scenario (from sowing to harvest) and the waterlogged pots (before and after the treatments) were kept at 15–20% of the volumetric soil water content (approximately 80% of field capacity) by irrigating as necessary.

2.2. Experiment Design

The experiment used a completely random design. A winter wheat (Triticum aestivum L.) cultivar Yangmai 23 was used as experimental material, which has been widely grown in the middle and lower reaches of the Yangtze River. All pots were divided into 6 groups (treatments) with 12 pots (replicates) each, of which 5 groups were waterlogged for 10 days beginning at the stem elongation stage (GS33). The pots used for waterlogging treatment were moved into a pool (4 m × 1.2 m × 0.3 m), and then a 1–2 cm layer of water was maintained above the soil surface for the entirety of the waterlogging phase. Following waterlogging treatment, the pots were removed from the water to conduct remedial treatments and allowed to drain freely. These six treatments were (1) the water drainage treatment (DR); (2) the waterlogging treatment (WA); (3) foliar spray of a urea solution (containing 0.108 g urea per pot) at the 0th day after finishing waterlogging (FU1); (4) foliar spray of urea solution (containing 0.108 g urea per pot) twice at the 0th day and the 7th day after finishing waterlogging (FU2); (5) soil surface spray of urea solution (containing 0.108 g urea per pot) when soil water content was approximately 80% of the field capacity (the 4th day after finishing waterlogging; SU1); and (6) soil surface spray of urea solution (containing 0.216 g urea per pot) when soil water content was approximately 80% of field capacity (SU2). The urea (containing 46% N) applied after waterlogging was labeled 15N (an isotopic enrichment of 10 atom%, Shanghai Research Institute of Chemical Industry Co. Ltd., Shanghai, China). All urea solutions, containing 0.1% (v/v) Tween 80 as a surfactant, were sprayed at 20 mg per pot each time after sunset. Fifty-milliliter spray bottles were used to spray the solutions evenly on the surface of all leaves or soil. A removable waterproof canopy was used when raining from the end of the waterlogging treatments to the anthesis stage to avoid water from influencing the treatments. The weather data of the experiments and the treatment time points are shown in Figure 1. The times when wheat plants reached the stages of stem elongation (GS33), anthesis (GS60), and maturity (GS92) were 14 March, 10 April, and 18 May 2018, respectively.

2.3. Measurements and Calculations

2.3.1. Chlorophyll Content and Green Leaf Area

Six culms were labeled for each treatment at the day when waterlogging was completed. Chlorophyll content of the labeled top three leaves (full expansion), including flag leaves and the 2nd and 3rd leaves from the top, was measured from the 0th day after waterlogging to the day of leaf yellowing at seven-day intervals, using a (soil and plant analyzer development) SPAD Chlorophyll Meter (SPAD-502 Plus, Konica Minolta Inc., Tokyo, Japan). The three readings of each leaf at the top, center, and bottom, avoiding the central vein, were averaged as a SPAD reading value.
On the same day, when chlorophyll content was measured, the ratio of green leaf area to whole leaf area was estimated and recorded. At the anthesis stage, when plant biomass was measured, the leaf area of the top three leaves of the main stem was separately measured using a leaf area meter (LI-3000, Li-cor Inc., Lincoln, NE, USA). The results showed that the leaf area of the flag leaf and the 2nd and 3rd leaves from the top was similar between treatments. Thus, green leaf area was assessed as the percentage of green leaf area in relation to the whole leaf area.

2.3.2. Biomass

The plants of three pots were harvested at the anthesis (GS60) and maturity (GS92) stages. The dry matter of the aboveground plants was weighed (oven-dried at 75 °C for ∼36 h). The dry matter weight at anthesis and maturity was defined as the pre-anthesis biomass and the total biomass, respectively. The post-anthesis biomass was defined as the difference in biomass between anthesis and maturity.

2.3.3. Grain Yield and Yield Components

At maturity (GS92), spike number was recorded and harvested from five pots. The average number of kernels per spike, spikelets per spike, and fertile spikelets per spike were calculated from all harvested spikes. Next, these spikes were threshed by hand. The number of kernels per pot was counted and weighed to calculate the kernel number per spike and 1000-kernel weight. A grain analyzer (Infratec™ 1241, Foss, Hillerød, Denmark) was used to measure the grain moisture, and then grains were adjusted to 13% moisture. Spikelet fertility was defined as being the number of fertile spikelets divided by the total number of spikelets per spike. The number of kernels per spikelet was defined as being the number of kernels divided by the number of fertile spikelets per spike.

2.3.4. N Uptake, N Efficiency, and 15N Recovery

The samples, which were used to measure biomass at the maturity stages, were oven-dried, ground to a fine powder (sieved using a 0.1-mm mesh size), and analyzed for N concentrations using the indophenol blue method [43] and 15N enrichment using an isotope ratio mass spectrometer (MAT271, Thermo Fisher Scientific, Waltham, MA, USA).
Total N uptake was calculated based on total biomass and N concentration. N partial factor productivity (g·g−1) was defined as dry grain yield divided by total applied N rates.
Recovery and percentage recovery of 15N labeled urea fertilizer (15NREC and %15NREC) were calculated using the formula of Hauck and Bremner [44] as follows:
N 15 = R E C N t × N 15 f p N 15 n f p N 15 f e r t N 15 n f p   and
% N 15 = R E C   N 15 R E C f   × 100 ,
where Nt is total N uptake; 15Nfp, 15Nnfp, and 15Nfert are the 15N enrichment (atom%) in the fertilized plants (under the FU1, FU2, SU1, or SU2 treatments), in the unfertilized plants (under the WA treatment), and in the fertilizer, respectively; and f is the N rate as remedial application.

2.4. Statistical Analysis

Data were analyzed using the software Data Processing System 7.05 (DPS, Shanghai, China). Analysis of variance (ANOVA) was performed to determine the significance according to the model of a completely random design. The least significant difference (LSD) test (p = 0.05) was used to analyze the differences among treatments. Furthermore, Pearson’s correlation was calculated.

3. Results

3.1. Grain Yield and Yield Components

Waterlogging significantly reduced grain yield by 11% (Table 1). Compared with WA, the remedial measures (FU1, FU2, SU1, and SU2) increased grain yield by 6–17%, but significant differences were only found between FU2 and WA and SU2 and WA. Grain yields with these remedial treatments were similar or even slightly higher than that with DR.
There were similar spike numbers per pot among treatments (Table 1). Waterlogging significantly reduced kernel number per spike, but did not affect the 1000-kernel weight. No significant differences in the number of kernels per spike and 1000-kernel weight were observed between WA and FU1. Compared with WA, FU2, SU1, and SU2 exhibited a significant increase in the number of kernels per spike, but their 1000-kernel weight was lower than that of WA. In addition, kernel number per spike with FU2 and SU2 was greatly higher than that with DR. Correlation analyses exhibited that kernel number per spike was significantly related to grain yield under all treatments (r = 0.86, p < 0.05).

3.2. Biomass

Waterlogging stress did not affect biomass before anthesis, but significantly reduced post-anthesis biomass and total biomass (Table 1). Compared with WA, FU1 only increased post-anthesis biomass, but FU2, SU1, and SU2 increased both pre-anthesis and post-anthesis biomass, resulting in higher total biomasses. There were similar pre-anthesis, post-anthesis, and total biomasses between DR and FU1. Additionally, pre-anthesis biomass under FU2, SU1, and SU2 was significantly higher than that under DR. Post-anthesis biomass under FU2 and SU2 was similar to DR, but SU1 was lower. These resulted in total biomass under SU1 and SU2 similar to DR, but that of FU2 was higher than DR. Correlation analyses indicated that post-anthesis biomass and total biomass were significantly and positively related to grain yield under all the treatments (r = 0.87, p < 0.05; r = 0.91, p < 0.01).

3.3. Spike Characters

Waterlogging significantly reduced single spike yield (Table 2). Compared with WA, FU1 and SU2 slightly increased single spike yield, and FU2 greatly increased it. Single spike yield with FU2 and SU2 was similar to DR, whereas that with FU1 and SU1 was lower than DR.
The treatments, including waterlogging and subsequent urea application, did not affect the number of spikelets per spike (Table 2). Waterlogging significantly decreased spikelet fertility and kernel number per spike. The remedial treatments (FU1, FU2, SU1, and SU2) greatly boosted spikelet fertility compared with WA, and spikelet fertility under FU2 and SU2 was even higher than that under DR. Among these treatments, FU2 showed the highest spikelet fertility, followed by SU2. Additionally, kernels per spikelet under FU2 and SU2 were higher than that under both WA and DR. Compared with WA, FU1 only slightly increased kernels per spikelet, but SU1 dramatically increased it, resulting in a non-significant difference between SU1 and DR. Correlation analyses indicated that the improvement in kernel number per spike was strongly related to increased spikelet fertility and kernel number per spikelet (r = 0.92, p < 0.01; r = 0.99, p < 0.01).

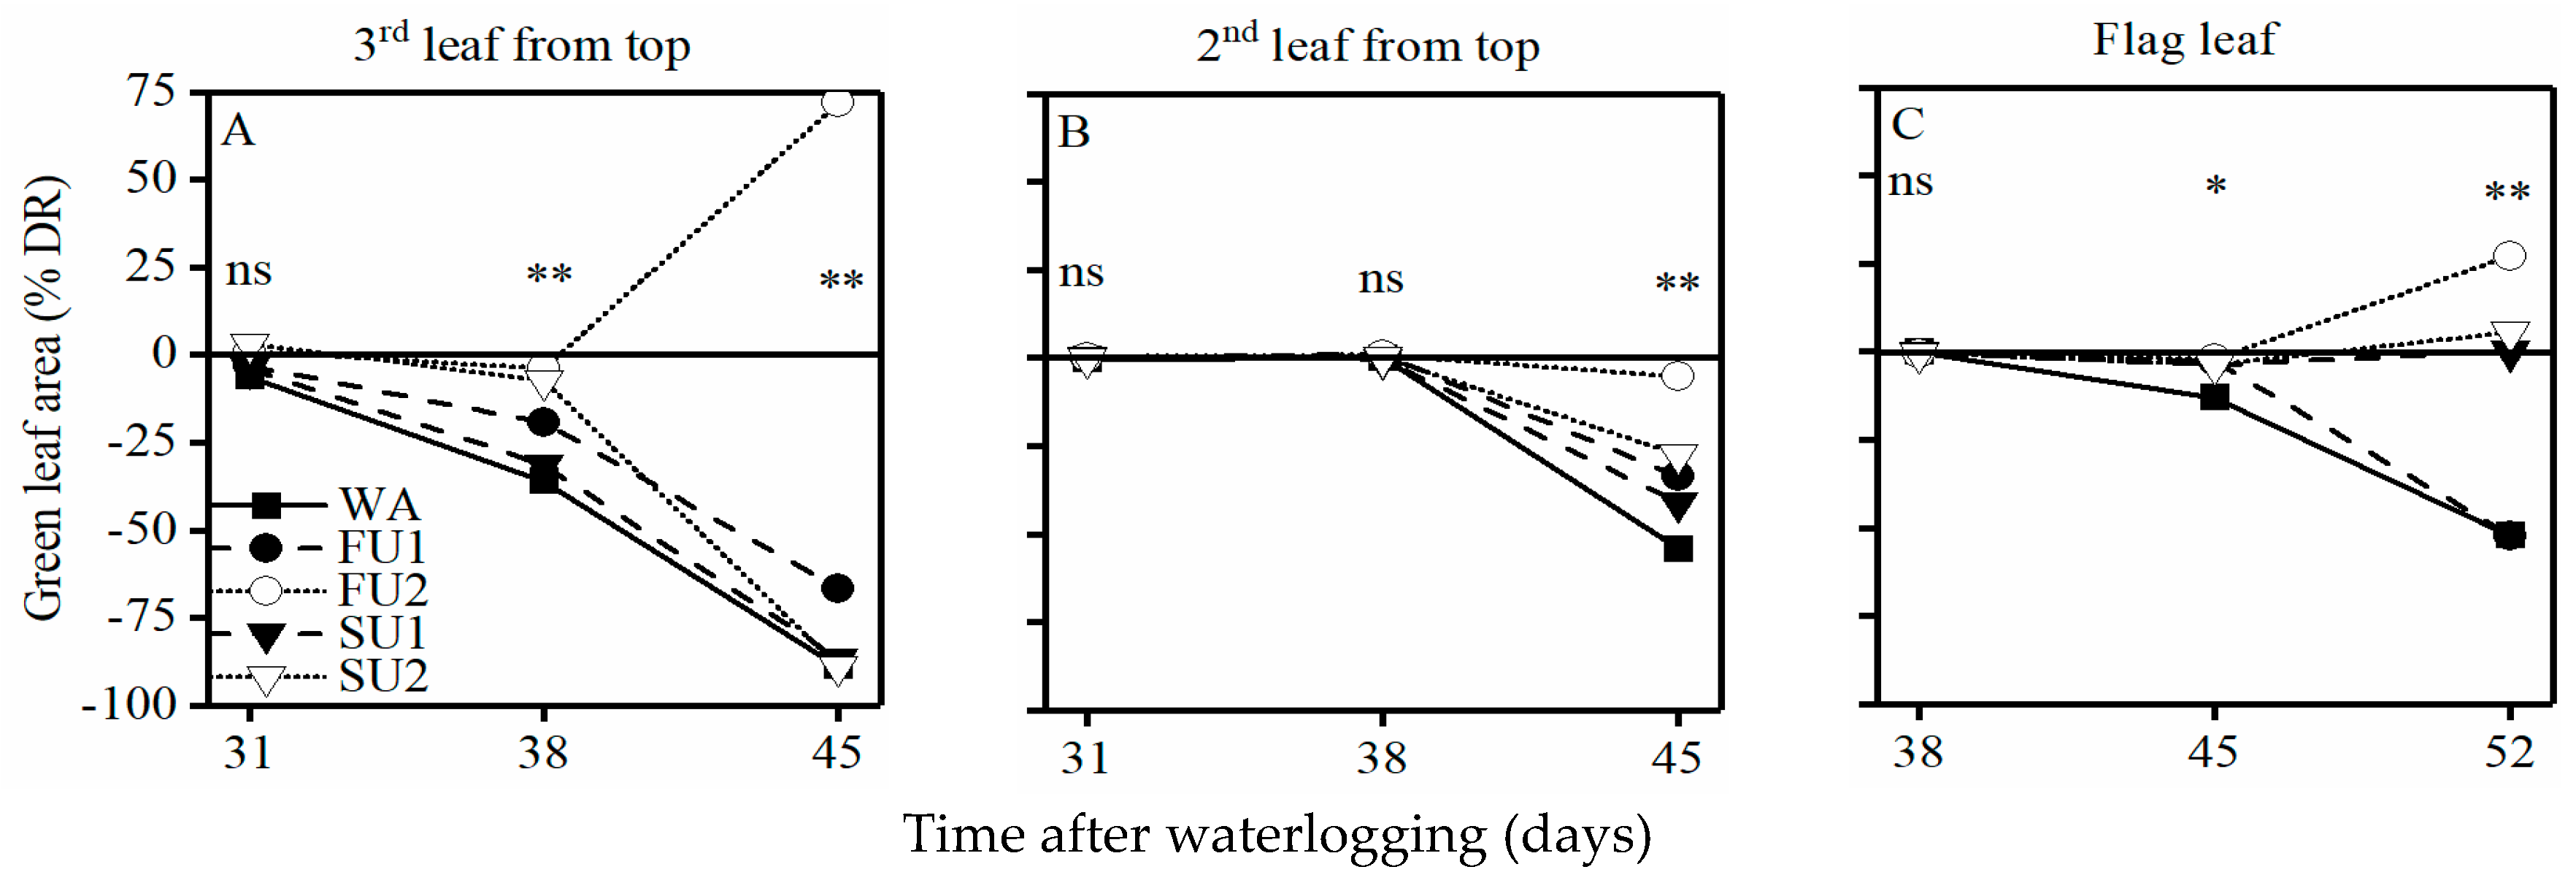
3.4. Green Leaf Area of the Top Three Leaves

The treatments, including waterlogging and subsequent urea application, did not immediately change the green leaf area of the top three leaves (Figure 2). Until the 38th, 45th, and 45th day after waterlogging, the green leaf area of the 3rd, 2nd, and 1st (flag leaf) leaf from the top began to exhibit changes. Waterlogging substantially decreased the green leaf area of the leaves, but subsequent remedial measures improved these to varying degrees, which was dependent on leaf position and measuring time. Compared with WA, SU1 did not obviously improve the green leaf area of the 3rd leaf from the top. FU1 exhibited a significant improvement in green leaf area, but was still lower than that under DR. SU2 maintained its green leaf area at the DR level only within a short time (at the 38th day after waterlogging). FU2 had an equivalent or higher green leaf area relative to DR. The remedial treatments (FU1, FU2, SU1, and SU2) significantly improved the green area leaf of the 2nd leaf from the top, but only the plants under SU2 showed an equivalent area with DR. At the 45th day after waterlogging, the green area leaf of flag leaf under all the remedial treatments was similar to DR. When measuring on the 52nd day after waterlogging, the green leaf area of the flag leaves under SU1 and SU2 was still similar to DR, and FU2 was higher than DR, whereas FU1 was lower than DR.
Correlation analyses (Table 3) showed that post-anthesis biomass was closely related to the green leaf area of the 3rd, 2nd, and 1st leaves from the top, which were measured on the 38th, 45th, and 45th day after waterlogging, respectively. In addition, the green leaf area of the flag leaf, which was measured on the 52nd day after waterlogging, was positively correlated with spikelet fertility, the number of kernels per spikelet, and the number of kernels per spike.

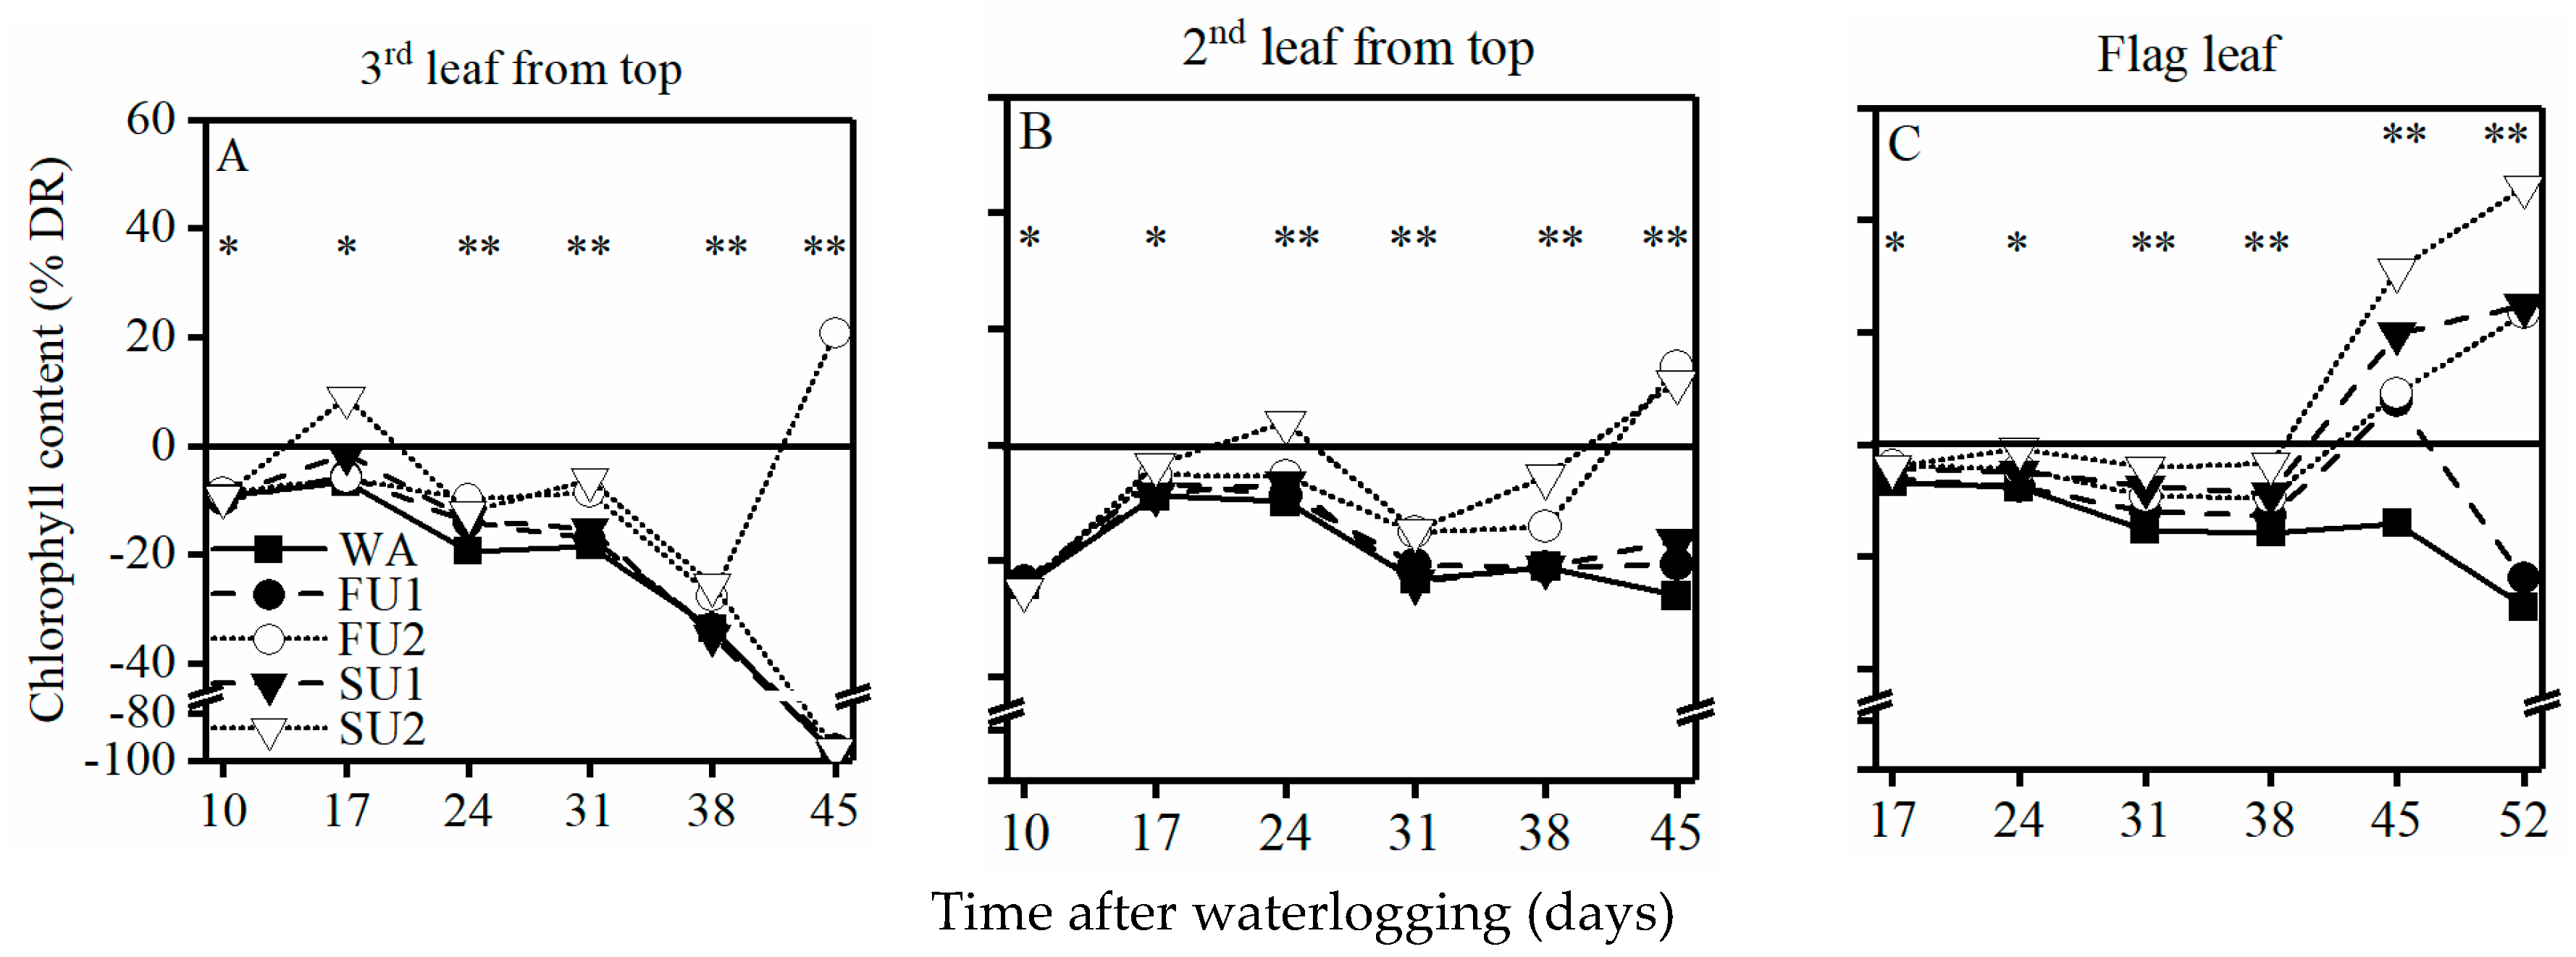
3.5. Chlorophyll Content of the Top Three Leaves

The chlorophyll content of the top three leaves (after the finishing of waterlogging) was significantly affected by the treatments (Figure 3). Waterlogging significantly decreased the chlorophyll content of the leaves, and the reduction increased over time. The remedial measures after waterlogging (FU1, FU2, SU1, and SU2) resulted in an increase in chlorophyll content to varying degrees, which was dependent on leaf position and time point. Compared with WA, FU1 and SU1 did not exhibit a significant improvement in chlorophyll content in the top three leaves, with a few exceptions. The chlorophyll content of the flag leaves, which was measured on the 45th day after waterlogging, was considerably higher under FU1 and SU1 than WA and DR, which were measured on the 52nd day after waterlogging, and was still higher under SU1 than WA and DR. Compared with WA, FU2 improved the chlorophyll content of the top leaves during senescence (from the 31st to 45th day after waterlogging for the 3rd and 2nd leaves from the top, and from the 45th to 52nd day after waterlogging for the flag leaves). Also, the top three leaves of FU2 relative to DR showed higher chlorophyll content on the 45th day after waterlogging and that of the flag leaves on the 52nd day after waterlogging. Among these remedial treatments, SU2 improves the chlorophyll content of the top leaves much earlier (from the 17th to 38th, 24th to 45th, and 24th to 52nd day after waterlogging for the 3rd, 2nd, and 1st leaves from the top, respectively). Compared with DR, the top two leaves of SU2 showed a higher chlorophyll content only at their senescence/late phase (the 2nd leaf from the top on the 45th day after waterlogging and flag leaf on the 45th and 52nd day after waterlogging).
Correlation analyses (Table 4) showed that the chlorophyll content of the 2nd leaf from the top and flag leaf, which was measured separately on the 45th and 52nd day after waterlogging, was positively correlated with spikelet fertility, the number of kernels per spikelet, and the number of kernels per spike.

3.6. N Uptake, N Efficiency, 15NREC, and %15NREC

Waterlogging significantly reduced total N uptake by 18% and N partial factor productivity by 11% (Table 5). The remedial treatments (FU1, FU2, SU1, and SU2) significantly improved total N uptake (by 7–36%) compared with WA, but only SU2 was significantly higher than DR. Also, total N uptake with FU2 was similar with DR. Furthermore, FU1 and SU1 just slightly increased N partial factor productivity (both by 3%) relative to WA, and FU2 and SU2 effectively promoted (by 17% and 12%) it, thereby resulting in an equivalent value with DR.
Marked differences were observed in 15NREC between different remedial treatments. Among these treatments, SU2 showed the highest 15NREC, followed by FU2, and FU1 had the lowest. There was a similar %15NREC between SU1 and SU2, which was significantly higher than FU1 and FU2. Compared with FU1, %15NREC under FU2 was higher.

4. Discussion

Owing to strong denitrification and leaching in waterlogged soils, there was low available nitrogen in soil, adversely affecting plant growth [31,45]. Therefore, grain yield and nutrient uptake decreased [32,34,46], causing low efficient use of applied fertilizers. Unused nitrogen likely harms the environment through leaching of nitrate into groundwater, surface run-off, and eutrophication of aquatic ecosystems [47]. The results of the present study were concordant with those of previous studies, showing that waterlogging significantly reduced grain yield, total N uptake, and N partial factor productivity (Table 1 and Table 5).
To reduce yield losses, additional fertilizer inputs have been attempted at different time points before and after waterlogging. Nguyen et al. [48] showed that cotton yield losses caused by waterlogging could not fully be counteracted by the high rates of N fertilizer applied once before planting. Similar results were obtained by Robertson et al. [33], who considered that high N applied at sowing did not affect grain yield of waterlogged wheat, but N application after waterlogging could reduce the detrimental effect of waterlogging. In the field where waterlogging events are not frequent, split N applied at the critical growth stages exhibited equivalent effects with applying N after waterlogging [35], but when waterlogging occurs more frequently or at the late growth stage (after anthesis), the effects of splitting N application on alleviating the damages were not significant [34,35]. N by foliar spraying, when waterlogging was implemented after anthesis, could effectively alleviate wheat yield losses [40]. Our study showed that foliar and soil surface spray of urea solution after waterlogging prevent yield loss, which was caused by waterlogging during the stem elongation stage (Table 1). Compared with low doses of urea application, the grain yield of waterlogged wheat could be better alleviated by increased doses, resulting in slightly higher grain yield compared with natural control.
Moreover, the remedial applications of urea significantly improved total N uptake in waterlogged plants (Table 5). With increased application rates, total N uptake and applied N recovery (15NREC) significantly improved, especially by directly applying in soil, indicating that roots remain highly active in absorbing N after waterlogging. Although the root system capacity of recovery after waterlogging was lower than that of shoots [18], root growth and vigor showed significant recovery after the termination of waterlogging [49]. Waterlogging resulted in the death of seminal roots and restriction of adventitious roots and axile root length in wheat, but induced the development of surface adventitious and axile roots [30,31]. Therefore, a possible root vigor recovery and/or surface root growth may facilitate the uptake of applied N in soil. In addition, Pang et al. [39] reported that spraying of foliar nutrients promotes the growth of adventitious roots and plant nutrients in barley.
The results of the present study revealed that N applied to soil could be absorbed at higher quantities compared with foliar application, but there was a similar N partial factor productivity between two types of applications (Table 5). This indicates that foliar spraying allows nutrients to be utilized efficiently, and soil application allows the nutrient to be absorbed efficiently. In the case of foliar application, the nutrients penetrate the cuticle of the leaves or the stomata and then enter the cells, thus improving utilization efficiency [50]. Also, the percentage recovery of applied N (%15NREC) was lower using foliar spray than soil face spray (Table 5), possibly owing to low absorption capacity of old leaves, stems, leaf sheaths, and spikes.
Previous studies have reported that waterlogging during stem elongation reduces wheat yield mainly owing to a reduction in grain number [23,24], which is mostly the result of a decrease in kernel number per spike [23]. This study observed that waterlogging greatly reduced kernel number per spike, but did not affect spike number and kernel weight (Table 1). However, Araki et al. [22] considered that waterlogging during stem elongation mainly decreased kernel weight, causing yield losses. These results may have thus varied with waterlogging methods and cultivars. Our remedial measures could increase kernel number per spike, but also decrease kernel weight to different degrees (Table 1). The increase in kernel number per spike was the result of improved spikelet fertility and the number of kernels per spikelet (Table 2). One explanation for these results is that urea application improved grain-filling in inferior grains, causing an increase in the number of kernels with poor filling and a decrease in the average kernel weight. Additionally, the present study showed that the application of high doses of urea (FU2 and SU2) achieved higher spikelet fertility, number of kernels per spikelet, and number of kernels per spike relative to natural control (Table 1 and Table 2). In this study, the application time of urea after waterlogging was close to the early-booting stage (flag leaf visible), when top-dressing fertilizers facilitate the improvement of kernel number per spike [51].
Waterlogging stress adversely affects leaf photosynthetic capacity, accelerates leaf senescence, and reduces photoassimilate accumulation [12,13,22]. This study showed that waterlogging significantly decreased the chlorophyll content of the top three leaves after the stress and their green leaf area during the senescence phase (Figure 2 and Figure 3), leading to a reduction of post-anthesis biomass. Although waterlogging reduced the chlorophyll content in the leaves before anthesis (the 28th day after waterlogging), these reductions did not affect pre-anthesis biomass (Table 1). Remedial measures improved the chlorophyll content of leaves before anthesis to varying degrees, but not significantly higher than the natural control, although pre-anthesis biomass under some measures (FU2, SU1, and SU2) exhibited a significant improvement compared with the natural control. We observed that leaves under remedial measures relative to the natural control exhibited a higher chlorophyll content along with the maintenance and even improvement of the green leaf area during senescence. In addition, the green leaf area of the top leaves at the aging stage was closely related to post-anthesis biomass (Table 3). These results indicated that urea application facilitated in delaying the senescence of old leaves, thereby improving pre-anthesis and post-anthesis biomass of waterlogged plants as a consequence of boosted photosynthesis. Similar results were reported by Pang et al. [39], who described the beneficial effects of nutrient sprays, which included reduced leaf senescence and increased chlorophyll net CO2 assimilation and photochemical efficiency of (Photosystem II) PSII compared with waterlogged plants with no added foliar nutrients. In addition, Jiang et al. [34] considered that the application of high concentrations of N fertilizers under post-anthesis waterlogging could increase N content in the flag leaves.
Moreover, this study indicated that increased doses of urea application better maintained the green leaf area of leaves, as well as rapidly improved their chlorophyll content (Figure 2 and Figure 3). Compared with the natural control, foliar spraying of urea at a high dose (FU2) after waterlogging resulted in a significant increase in green leaf area and chlorophyll content of the top three leaves at their senescence late phase, while soil application of urea at a high dose (SU2) only delayed the senescence of the top two leaves. These differences between foliar spraying and soil application of urea likely resulted in varying biomass, spike characteristics, and grain yield. Further studies are required to verify the effects of these remedial measures in the field.

5. Conclusions

Waterlogging during the stem elongation stage significantly decreases grain yield, N uptake, and N partial factor productivity, adversely affecting the economic and environmental benefit of wheat production. Foliar spraying or soil application of urea for a brief period following waterlogging events can delay the senescence of aging leaves, effectively alleviating yield losses through improved photosynthetic accumulation and the number and filling of inferior grains.

Author Contributions

Methodology, J.D.; formal analysis, J.D.; investigation, P.L., D.G., D.L., and M.Y.; resources, C.L.; writing—original draft preparation, J.D.; writing—review and editing, M.Z. and X.Z.; supervision, W.G.; project administration, J.D. and W.G. All authors have read and agreed to the published version of the manuscript.

Funding

This work was supported by the National Key Research and Development Program of China (2016YFD0300405); the National Natural Science Foundation of China (31401317; 31771711); Jiangsu Modern Agricultural (Wheat) Industry Technology System; the Priority Academic Program Development of Jiangsu Higher Education Institutions; Jiangsu Overseas Visiting Scholar Program for University Prominent Yong & Middle-aged Teachers; and Academic Science and Technology Innovation Project for Students of Yangzhou University.

Conflicts of Interest

The authors declare no conflict of interest.

References

  1. Manik, S.N.; Pengilley, G.; Dean, G.; Field, B.; Shabala, S.; Zhou, M. Soil and crop management practices to minimize the impact of waterlogging on crop productivity. Front. Plant Sci. 2019, 10, 140. [Google Scholar] [CrossRef] [PubMed] [Green Version]
  2. Zhou, Q.; Huang, M.; Huang, X.; Liu, J.; Wang, X.; Cai, J.; Dai, T.; Cao, W.; Jiang, D. Effect of post-anthesis waterlogging on biosynthesis and granule size distribution of starch in wheat grains. Plant Physiol. Biochem. 2018, 132, 222–228. [Google Scholar] [CrossRef] [PubMed]
  3. Acuña, T.B.; Dean, G.; Riffkin, P. Constraints to achieving high potential yield of wheat in a temperate, high-rainfall environment in south-eastern Australia. Crop Pasture Sci. 2011, 62, 125–136. [Google Scholar] [CrossRef]
  4. Ding, J.; Liang, P.; Wu, P.; Zhu, M.; Li, C.; Zhu, X.; Chen, Y.; Guo, W. Effects of waterlogging on grain yield and associated traits of historic wheat cultivars in the middle and lower reaches of the Yangtze River, China. Field Crops Res. 2020, 246, 107695. [Google Scholar] [CrossRef]
  5. Yaduvanshi, N.P.S.; Setter, T.L.; Sharma, S.K.; Singh, K.N.; Kulshreshtha, N. Influence of waterlogging on yield of wheat (Triticum aestivum), redox potentials, and concentrations of microelements in different soils in India and Australia. Soil Res. 2012, 50, 489–499. [Google Scholar] [CrossRef]
  6. Intergovernmental Panel on Climate Change. Expert Reviewers, Government Reviewers and Other Scientific Advisors of the IPCC WGIII Fifth Assessment Report. In Climate Change 2014: Mitigation of Climate Change: Working Group III Contribution to the IPCC Fifth Assessment Report; Cambridge University Press: Cambridge, UK, 2015; pp. 1371–1414. [Google Scholar] [CrossRef] [Green Version]
  7. Setter, T.L.; Waters, I. Review of prospects for germplasm improvement for waterlogging tolerance in wheat, barley and oats. Plant Soil 2003, 253, 1–34. [Google Scholar] [CrossRef]
  8. Hossain, M.A.; Uddin, S.N. Mechanisms of waterlogging tolerance in wheat: Morphological and metabolic adaptations under hypoxia or anoxia. Aust. J. Crop Sci. 2011, 5, 1094. [Google Scholar]
  9. Liu, C.; Allan, R.P. Observed and simulated precipitation responses in wet and dry regions 1850–2100. Environ. Res. Lett. 2013, 8, 034002. [Google Scholar] [CrossRef]
  10. Setter, T.L.; Waters, I.; Sharma, S.K.; Singh, K.N.; Kulshreshtha, N.; Yaduvanshi, N.P.S.; Ram, P.C.; Singh, B.N.; Rane, J.; Khabaz-Saberi, G.M.H.; et al. Review of wheat improvement for waterlogging tolerance in Australia and India: The importance of anaerobiosis and element toxicities associated with different soils. Ann. Bot. 2008, 103, 221–235. [Google Scholar] [CrossRef] [Green Version]
  11. Saqib, M.; Akhtar, J.; Qureshi, R.H.; Nasim, M. Selection and characterization of wheat genotypes for saline soils prone to water-logging. J. Plant Nutr. Soil Sci. 2013, 176, 131–137. [Google Scholar] [CrossRef]
  12. Shao, G.C.; Lan, J.J.; Yu, S.E.; Liu, N.; Guo, R.Q.; She, D.L. Photosynthesis and growth of winter wheat in response to waterlogging at different growth stages. Photosynthetica 2013, 51, 429–437. [Google Scholar] [CrossRef]
  13. Wu, X.; Tang, Y.; Li, C.; McHugh, A.D.; Li, Z.; Wu, C. Individual and combined effects of soil waterlogging and compaction on physiological characteristics of wheat in southwestern China. Field Crops Res. 2018, 215, 163–172. [Google Scholar] [CrossRef]
  14. De San Celedonio, R.P.; Abeledo, L.G.; Brihet, J.M.; Miralles, D.J. Waterlogging affects leaf and tillering dynamics in wheat and barley. J. Agron. Crop Sci. 2016, 202, 409–420. [Google Scholar] [CrossRef]
  15. De San Celedonio, R.P.; Abeledo, L.G.; Miralles, D.J. Physiological traits associated with reductions in grain number in wheat and barley under waterlogging. Plant Soil 2018, 429, 469–481. [Google Scholar] [CrossRef]
  16. Pampana, S.; Masoni, A.; Arduini, I. Grain yield of durum wheat as affected by waterlogging at tillering. Cereal Res. Commun. 2016, 44, 706–716. [Google Scholar] [CrossRef] [Green Version]
  17. Malik, A.I.; Colmer, T.D.; Lambers, H.; Setter, T.L.; Schortemeyer, M. Short-term waterlogging has long-term effects on the growth and physiology of wheat. New Phytol. 2002, 153, 225–236. [Google Scholar] [CrossRef]
  18. De San Celedonio, R.P.; Abeledo, L.G.; Mantese, A.I.; Miralles, D.J. Differential root and shoot biomass recovery in wheat and barley with transient waterlogging during preflowering. Plant Soil 2017, 417, 481–498. [Google Scholar] [CrossRef]
  19. Collaku, A.; Harrison, S.A. Heritability of waterlogging tolerance in wheat. Crop Sci. 2005, 45, 722–727. [Google Scholar] [CrossRef] [Green Version]
  20. Dickin, E.; Bennett, S.; Wright, D. Growth and yield responses of UK wheat cultivars to winter waterlogging. J. Agric. Sci. 2009, 147, 127–140. [Google Scholar] [CrossRef]
  21. Dickin, E.; Wright, D. The effects of winter waterlogging and summer drought on the growth and yield of winter wheat (Triticum aestivum L.). Eur. J. Agron. 2008, 28, 234–244. [Google Scholar] [CrossRef]
  22. Araki, H.; Hamada, A.; Hossain, M.A.; Takahashi, T. Waterlogging at jointing and/or after anthesis in wheat induces early leaf senescence and impairs grain filling. Field Crops Res. 2012, 137, 27–36. [Google Scholar] [CrossRef]
  23. De San Celedonio, R.P.; Abeledo, L.G.; Miralles, D.J. Identifying the critical period for waterlogging on yield and its components in wheat and barley. Plant Soil 2014, 378, 265–277. [Google Scholar] [CrossRef]
  24. Ding, J.; Huang, Z.; Zhu, M.; Li, C.; Zhu, X.; Guo, W. Does cyclic water stress damage wheat yield more than a single stress? PLoS ONE 2018, 13, e0195535. [Google Scholar] [CrossRef] [Green Version]
  25. Brisson, N.; Rebiere, B.; Zimmer, D.; Renault, P. Response of the root system of a winter wheat crop to waterlogging. Plant Soil 2002, 243, 43–55. [Google Scholar] [CrossRef]
  26. Arguello, M.N.; Mason, R.E.; Roberts, T.L.; Subramanian, N.; Acuna, A.; Addison, C.K.; Lozada, D.N.; Miller, R.G.; Gbur, E. Performance of soft red winter wheat subjected to field soil waterlogging: Grain yield and yield components. Field Crops Res. 2016, 194, 57–64. [Google Scholar] [CrossRef] [Green Version]
  27. Tan, W.; Liu, J.; Dai, T.; Jing, Q.; Cao, W.; Jiang, D. Alterations in photosynthesis and antioxidant enzyme activity in winter wheat subjected to post-anthesis waterlogging. Photosynthetica 2008, 46, 21–27. [Google Scholar] [CrossRef]
  28. Hossain, M.A.; Araki, H.; Takahashi, T. Poor grain filling induced by waterlogging is similar to that in abnormal early ripening in wheat in Western Japan. Field Crops Res. 2011, 123, 100–108. [Google Scholar] [CrossRef]
  29. Li, H.; Cai, J.; Liu, F.; Jiang, D.; Dai, T.; Cao, W. Generation and scavenging of reactive oxygen species in wheat flag leaves under combined shading and waterlogging stress. Funct. Plant Biol. 2012, 39, 71–81. [Google Scholar] [CrossRef]
  30. Herzog, M.; Striker, G.G.; Colmer, T.D.; Pedersen, O. Mechanisms of waterlogging tolerance in wheat–a review of root and shoot physiology. Plant Cell Environ. 2016, 39, 1068–1086. [Google Scholar] [CrossRef]
  31. Nguyen, L.T.; Osanai, Y.; Anderson, I.C.; Bange, M.P.; Tissue, D.T.; Singh, B.K. Flooding and prolonged drought have differential legacy impacts on soil nitrogen cycling, microbial communities and plant productivity. Plant Soil 2018, 431, 371–387. [Google Scholar] [CrossRef]
  32. Harris, R.H.; Armstrong, R.D.; Wallace, A.J.; Belyaeva, O.N. Effect of nitrogen fertiliser management on soil mineral nitrogen, nitrous oxide losses, yield and nitrogen uptake of wheat growing in waterlogging-prone soils of south-eastern Australia. Soil Res. 2016, 54, 619–633. [Google Scholar] [CrossRef] [Green Version]
  33. Robertson, D.; Zhang, H.; Palta, J.A.; Colmer, T.; Turner, N.C. Waterlogging affects the growth, development of tillers, and yield of wheat through a severe, but transient, N deficiency. Crop Pasture Sci. 2009, 60, 578–586. [Google Scholar] [CrossRef]
  34. Jiang, D.; Fan, X.; Dai, T.; Cao, W. Nitrogen fertiliser rate and post-anthesis waterlogging effects on carbohydrate and nitrogen dynamics in wheat. Plant Soil 2008, 304, 301–314. [Google Scholar] [CrossRef]
  35. Simpson, N.L.; Brennan, R.F.; Anderson, W.K. Grain yield increases in wheat and barley to nitrogen applied after transient waterlogging in the high rainfall cropping zone of western Australia. J. Plant Nutr. 2016, 39, 974–992. [Google Scholar] [CrossRef]
  36. Zheng, W.; Liu, Z.; Zhang, M.; Shi, Y.; Zhu, Q.; Sun, Y.; Zhou, H.; Li, C.; Yang, Y.; Geng, J. Improving crop yields, nitrogen use efficiencies, and profits by using mixtures of coated controlled-released and uncoated urea in a wheat-maize system. Field Crops Res. 2017, 205, 106–115. [Google Scholar] [CrossRef]
  37. Swarup, A.; Sharma, D. Influence of top-dressed nitrogen in alleviating adverse effects of flooding on growth and yield of wheat in a sodic soil. Field Crops Res. 1993, 35, 93–100. [Google Scholar] [CrossRef]
  38. Najeeb, U.; Bange, M.P.; Tan, D.K.; Atwell, B.J. Consequences of waterlogging in cotton and opportunities for mitigation of yield losses. AoB Plants 2015, 7, plv080. [Google Scholar] [CrossRef]
  39. Pang, J.; Ross, J.; Zhou, M.; Mendham, N.; Shabala, S. Amelioration of detrimental effects of waterlogging by foliar nutrient sprays in barley. Funct. Plant Biol. 2007, 34, 221–227. [Google Scholar] [CrossRef]
  40. Wu, J.D.; Li, J.C.; Wei, F.Z.; Wang, C.Y.; Zhang, Y.; Sun, G. Effects of nitrogen spraying on the post-anthesis stage of winter wheat under waterlogging stress. Acta Physiol. Plant. 2014, 36, 207–216. [Google Scholar] [CrossRef]
  41. Cheng, S.; Guo, W.; Wang, L. Wheat in South China; Jiangsu Science and Technology Press: Nanjing, China, 2012. [Google Scholar]
  42. Chen, Y.; Huang, J.; Song, X.; Gao, P.; Wan, S.; Shi, L.; Wang, X. Spatiotemporal Characteristics of Winter Wheat Waterlogging in the Middle and Lower Reaches of the Yangtze River, China. Adv. Meteorol. 2018, 2018, 3542103. [Google Scholar] [CrossRef] [Green Version]
  43. Scheiner, D. Determination of ammonia and Kjeldahl nitrogen by indophenol method. Water Res. 1976, 10, 31–36. [Google Scholar] [CrossRef]
  44. Hauck, R.D.; Bremner, J.M. Use of tracers for soil and fertilizer nitrogen research. Adv. Agron. 1976, 28, 219–266. [Google Scholar] [CrossRef]
  45. Bronson, K.F.; Fillery, I.R.P. Fate of nitrogen-15-labelled urea applied to wheat on a waterlogged texture-contrast soil. Nutr. Cycl. Agroecosyst. 1998, 51, 175–183. [Google Scholar] [CrossRef]
  46. Ren, B.; Dong, S.; Zhao, B.; Liu, P.; Zhang, J. Responses of nitrogen metabolism, uptake and translocation of maize to waterlogging at different growth stages. Front. Plant Sci. 2017, 8, 1216. [Google Scholar] [CrossRef] [Green Version]
  47. Camargo, J.A.; Alonso, Á. Ecological and toxicological effects of inorganic nitrogen pollution in aquatic ecosystems: A global assessment. Environ. Int. 2006, 32, 831–849. [Google Scholar] [CrossRef]
  48. Nguyen, T.N.; Tuan, P.A.; Mukherjee, S.; Son, S.; Ayele, B.T. Hormonal regulation in adventitious roots and during their emergence under waterlogged conditions in wheat. J. Exp. Bot. 2018, 69, 4065–4082. [Google Scholar] [CrossRef]
  49. Liu, R.; Yang, C.; Zhang, G.; Zhang, L.; Yang, F.; Guo, W. Root recovery development and activity of cotton plants after waterlogging. Agron. J. 2015, 107, 2038–2046. [Google Scholar] [CrossRef]
  50. Fageria, N.K.; Filho, M.B.; Moreira, A.; Guimarães, C.M. Foliar fertilization of crop plants. J. Plant Nutr. 2009, 32, 1044–1064. [Google Scholar] [CrossRef]
  51. Demotes-Mainard, S.; Jeuffroy, M.H.; Robin, S. Spike dry matter and nitrogen accumulation before anthesis in wheat as affected by nitrogen fertilizer: Relationship to kernels per spike. Field Crops Res. 1999, 64, 249–259. [Google Scholar] [CrossRef]
Figure 1. Mean temperature and sunshine duration per day from the beginning of the waterlogging treatment to the maturity stage. Arrows indicate treatment times and the anthesis and maturity stages, where BW and FW refer to the beginning and the finishing of the waterlogging treatment, respectively; FSU stands for the time of foliar spray of the urea solution; and SSU is the time of soil surface spray of the urea solution.
Agriculture 10 00023 g001
Figure 2. Variations in green leaf area of (A) the 3rd leaf from the top, (B) the 2nd leaf from the top, and (C) flag leaf relative to the water drainage treatment (DR) for different remedial treatments after waterlogging. ns, *, and ** indicate the non-significant difference and the significant difference at p < 0.05 and p < 0.01, respectively, in the green leaf area among the water drainage treatment (DR), the waterlogging treatment (WA), and the remedial treatments (FU1, FU2, SU1, and SU2).
Agriculture 10 00023 g002
Figure 3. Variation in chlorophyll content of (A) the 3rd leaf from the top, (B) the 2nd leaf from the top, and (C) flag leaf relative to the water drainage treatment (DR) for different remedial treatments after waterlogging. ns, *, and ** indicate the non-significant difference and the significant difference at p < 0.05 and p < 0.01, respectively, in the chlorophyll content after the water drainage treatment (DR), the waterlogging treatment (WA), and the remedial treatments (FU1, FU2, SU1, and SU2).
Agriculture 10 00023 g003
Table 1. Effects of urea applied after waterlogging on grain yield, yield components, and biomass in wheat. DR, water drainage treatment; WA, waterlogging treatment.
TreatmentsSpikes per PotKernels per Spike1000-Kernel Weight (g)Grain Yield (g pot−1)Biomass (g·pot−1)
Pre-AnthesisPost-AnthesisTotal
DR34 a 142 bc46 a66 ab90 b33 ab123 bc
WA36 a35 d46 a59 c90 b22 d112 d
FU136 a37 cd47 a62 bc91 b31 bc121 c
FU237 a49 a39 b73 a96 a38 a133 a
SU138 a45 b36 c62 bc97 a28 c124 bc
SU238 a51 a35 c69 ab97 a30 bc127 b
1 Different letters indicate statistical significance at the p < 0.05 level.
Table 2. Effects of urea applied after waterlogging on single spike yield, spikelets per spike, fertile spikelet, and kernels per spikelet.
TreatmentsSingle Spike YieldSpikelets per SpikeSpikelet Fertility (%)Kernels per Spikelet
DR1.9 a 119 a89 c2.2 b
WA1.6 b19 a75 e1.9 c
FU11.7 b19 a78 d2.0 c
FU21.9 a19 a94 a2.7 a
SU11.6 b18 a88 c2.4 ab
SU21.8 ab19 a91 b2.7 a
1 Different letters indicate statistical significance at the p < 0.05 level.
Table 3. Correlation coefficients of spikelet fertility, kernels per spikelet, kernels per spike, and post-anthesis biomass with green leaf area of the top three leaves.
Time after Waterlogging (Days)Spikelet FertilityKernels per SpikeletKernels per SpikePost-Anthesis Biomass
3rd leaf from top
310.80 10.790.800.73
380.700.550.570.86 *
450.570.440.420.80
2nd leaf from top
310.760.630.580.64
38−0.08−0.11−0.060.48
450.710.490.490.91 *
Flag leaf
38−0.22−0.34−0.38−0.40
450.660.430.430.86 *
520.98 ** 20.92 **0.90 *0.71
1 The data are the r values. 2 * and ** indicate significance at p < 0.05 and p < 0.01, respectively.
Table 4. Correlation coefficients of spikelet fertility, kernels per spikelet, kernels per spike, and post-anthesis biomass with chlorophyll content of the top three leaves.
Time after Waterlogging (Days)Spikelet FertilityKernels per SpikeletKernels per SpikePost-Anthesis Biomass
3rd leaf from top
10−0.09 1−0.26−0.26
170.330.470.48
240.570.310.30
310.690.540.540.64
380.250.030.020.32
450.570.340.320.80
2nd leaf from top
100.13−0.13−0.16
170.500.320.34
240.660.660.68
310.440.220.220.57
380.560.440.450.48
450.89 *0.86 *0.88 *0.78
Flag leaf
170.640.410.39
240.720.630.63
310.680.540.530.51
380.680.550.540.50
450.660.780.800.32
520.88 * 20.97 **0.96 **0.42
1 The data are r values. 2 * and ** indicate significance at p < 0.05 and p < 0.01, respectively.
Table 5. Effects of urea applied after waterlogging on N uptake, N efficiency, and 15NREC.
TreatmentsTotal N Uptake (g·pot−1)N Partial Factor Productivity (g·g−1)15NREC (mg·pot−1)%15NREC
DR1.6 b 137 a
WA1.3 d32 c
FU11.4 c33 bc23 d46 c
FU21.7 b38 a56 b56 b
SU11.4 c33 bc32 c64 a
SU21.8 a36 ab68 a68 a
1 Different letters indicate statistical significance at the p < 0.05 level.

