Yield Gap Management under Seawater Intrusion Areas of Indonesia to Improve Rice Productivity and Resilience to Climate Change

 ,
,
Abstract
:1. Introduction
2. Materials and Methods
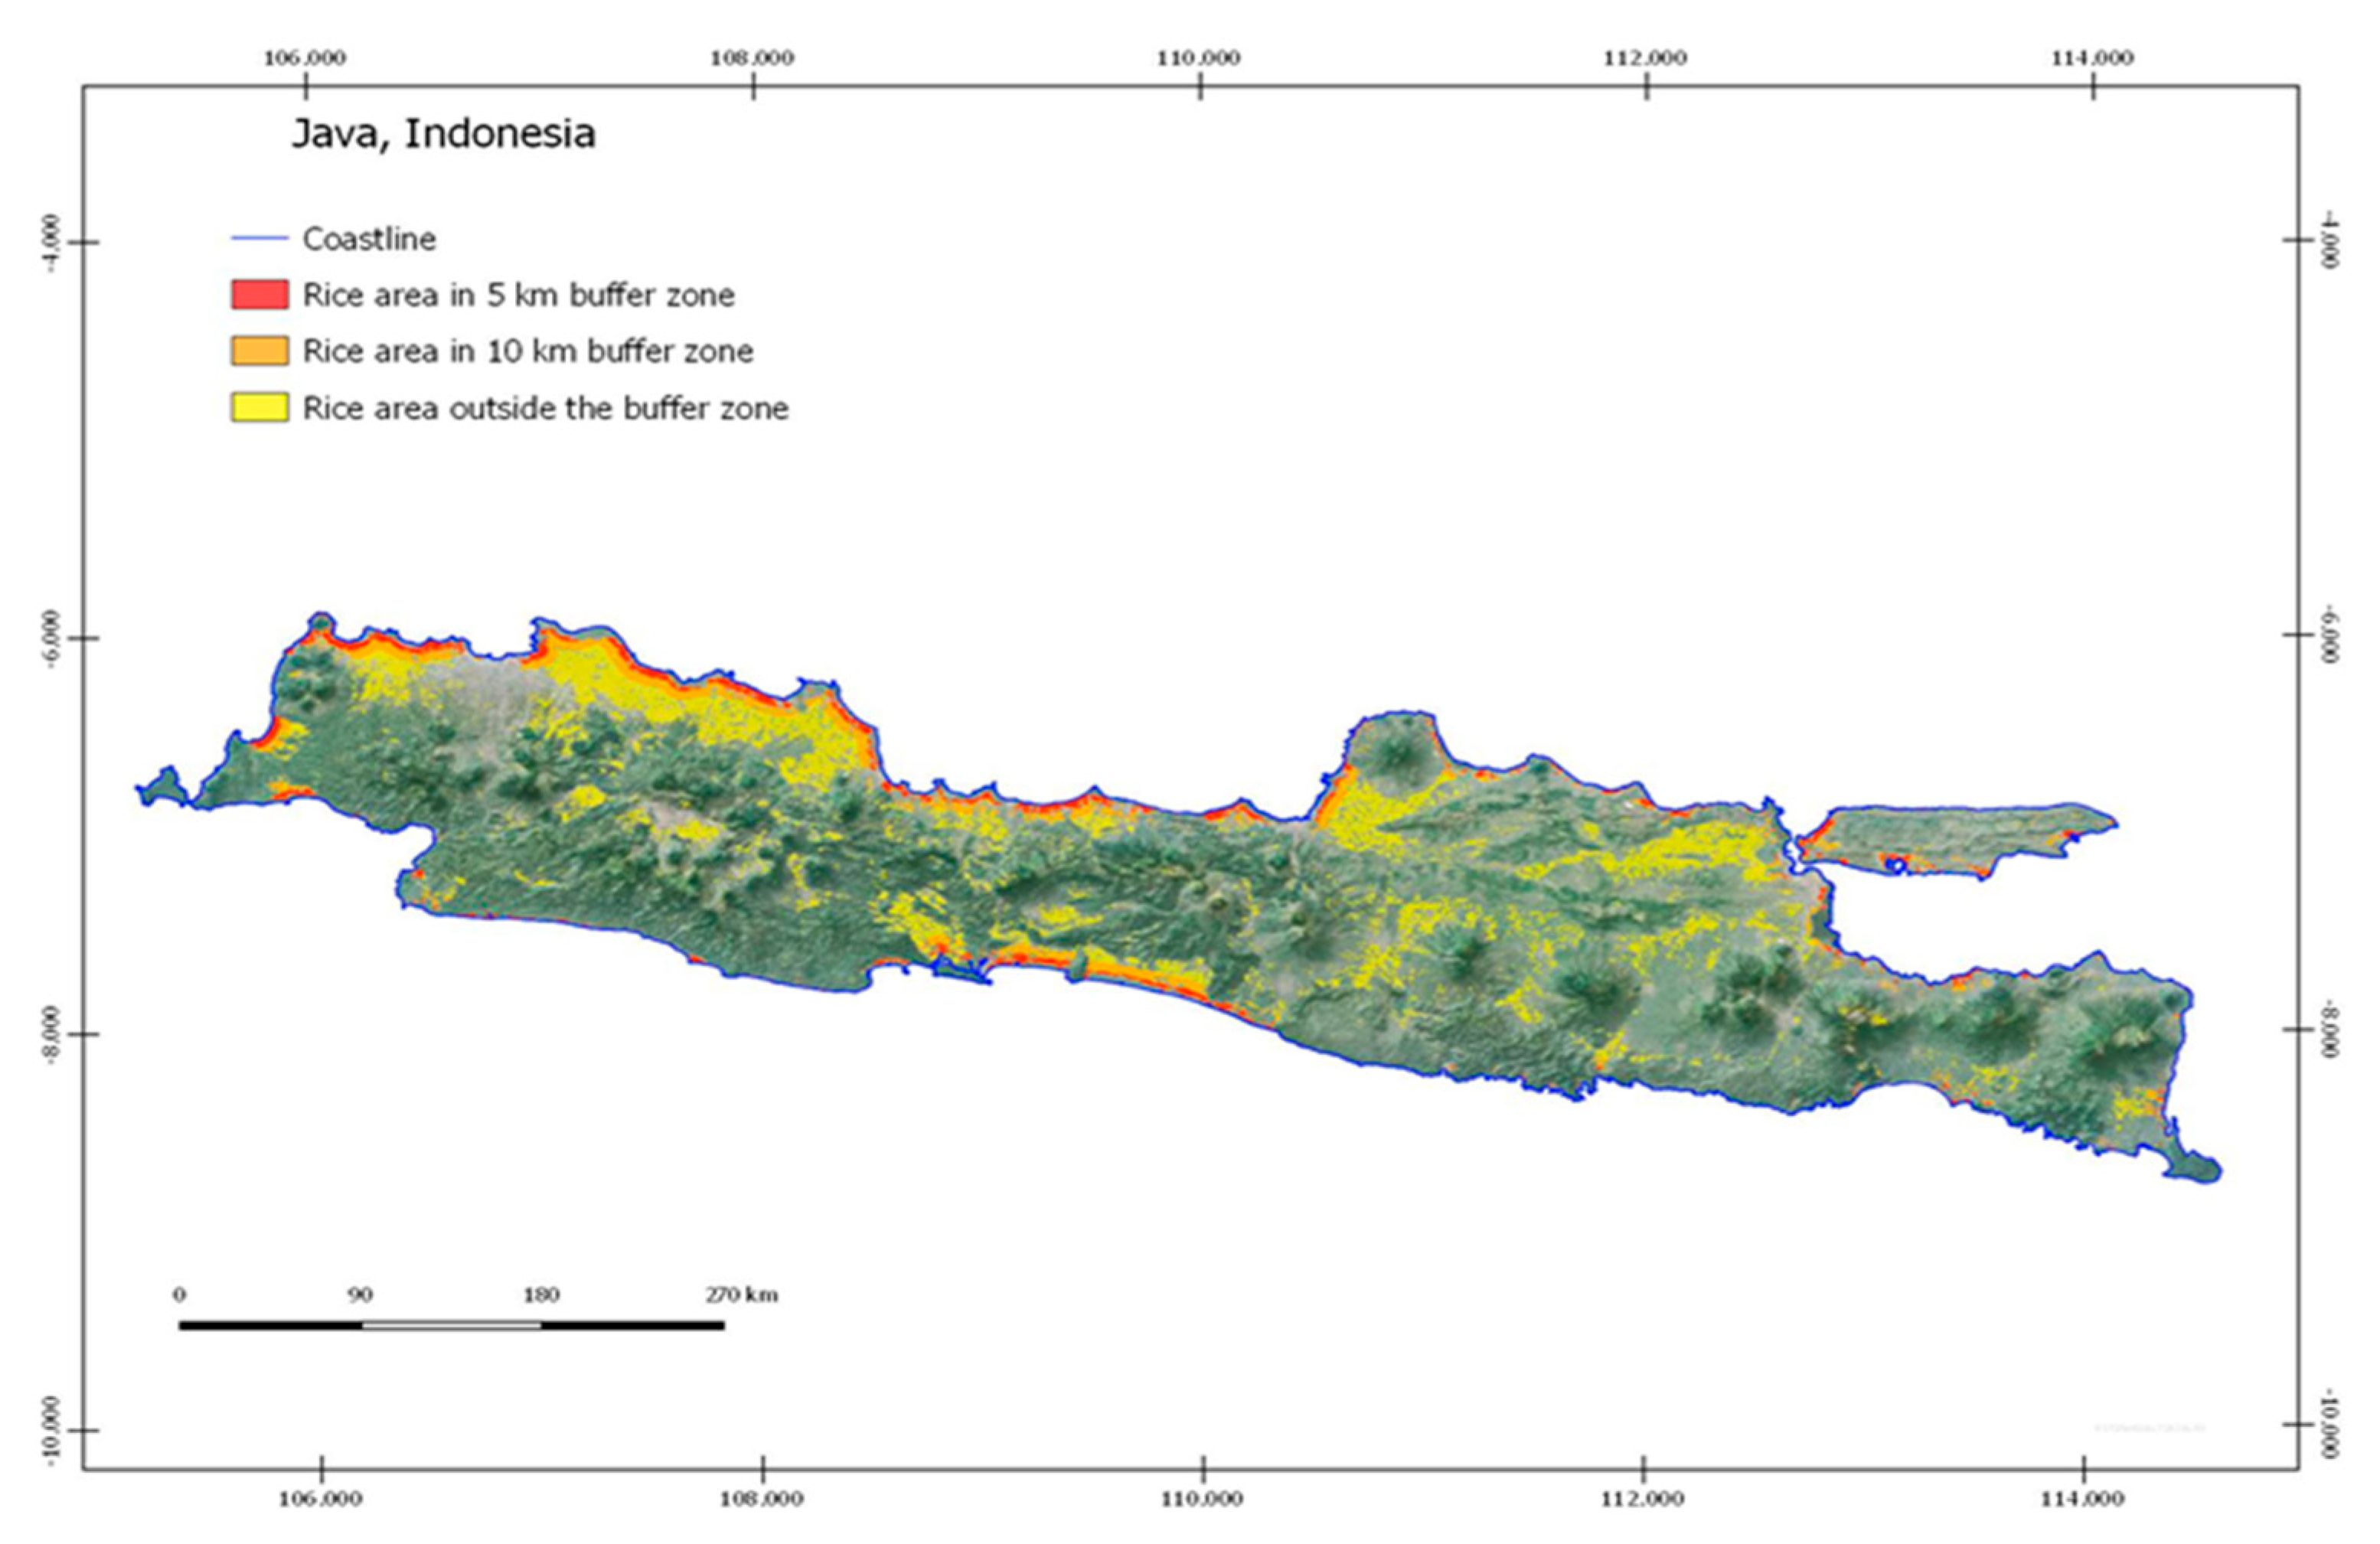
2.1. Description of Study Area
2.2. Soil Sampling and Analysis
2.3. Field Experiments
2.3.1. Best Management Practices (BMP)
2.3.2. Yield Gap between BMP and Farmer’s Practice
3. Results and Discussion
3.1. Best Management Practices (BMP)
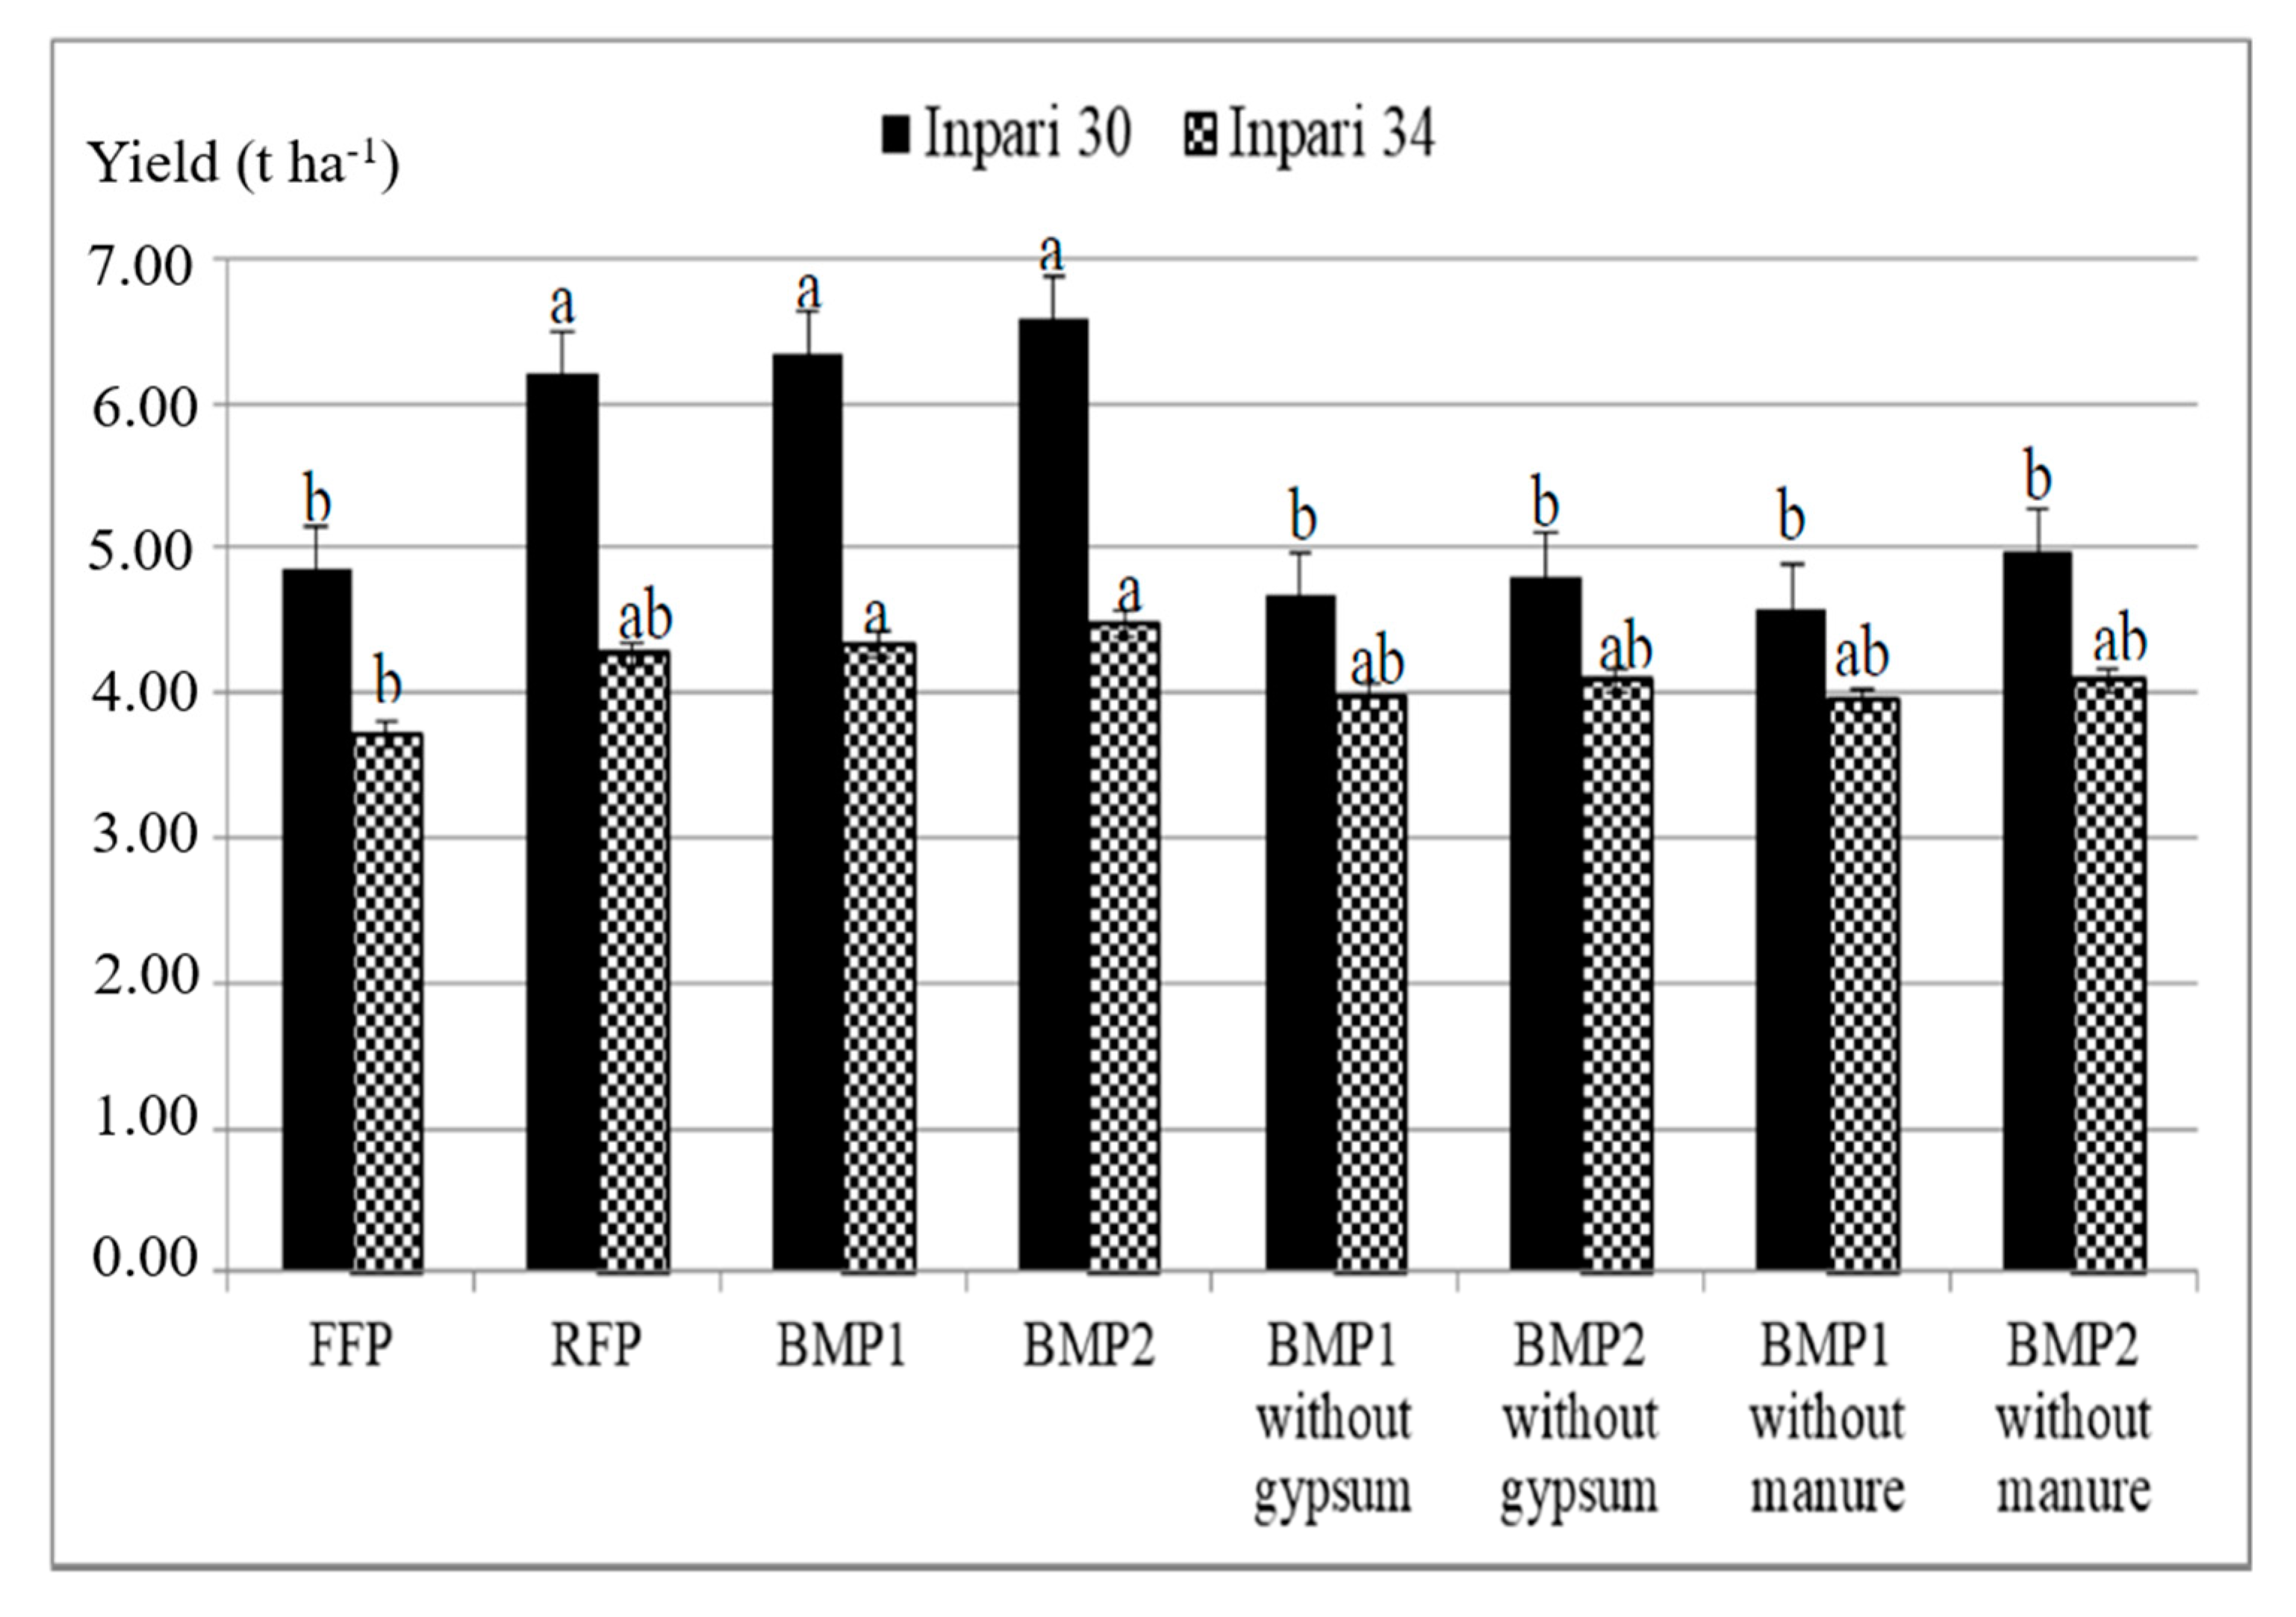
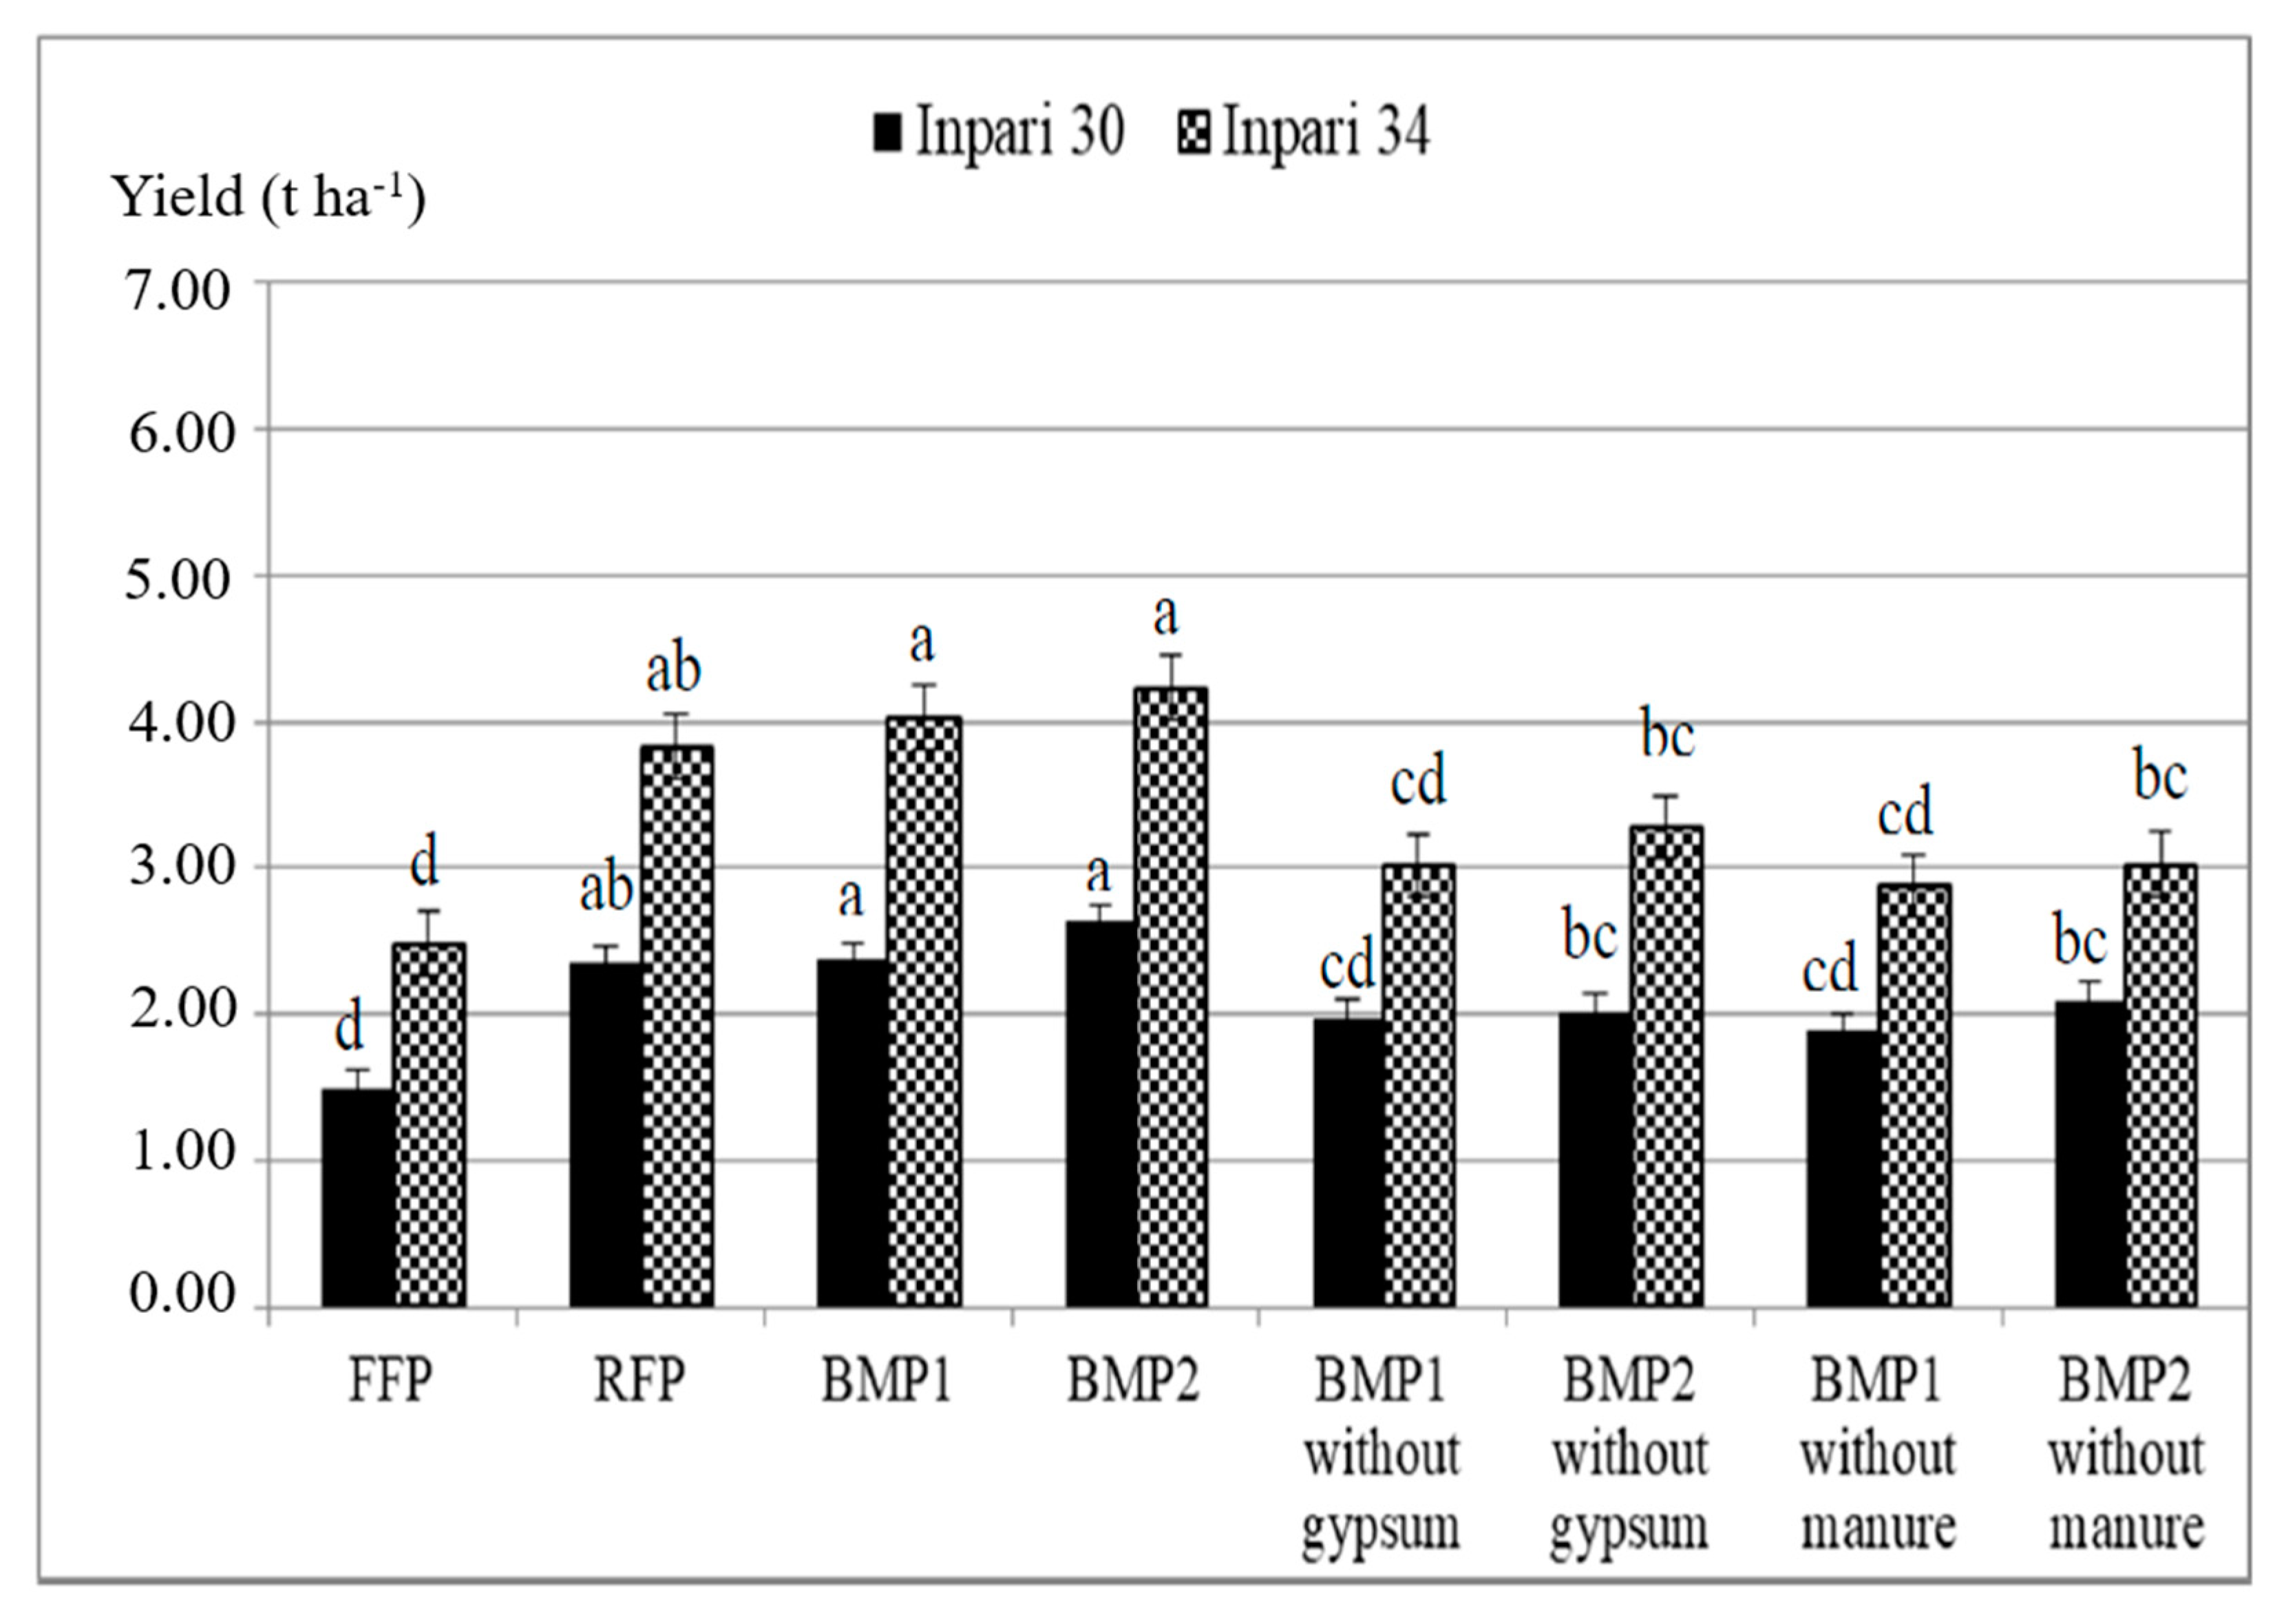
3.1.1. Grain Yield
3.1.2. Yield Components
3.1.3. Biomass
3.2. Yield Gap between BMP and Farmer’s Practice
4. Conclusions
Author Contributions
Funding
Acknowledgments
Conflicts of Interest
References
- Statistics Indonesia. Statistical Yearbook of Indonesia 2017; Statistics Indonesia: Jakarta, Indonesia, 2017; p. 750. [Google Scholar]
- MoE. Indonesia Country Report: Climate Variability and Climate Change, and Their Implication; Ministry of Environment, Republic of Indonesia: Jakarta, Indonesia, 2007. [Google Scholar]
- Boer, R. The threat of global climate change on Indonesia’s food security. Agromedia 2011, 15, 16–20. [Google Scholar]
- Erfandi, D.; Rachman, A. Soil salinity due to seawater intrusion on rice field. J. Trop. Soils 2011, 16, 115–121. [Google Scholar] [CrossRef]
- Forster, H.; Sterzel, T.; Pape, C.A.; Moneo-Lain, M.; Niemeyer, I.; Boer, R.; Kropp, J.P. Sea-level rise in Indonesia: On adaptation priorities in the agricultural sector. Reg. Environ. Chang. 2011, 11, 893–904. [Google Scholar] [CrossRef]
- Rumanti, I.A.; Hairmansis, A.; Nugraha, Y.; Susanto, U.N.; Wardana, P.; Subandiono, R.E.; Zaini, Z.; Sembiring, H.; Khan, N.I.; Singh, R.K.; et al. Development of tolerant rice varieties for stress-prone ecosystems in the coastal deltas of Indonesia. Field Crop Res. 2018, 223, 75–82. [Google Scholar] [CrossRef]
- Irawan, B. Stabilization of Upland Agriculture under El-Niño-Induced Climatic Risk: Impact Assessment and Mitigation Measures in Indonesia. JAAE 2002. [Google Scholar] [CrossRef]
- Barus, W.A.; Rauf, A.; Rosmayati, C.H. Improvement of salt tolerance in some varieties of rice by ascorbic acid application. Int. J. Sci. Technol. Res. 2015, 4, 235–237. [Google Scholar]
- ACIAR. Assessment of Management in Key Coastal Areas of Indonesia to Improve Agricultural Productivity and Resilience to Climate Change; ACIAR: Canberra, Australia, 2018; in press. [Google Scholar]
- Li, Z.K.; Xu, J.L. Breeding for drought and salt tolerant rice (Oryza sativa L.): Progress and perspectives. In Advances in Molecular Breeding Toward Drought and Salt Tolerant Crops; Jenks, M.A., Ed.; Springer: Dordrecht, The Netherlands, 2007; pp. 531–564. [Google Scholar]
- FAO. Land and Plant Nutrition Management Service. 2005. Available online: http://www.fao.org/ag/agl/agll/spush (accessed on 12 March 2018).
- Harini, R.; Yunus, H.S.; Hartono, S. Agricultural Land Conversion: Determinants and impact for food sufficiency in Sleman Regency. Indones. J. Geogr. 2012, 44, 120–133. [Google Scholar]
- Sari, I.M. Faktor-faktor yang mempengaruhi alih fungsi lahan sawah menjadi tambak di Desa Beurawang Kecamatan Jeumpa Kabupaten Bireuen. J. Sains Pertan. 2017, 1, 134–141. [Google Scholar]
- Sembiring, H.; Gani, A.; Iskandar, T. Implications of salinity research in Aceh for Indonesian Rice Growing. Int. Workshop Post Tsunami Soil Manag. 2008, 97–108. [Google Scholar]
- Ashraf, M.; Akram, N.A. Improving salinity tolerance of plants through conventional breeding and genetic engineering: An analytical comparison. Biotechnol. Adv. 2009, 27, 744–752. [Google Scholar] [CrossRef]
- Pradheeban, L.; Nissanka, S.P.; Suriyagoda, L.D.B. Influence of whole and sub soil salinity on growth, development, physiology and yield of selected rice varieties cultivated in Jaffna district, Sri Lanka. Trop. Agric. Res. 2017, 28, 389–401. [Google Scholar] [CrossRef]
- Hairmansis, A.; Nafisah, N.; Jamil, A. Towards Developing Salinity Tolerant Rice Adaptable for Coastal Regions in Indonesia. KNE Life Sci. 2017, 72–79. [Google Scholar] [CrossRef] [Green Version]
- Gregorio, G.B.; Senadhira, D.; Mendoza, R.D.; Manigbas, N.L.; Roxas, J.P.; Guerta, C.Q. Progress in breeding for salinity tolerance and associated abiotic stresses in rice. Field Crops Res. 2002, 76, 91–101. [Google Scholar] [CrossRef]
- Tripathi, S.; Kumari, S.; Chakraborty, A.; Gupta, A.; Chakrabarti, K.; Bandyapadhyay, B.K. Microbial biomass and its activities in salt-affected coastal soils. Biol. Fertil. Soils 2006, 42, 273–277. [Google Scholar] [CrossRef]
- Yuan, B.C.; Li, Z.Z.; Liu, H.; Gao, M.; Zhang, Y.T. Microbial biomass and activity in salt affected soils under arid conditions. Appl. Soil Ecol. 2007, 35, 319–328. [Google Scholar] [CrossRef]
- Rietz, D.N.; Haynes, R.J. Effect of irrigation-induced salinity and sodicity on soil microbial activity. Soil Biol. Biochem. 2003, 35, 845–854. [Google Scholar] [CrossRef]
- Ahmad, M.; Zahir, Z.A.; Asghar, H.N.; Asghar, M. Inducing salt tolerance in mung bean through coinoculation with rhizobia and plant-growth-promoting rhizobacteria containing 1-aminocyclopropane-1-carboxylate deaminase. Can. J. Microbiol. 2011, 57, 578–589. [Google Scholar] [CrossRef]
- Ali, S.; Charles, T.C.; Glick, B.R. Amelioration of high salinity stress damage by plant growth promoting bacterial endophytes that contain ACC deaminase. Plant Physiol. Biochem. 2014, 80, 160–167. [Google Scholar] [CrossRef]
- Amezketa, E.; Aragues, R.; Gazol, R. Efficiency of sulfuric acid, mined gypsum and two gypsum by-products in soil crusting prevention and sodic soil reclamation. Agron. J. 2005, 97, 983–989. [Google Scholar] [CrossRef]
- Abdel-Fattah, M.K. Role of gypsum and compost in reclaiming saline-sodic soils. J. Agric. Vet. Sci. 2012, 1, 30–38. [Google Scholar] [CrossRef]
- Subardja, V.O.; Anas, I.; Widyastuti, R. Utilization of organic fertilizer to increase paddy growth and productivity using System of Rice Intensification (SRI) method in saline soil. J. Degrad. Min. Lands Manag. 2016, 3, 543–549. [Google Scholar] [CrossRef]
- Erythrina. Leaf Color Chart: A Tool to Increase Nitrogen Fertilizer Efficiency in Rice. J. Litbang Pert 2016, 35, 1–10. [Google Scholar] [CrossRef] [Green Version]
- Stevens, D. Rengasamy, Soil salinity and sodicity. In Growing Crops with Reclaimed Wastewater; CSIRO Publishing: Collingwood, Australia, 2006; pp. 125–138. [Google Scholar]
- Husen, E.; Salma, S. Skrining Bakteri Penghasil ACC Deaminase untuk Ameliorasi Cekaman Salinitas pada Padi Sawah. J. Tanah Dan Iklim 2012, 36, 1–12. [Google Scholar]
- Setiawati, M.R.; Santosa, D.A.; Simarmata, T.; Sumarni, Y.; Arief, D.H. The Contribution of Nitrogen-Fixing Endophytic Bacteria to Increase the Growth of Upland Rice; LISA International Seminar; UNPAD: Bandung, Indonesia, 2003. [Google Scholar]
- Widawati, S. The effect of salinity to activity and effectivity phosphate solubilizing bacteria on growth and production of paddy. KNE Life Sci. 2015, 2, 609–612. [Google Scholar] [CrossRef] [Green Version]
- Stuart, A.M.; Pame, A.R.P.; Silva, J.V.; Dikitanan, R.C.; Rutsaert, P.; Malabayabas, A.J.B.; Lampayan, R.M.; Radanielson, A.M.; Singleton, G.R. Yield gaps in rice-based farming systems: Insights from local studies and prospects for future analysis. Field Crops Res. 2016, 194, 43–56. [Google Scholar] [CrossRef] [Green Version]
- IRRI. Statistical Tool for Agricultural Research (STAR) Version 2.01; International Rice Research Institute: Los Banos, Philippines, 2013. [Google Scholar]
- Septiningsih, E.M.; Hidayatun, N.; Sanchez, D.L.; Nugraha, Y.; Carandang, J.; Pamplona, A.M.; Collard, B.Y.C.; Ismail, A.M.; Mackill, D.J. Accelerating the development of new submergence tolerant rice varieties: The case of CiherangSub1 and PSB Rc18-Sub1. Euphytica 2015, 202, 259–268. [Google Scholar] [CrossRef]
- Toledo, A.M.U.; Ignacio, J.C.I.; Casal, C., Jr.; Gonzaga, Z.J.; Mendioro, M.S.; Septiningsih, E.M. Development of improved Ciherang-Sub1 having tolerance to anaerobic germination conditions. Plant Breed. Biotech. 2015, 3, 77–87. [Google Scholar] [CrossRef] [Green Version]
- Hairmansis, A.; Berger, B.; Tester, M.; Roy, S.J. Image-based phenotyping for non-destructive screening of different salinity tolerance traits in rice. Rice 2014, 7, 16. [Google Scholar] [CrossRef] [Green Version]
- Reddy, N.B.L.; Kim, B.K.; Yoon, I.S.; Kim, K.H.; Kwon, T.R. Salt tolerance in rice: Focus on mechanisms and approaches. Rice Sci. 2017, 24, 123–144. [Google Scholar] [CrossRef]
- Muhammad, S.; Muller, T.; Joergensen, R. Decomposition of pea and maize straw in Pakistani soils along a gradient in salinity. Biol. Fertil. Soils 2006, 43, 93–101. [Google Scholar] [CrossRef]
- Jacoby, R.; Peukert, M.; Succurro, A.; Koprinova, A.; Kopriva, S. The role of soil microorganisms in plant mineral nutrition-current knowledge and future directions. Front. Plant Sci. 2017, 8, 1617. [Google Scholar] [CrossRef] [PubMed] [Green Version]
- Yu, H.L.; Gu, W.; Tao, J.; Huang, J.Y.; Lin, H.S. Impact of addition of FGDB as a soil amendment on physical and chemical properties of an alkali soil and crop yield of maize in Northern China coastal plain. J. Chem. 2015, 2015, 540604. [Google Scholar] [CrossRef] [Green Version]
- Tejada, M.; Garcia, C.; Gonzalez, J.L.; Hernandez, M.T. Use of organic amendment as a strategy for saline soil remediation: Influence on the physical, chemical and biological properties of soil. Soil Biol. Biochem. 2006, 38, 1413–1421 ISSN 0038. [Google Scholar] [CrossRef]
- El-Shakweer, M.H.A.; El-Sayad, E.A.; Ejes, M.S.A. Soil and plant analysis as a guide for interpretation of the improvement efficiency of organic conditioners added to different soils in Egypt. Commun. Soil Sci. Plant Anal. 1998, 29, 2067–2088. [Google Scholar] [CrossRef]
- Bargaz, A.; Lyamlouli, K.; Chtouki, M.; Zeroual, Y.; Dhiba, D. Soil microbial resources for improving fertilizers efficiency in an integrated plant nutrient management system. Front. Microbiol. 2018, 9, 1606. [Google Scholar] [CrossRef] [Green Version]
- Aich, A.C.; Ahmed, A.H.M.; Mandal, R. Impact of organic matter, lime and gypsum on grain yield of wheat in salt affected soils irrigated with different grades of brackish water. Research 1997, 10, 79–84. [Google Scholar]
- Liang, Y.C.; Yang, Y.F.; Yang, C.G.; Shen, Q.Q.; Zhou, J.M.; Yang, L.Z. Soil enzymatic activity and growth of rice and barley as influenced by organic matter in an anthropogenic soil. Geoderma 2003, 115, 149–160. [Google Scholar] [CrossRef]
- Rad, H.E.; Aref, F.; Rezaei, M.; Amiri, E.; Khaledian, M.R. The effects of salinity at different growth stage on rice yield. Ecol. Environ. Conserv. 2011, 17, 111–117. [Google Scholar]
- Radanielson, A.M.; Angeles, O.; Li, T.; Ismail, A.M.; Gaydon, D.S. Describing the physiological responses of different rice genotypes to salt stress using sigmoid and piecewise linear functions. Field Crops Res. 2017, 211, 172. [Google Scholar] [CrossRef]
- Radanielson, A.M.; Gaydon, D.S.; Li, T.; Angeles, O.; Roth, C.H. Modeling salinity effect on rice growth and grain yield with ORYZA v3 and APSIM-Oryza. Eur. J. Agron. 2018, 100, 44–55. [Google Scholar] [CrossRef]

| Property | Soil Salinity | ||
|---|---|---|---|
| Low | Medium | High | |
| Particle size distribution (%): | |||
| • Clay | 76.6 | 75.5 | 77.3 |
| • Silt | 23.2 | 21.8 | 21.9 |
| • Sand | 0.2 | 0.7 | 0.8 |
| Organic matter (g kg−1) | 2.45 | 2.27 | 1.04 |
| Total-N (%) | 0.16 | 0.15 | 0.80 |
| C/N ratio | 15 | 15 | 13 |
| P total (%) | 0.03 | 0.06 | 0.03 |
| K total (%) | 0.38 | 0.43 | 0.55 |
| EC and pH: | |||
| • EC (dSm−1) (Soil paste extract 1:5) | 0.499 | 1.728 | 2.660 |
| • ECe (dSm−1) | 2.02 | 7.23 | 10.51 |
| • pH (Soil suspension 1:5) | 6.4 | 6.0 | 6.9 |
| Exchangeable cations, CEC and ESP * | |||
| • Na+ (cmol kg−1) | 2.79 | 7.31 | 13.43 |
| • K+ (cmol kg−1) | 0.80 | 1.54 | 2.76 |
| • Ca2+ (cmol kg−1) | 15.94 | 12.11 | 7.11 |
| • Mg2+ (cmol kg−1) | 11.86 | 15.00 | 14.07 |
| • CEC (cmol kg−1) | 21.80 | 25.63 | 21.70 |
| • ESP. (%) | 13.43 | 21.70 | 61.89 |
| df | Mean Squares | ||||||
|---|---|---|---|---|---|---|---|
| Source of Variance | Grain Yield (t ha−1) | Above Ground Biomass (t ha−1) | Panicle Number | Number of Seed per Panicle | Empty Grain (%) | Weight of 1000 Grains (g) | |
| Moderate soil salinity | |||||||
| Variety (A) | 1 | 19,291,980 ** | 19,761,536 ns | 91.8533 * | 7.2385 ns | 1.8252 ns | 0.0675 ns |
| Error (a) | 2 | 224,827 | 13,349,184 | 2.4788 | 202.7430 | 2.0097 | 1.2699 |
| Fertilizer management (B) | 7 | 1,681,251 *** | 14,773,687 ns | 19.3286 *** | 407.7835 *** | 25.4171 * | 2.7255 ns |
| A × B | 7 | 615,247 ** | 548,589 ns | 1.9135 ns | 270.3462 ** | 1.6978 ns | 0.0963 ns |
| Error (b) | 28 | 113,340 | 8,272,480 | 1.8741 | 48.5038 | 10.2057 | 1.2356 |
| cv (a) (%) | 9.99 | 34.65 | 13.09 | 13.53 | 12.01 | 4.45 | |
| cv (b) (%) | 7.10 | 27.28 | 11.38 | 6.62 | 27.07 | 4.39 | |
| High soil salinity | |||||||
| Variety (A) | 1 | 18,585,363 * | 4,404,893 ns | 24.9697 * | 1427.9008 ns | 1623.8970 * | 0.0050 ns |
| Error (a) | 2 | 498,658 | 442,955 | 0.3047 | 141.4758 | 28.8277 | 2.0288 |
| Fertilizer management (B) | 7 | 1,364,059 ** | 6,715,193 * | 11.8847 *** | 494.0164 ** | 33.3816 * | 1.3165 ns |
| A × B | 7 | 135,609 ns | 193,799 ns | 0.5205 ns | 103.9639 ns | 4.9969 ns | 1.1057 ns |
| Error (b) | 28 | 209,854 | 539,870 | 0.5952 | 122.6405 | 11.1116 | 1.6614 |
| cv (a) (%) | 25.90 | 7.69 | 6.84 | 13.29 | 27.96 | 6.78 | |
| cv (b) (%) | 16.80 | 8.49 | 9.55 | 12.37 | 17.36 | 6.14 | |
| Fertilizer Management | Panicle Number | Number of Seed per Panicle | Empty Grain (%) | Weight of 1000 Grain (g) | Above Ground Biomass (t ha−1) |
|---|---|---|---|---|---|
| Moderate soil salinity | |||||
| Farmer fertilizer practices (FFP) | 9.6 c | 91.3 d | 14.9 a | 24.2 a | 8.849 a |
| Recommended Fertilizer package (RFP) | 13.7 a | 112.7 a | 10.1 bcd | 24.9 a | 11.559 a |
| BMP1 = RFP + PGRB rhizozpheric | 14.1 a | 110.2 a | 9.5 cd | 25.8 a | 12.339 a |
| BMP2 = RFP + PGRB endophytes | 14.3 a | 113.9 a | 9.1 d | 26.5 a | 13.116 a |
| BMP1 without gypsum | 10.1 c | 96.7 c | 13.0 abc | 25.5 a | 9.792 a |
| BMP2 without gypsum | 11.9 b | 103.8 b | 11.9 abcd | 25.0 a | 9.651 a |
| BMP1 without manure | 11.0 bc | 101.5 b | 13.4 ab | 25.4 a | 9.374 a |
| BMP2 without manure | 11.7 b | 101.8 b | 12.5 abcd | 25.5 a | 9.668 a |
| Average | 12.1 | 104.0 | 11.8 | 25.4 | 10.544 |
| High soil salinity | |||||
| Farmer fertilizer practices (FFP) | 6.3 d | 82.0 c | 23.5 a | 20.5 a | 6.587 c |
| Recommended Fertilizer package (RFP) | 9.1 b | 95.8 ab | 18.0 ab | 20.5 a | 9.600 ab |
| BMP1 = RFP + PGRB rhizozpheric | 9.4 b | 101.8 a | 16.4 b | 21.3 a | 9.459 ab |
| BMP2 = RFP + PGRB endophytes | 10.4 a | 101.9 a | 16.5 b | 21.6 a | 9.924 a |
| BMP1 without gypsum | 7.4 c | 80.3 c | 20.8 ab | 21.6 a | 8.264 b |
| BMP2 without gypsum | 7.8 c | 83.5 bc | 19.7 ab | 20.8 a | 8.789 ab |
| BMP1 without manure | 7.1 c | 82.2 c | 20.0 ab | 21.0 a | 8.247 b |
| BMP2 without manure | 7.3 c | 88.5 bc | 18.8 ab | 20.8 a | 8.384 b |
| Average | 8.1 | 89.5 | 19.2 | 21.0 | 8.7 |
| Item | Low Soil Salinity | Moderate Soil Salinity | High Soil Salinity | |||
|---|---|---|---|---|---|---|
| Farmer’s Current Practice (n =19) | Recom-Mended Practice (n = 4) | Farmer’s Current Practice (n =18) | Recom-Mended Practice (n = 4) | Farmer’s Current Practice (n =17) | Recom-Mended Practice (n = 4) | |
| Mean Grain yield at 14% m.c. (t ha−1) | ||||||
| ▪ Sidenuk | 4.937 | 6.137 | 4.075 | 5.350 | 1.294 | 1.489 |
| ▪ Inpari 30 | 6.299 | 4.521 | 1.627 | |||
| ▪ Inpari 34 | 5.490 | 3.953 | 2.344 | |||
| ▪ Inpari 35 | 5.386 | 3.887 | 2.638 | |||
| Yield gap (t ha−1) a | 1.362 | 1.275 | 1.344 | |||
| Revenue (USD ha−1) b | ||||||
| ▪ Sidenuk | 2252.04 | 2799.32 | 1830.18 | 2402.81 | 581.16 | 668.82 |
| ▪ Inpari 30 | 2873.23 | 2030.48 | 730.72 | |||
| ▪ Inpari 34 | 2504.08 | 1775.38 | 1052.72 | |||
| ▪ Inpari 35 | 2456.57 | 1745.74 | 1184.56 | |||
| Mean Fertilizer cost (inorganic sources)/ha | 76.84 | 68.77 | 76.84 | 68.77 | 76.84 | 68.77 |
| Fertilizer cost (organic sources) | 0.00 | 35.09 | 0.00 | 35.09 | 0.00 | 35.09 |
| Total cost (USD ha−1) | 76.84 | 103.89 | 76.84 | 103.89 | 76.84 | 103.89 |
| Expected benefit above fertilizer costs (USD ha−1) | ||||||
| ▪ Sidenuk | 2175.20 | 2695.46 | 1753.33 | 2298.95 | 504.32 | 564.96 |
| ▪ Inpari 30 | 2769.37 | 1926.62 | 626.86 | |||
| ▪ Inpari 34 | 2400.22 | 1671.52 | 948.86 | |||
| ▪ Inpari 35 | 2352.71 | 1641.88 | 1080.70 | |||
| Change in benefit (USD ha−1) | ||||||
| ▪ Sidenuk | 520.26 (23.9%) | 545.61 (31.1%) | 60.64 (12.0%) | |||
| ▪ Inpari 30 | 594.17 (27.3%) | 173.29 (9.9%) | 122.54 (24.3%) | |||
| ▪ Inpari 34 | 225.02 (10.3%) | −81.81 (−4.7%) | 444.53 (88.1%) | |||
| ▪ Inpari 35 | 177.51 (8.2%) | −111.45 (−6.4%) | 576.38 (102.3%) | |||
| Average | 379.24 | 131.41 | 301.02 | |||
© 2019 by the authors. Licensee MDPI, Basel, Switzerland. This article is an open access article distributed under the terms and conditions of the Creative Commons Attribution (CC BY) license (http://creativecommons.org/licenses/by/4.0/).
Share and Cite
Sembiring, H.; A. Subekti, N.; Erythrina; Nugraha, D.; Priatmojo, B.; Stuart, A.M. Yield Gap Management under Seawater Intrusion Areas of Indonesia to Improve Rice Productivity and Resilience to Climate Change. Agriculture 2020, 10, 1. https://doi.org/10.3390/agriculture10010001
Sembiring H, A. Subekti N, Erythrina, Nugraha D, Priatmojo B, Stuart AM. Yield Gap Management under Seawater Intrusion Areas of Indonesia to Improve Rice Productivity and Resilience to Climate Change. Agriculture. 2020; 10(1):1. https://doi.org/10.3390/agriculture10010001
Chicago/Turabian StyleSembiring, Hasil, Nuning A. Subekti, Erythrina, Dedi Nugraha, Bhakti Priatmojo, and Alexander M. Stuart. 2020. "Yield Gap Management under Seawater Intrusion Areas of Indonesia to Improve Rice Productivity and Resilience to Climate Change" Agriculture 10, no. 1: 1. https://doi.org/10.3390/agriculture10010001
APA StyleSembiring, H., A. Subekti, N., Erythrina, Nugraha, D., Priatmojo, B., & Stuart, A. M. (2020). Yield Gap Management under Seawater Intrusion Areas of Indonesia to Improve Rice Productivity and Resilience to Climate Change. Agriculture, 10(1), 1. https://doi.org/10.3390/agriculture10010001