The Effects of Human Visual Sensory Stimuli on N1b Amplitude: An EEG Study


Abstract
1. Introduction
2. Materials and Methods
2.1. Subjects
2.2. Apparatus
2.3. Stimuli
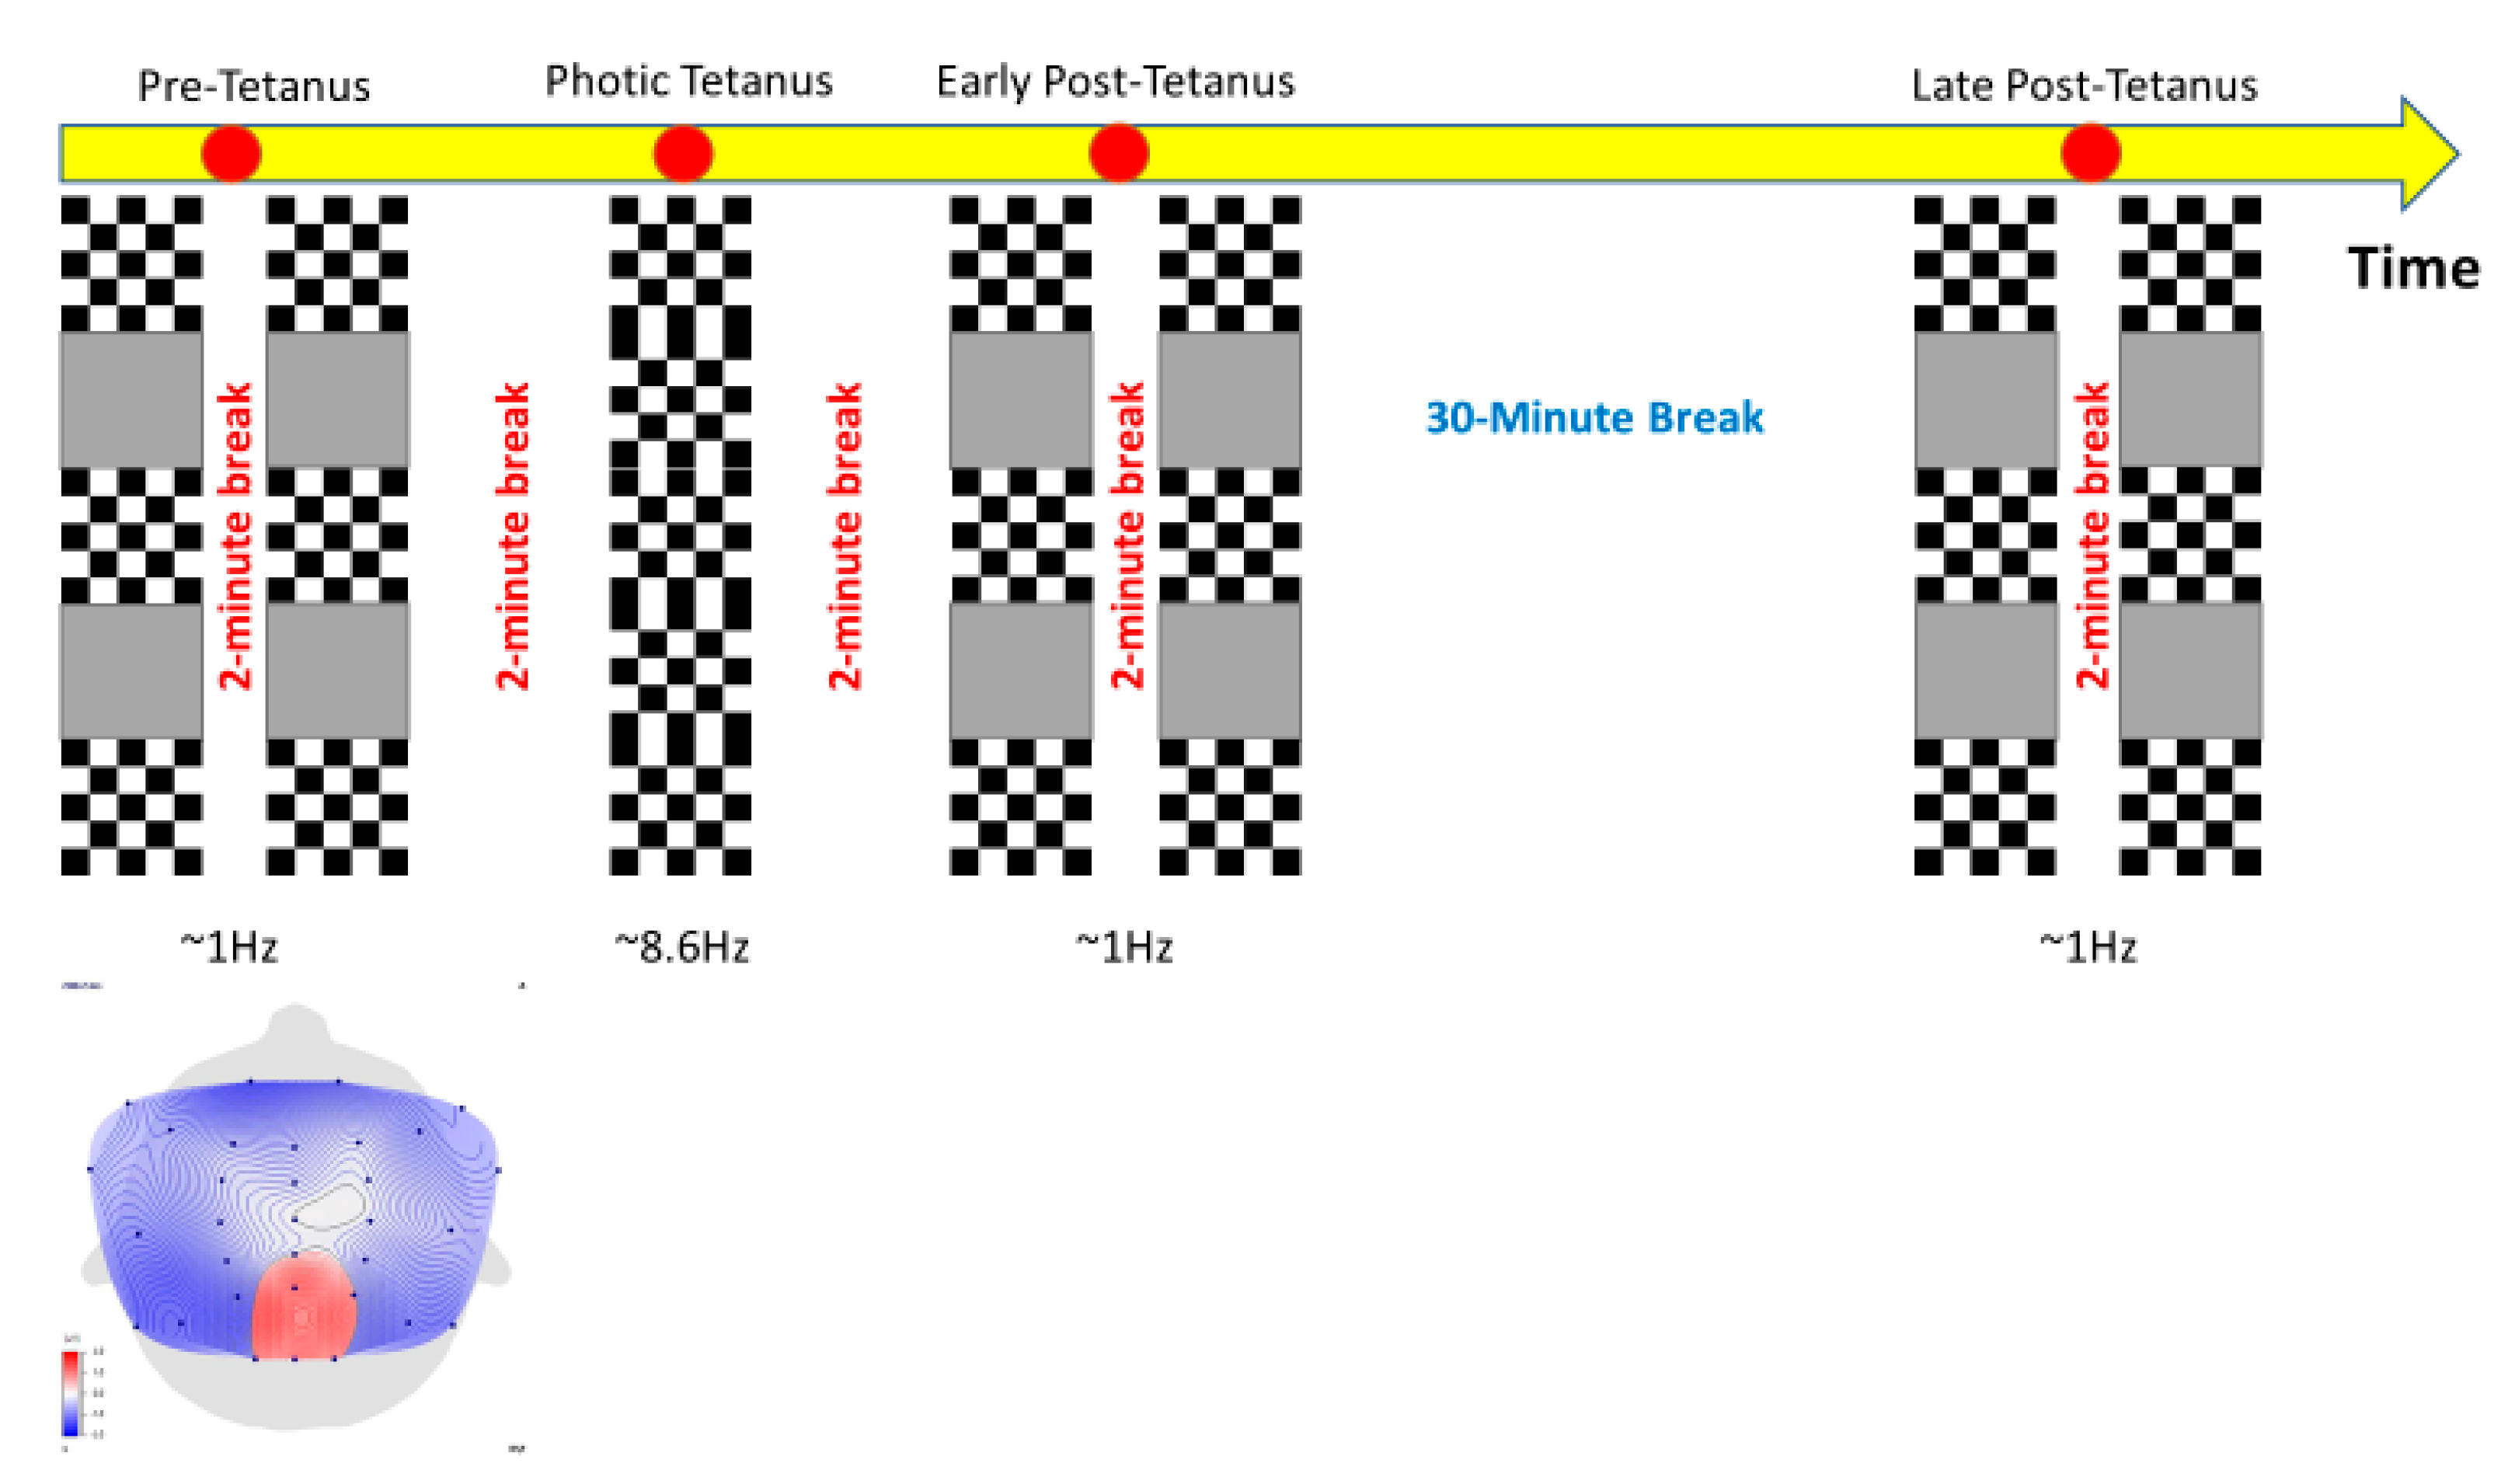
2.4. Procedure
2.5. EEG Data Reduction
2.6. Statistical Analysis
3. Results
4. Discussion
Author Contributions
Funding
Acknowledgments
Conflicts of Interest
References
- Engel, S.A.; Furmanski, C.S. Selective adaptation to color contrast in human primary visual cortex. J. Neurosci. 2001, 21, 3949–3954. [Google Scholar] [CrossRef] [PubMed][Green Version]
- Montaser-Kouhsari, L.; Landy, M.S.; Heeger, D.J.; Larsson, J. Orientation-selective adaptation to illusory contours in human visual cortex. J. Neurosci. 2007, 27, 2186–2195. [Google Scholar] [CrossRef] [PubMed][Green Version]
- Movshon, J.A.; Lennie, P. Pattern-selective adaptation in visual cortical neurones. Nature 1979, 278, 850–852. [Google Scholar] [CrossRef] [PubMed]
- Kappenman, E.; Luck, S. The Oxford Handbook of Event-Related Potential Components; Oxford University Press: Oxford, UK, 2012; pp. 1–664. [Google Scholar] [CrossRef]
- Spriggs, M.J.; Thompson, C.S.; Moreau, D.; McNair, N.A.; Wu, C.C.; Lamb, Y.N.; McKay, N.S.; King, R.O.C.; Antia, U.; Shelling, A.N.; et al. Human Sensory LTP Predicts Memory Performance and Is Modulated by the BDNF Val(66)Met Polymorphism. Front. Hum. Neurosci. 2019, 13, 22. [Google Scholar] [CrossRef] [PubMed]
- McNair, N.A.; Clapp, W.C.; Hamm, J.P.; Teyler, T.J.; Corballis, M.C.; Kirk, I.J. Spatial frequency-specific potentiation of human visual-evoked potentials. Neuroreport 2006, 17, 739–741. [Google Scholar] [CrossRef] [PubMed]
- Ross, R.M.; McNair, N.A.; Fairhall, S.L.; Clapp, W.C.; Hamm, J.P.; Teyler, T.J.; Kirk, I.J. Induction of orientation-specific LTP-like changes in human visual evoked potentials by rapid sensory stimulation. Brain Res. Bull. 2008, 76, 97–101. [Google Scholar] [CrossRef] [PubMed]
- Teyler, T.J.; Hamm, J.P.; Clapp, W.C.; Johnson, B.W.; Corballis, M.C.; Kirk, I.J. Long-term potentiation of human visual evoked responses. Eur. J. Neurosci. 2005, 21, 2045–2050. [Google Scholar] [CrossRef] [PubMed]
- Clapp, W.C.; Hamm, J.P.; Kirk, I.J.; Teyler, T.J. Translating long-term potentiation from animals to humans: A novel method for noninvasive assessment of cortical plasticity. Biol. Psychiatry 2012, 71, 496–502. [Google Scholar] [CrossRef] [PubMed]
- Clapp, W.C.; Eckert, M.J.; Teyler, T.J.; Abraham, W.C. Rapid visual stimulation induces N-methyl-D-aspartate receptor-dependent sensory long-term potentiation in the rat cortex. Neuroreport 2006, 17, 511–515. [Google Scholar] [CrossRef] [PubMed]
- Heynen, A.J.; Bear, M.F. Long-term potentiation of thalamocortical transmission in the adult visual cortex in vivo. J. Neurosci. 2001, 21, 9801–9813. [Google Scholar] [CrossRef] [PubMed]
- Cooke, S.F.; Bear, M.F. Visual experience induces long-term potentiation in the primary visual cortex. J. Neurosci. 2010, 30, 16304–16313. [Google Scholar] [CrossRef] [PubMed]
- Marenna, S.; Castoldi, V.; d’Isa, R.; Marco, C.; Comi, G.; Leocani, L. Semi-invasive and non-invasive recording of visual evoked potentials in mice. Doc. Ophthalmol. 2019, 138, 169–179. [Google Scholar] [CrossRef] [PubMed]
- Ferree, T.C.; Luu, P.; Russell, G.S.; Tucker, D.M. Scalp electrode impedance, infection risk, and EEG data quality. Clin. Neurophysiol. 2001, 112, 536–544. [Google Scholar] [CrossRef]
- Bliss, T.V.P.; Cooke, S.F. Long-term potentiation and long-term depression: A clinical perspective. Clinics 2011, 66, 3–17. [Google Scholar] [CrossRef] [PubMed]
- Kamitani, Y.; Tong, F. Decoding the visual and subjective contents of the human brain. Nat. Neurosci. 2005, 8, 679–685. [Google Scholar] [CrossRef] [PubMed]
- Tootell, R.B.; Hadjikhani, N.K.; Vanduffel, W.; Liu, A.K.; Mendola, J.D.; Sereno, M.I.; Dale, A.M. Functional analysis of primary visual cortex (V1) in humans. Proc. Natl. Acad. Sci. USA 1998, 95, 811–817. [Google Scholar] [CrossRef]
- Smallwood, N.; Spriggs, M.J.; Thompson, C.S.; Wu, C.C.; Hamm, J.P.; Moreau, D.; Kirk, I.J. Influence of Physical Activity on Human Sensory Long-Term Potentiation. J. Int. Neuropsychol. Soc. 2015, 21, 831–840. [Google Scholar] [CrossRef] [PubMed]


| Variable | Point Estimate | SD |
|---|---|---|
| Age, mean years | 24.05 | 3.2 |
| Gender, % Male | 52.6 | |
| BMI, mean kg/m2 | 25.28 | 4.81 |
© 2020 by the authors. Licensee MDPI, Basel, Switzerland. This article is an open access article distributed under the terms and conditions of the Creative Commons Attribution (CC BY) license (http://creativecommons.org/licenses/by/4.0/).
Share and Cite
Moore, D.; Ikuta, T.; Loprinzi, P.D. The Effects of Human Visual Sensory Stimuli on N1b Amplitude: An EEG Study. J. Clin. Med. 2020, 9, 2837. https://doi.org/10.3390/jcm9092837
Moore D, Ikuta T, Loprinzi PD. The Effects of Human Visual Sensory Stimuli on N1b Amplitude: An EEG Study. Journal of Clinical Medicine. 2020; 9(9):2837. https://doi.org/10.3390/jcm9092837
Chicago/Turabian StyleMoore, Damien, Toshikazu Ikuta, and Paul D. Loprinzi. 2020. "The Effects of Human Visual Sensory Stimuli on N1b Amplitude: An EEG Study" Journal of Clinical Medicine 9, no. 9: 2837. https://doi.org/10.3390/jcm9092837
APA StyleMoore, D., Ikuta, T., & Loprinzi, P. D. (2020). The Effects of Human Visual Sensory Stimuli on N1b Amplitude: An EEG Study. Journal of Clinical Medicine, 9(9), 2837. https://doi.org/10.3390/jcm9092837