Hepatitis C Clearance by Direct-Acting Antivirals Impacts Glucose and Lipid Homeostasis

 ,
,
Abstract
:1. Introduction
2. Material and Methods
2.1. Patients
2.2. Serum Biomarkers
2.3. Liver Stiffness Measurement
2.4. Statistical Analysis
3. Results
Longitudinal Study
4. Discussion
5. Conclusions
Supplementary Materials
Author Contributions
Funding
Conflicts of Interest
References
- WHO. The Global Burden of Viral Hepatitis: Better Estimates to Guide Hepatitis Elimination Efforts. Available online: http://www.who.int/mediacentre/commentaries/better-estimates-hepatitis/en/ (accessed on 20 April 2020).
- El-Serag, H.B. Epidemiology of viral hepatitis and hepatocellular carcinoma. Gastroenterology 2012, 142, 1264–1273.e1. [Google Scholar] [CrossRef] [PubMed] [Green Version]
- Meissner, E.G.; Lee, Y.-J.; Osinusi, A.; Sims, Z.; Qin, J.; Sturdevant, D.; McHutchison, J.; Subramanian, M.; Sampson, M.; Naggie, S.; et al. Effect of sofosbuvir and ribavirin treatment on peripheral and hepatic lipid metabolism in chronic hepatitis C virus, genotype 1-infected patients. Hepatology 2015, 61, 790–801. [Google Scholar] [CrossRef] [PubMed]
- Allison, M.E.; Wreghitt, T.; Palmer, C.R.; Alexander, G.J. Evidence for a link between hepatitis C virus infection and diabetes mellitus in a cirrhotic population. J. Hepatol. 1994, 21, 1135–1139. [Google Scholar] [CrossRef]
- Mehta, S.H.; Brancati, F.L.; Sulkowski, M.S.; Strathdee, S.A.; Szklo, M.; Thomas, D.L. Prevalence of type 2 diabetes mellitus among persons with hepatitis C virus infection in the United States. Ann. Intern. Med. 2000, 133, 592–599. [Google Scholar] [CrossRef] [PubMed]
- Mason, A.L.; Lau, J.Y.; Hoang, N.; Qian, K.; Alexander, G.J.; Xu, L.; Guo, L.; Jacob, S.; Regenstein, F.G.; Zimmerman, R.; et al. Association of diabetes mellitus and chronic hepatitis C virus infection. Hepatology 1999, 29, 328–333. [Google Scholar] [CrossRef]
- Imazeki, F.; Yokosuka, O.; Fukai, K.; Kanda, T.; Kojima, H.; Saisho, H. Prevalence of diabetes mellitus and insulin resistance in patients with chronic hepatitis C: Comparison with hepatitis B virus-infected and hepatitis C virus-cleared patients. Liver Int. 2008, 28, 355–362. [Google Scholar] [CrossRef]
- Soverini, V.; Persico, M.; Bugianesi, E.; Forlani, G.; Salomone, F.; Masarone, M.; La Mura, V.; Mazzotti, A.; Bruno, A.; Marchesini, G. HBV and HCV infection in type 2 diabetes mellitus: A survey in three diabetes units in different Italian areas. Acta Diabetol. 2011, 48, 337–343. [Google Scholar] [CrossRef]
- White, D.L.; Ratziu, V.; El-Serag, H.B. Hepatitis C infection and risk of diabetes: A systematic review and meta-analysis. J. Hepatol. 2008, 49, 831–844. [Google Scholar] [CrossRef] [Green Version]
- Sheikh, M.Y.; Choi, J.; Qadri, I.; Friedman, J.E.; Sanyal, A.J. Hepatitis C virus infection: Molecular pathways to metabolic syndrome. Hepatology 2008, 47, 2127–2133. [Google Scholar] [CrossRef]
- Kawaguchi, T.; Yoshida, T.; Harada, M.; Hisamoto, T.; Nagao, Y.; Ide, T.; Taniguchi, E.; Kumemura, H.; Hanada, S.; Maeyama, M.; et al. Hepatitis C virus down-regulates insulin receptor substrates 1 and 2 through up-regulation of suppressor of cytokine signaling 3. Am. J. Pathol. 2004, 165, 1499–1508. [Google Scholar] [CrossRef] [Green Version]
- Russo, F.P.; Zanetto, A.; Gambato, M.; Bortoluzzi, I.; Al Zoairy, R.; Franceschet, E.; De Marchi, F.; Marzi, L.; Lynch, E.N.; Floreani, A.; et al. Hepatitis C virus eradication with direct-acting antiviral improves insulin resistance. J. Viral Hepat. 2019, 27, 188–194. [Google Scholar] [CrossRef] [PubMed]
- Li, J.; Zhang, T.; Gordon, S.C.; Rupp, L.B.; Trudeau, S.; Holmberg, S.D.; Moorman, A.C.; Spradling, P.R.; Teshale, E.H.; Boscarino, J.A.; et al. Impact of sustained virologic response on risk of type 2 diabetes among hepatitis C patients in the United States. J. Viral Hepat. 2018, 25, 952–958. [Google Scholar] [CrossRef] [PubMed]
- Salomone, F.; Catania, M.; Montineri, A.; Bertino, G.; Godos, J.; Rizzo, L.; Magrì, G.; Volti, G.L. Hepatitis C virus eradication by direct antiviral agents improves glucose tolerance and reduces post-load insulin resistance in nondiabetic patients with genotype 1. Liver Int. 2018, 38, 1206–1211. [Google Scholar] [CrossRef] [PubMed]
- Viral Clearance Is Associated With Improved Insulin Resistance in Genotype 1 Chronic Hepatitis C but Not Genotype 2/3. 2012. Available online: https://pubmed.ncbi.nlm.nih.gov/21873466/?from_single_result=10.1136%2Fgut.2010.236158 (accessed on 1 June 2020).
- Stine, J.G.; Wynter, J.A.; Niccum, B.; Kelly, V.; Caldwell, S.H.; Shah, N.L. Effect of treatment with direct acting antiviral on glycemic control in patients with diabetes mellitus and chronic hepatitis C. Ann. Hepatol. 2017, 16, 215–220. [Google Scholar] [CrossRef]
- Chaudhury, C.S.; Sheehan, J.; Chairez, C.; Akoth, E.; Gross, C.; Silk, R.; Kattakuzhy, S.; Rosenthal, E.; Kottilil, S.; Masur, H.; et al. no improvement in hemoglobin A1c following hepatitis C viral clearance in patients with and without HIV. J. Infect. Dis. 2017, 217, 47–50. [Google Scholar] [CrossRef]
- Hepatitis C Direct Acting Antivirals and Ribavirin Modify Lipid but Not Glucose Parameters. Available online: https://pubmed.ncbi.nlm.nih.gov/30884773/ (accessed on 1 June 2020).
- Rao, G.A.; Pandya, P.K. Statin therapy improves sustained virologic response among diabetic patients with chronic hepatitis C. Gastroenterology 2011, 140, 144–152. [Google Scholar] [CrossRef]
- Atsukawa, M.; Tsubota, A.; Kondo, C.; Itokawa, N.; Narahara, Y.; Nakatsuka, K.; Hashimoto, S.; Fukuda, T.; Matsushita, Y.; Kidokoro, H.; et al. Combination of fluvastatin with pegylated interferon/ribavirin therapy reduces viral relapse in chronic hepatitis C infected with HCV genotype 1b. J. Gastroenterol. Hepatol. 2012, 28, 51–56. [Google Scholar] [CrossRef]
- Harrison, S.A.; Rossaro, L.; Hu, K.-Q.; Patel, K.; Tillmann, H.; Dhaliwal, S.; Torres, D.M.; Koury, K.; Goteti, V.S.; Noviello, S.; et al. Serum cholesterol and statin use predict virological response to peginterferon and ribavirin therapy. Hepatology 2010, 52, 864–874. [Google Scholar] [CrossRef]
- Pawlotsky, J.M.; Negro, F.; Aghemo, A.; Berenguer, M.; Dalgard, O.; Dusheiko, G.; Marra, F.; Puoti, M.; Wedemeyer, H. European Association for the Study of the Liver (EASL) recommendations on treatment of hepatitis C 2018. J. Hepatol. 2018, 69, 461–511. [Google Scholar] [CrossRef] [Green Version]
- Moucari, R.; Asselah, T.; Cazals-Hatem, D.; Voitot, H.; Boyer, N.; Ripault, M.; Sobesky, R.; Martinot-Peignoux, M.; Maylin, S.; Nicolas-Chanoine, M.; et al. Insulin resistance in chronic hepatitis C: Association with genotypes 1 and 4, serum HCV RNA level, and liver fibrosis. Gastroenterology 2008, 134, 416–423. [Google Scholar] [CrossRef]
- Imbert-Bismut, F.; Ratziu, V.; Piéroni, L.; Charlotte, F.; Benhamou, Y.; Poynard, T. Biochemical markers of liver fibrosis in patients with hepatitis C virus infection: A prospective study. Lancet 2001, 357, 1069–1075. [Google Scholar] [CrossRef]
- Wai, C.; Marrero, J.A.; Conjeevaram, H.S.; Lok, A.S.; Greenson, J.K.; Fontana, R.J.; Kalbfleisch, J.D. A simple noninvasive index can predict both significant fibrosis and cirrhosis in patients with chronic hepatitis C. Hepatology 2003, 38, 518–526. [Google Scholar] [CrossRef] [PubMed] [Green Version]
- Sterling, R.K.; Lissen, E.; Clumeck, N.; Sola, R.; Correa, M.C.; Montaner, J.; Sulkowski, M.S.; Torriani, F.J.; Dieterich, D.T.; Thomas, D.L.; et al. Development of a simple noninvasive index to predict significant fibrosis in patients with HIV/HCV coinfection. Hepatology 2006, 43, 1317–1325. [Google Scholar] [CrossRef] [PubMed]
- Friedrich-Rust, M.; Wunder, K.; Kriener, S.; Sotoudeh, F.; Richter, S.; Bojunga, J.; Herrmann, E.; Poynard, T.; Dietrich, C.F.; Vermehren, J.; et al. Liver fibrosis in viral hepatitis: Noninvasive assessment with acoustic radiation force impulse imaging versus transient elastography. Radiology 2009, 252, 595–604. [Google Scholar] [CrossRef] [PubMed] [Green Version]
- Marcellin, P.; Ziol, M.; Bedossa, P.; Douvin, C.; Poupon, R.; De Ledinghen, V.; Beaugrand, M. Non-invasive assessment of liver fibrosis by stiffness measurement in patients with chronic hepatitis B. Liver Int. 2009, 29, 242–247. [Google Scholar] [CrossRef] [PubMed]
- Knobler, H.; Zhornicky, T.; Sandler, A.; Haran, N.; Ashur, Y.; Schattner, A. Tumor necrosis factor-alpha-induced insulin resistance may mediate the hepatitis C virus-diabetes association. Am. J. Gastroenterol. 2003, 98, 2751–2756. [Google Scholar] [CrossRef]
- Knobler, H.; Malnick, S. Hepatitis C and insulin action: An intimate relationship. World J. Hepatol. 2016, 8, 131–138. [Google Scholar] [CrossRef]
- Adinolfi, L.E.; Nevola, R.; Guerrera, B.; Marrone, A.; Giordano, M.; Rinaldi, L.; D’Alterio, G. Hepatitis C virus clearance by direct-acting antiviral treatments and impact on insulin resistance in chronic hepatitis C patients. J. Gastroenterol. Hepatol. 2018, 33, 1379–1382. [Google Scholar] [CrossRef]
- Alsatie, M.; Kwo, P.Y.; Gingerich, J.R.; Qi, R.; Eckert, G.; Cummings, O.W.; Imperiale, T.F. A multivariable model of clinical variables predicts advanced fibrosis in chronic hepatitis C. J. Clin. Gastroenterol. 2007, 41, 416–421. [Google Scholar] [CrossRef]
- Fartoux, L.; Poujol-Robert, A.; Guéchot, J.; Wendum, D.; Poupon, R.; Serfaty, L. Insulin resistance is a cause of steatosis and fibrosis progression in chronic hepatitis C. Gut 2005, 54, 1003–1008. [Google Scholar] [CrossRef] [Green Version]
- Huang, Y.-W.; Yang, S.-S.; Fu, S.-C.; Wang, T.-C.; Hsu, C.-K.; Chen, P.-J.; Hu, J.-T.; Kao, J. Increased risk of cirrhosis and its decompensation in chronic hepatitis C patients with new-onset diabetes: A nationwide cohort study. Hepatology 2014, 60, 807–814. [Google Scholar] [CrossRef] [PubMed]
- Ghany, M.G.; Kleiner, D.E.; Alter, H.; Doo, E.; Khokar, F.; Promrat, K.; Herion, D.; Park, Y.; Liang, T.; Hoofnagle, J.H. Progression of fibrosis in chronic hepatitis C. Gastroenterology 2003, 124, 97–104. [Google Scholar] [CrossRef] [PubMed]
- Papatheodoridis, G.; Chrysanthos, N.; Savvas, S.; Sevastianos, V.; Kafiri, G.; Petraki, K.; Manesis, E.K. Diabetes mellitus in chronic hepatitis B and C: Prevalence and potential association with the extent of liver fibrosis. J. Viral Hepat. 2006, 13, 303–310. [Google Scholar] [CrossRef] [PubMed]
- Agnello, V.; Ábel, G.; Elfahal, M.; Knight, G.B.; Zhang, Q.-X. Hepatitis C virus and other Flaviviridae viruses enter cells via low density lipoprotein receptor. Proc. Natl. Acad. Sci. USA 1999, 96, 12766–12771. [Google Scholar] [CrossRef] [PubMed] [Green Version]

| Characteristics | Patients (n = 46) |
|---|---|
| Patient age (years), mean ± SD | 51.7 ± 14.1 |
| Male gender, n (%) | 22 (47.8%) |
| Caucasian ethnicity, n (%) | 32 (69.0%) |
| BMI (kg/m2), mean ± SD | 25.4 ± 4.2 |
| HCV genotype 1a/1b/2/3/4–6, n (%) | 17 (36.9)/13 (28.2)/10 (21.7)/1 (3)/5 (10.8) |
| Median baseline HCV RNA (log10, IU/mL) | 6.06 |
| Previous antiviral therapy, n (%) | 6 (13.0) |
| Metabolic Comorbidity, n (%) | |
| Hyperlipidemia | 5 (8.6%) |
| Hypertension | 13 (28.3%) |
| Diabetes mellitus | 5 (10.9%) |
| Compensated cirrhosis, n (%) | 12 (26.1%) |
| Child Class A/B, n (%) * | 12(26.1)/0(0) |
| MELD score, mean ± SD * | 9.7 ± 4.0 |
| Total bilirubin (mg/dL), mean ± SD | 0.54 ± 0.3 |
| Serum albumin (g/dL), mean ± SD | 4.4 ± 0.4 |
| AST (IU/L), mean ± SD | 57.6 ± 39.6 |
| ALT (IU/L), mean ± SD | 73.9 ± 53.3 |
| GGT (IU/L), mean ± SD | 79.1 ± 68.9 |
| Total cholesterol (mg/dL), mean ± SD | 158.1 ± 42.4 |
| LDL cholesterol (mg/dL), mean ± SD | 94.8 ± 34.7 |
| HDL cholesterol (mg/dL), mean ± SD | 49.8 ± 12.7 |
| Triglycerides (mg/dL), mean ± SD | 112.7 ± 73.6 |
| HbA1c (%), mean ± SD | 5.4 ± 0.5 |
| Fasting glucose (mg/dL), mean ± SD | 105.0 ± 37.7 |
| Insulin (µIU/mL), mean ± SD | 18.9 ± 17.3 |
| HOMA-IR, mean ± SD | 5.3 ± 6.1 |
| Variable | Baseline (n = 46) | EOT (n = 46) | FU12 (n = 44) | FU24 (n = 41) | p * |
|---|---|---|---|---|---|
| AST (IU/L), mean ± SD | 57.6 ± 39.6 | 28.6 ± 15.8 | 27.6 ± 12.1 | 27.4 ± 14.0 | <0.001 |
| ALT (IU/L), mean ± SD | 73.9 ± 53.3 | 23.4 ± 13.8 | 23.9 ± 20.9 | 24.2 ± 17.9 | <0.001 |
| GGT (IU/L), mean ± SD | 79.1 ± 68.9 | 175.5 ± 32.8 | 28.0 ± 30.9 | 29.0 ± 29.6 | <0.001 |
| Total bilirubin (IU/L), mean ± SD | 0.5 ± 0.3 | 0.6 ± 0.4 | 0.5 ± 0.3 | 0.6 ± 0.4 | 0.14 |
| Serum albumin (g/dL), mean ± SD | 4.4 ± 0.4 | 4.4 ± 0.4 | 4.5 ± 0.3 | 4.6 ± 0.3 | 0.09 |
| Median HCV RNA (log10, IU/mL) | 6.1 | Undetectable | Undetectable | Undetectable | <0.001 |
| Median TE (kPa) | 7.7 | 5.8 | 5.3 | 5.4 | 0.01 |
| Median ARFI (m/s) | 1.4 | 1.4 | 1.1 | 1.1 | <0.001 |
| Median APRI score | 0.6 | 0.3 | 0.3 | 0.3 | <0.001 |
| Median FIB-4 score | 1.5 | 1.1 | 1.2 | 1.1 | 0.11 |
| Median FT score | 1.4 | 0.5 | 0.7 | 0.3 | <0.001 |
| Median CAP (dB/M) | 240.0 | 240.5 | 248.2 | 250.0 | 0.03 |
| Variable | Baseline (n = 46) | 12W (n = 46) | 24W (n = 44) | 48W (n = 41) | p * |
|---|---|---|---|---|---|
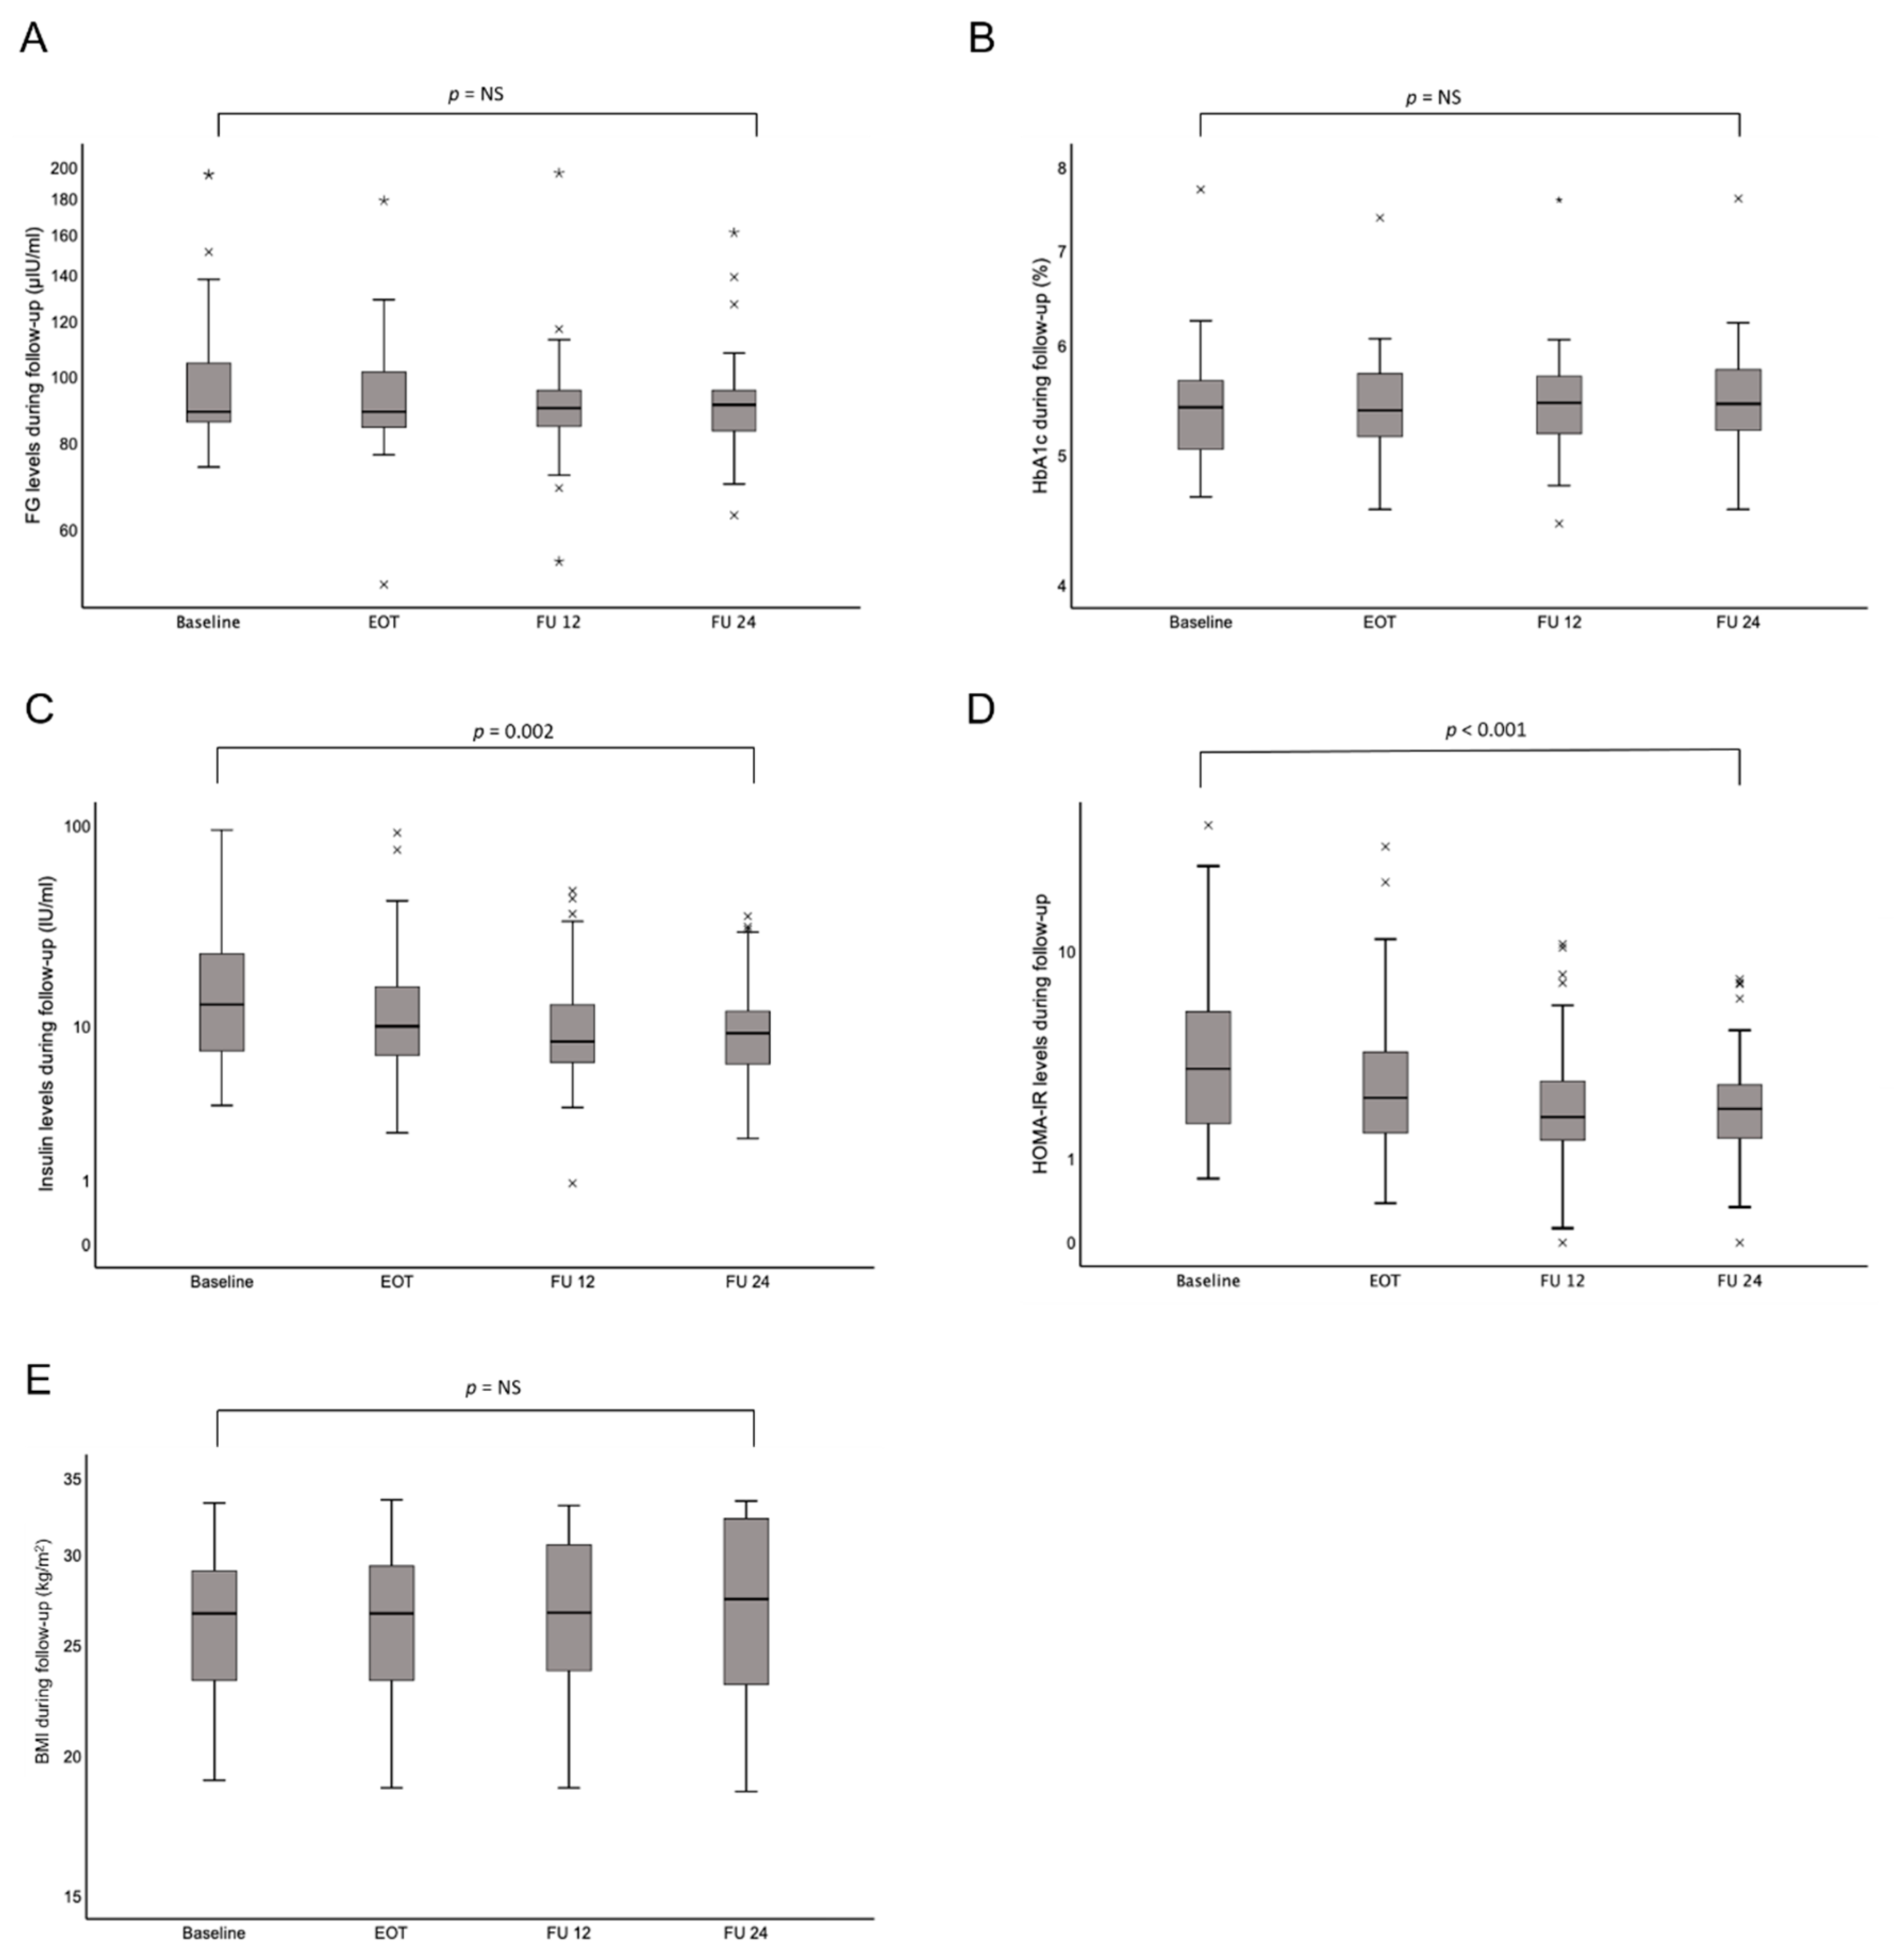
| Fasting glucose (mg/dL); mean ± SD | 105.0 ± 37.7 | 105 ± 37.7 | 94.5 ± 23.8 | 93.1 ± 17.5 | 0.11 |
| HbA1c (%); mean ± SD | 5.4 ± 0.5 | 5.4 ± 0.6 | 5.6 ± 0.6 | 5.5 ± 0.6 | 0.82 |
| Insulin (µIU/mL); mean ± SD | 18.9 ± 17.3 | 16.5 ± 18.5 | 12.2 ± 11.3 | 11.7 ± 8.7 | 0.001 |
| HOMA-IR; mean ± SD | 5.3 ± 6.1 | 3.9 ± 5.0 | 3.9 ± 5.0 | 2.5 ± 1.9 | 0.001 |
| BMI (kg/m2); mean ± SD | 25.4 ± 4.2 | 25.1 ± 5.6 | 25.1 ± 4.1 | 26.3 ± 5.6 | 0.95 |
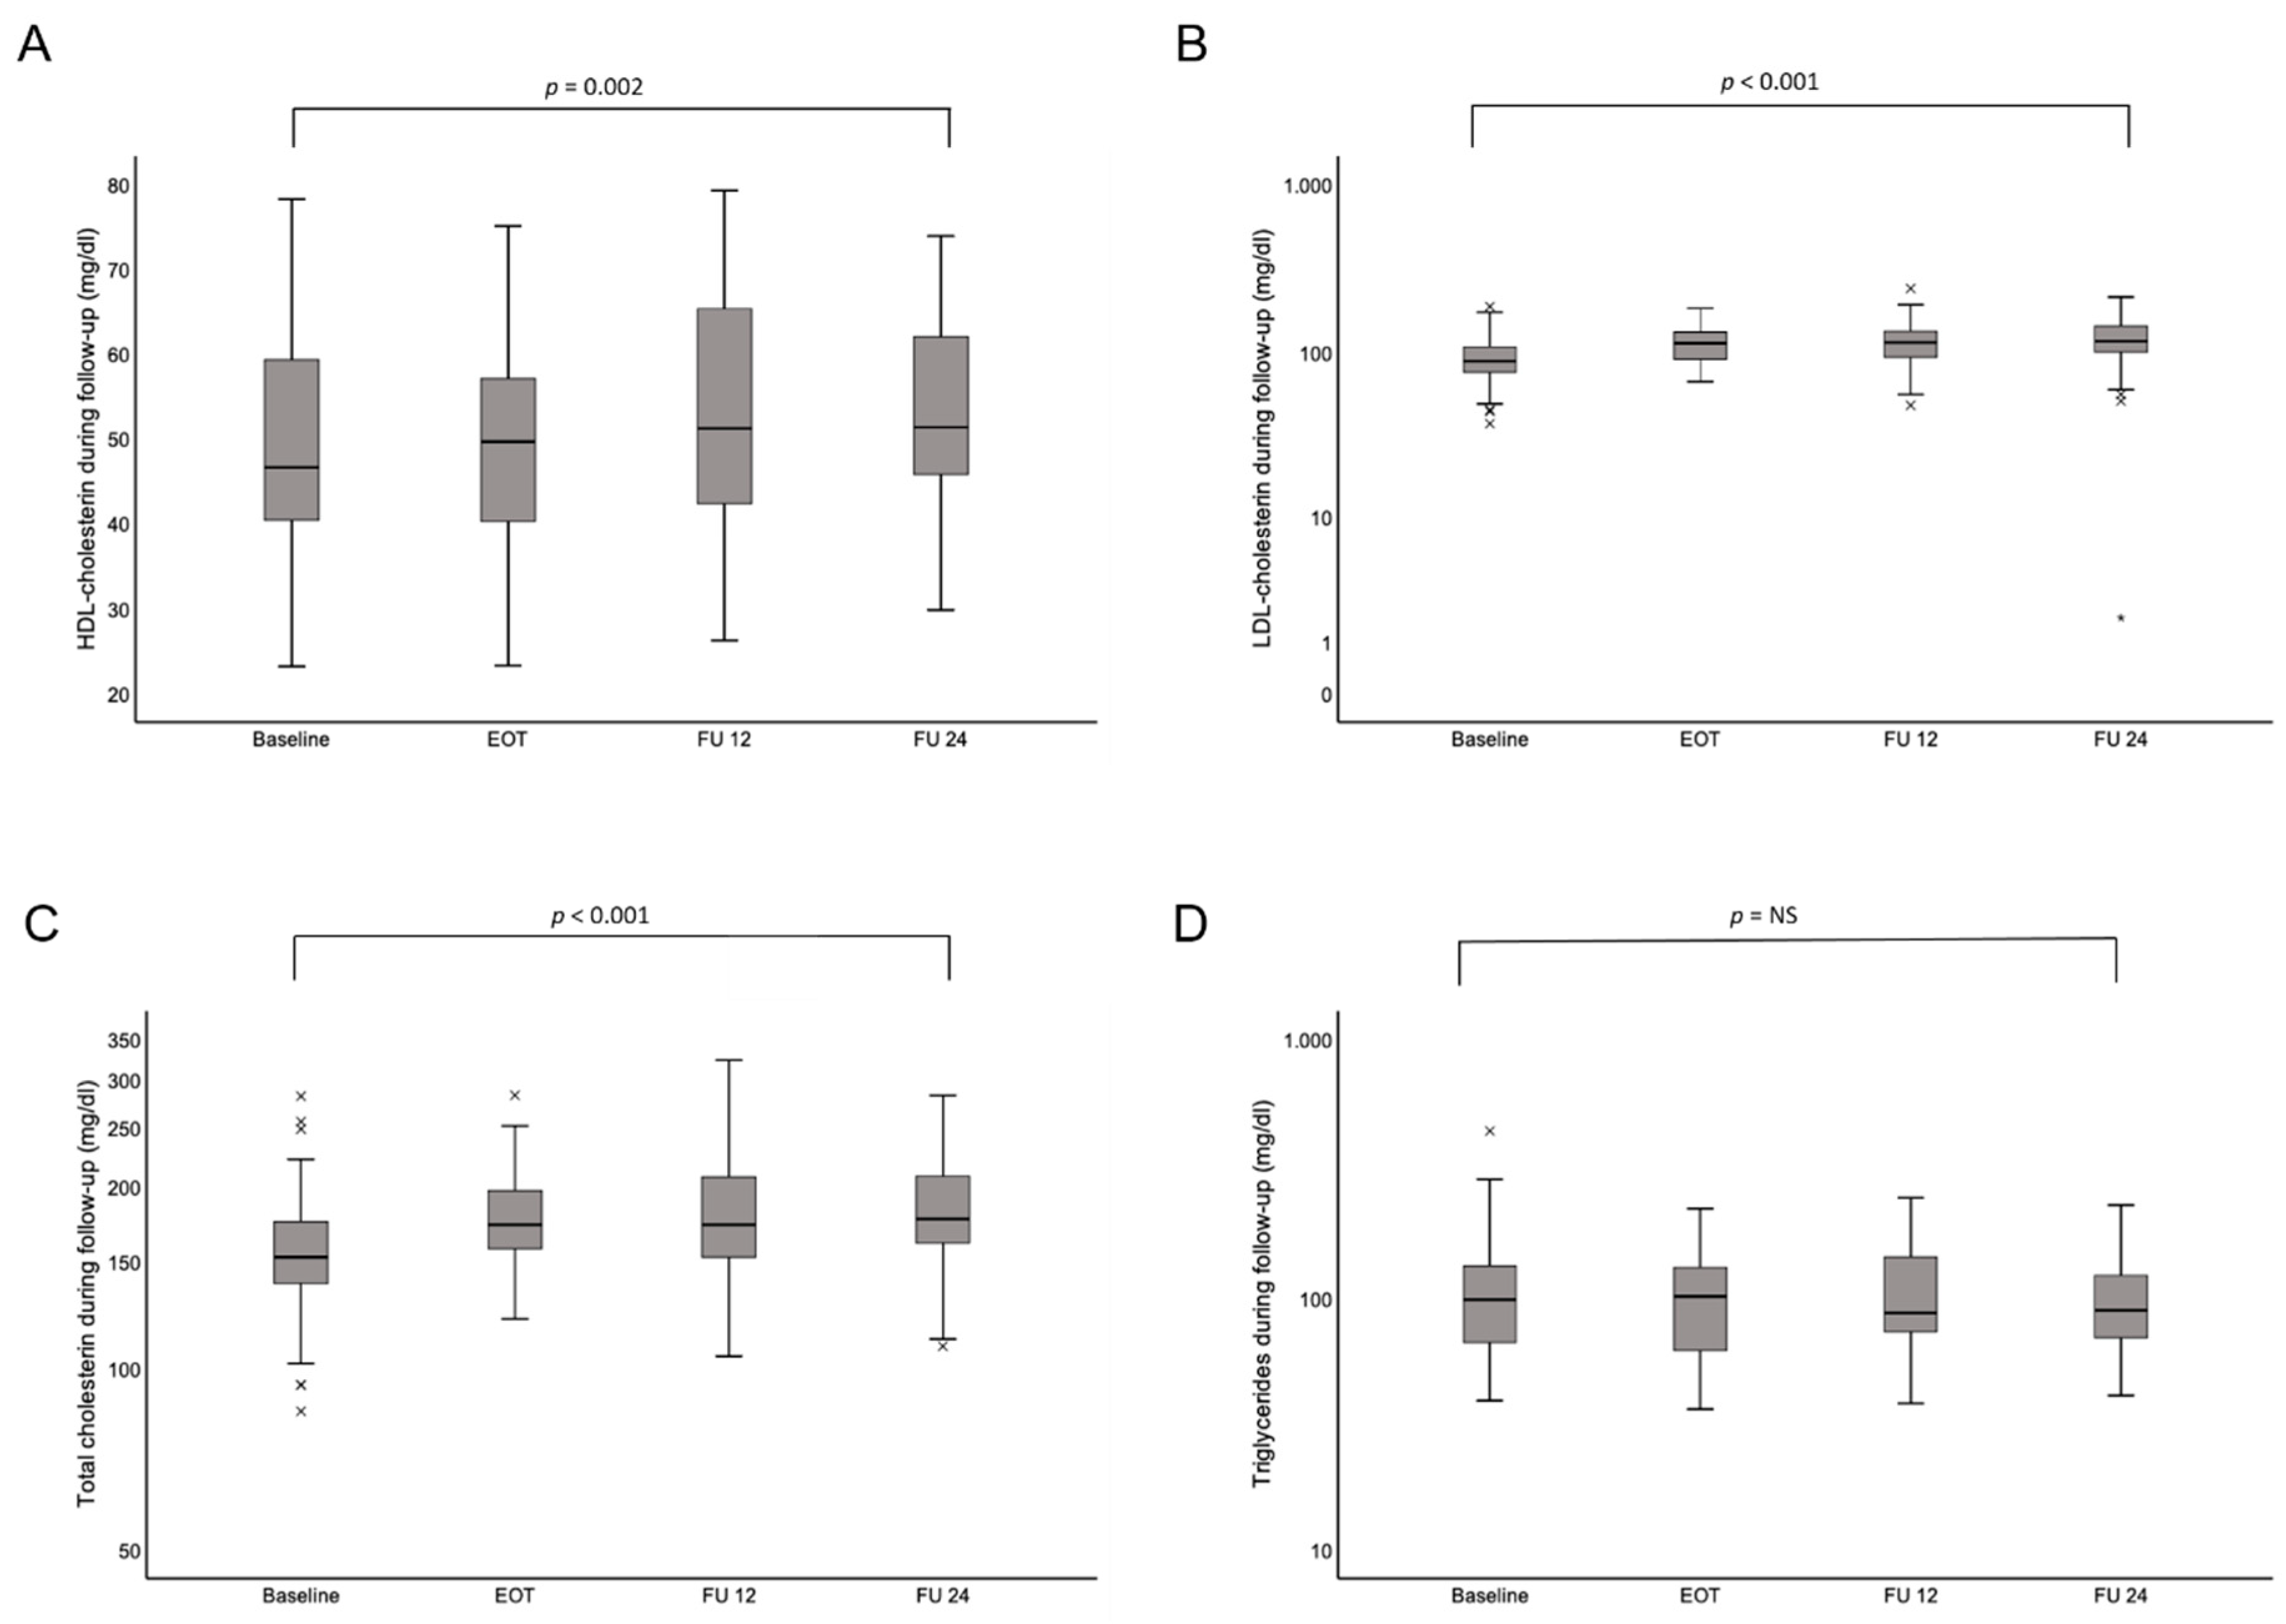
| HDL cholesterol (mg/dL); mean ± SD | 49.8 ± 12.7 | 49.4 ± 11.1 | 52.5 ± 13.1 | 53.8 ± 12.4 | 0.002 |
| LDL cholesterol (mg/dL); mean ± SD | 94.8 ± 34.2 | 111.8 ± 33.7 | 116.5 ± 37.1 | 120.5 ± 39.8 | <0.001 |
| Total cholesterol (mg/dL); mean ± SD | 158 ± 42.4 | 175.5 ± 32.8 | 176.7 ± 43.3 | 182.6 ± 37.7 | <0.001 |
| Triglycerides (mg/dL); mean ± SD | 112.7 ± 73.6 | 104.3 ± 47.2 | 103.6 ± 50.3 | 101.3 ± 45.1 | 0.83 |
© 2020 by the authors. Licensee MDPI, Basel, Switzerland. This article is an open access article distributed under the terms and conditions of the Creative Commons Attribution (CC BY) license (http://creativecommons.org/licenses/by/4.0/).
Share and Cite
Graf, C.; Welzel, T.; Bogdanou, D.; Vermehren, J.; Beckel, A.; Bojunga, J.; Friedrich-Rust, M.; Dietz, J.; Kubesch, A.; Mondorf, A.; et al. Hepatitis C Clearance by Direct-Acting Antivirals Impacts Glucose and Lipid Homeostasis. J. Clin. Med. 2020, 9, 2702. https://doi.org/10.3390/jcm9092702
Graf C, Welzel T, Bogdanou D, Vermehren J, Beckel A, Bojunga J, Friedrich-Rust M, Dietz J, Kubesch A, Mondorf A, et al. Hepatitis C Clearance by Direct-Acting Antivirals Impacts Glucose and Lipid Homeostasis. Journal of Clinical Medicine. 2020; 9(9):2702. https://doi.org/10.3390/jcm9092702
Chicago/Turabian StyleGraf, Christiana, Tania Welzel, Dimitra Bogdanou, Johannes Vermehren, Anita Beckel, Jörg Bojunga, Mireen Friedrich-Rust, Julia Dietz, Alica Kubesch, Antonia Mondorf, and et al. 2020. "Hepatitis C Clearance by Direct-Acting Antivirals Impacts Glucose and Lipid Homeostasis" Journal of Clinical Medicine 9, no. 9: 2702. https://doi.org/10.3390/jcm9092702
APA StyleGraf, C., Welzel, T., Bogdanou, D., Vermehren, J., Beckel, A., Bojunga, J., Friedrich-Rust, M., Dietz, J., Kubesch, A., Mondorf, A., Fischer, S., Lutz, T., Stoffers, P., Herrmann, E., Poynard, T., Zeuzem, S., Dultz, G., & Mihm, U. (2020). Hepatitis C Clearance by Direct-Acting Antivirals Impacts Glucose and Lipid Homeostasis. Journal of Clinical Medicine, 9(9), 2702. https://doi.org/10.3390/jcm9092702