Comparison of Drusen Volume Assessed by Two Different OCT Devices

 , , ,
, , ,
Abstract
1. Introduction
2. Experimental Section
3. Results
3.1. Demography
3.2. Intra-Device Comparison before and after Manual Correction
3.3. Inter-Device Comparison Using Manufacturer Software
3.4. Intra-Device Comparison Using Manufacturer vs. Customized Discovery Software
3.5. Interdevice Comparison Using Customized Software
4. Discussion
Author Contributions
Funding
Conflicts of Interest
References
- van der Schaft, T.L.; Mooy, C.M.; de Bruijn, W.C.; Oron, F.G.; Mulder, P.G.H.; de Jong, P.T.V.M. Histologic features of the early stages of age-related macular degeneration: A statistical analysis. Ophthalmology 1992, 99, 278–286. [Google Scholar] [CrossRef]
- Guymer, R.H.; Wu, Z.; Hodgson, L.A.B.; Caruso, E.; Brassington, K.H.; Tindill, N.; Aung, K.Z.; McGuinness, M.B.; Fletcher, E.L.; Chen, F.K.; et al. Subthreshold nanosecond laser intervention in age-related macular degeneration: The LEAD randomized controlled clinical trial. Ophthalmology 2019, 126, 829–838. [Google Scholar] [CrossRef] [PubMed]
- Markowitz, S.N.; Devenyi, R.G.; Munk, M.R.; Croissant, C.L.; Tedford, S.E.; Rückert, R.; Walker, M.G.; Patino, B.E.; Chen, L.; Nido, M.; et al. A double-masked, randomized, sham-controlled, single-center study with photobiomodulation for the treatment of dry age-related macular degeneration. Retina 2019, 40, 1471–1482. [Google Scholar] [CrossRef] [PubMed]
- Age-Related Eye Disease Study Research Group. The age-related eye disease study system for classifying age-related macular degeneration from stereoscopic color fundus photographs: The age-related eye disease study report number 6. Am. J. Ophthalmol. 2001, 132, 668–681. [Google Scholar] [CrossRef]
- Bartlett, H.; Eperjesi, F. Use of fundus imaging in quantification of age-related macular change. Surv. Ophthalmol. 2007, 52, 655–671. [Google Scholar] [CrossRef]
- Scholl, H.P.N.; Peto, T.; Dandekar, S.; Bunce, C.; Xing, W.; Jenkins, S.; Bird, A.C. Inter- and intra-observer variability in grading lesions of age-related maculopathy and macular degeneration. Graefes Arch. Clin. Exp. Ophthalmol. 2003, 241, 39–47. [Google Scholar] [CrossRef]
- Pirbhai, A.; Sheidow, T.; Hooper, P. Prospective evaluation of digital non-stereo color fundus photography as a screening tool in age-related macular degeneration. Am. J. Ophthalmol. 2005, 139, 455–461. [Google Scholar] [CrossRef]
- Freeman, S.R.; Kozak, I.; Cheng, L.; Bartsch, D.U.; Mojana, F.; Nigam, N.; Brar, M.; Yuson, R.; Freeman, W.R. Optical coherence tomography-raster scanning and manual segmentation in determining drusen volume in age-related macular degeneration. Retina 2010, 30, 431–435. [Google Scholar] [CrossRef]
- Abdelfattah, N.S.; Zhang, H.; Boyer, D.S.; Rosenfeld, P.J.; Feuer, W.J.; Gregori, G.; Sadda, S.R. Drusen volume as a predictor of disease progression in patients with late age-related macular degeneration in the fellow eye. Investig. Ophthalmol. Vis. Sci. 2016, 57, 1839–1846. [Google Scholar] [CrossRef]
- Saleh, R.; Karpe, A.; Zinkernagel, M.S.; Munk, M.R. Inner retinal layer change in glaucoma patients receiving anti-VEGF for neovascular age related macular degeneration. Graefes Arch. Clin. Exp. Ophthalmol. 2017, 255, 817–824. [Google Scholar] [CrossRef]
- Diniz, B.; Rodger, D.C.; Chavali, V.R.; Mackay, T.; Lee, S.Y.; Stambolian, D.; Sadda, S.V.R. Drusen and RPE atrophy automated quantification by optical coherence tomography in an elderly population. Eye 2015, 29, 272–279. [Google Scholar] [CrossRef] [PubMed]
- Schlanitz, F.G.; Baumann, B.; Kundi, M.; Sacu, S.; Baratsits, M.; Scheschy, U.; Shahlaee, A.; Mittermüller, T.J.; Montuoro, A.; Roberts, P.; et al. Drusen volume development over time and its relevance to the course of age-related macular degeneration. Br. J. Ophthalmol. 2017, 101, 198–203. [Google Scholar] [CrossRef] [PubMed]
- Toth, C.A.; Farsiu, S.; Chiu, S.J.; Khanifar, A.A.; Izatt, J.A. Automatic Drusen Segmentation and Characterization in Spectral Domain Optical Coherence Tomography (SDOCT) Images of AMD Eyes. Investig. Ophthalmol. Vis. Sci. 2008, 49, 5394. [Google Scholar]
- Chiu, S.J.; Izatt, J.A.; O’Connell, R.V.; Winter, K.P.; Toth, C.A.; Farsiu, S. Validated automatic segmentation of AMD pathology including drusen and geographic atrophy in SD-OCT images. Investig. Ophthalmol. Vis. Sci. 2012, 53, 53–61. [Google Scholar] [CrossRef]
- de Sisternes, L.; Jonna, G.; Greven, M.A.; Chen, Q.; Leng, T.; Rubin, D.L. Individual drusen segmentation and repeatability and reproducibility of their automated quantification in optical coherence tomography images. Transl. Vis. Sci. Technol. 2017, 6, 12. [Google Scholar] [CrossRef]
- Wintergerst, M.W.M.; Schultz, T.; Birtel, J.; Schuster, A.K.; Pfeiffer, N.; Schmitz-Valckenberg, S.; Holz, F.G.; Finger, R.P. Algorithms for the automated analysis of age-related macular degeneration biomarkers on optical coherence tomography: A systematic review. Transl. Vis. Sci. Technol. 2017, 6, 10. [Google Scholar] [CrossRef]
- Lindblad, A.S.; Kassoff, A.; Kieval, S.; Mehu, M.; Buehler, J.; Eglow, M.; Kaufman, F.; Margherio, R.R.; Cox, M.S.; Garretson, B.; et al. The age-related eye disease study (AREDS): Design implications AREDS report no. 1. Control. Clin. Trials 1999, 20, 573–600. [Google Scholar]
- Joeres, S.; Tsong, J.W.; Updike, P.G.; Collins, A.T.; Dustin, L.; Walsh, A.C.; Romano, P.W.; Sadda, S.V.R. Reproducibility of quantitative optical coherence tomography subanalysis in neovascular age-related macular degeneration. Investig. Ophthalmol. Vis. Sci. 2007, 48, 4300–4307. [Google Scholar] [CrossRef]
- Gregori, G.; Wang, F.; Rosenfeld, P.J.; Yehoshua, Z.; Gregori, N.Z.; Lujan, B.J.; Puliafito, C.A.; Feuer, W.J. Spectral domain optical coherence tomography imaging of drusen in nonexudative age-related macular degeneration. Ophthalmology 2011, 118, 1373–1379. [Google Scholar] [CrossRef]
- Yehoshua, Z.; Gregori, G.; Sadda, S.R.; Penha, F.M.; Goldhardt, R.; Nittala, M.G.; Konduru, R.K.; Feuer, W.J.; Gupta, P.; Li, Y.; et al. Comparison of drusen area detected by spectral domain optical coherence tomography and color fundus imaging. Investig. Ophthalmol. Vis. Sci. 2013, 54, 2429–2434. [Google Scholar] [CrossRef]
- Khanifar, A.A.; Koreishi, A.F.; Izatt, J.A.; Toth, C.A. Drusen ultrastructure imaging with spectral domain optical coherence tomography in age-related macular degeneration. Ophthalmology 2008, 115, 1883–1890. [Google Scholar] [CrossRef] [PubMed]
- Nittala, M.G.; Ruiz-Garcia, H.; Sadda, S.R. Accuracy and reproducibility of automated drusen segmentation in eyes with non-neovascular age-related macular degeneration. Investig. Ophthalmol. Vis. Sci. 2012, 53, 8319–8324. [Google Scholar] [CrossRef] [PubMed]
- Bogunovic, H.; Montuoro, A.; Baratsits, M.; Karantonis, M.G.; Waldstein, S.M.; Schlanitz, F.; Schmidt-Erfurth, U. Machine learning of the progression of intermediate age-related macular degeneration based on OCT imaging. Investig. Ophthalmol. Vis. Sci. 2017, 58, BIO141–BIO150. [Google Scholar] [CrossRef] [PubMed]
- Lee, E.S.; Kang, S.Y.; Choi, E.H.; Kim, J.H.; Kim, N.R.; Seong, G.J.; Kim, C.Y. Comparisons of nerve fiber layer thickness measurements between Stratus, Cirrus, and RTVue OCTs in healthy and glaucomatous eyes. Optom. Vis. Sci. 2011, 88, 751–758. [Google Scholar] [CrossRef] [PubMed]
- Schlanitz, F.G.; Ahlers, C.; Sacu, S.; Schütze, C.; Rodriguez, M.; Schriefl, S.; Golbaz, I.; Spalek, T.; Stock, G.; Schmidt-Erfurth, U. Performance of drusen detection by spectral-domain optical coherence tomography. Investig. Ophthalmol. Vis. Sci. 2010, 51, 6715–6721. [Google Scholar] [CrossRef]
- Yehoshua, Z.; Wang, F.; Rosenfeld, P.J.; Penha, F.M.; Feuer, W.J.; Gregori, G. Natural history of drusen morphology in age-related macular degeneration using spectral domain optical coherence tomography. Ophthalmology 2011, 118, 2434–2441. [Google Scholar] [CrossRef]
- Waldstein, S.M.; Gerendas, B.S.; Montuoro, A.; Simader, C.; Schmidt-Erfurth, U. Quantitative comparison of macular segmentation performance using identical retinal regions across multiple spectral-domain optical coherence tomography instruments. Br. J. Ophthalmol. 2015, 99, 794–800. [Google Scholar] [CrossRef]
- Knight, O.J.; Chang, R.T.; Feuer, W.J.; Budenz, D.L. Comparison of retinal nerve fiber layer measurements using time domain and spectral domain optical coherent tomography. Ophthalmology 2009, 116, 1271–1277. [Google Scholar] [CrossRef]


| Segmentation | Heidelberg Spectralis SD-OCT(Mean ± SD, mm3) | Zeiss Plex Elite SS-OCT(Mean ± SD, mm3) |
|---|---|---|
| Automatic 1 | 0.1375 ± 0.0329 | 0.0331 ± 0.0429 |
| Manually 2 corrected | 0.1563 ± 0.0490 | 0.0331 ± 0.0428 |
| Discovery 3 | 0.1025 ± 0.1074 | 0.1237 ± 0.1353 |
| Discovery subsampled 4 | 0.1233 ± 0.1348 |
| Segmentation | Mean difference ± SD, mm3 | p-Value (T-Test) | Correlation (r) |
|---|---|---|---|
| SD Automatic 1 vs. SS Automatic 1 | 0.1044 ± 0.0289 | p < 0.001 corr. p < 0.001 | 0.718 |
| SD Manually 2 vs. SS Manually 2 | 0.1231 ± 0.0371 | p < 0.001 corr. p < 0.001 | 0.681 |
| SD Manually 2 vs. SD discovery 3 | 0.0547 ± 0.0744 | p < 0.001 corr. p < 0.001 | 0.798 |
| SS Manually 2 vs. SS discovery 3 | 0.0906 ± 0.101 | p < 0.001 corr. p < 0.001 | 0.854 |
| SS discovery 3 vs. SS discovery 3 subsampled 4 | 0.0004 ± 0.0063 | p = 0.733 corr. p = 0.733 | 0.999 |
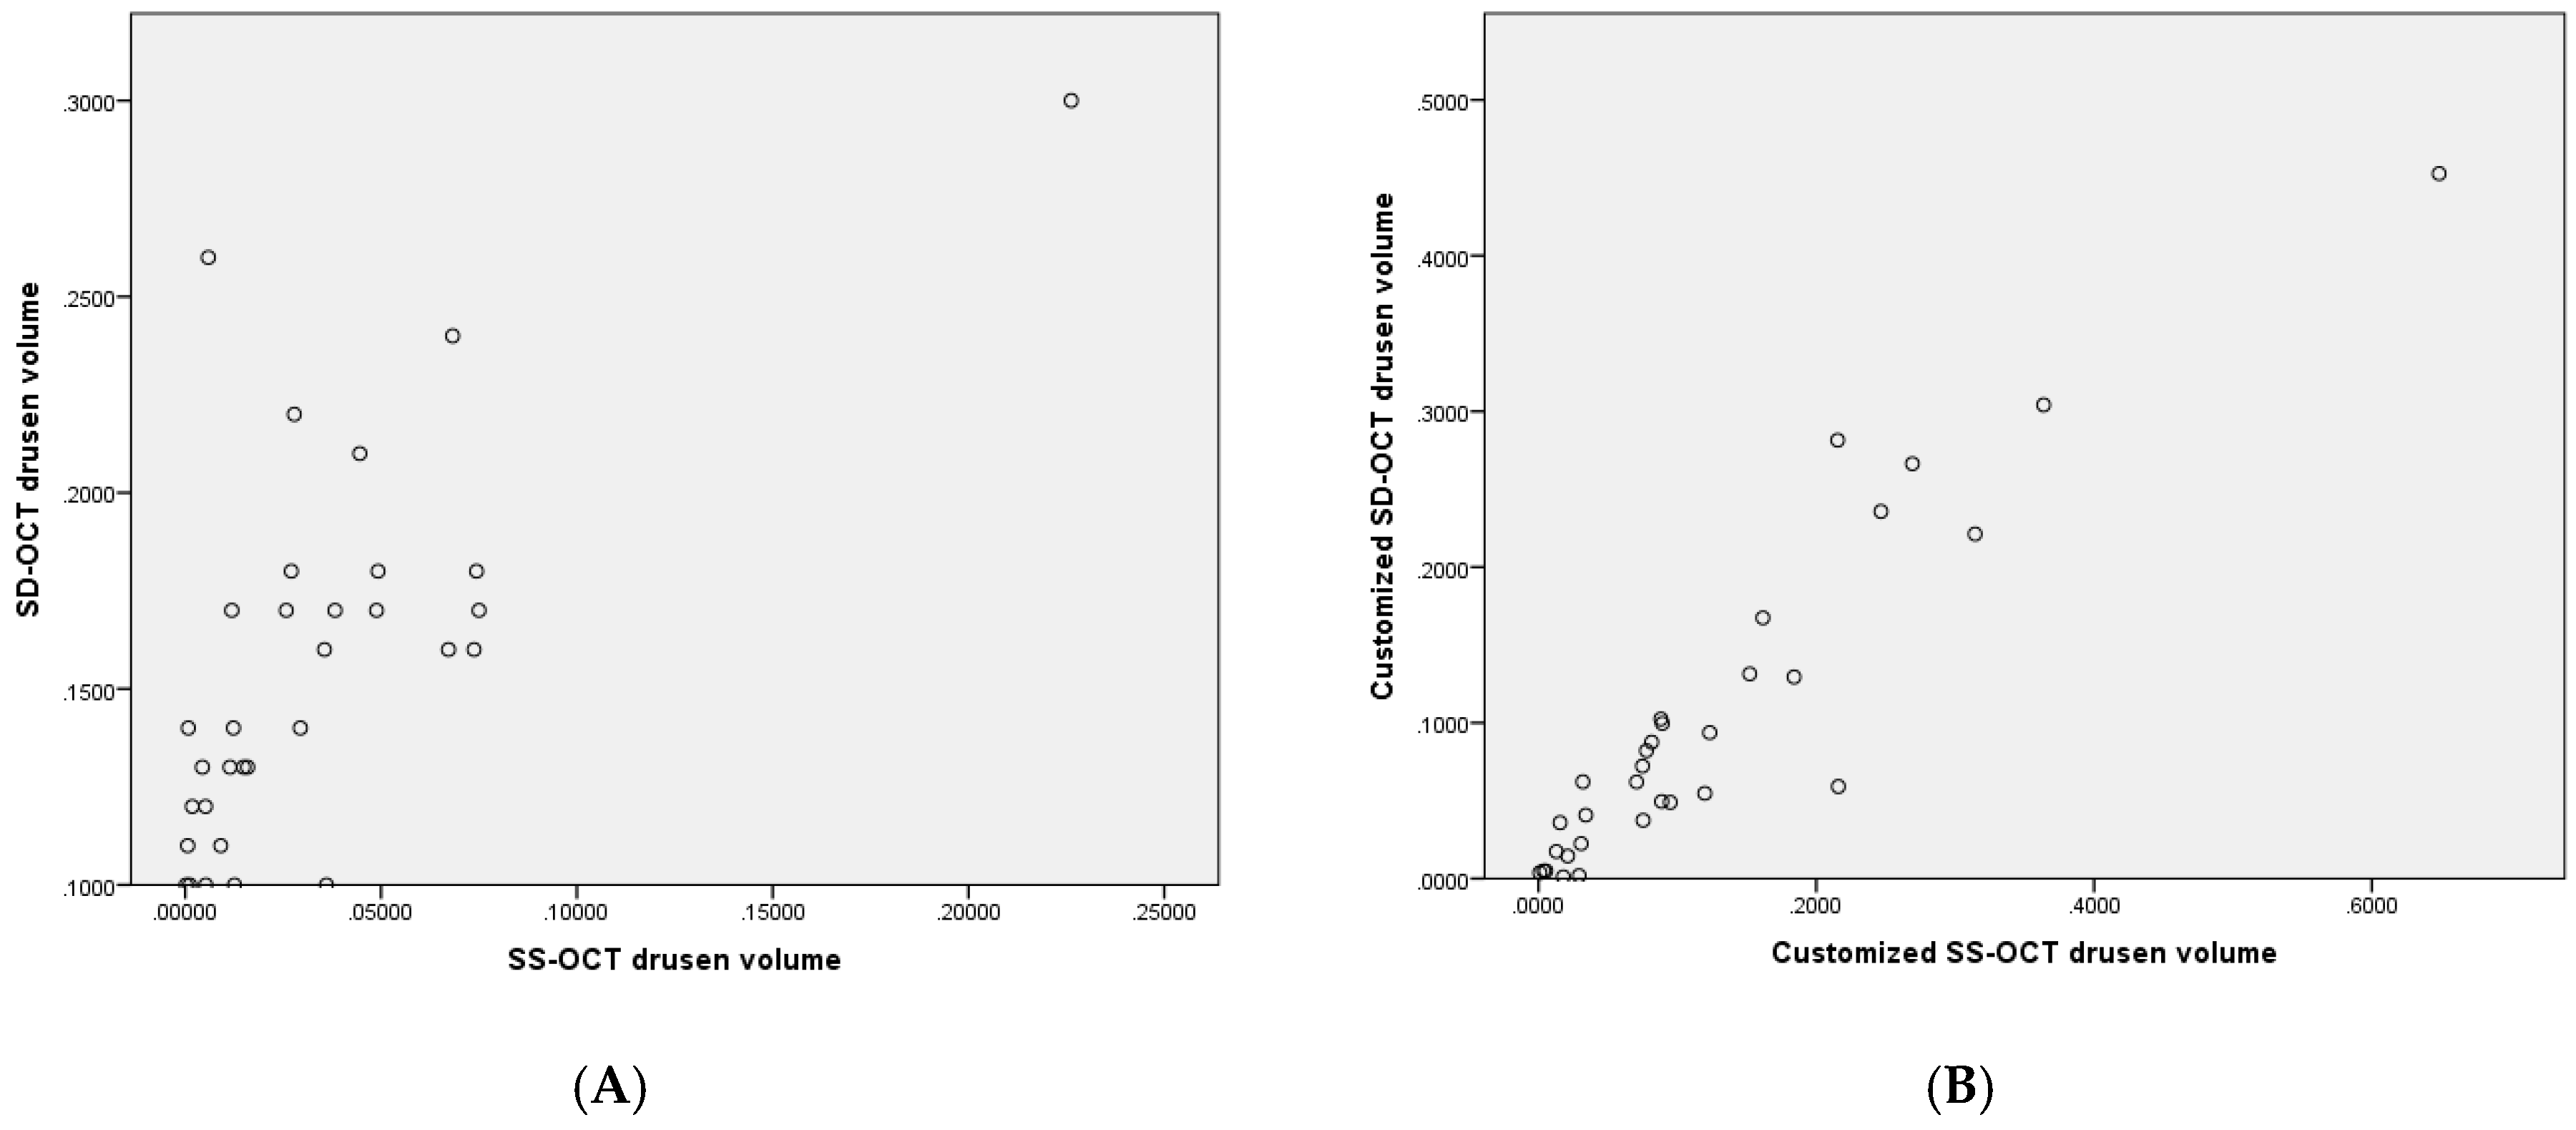
| SD discovery 3 vs. SS discovery 3 | 0.0547 ± 0.0744 | p = 0.02 corr. p = 0.08 | 0.937 |
| SD discovery 3 vs. SS- discovery 3 subsampled 4 | 0.0218 ± 0.0514 | p = 0.023 corr. p = 0.069 | 0.935 |
© 2020 by the authors. Licensee MDPI, Basel, Switzerland. This article is an open access article distributed under the terms and conditions of the Creative Commons Attribution (CC BY) license (http://creativecommons.org/licenses/by/4.0/).
Share and Cite
Beck, M.; Joshi, D.S.; Berger, L.; Klose, G.; De Zanet, S.; Mosinska, A.; Apostolopoulos, S.; Ebneter, A.; Zinkernagel, M.S.; Wolf, S.; et al. Comparison of Drusen Volume Assessed by Two Different OCT Devices. J. Clin. Med. 2020, 9, 2657. https://doi.org/10.3390/jcm9082657
Beck M, Joshi DS, Berger L, Klose G, De Zanet S, Mosinska A, Apostolopoulos S, Ebneter A, Zinkernagel MS, Wolf S, et al. Comparison of Drusen Volume Assessed by Two Different OCT Devices. Journal of Clinical Medicine. 2020; 9(8):2657. https://doi.org/10.3390/jcm9082657
Chicago/Turabian StyleBeck, Marco, Devika S. Joshi, Lieselotte Berger, Gerd Klose, Sandro De Zanet, Agata Mosinska, Stefanos Apostolopoulos, Andreas Ebneter, Martin S. Zinkernagel, Sebastian Wolf, and et al. 2020. "Comparison of Drusen Volume Assessed by Two Different OCT Devices" Journal of Clinical Medicine 9, no. 8: 2657. https://doi.org/10.3390/jcm9082657
APA StyleBeck, M., Joshi, D. S., Berger, L., Klose, G., De Zanet, S., Mosinska, A., Apostolopoulos, S., Ebneter, A., Zinkernagel, M. S., Wolf, S., & Munk, M. R. (2020). Comparison of Drusen Volume Assessed by Two Different OCT Devices. Journal of Clinical Medicine, 9(8), 2657. https://doi.org/10.3390/jcm9082657