Influence of Sociodemographic, Premorbid, and Injury-Related Factors on Post-Concussion Symptoms after Traumatic Brain Injury

 ,
,  , , ,
, , , 
Abstract
1. Introduction
- Investigating the probability of occurrence and the frequency (number) of PCS by applying a zero-inflated negative binomial model (see Statistical analyses).
- Examining the factors associated with the intensity of PCS among individuals after TBI using a well-established statistical approach (i.e., negative binomial model; see Statistical analyses).
2. Methods
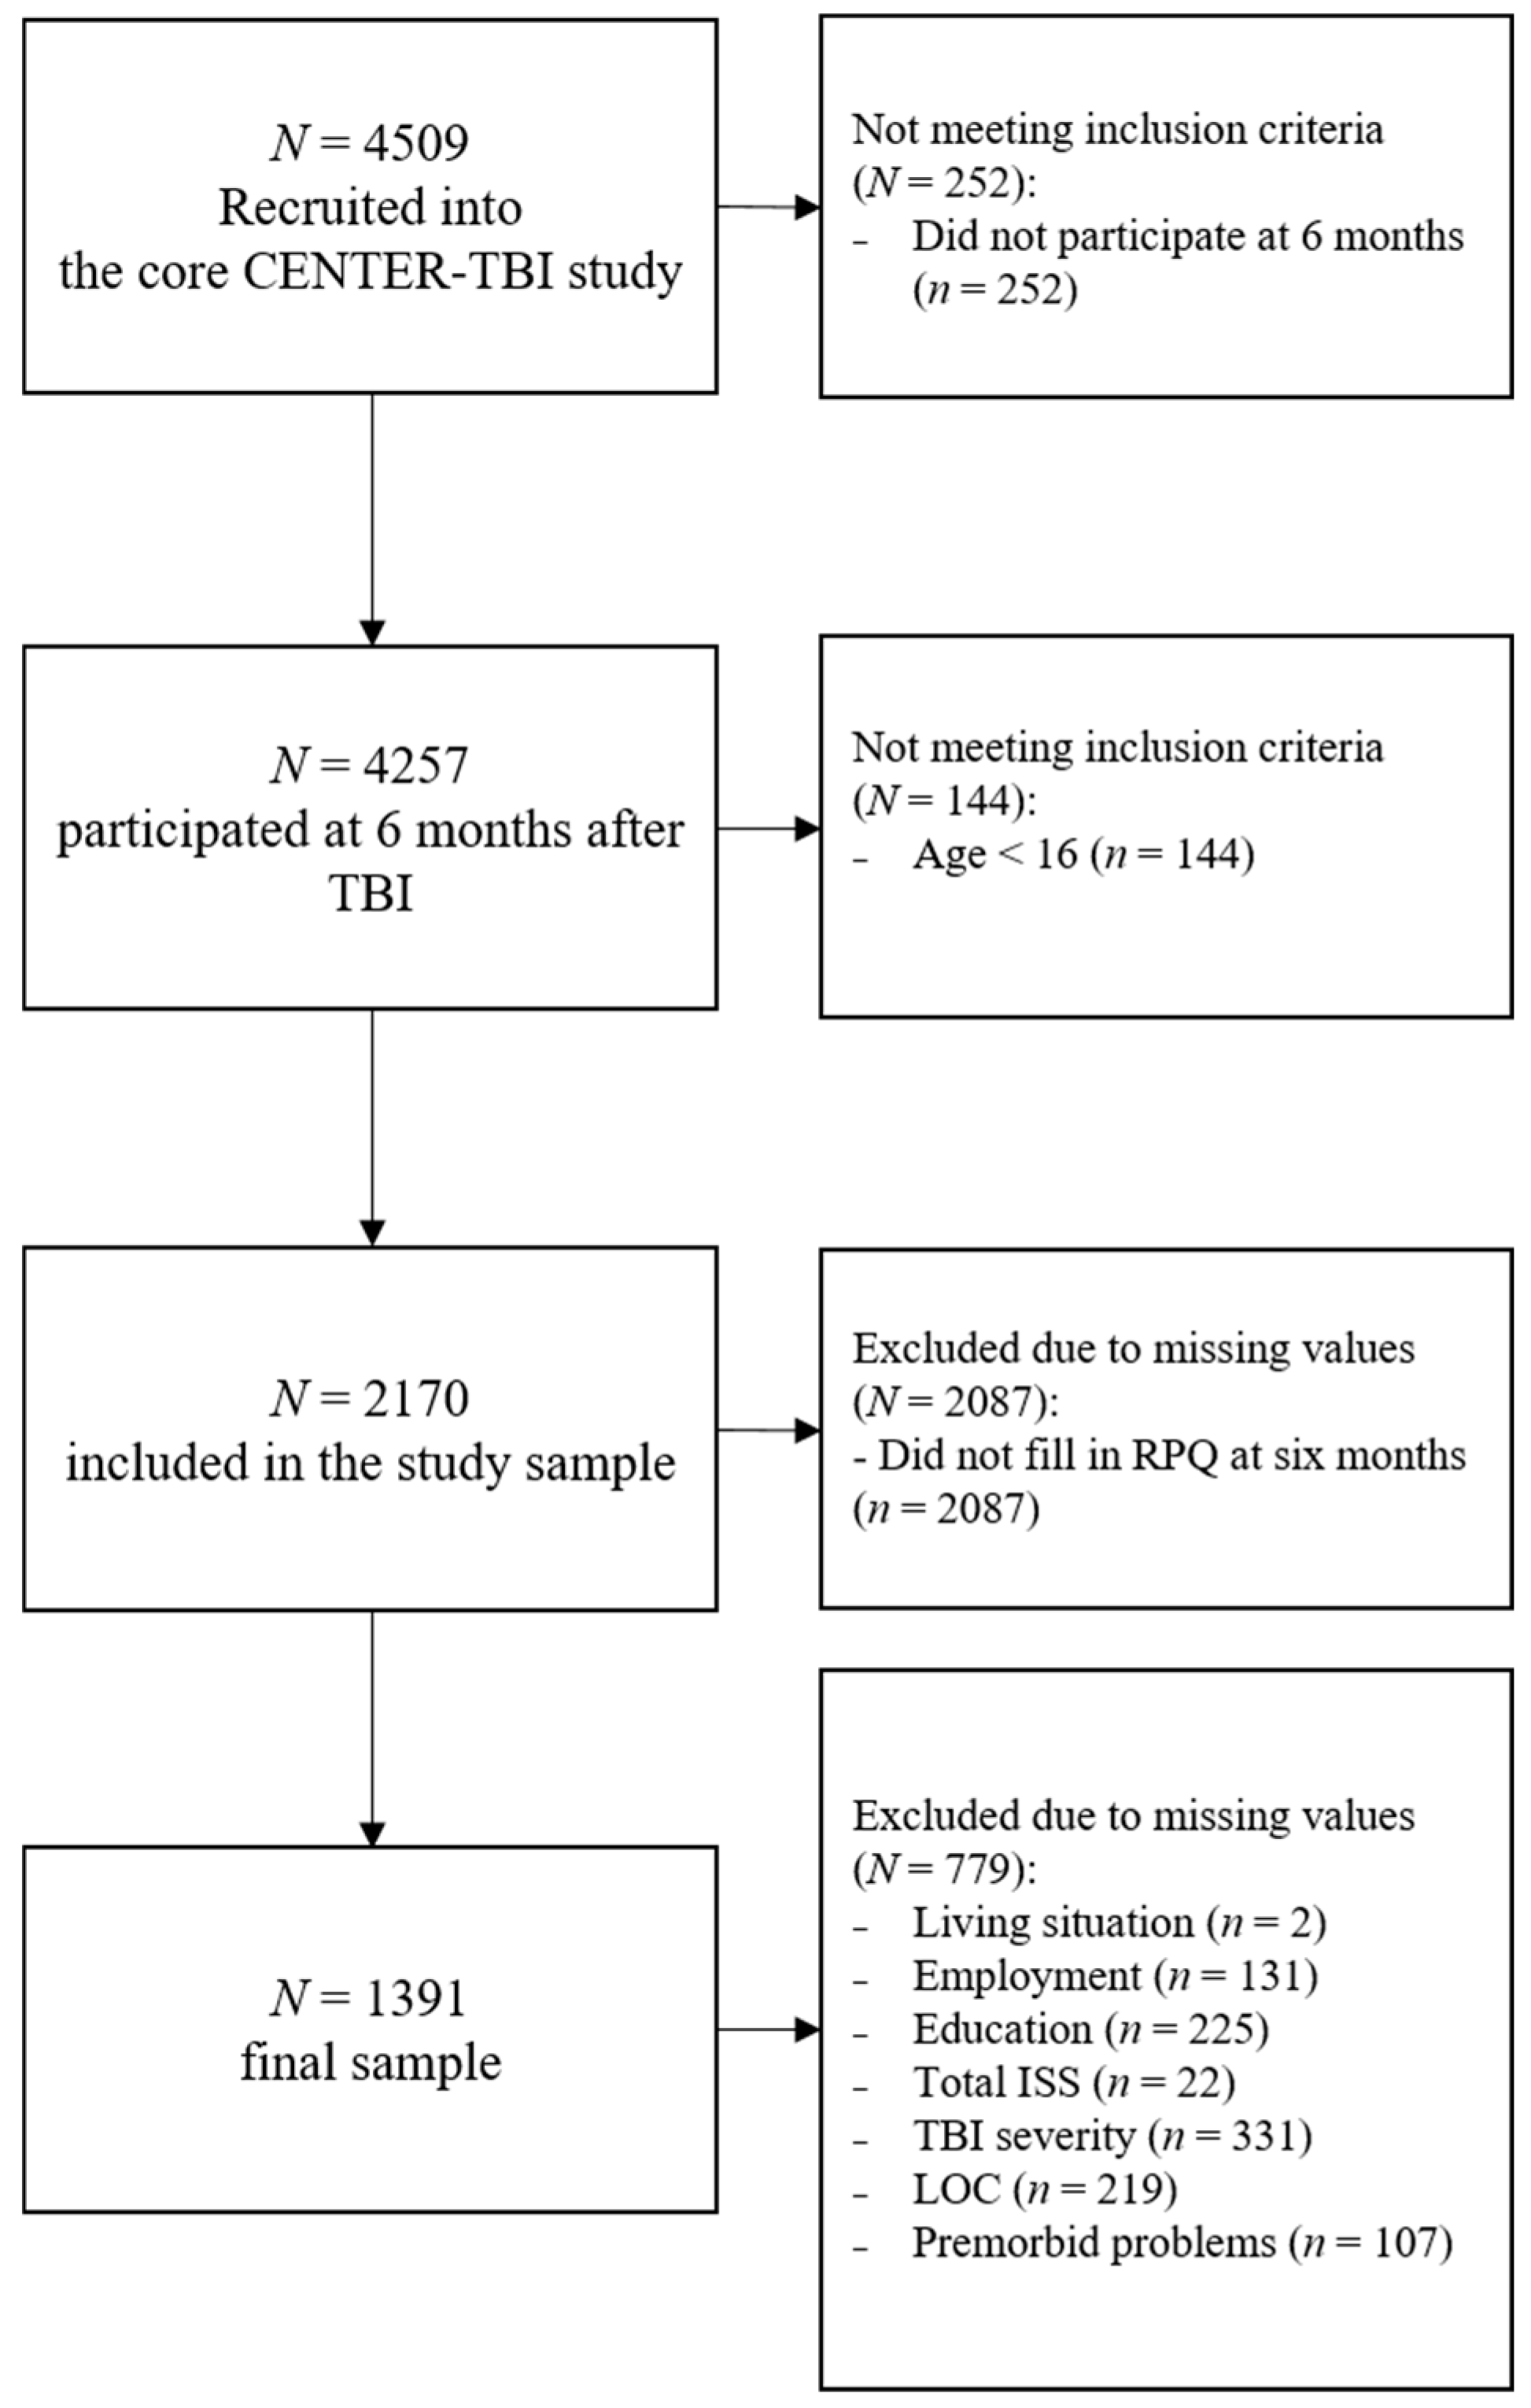
2.1. Participants
2.2. Ethical Approval
2.3. Instruments
2.4. Statistical Analyses
2.5. Model for Occurrence and Frequency of PCS
2.6. Model for Intensity of PCS
3. Results
3.1. Sample Characteristics
3.2. Model Building Procedure
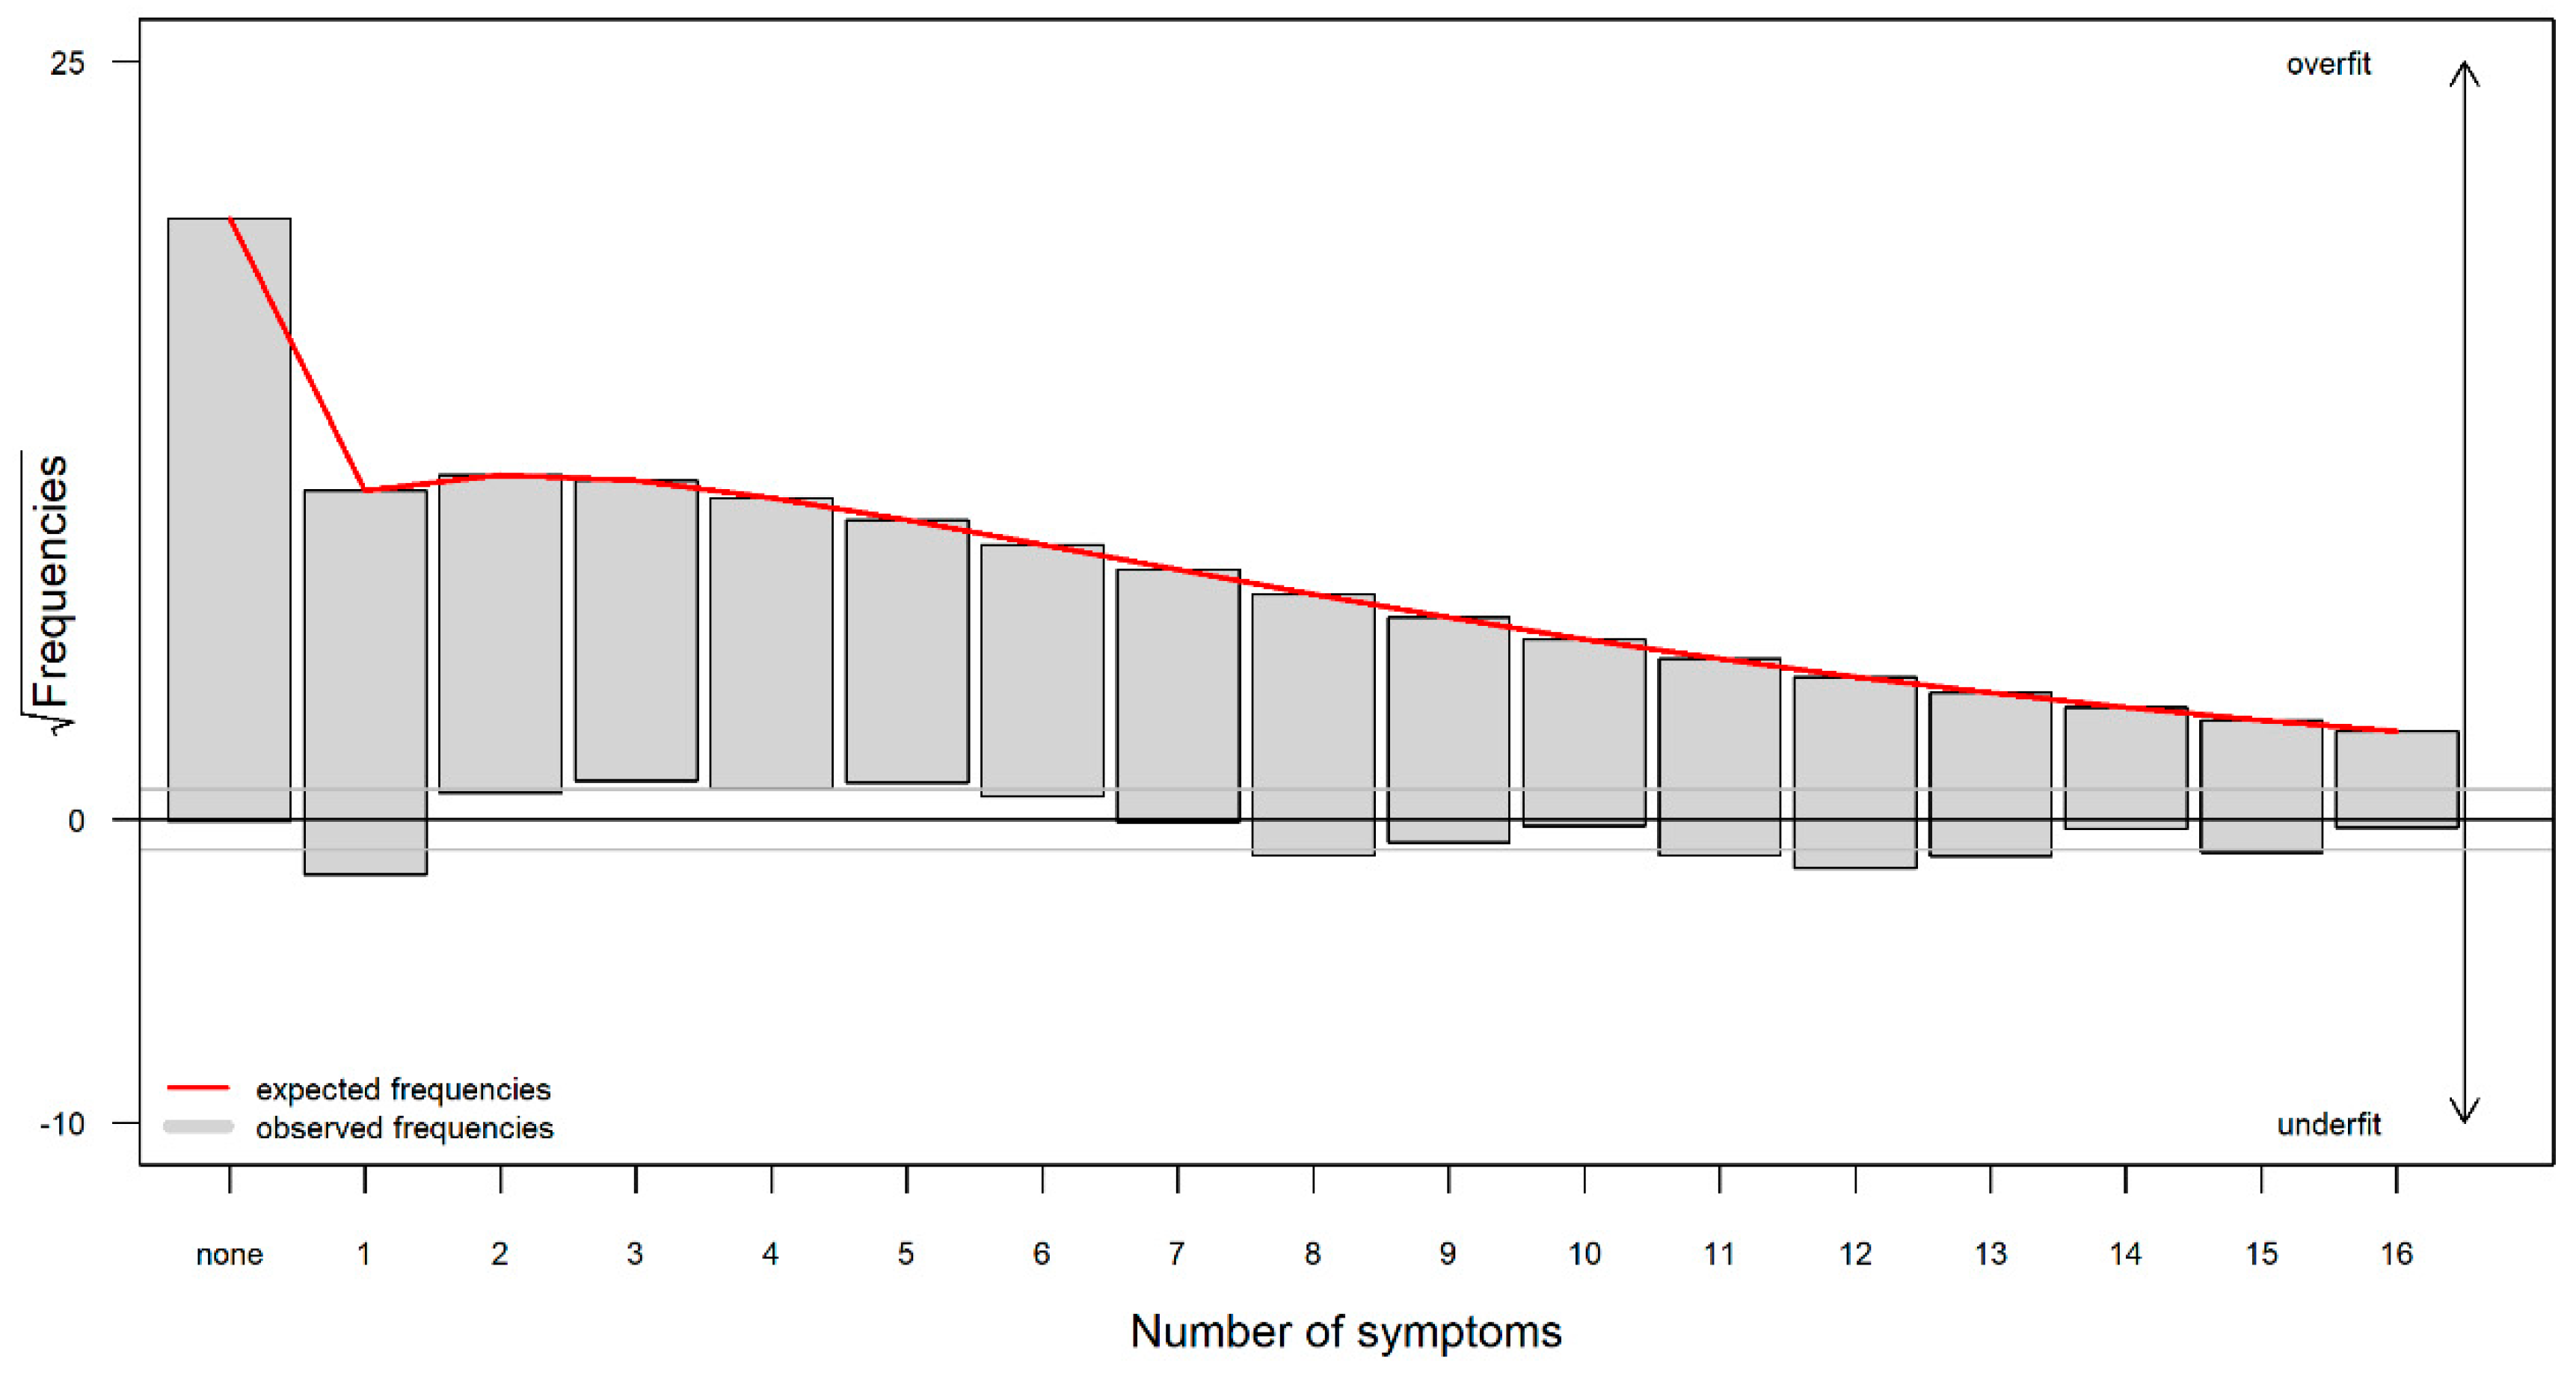
3.3. Occurrence and Frequency of PCS
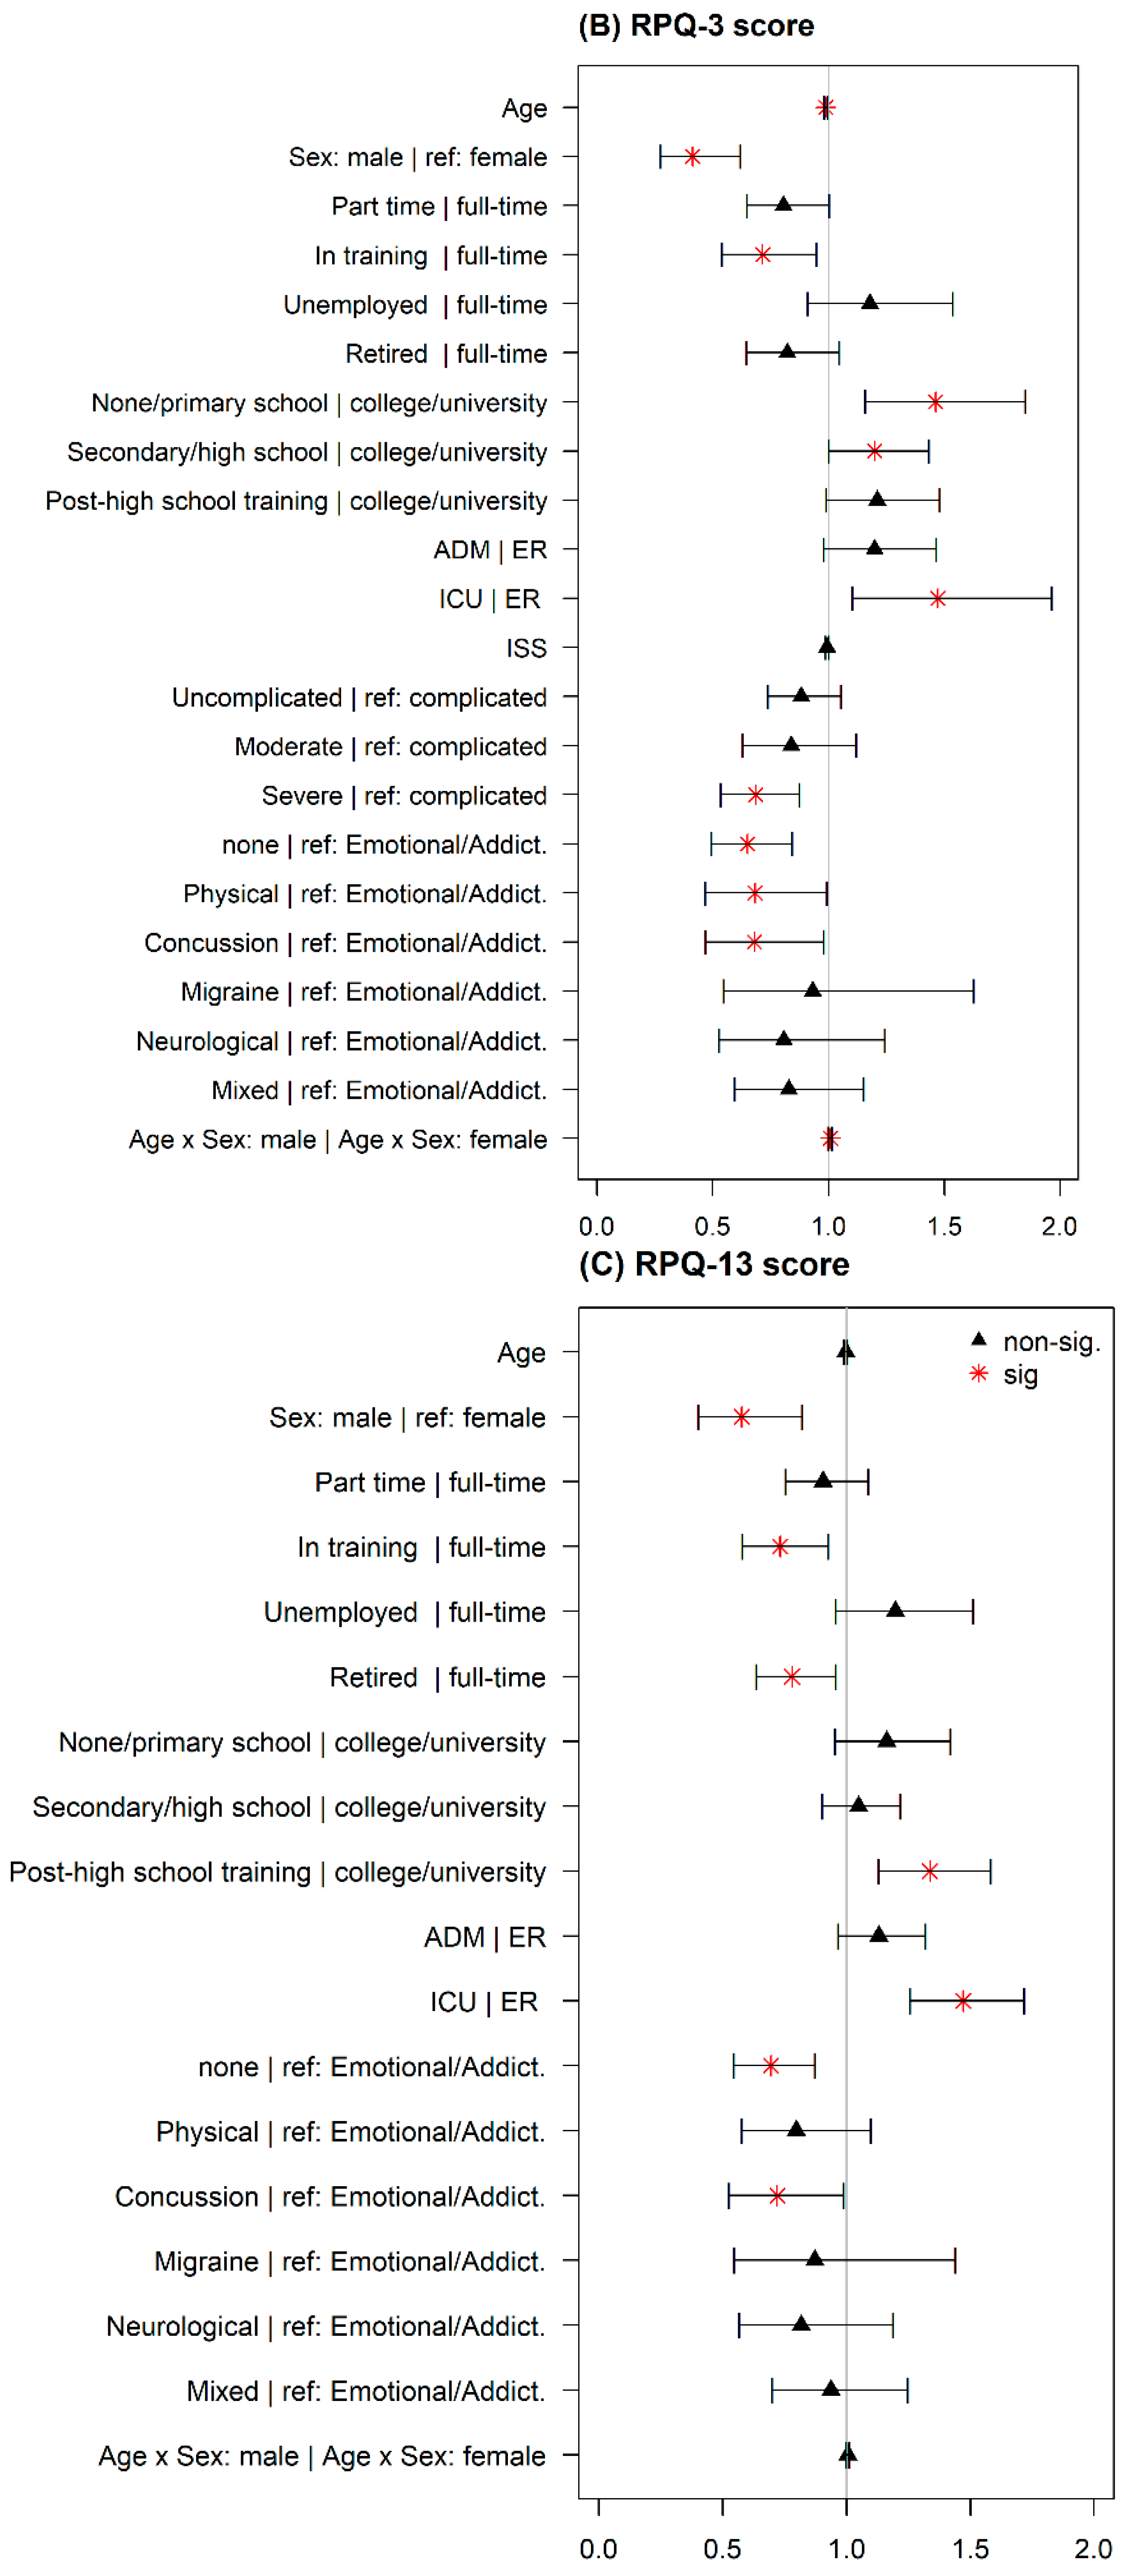
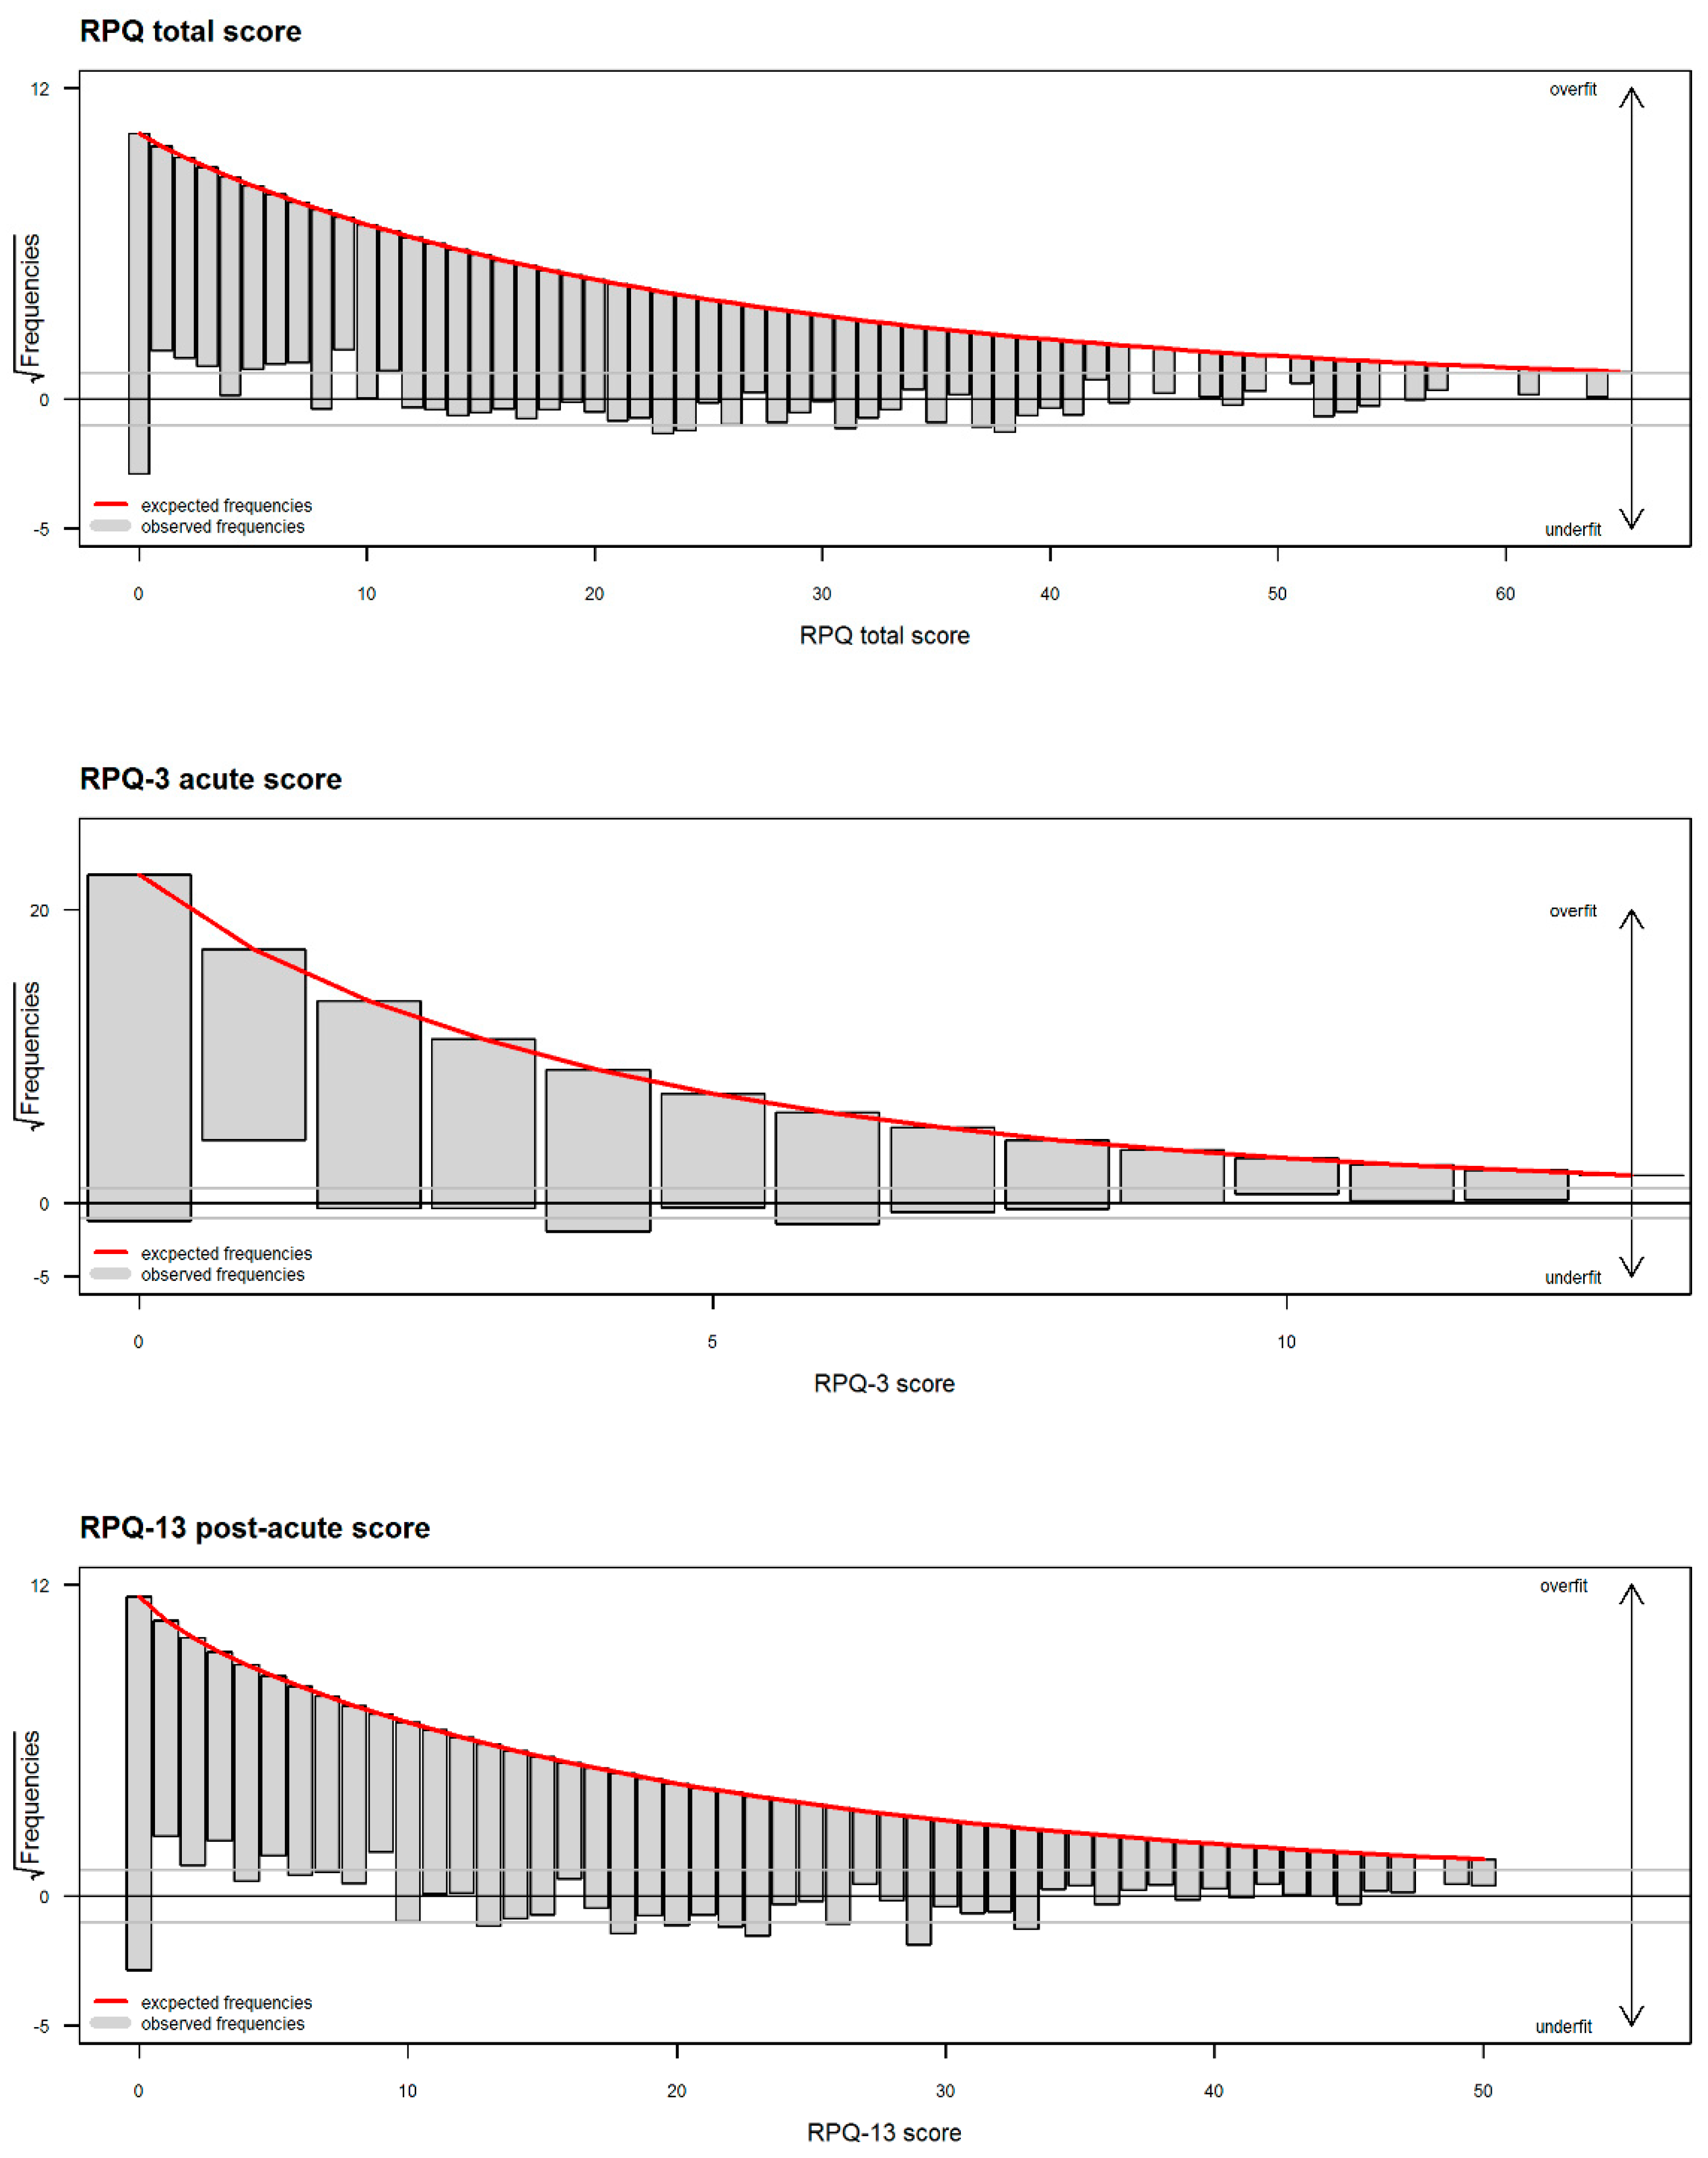
3.4. Intensity of PCS
4. Discussion
5. Conclusions
Supplementary Materials
Author Contributions
Funding
Acknowledgments
Conflicts of Interest
Appendix A


Appendix B

| Zero Model | Count Model | |||||||||||||
|---|---|---|---|---|---|---|---|---|---|---|---|---|---|---|
| No. | Predictors | Levels|reference group | Est. | S.E. | z | OR | CI95 | p | Est. | S.E. | z | RR | CI95 | p |
| Intercept | −3.62 | 0.88 | −4.12 | 0.03 | [0.01, 0.15] | <0.001 | 2.06 | 0.20 | 10.21 | 7.88 | [5.30, 11.71] | <0.001 | ||
| (1) | Age | in years | 0.01 | 0.01 | 1.41 | 1.01 | [0.99, 1.03] | 0.158 | 0.00 | 0.00 | −1.24 | 1.00 | [0.99, 1.00] | 0.216 |
| (2) | Sex | male|female | 0.93 | 0.51 | 1.81 | 2.53 | [0.93, 6.90] | 0.070 | −0.56 | 0.17 | −3.35 | 0.57 | [0.41, 0.79] | 0.001 |
| (4) | Employment | part time|full-time | 0.09 | 0.26 | 0.36 | 1.10 | [0.66, 1.84] | 0.722 | −0.07 | 0.08 | −0.86 | 0.93 | [0.79, 1.10] | 0.390 |
| in training|full-time | 0.88 | 0.33 | 2.66 | 2.41 | [1.26, 4.61] | 0.008 | −0.19 | 0.12 | −1.61 | 0.83 | [0.66, 1.04] | 0.107 | ||
| unemployed|full-time | −0.12 | 0.37 | −0.33 | 0.89 | [0.43, 1.83] | 0.743 | 0.20 | 0.10 | 2.02 | 1.22 | [1.01, 1.47] | 0.044 | ||
| retired|full-time | 0.31 | 0.29 | 1.08 | 1.37 | [0.77, 2.42] | 0.280 | −0.21 | 0.09 | −2.30 | 0.81 | [0.67, 0.97] | 0.022 | ||
| (5) | Education | none/primary school|college/university | −0.46 | 0.28 | −1.62 | 0.63 | [0.36, 1.10] | 0.105 | 0.09 | 0.09 | 1.04 | 1.10 | [0.92, 1.31] | 0.298 |
| secondary/high school|college/university | −0.19 | 0.21 | −0.89 | 0.83 | [0.54, 1.26] | 0.372 | 0.01 | 0.07 | 0.18 | 1.01 | [0.88, 1.16] | 0.861 | ||
| post−high school training|college/university | −0.31 | 0.23 | −1.33 | 0.73 | [0.47, 1.16] | 0.182 | 0.26 | 0.08 | 3.37 | 1.29 | [1.11, 1.50] | 0.001 | ||
| (7) | Total ISS | total injury severity score | −0.04 | 0.01 | −3.22 | 0.96 | [0.94, 0.98] | 0.001 | 0.00 | 0.00 | 1.31 | 1.00 | [1.00, 1.01] | 0.190 |
| (8) | TBI | uncomplicated mild|complicated mild | 0.94 | 0.20 | 4.64 | 2.56 | [1.72, 3.80] | <0.001 | 0.01 | 0.07 | 0.15 | 1.01 | [0.89, 1.15] | 0.879 |
| moderate|complicated mild | −0.02 | 0.47 | −0.05 | 0.98 | [0.39, 2.45] | 0.964 | −0.03 | 0.10 | −0.28 | 0.97 | [0.79, 1.19] | 0.779 | ||
| severe|complicated mild | −0.40 | 0.49 | −0.81 | 0.67 | [0.26, 1.75] | 0.415 | −0.07 | 0.08 | −0.86 | 0.93 | [0.79, 1.10] | 0.391 | ||
| (10) | Premorbidproblems | none|emotional | 1.87 | 0.64 | 2.90 | 6.47 | [1.83, 22.81] | 0.004 | −0.15 | 0.10 | −1.59 | 0.86 | [0.71, 1.04] | 0.112 |
| physical|emotional | 0.68 | 0.77 | 0.88 | 1.97 | [0.44, 8.88] | 0.378 | −0.22 | 0.14 | −1.60 | 0.80 | [0.61, 1.05] | 0.110 | ||
| concussion|emotional | 1.51 | 0.71 | 2.14 | 4.54 | [1.13, 18.19] | 0.033 | −0.20 | 0.14 | −1.46 | 0.82 | [0.62, 1.07] | 0.145 | ||
| migraine|emotional | 1.69 | 0.85 | 1.98 | 5.44 | [1.02, 29.05] | 0.048 | 0.06 | 0.20 | 0.27 | 1.06 | [0.71, 1.58] | 0.785 | ||
| neurological|emotional | 1.53 | 0.74 | 2.06 | 4.61 | [1.07, 19.78] | 0.040 | −0.04 | 0.16 | −0.22 | 0.97 | [0.70, 1.32] | 0.825 | ||
| mixed|emotional | 0.75 | 0.70 | 1.07 | 2.12 | [0.54, 8.39] | 0.283 | 0.01 | 0.12 | 0.05 | 1.01 | [0.80, 1.27] | 0.962 | ||
| (1:2) | Age:sex | age:male|age: female | −0.01 | 0.01 | −1.08 | 0.99 | [0.97, 1.01] | 0.282 | 0.01 | 0.00 | 2.09 | 1.01 | [1.00, 1.01] | 0.036 |
| RPQ Total Score | RPQ-3 Score | RPQ-13 Score | ||||||||||||||||||
|---|---|---|---|---|---|---|---|---|---|---|---|---|---|---|---|---|---|---|---|---|
| No. | Predictors | Levels|Reference Group | Est. | S.E. | z | RR | CI95 | p | Est. | S.E. | z | RR | CI95 | p | Est. | S.E. | z | RR | CI95 | p |
| Intercept | 3.07 | 0.20 | 15.18 | 21.60 | [14.36, 32.76] | <0.001 | 1.80 | 0.26 | 7.02 | 6.07 | [3.63, 10.21] | <0.001 | 2.82 | 0.21 | 13.42 | 16.70 | [10.94, 25.74] | <0.001 | ||
| (1) | Age | in years | 0.00 | 0.00 | −1.33 | 1.00 | [0.99, 1.00] | 0.184 | −0.01 | 0.00 | −2.82 | 0.99 | [0.98, 1.00] | 0.005 | 0.00 | 0.00 | −0.90 | 1.00 | [0.99, 1.00] | 0.366 |
| (2) | Sex | male|female | −0.61 | 0.17 | −3.59 | 0.54 | [0.38, 0.76] | <0.001 | −0.88 | 0.20 | −4.32 | 0.41 | [0.27, 0.62] | <0.001 | −0.55 | 0.18 | −3.09 | 0.58 | [0.40, 0.82] | 0.002 |
| (4) | Employment | part time|full-time | −0.12 | 0.09 | −1.32 | 0.89 | [0.75, 1.06] | 0.186 | −0.22 | 0.11 | −1.95 | 0.81 | [0.65, 1.00] | 0.052 | −0.10 | 0.09 | −1.07 | 0.90 | [0.75, 1.09] | 0.285 |
| in training|full-time | −0.31 | 0.12 | −2.72 | 0.73 | [0.58, 0.92] | 0.007 | −0.33 | 0.14 | −2.35 | 0.72 | [0.54, 0.95] | 0.019 | −0.31 | 0.12 | −2.61 | 0.73 | [0.58, 0.93] | 0.009 | ||
| unemployed|full-time | 0.18 | 0.11 | 1.56 | 1.19 | [0.96, 1.49] | 0.119 | 0.16 | 0.13 | 1.23 | 1.18 | [0.91, 1.54] | 0.218 | 0.18 | 0.12 | 1.55 | 1.20 | [0.96, 1.51] | 0.122 | ||
| retired|full-time | −0.24 | 0.10 | −2.39 | 0.79 | [0.65, 0.96] | 0.017 | −0.20 | 0.12 | −1.60 | 0.82 | [0.65, 1.05] | 0.111 | −0.25 | 0.10 | −2.39 | 0.78 | [0.64, 0.96] | 0.017 | ||
| (5) | Education | none/primary school|college/university | 0.19 | 0.10 | 1.93 | 1.21 | [1.00, 1.46] | 0.054 | 0.38 | 0.12 | 3.23 | 1.46 | [1.16, 1.85] | 0.001 | 0.15 | 0.10 | 1.50 | 1.16 | [0.95, 1.42] | 0.135 |
| at least secondary/high school|college/university | 0.07 | 0.07 | 0.92 | 1.07 | [0.93, 1.24] | 0.360 | 0.18 | 0.09 | 1.99 | 1.20 | [1.00, 1.43] | 0.047 | 0.05 | 0.08 | 0.62 | 1.05 | [0.90, 1.22] | 0.533 | ||
| post−high school training|college/university | 0.28 | 0.08 | 3.37 | 1.32 | [1.12, 1.55] | 0.001 | 0.19 | 0.10 | 1.89 | 1.21 | [0.99, 1.48] | 0.059 | 0.29 | 0.08 | 3.42 | 1.34 | [1.13, 1.58] | 0.001 | ||
| (7) | Stratum | ADM|ER | 0.13 | 0.08 | 1.72 | 1.14 | [0.98, 1.32] | 0.086 | 0.18 | 0.10 | 1.78 | 1.20 | [0.98, 1.47] | 0.075 | 0.12 | 0.08 | 1.54 | 1.13 | [0.97, 1.32] | 0.123 |
| ICU|ER | 0.35 | 0.08 | 4.60 | 1.42 | [1.22, 1.65] | <0.001 | 0.39 | 0.14 | 2.68 | 1.47 | [1.10, 1.96] | 0.007 | 0.39 | 0.08 | 4.86 | 1.47 | [1.26, 1.72] | <0.001 | ||
| (8) | ISS | total injury severity score | - | - | - | - | - | - | −0.01 | 0.00 | −1.61 | 0.99 | [0.99, 1.00] | 0.108 | - | - | - | - | - | - |
| (9) | TBI | uncomplicated mild|complicated mild | - | - | - | - | - | - | −0.12 | 0.09 | −1.39 | 0.88 | [0.74, 1.05] | 0.164 | - | - | - | - | - | - |
| moderate|complicated mild | - | - | - | - | - | - | −0.18 | 0.15 | −1.21 | 0.84 | [0.63, 1.12] | 0.225 | - | - | - | - | - | - | ||
| severe|complicated mild | - | - | - | - | - | - | −0.38 | 0.13 | −3.00 | 0.69 | [0.54, 0.88] | 0.003 | - | - | - | - | - | - | ||
| (11) | Premorbidproblems | none|emotional | −0.37 | 0.12 | −3.24 | 0.69 | [0.54, 0.86] | 0.001 | −0.43 | 0.14 | −3.18 | 0.65 | [0.5, 0.84] | 0.001 | −0.36 | 0.12 | −3.04 | 0.69 | [0.55, 0.87] | 0.002 |
| physical|emotional | −0.25 | 0.16 | −1.59 | 0.78 | [0.57, 1.06] | 0.112 | −0.38 | 0.19 | −1.98 | 0.68 | [0.47, 0.99] | 0.048 | −0.23 | 0.17 | −1.38 | 0.80 | [0.58, 1.10] | 0.168 | ||
| concussion|emotional | −0.34 | 0.16 | −2.17 | 0.71 | [0.53, 0.97] | 0.030 | −0.39 | 0.19 | −2.06 | 0.68 | [0.47, 0.98] | 0.039 | −0.33 | 0.16 | −2.02 | 0.72 | [0.53, 0.99] | 0.043 | ||
| migraine|emotional | −0.13 | 0.24 | −0.54 | 0.88 | [0.56, 1.43] | 0.593 | −0.07 | 0.28 | −0.25 | 0.93 | [0.55, 1.63] | 0.800 | −0.14 | 0.25 | −0.56 | 0.87 | [0.55, 1.44] | 0.574 | ||
| neurological|emotional | −0.21 | 0.18 | −1.12 | 0.81 | [0.57, 1.17] | 0.262 | −0.21 | 0.22 | −0.97 | 0.81 | [0.53, 1.24] | 0.331 | −0.20 | 0.19 | −1.06 | 0.82 | [0.57, 1.19] | 0.288 | ||
| mixed|emotional | −0.09 | 0.14 | −0.61 | 0.92 | [0.69, 1.21] | 0.544 | −0.19 | 0.17 | −1.11 | 0.83 | [0.59, 1.15] | 0.265 | −0.07 | 0.15 | −0.44 | 0.94 | [0.70, 1.25] | 0.659 | ||
| (1:2) | Age: sex | age: male|age:female | 0.01 | 0.00 | 2.02 | 1.01 | [1.00, 1.01] | 0.043 | 0.01 | 0.00 | 2.24 | 1.01 | [1.00, 1.02] | 0.025 | 0.01 | 0.00 | 1.72 | 1.01 | [1.00, 1.01] | 0.085 |
References
- Menon, D.K.; Schwab, K.; Wright, D.W.; Maas, A.I. Position Statement: Definition of Traumatic Brain Injury. Arch. Phys. Med. Rehabil. 2010, 91, 1637–1640. [Google Scholar] [CrossRef]
- Peeters, W.; van den Brande, R.; Polinder, S.; Brazinova, A.; Steyerberg, E.W.; Lingsma, H.F.; Maas, A.I.R. Epidemiology of traumatic brain injury in Europe. Acta Neurochir. (Wien) 2015, 157, 1683–1696. [Google Scholar] [CrossRef] [PubMed]
- Majdan, M.; Plancikova, D.; Brazinova, A.; Rusnak, M.; Nieboer, D.; Feigin, V.; Maas, A. Epidemiology of traumatic brain injuries in Europe: A cross-sectional analysis. Lancet Public Health 2016, 1, e76–e83. [Google Scholar] [CrossRef]
- James, S.L.; Theadom, A.; Ellenbogen, R.G.; Bannick, M.S.; Montjoy-Venning, W.; Lucchesi, L.R.; Abbasi, N.; Abdulkader, R.; Abraha, H.N.; Adsuar, J.C.; et al. Global, regional, and national burden of traumatic brain injury and spinal cord injury, 1990–2016: A systematic analysis for the Global Burden of Disease Study 2016. Lancet Neurol. 2019, 18, 56–87. [Google Scholar] [CrossRef]
- Teasdale, G.; Jennett, B. Assessment of coma and impaired consciousness. A practical scale. Lancet 1974, 304, 81–84. [Google Scholar] [CrossRef]
- Cassidy, J.D.; Carroll, L.; Peloso, P.; Borg, J.; von Holst, H.; Holm, L.; Kraus, J.; Coronado, V. Incidence, risk factors and prevention of mild traumatic brain injury: Results of the WHO collaborating centre task force on mild traumatic brain injury. J. Rehabil. Med. 2004, 36, 28–60. [Google Scholar] [CrossRef] [PubMed]
- Dewan, M.C.; Rattani, A.; Gupta, S.; Baticulon, R.E.; Hung, Y.-C.; Punchak, M.; Agrawal, A.; Adeleye, A.O.; Shrime, M.G.; Rubiano, A.M.; et al. Estimating the global incidence of traumatic brain injury. J. Neurosurg. 2019, 130, 1080–1097. [Google Scholar] [CrossRef]
- Williams, D.H.; Levin, H.S.; Eisenberg, H.M. Mild head injury classification. Neurosurgery 1990, 27, 422–428. [Google Scholar] [CrossRef]
- King, N.S.; Crawford, S.; Wenden, F.J.; Moss, N.E.; Wade, D.T. The Rivermead Post Concussion Symptoms Questionnaire: A measure of symptoms commonly experienced after head injury and its reliability. J. Neurol. 1995, 242, 587–592. [Google Scholar] [CrossRef]
- Gordon, W.A.; Zafonte, R.; Cicerone, K.; Cantor, J.; Brown, M.; Lombard, L.; Goldsmith, R.; Chandna, T. Traumatic Brain Injury Rehabilitation: State of the Science. Am. J. Phys. Med. Rehabil. 2006, 85, 343–382. [Google Scholar] [CrossRef]
- Sigurdardottir, S.; Andelic, N.; Roe, C.; Jerstad, T.; Schanke, A.-K. Post-concussion symptoms after traumatic brain injury at 3 and 12 months post-injury: A prospective study. Brain Inj. 2009, 23, 489–497. [Google Scholar] [CrossRef] [PubMed]
- American Psychiatric Association Diagnostic and Statistical Manual of Mental Disorders, 4th ed. (DSM-IV); American Psychiatric Association: Washington, DC, USA, 1994.
- World Health Organization. ICD-10: International Statistical Classification of Diseases and Related Health Problems, Tenth Revision, 2nd ed.; World Health Organization: Geneva, Switzerland, 2004. [Google Scholar]
- Carroll, L.; Cassidy, J.D.; Peloso, P.; Borg, J.; von Holst, H.; Holm, L.; Paniak, C.; Pépin, M. Prognosis for mild traumatic brain injury: Results of the who collaborating centre task force on mild traumatic brain injury. J. Rehabil. Med. 2004, 36, 84–105. [Google Scholar] [CrossRef] [PubMed]
- Polinder, S.; Cnossen, M.C.; Real, R.G.L.; Covic, A.; Gorbunova, A.; Voormolen, D.C.; Master, C.L.; Haagsma, J.A.; Diaz-Arrastia, R.; von Steinbuechel, N. A Multidimensional Approach to Post-concussion Symptoms in Mild Traumatic Brain Injury. Front. Neurol. 2018, 9, 1113. [Google Scholar] [CrossRef] [PubMed]
- Ryan, L.M.; Warden, D.L. Post concussion syndrome. Int. Rev. Psychiatry 2003, 15, 310–316. [Google Scholar] [CrossRef]
- Røe, C.; Sveen, U.; Alvsåker, K.; Bautz-Holter, E. Post-concussion symptoms after mild traumatic brain injury: Influence of demographic factors and injury severity in a 1-year cohort study. Disabil. Rehabil. 2009, 31, 1235–1243. [Google Scholar] [CrossRef]
- Kleffelgaard, I.; Roe, C.; Soberg, H.L.; Bergland, A. Associations among self-reported balance problems, post-concussion symptoms and performance-based tests: A longitudinal follow-up study. Disabil. Rehabil. 2012, 34, 788–794. [Google Scholar] [CrossRef]
- Arciniegas, D.B.; Anderson, C.A.; Topkoff, J.; McAllister, T.W. Mild traumatic brain injury: A neuropsychiatric approach to diagnosis, evaluation, and treatment. Neuropsychiatr. Dis. Treat. 2005, 1, 311–327. [Google Scholar]
- Evans, R.W. Persistent Post-Traumatic Headache, Postconcussion Syndrome, and Whiplash Injuries: The Evidence for a Non-Traumatic Basis With an Historical Review. Headache J. Head Face Pain 2010, 50, 716–724. [Google Scholar] [CrossRef]
- Rose, S.C.; Fischer, A.N.; Heyer, G.L. How long is too long? The lack of consensus regarding the post-concussion syndrome diagnosis. Brain Inj. 2015, 29, 798–803. [Google Scholar] [CrossRef]
- Sharp, D.J.; Jenkins, P.O. Concussion is confusing us all. Pract. Neurol. 2015, 15, 172–186. [Google Scholar] [CrossRef]
- Cnossen, M.C.; van der Naalt, J.; Spikman, J.M.; Nieboer, D.; Yue, J.K.; Winkler, E.A.; Manley, G.T.; von Steinbuechel, N.; Polinder, S.; Steyerberg, E.W.; et al. Prediction of Persistent Post-Concussion Symptoms after Mild Traumatic Brain Injury. J. Neurotrauma 2018, 35, 2691–2698. [Google Scholar] [CrossRef] [PubMed]
- Mooney, G.; Speed, J.; Sheppard, S. Factors related to recovery after mild traumatic brain injury. Brain Inj. 2005, 19, 975–987. [Google Scholar] [CrossRef] [PubMed]
- Voormolen, D.C.; Cnossen, M.C.; Polinder, S.; von Steinbuechel, N.; Vos, P.E.; Haagsma, J.A. Divergent Classification Methods of Post-Concussion Syndrome after Mild Traumatic Brain Injury: Prevalence Rates, Risk Factors, and Functional Outcome. J. Neurotrauma 2018, 35, 1233–1241. [Google Scholar] [CrossRef]
- McLean, S.A.; Kirsch, N.L.; Tan-Schriner, C.U.; Sen, A.; Frederiksen, S.; Harris, R.E.; Maixner, W.; Maio, R.F. Health status, not head injury, predicts concussion symptoms after minor injury. Am. J. Emerg. Med. 2009, 27, 182–190. [Google Scholar] [CrossRef] [PubMed]
- Ponsford, J.; Nguyen, S.; Downing, M.; Bosch, M.; McKenzie, J.; Turner, S.; Chau, M.; Mortimer, D.; Gruen, R.; Knott, J.; et al. Factors associated with persistent post-concussion symptoms following mild traumatic brain injury in adults. J. Rehabil. Med. 2019, 51, 32–39. [Google Scholar] [CrossRef] [PubMed]
- Levin, H.S.; Diaz-Arrastia, R.R. Diagnosis, prognosis, and clinical management of mild traumatic brain injury. Lancet Neurol. 2015, 14, 506–517. [Google Scholar] [CrossRef]
- Sigurdardottir, S.; Andelic, N.; Wehling, E.; Roe, C.; Anke, A.; Skandsen, T.; Holthe, O.O.; Jerstad, T.; Aslaksen, P.M.; Schanke, A.-K. Neuropsychological Functioning in a National Cohort of Severe Traumatic Brain Injury: Demographic and Acute Injury-Related Predictors. J. Head Trauma Rehabil. 2015, 30, E1–E12. [Google Scholar] [CrossRef]
- Willer, B.; Leddy, J.J. Management of concussion and post-concussion syndrome. Curr. Treat. Options Neurol. 2006, 8, 415–426. [Google Scholar] [CrossRef]
- Sterr, A.; Herron, K.A.; Hayward, C.; Montaldi, D. Are mild head injuries as mild as we think? Neurobehavioral concomitants of chronic post-concussion syndrome. BMC Neurol. 2006, 6, 7. [Google Scholar] [CrossRef]
- Meares, S.; Shores, E.A.; Taylor, A.J.; Batchelor, J.; Bryant, R.A.; Baguley, I.J.; Chapman, J.; Gurka, J.; Marosszeky, J.E. The prospective course of postconcussion syndrome: The role of mild traumatic brain injury. Neuropsychology 2011, 25, 454–465. [Google Scholar] [CrossRef]
- Meares, S.; Shores, E.A.; Taylor, A.J.; Batchelor, J.; Bryant, R.A.; Baguley, I.J.; Chapman, J.; Gurka, J.; Dawson, K.; Capon, L.; et al. Mild traumatic brain injury does not predict acute postconcussion syndrome. J. Neurol. Neurosurg. Psychiatry 2008, 79, 300–306. [Google Scholar] [CrossRef] [PubMed]
- Cohen, J. The Cost of Dichotomization. Appl. Psychol. Meas. 1983, 7, 249–253. [Google Scholar] [CrossRef]
- Casson, R.J.; Farmer, L.D. Understanding and checking the assumptions of linear regression: A primer for medical researchers: Assumptions of linear regression. Clin. Experiment. Ophthalmol. 2014, 42, 590–596. [Google Scholar] [CrossRef] [PubMed]
- Iverson, G.L. Network Analysis and Precision Rehabilitation for the Post-concussion Syndrome. Front. Neurol. 2019, 10, 489. [Google Scholar] [CrossRef] [PubMed]
- Snell, D.L.; Martin, R.; Macleod, A.D.; Surgenor, L.J.; Siegert, R.J.; Hay-Smith, E.J.C.; Melzer, T.; Hooper, G.J.; Anderson, T. Untangling chronic pain and post-concussion symptoms: The significance of depression. Brain Inj. 2018, 32, 583–592. [Google Scholar] [CrossRef]
- Voormolen, D.C.; Cnossen, M.C.; Polinder, S.; Gravesteijn, B.Y.; Von Steinbuechel, N.; Real, R.G.L.; Haagsma, J.A. Prevalence of post-concussion-like symptoms in the general population in Italy, The Netherlands and the United Kingdom. Brain Inj. 2019, 33, 1078–1086. [Google Scholar] [CrossRef]
- Maas, A.I.R.; Menon, D.K.; Steyerberg, E.W.; Citerio, G.; Lecky, F.; Manley, G.T.; Hill, S.; Legrand, V.; Sorgner, A. Collaborative European NeuroTrauma Effectiveness Research in Traumatic Brain Injury (CENTER-TBI): A Prospective Longitudinal Observational Study. Neurosurgery 2015, 76, 67–80. [Google Scholar] [CrossRef]
- Steyerberg, E.W.; Wiegers, E.; Sewalt, C.; Buki, A.; Citerio, G.; De Keyser, V.; Ercole, A.; Kunzmann, K.; Lanyon, L.; Lecky, F.; et al. Case-mix, care pathways, and outcomes in patients with traumatic brain injury in CENTER-TBI: A European prospective, multicentre, longitudinal, cohort study. Lancet Neurol. 2019, 18, 923–934. [Google Scholar] [CrossRef]
- Acquadro, C. Linguistic Validation Manual for Health Outcome Assessments; MAPI Research Institute: Lyon, France, 2012. [Google Scholar]
- Gennarelli, T.A.; Wodzin, E. Association for the Advancement of Automotive Medicine Abbreviated Injury Scale 2005: Update 2008; Association for the Advancement of Automative Medicine: Barrington, IL, USA, 2008; ISBN 978-0-00-000202-0. [Google Scholar]
- Eyres, S.; Carey, A.; Gilworth, G.; Neumann, V.; Tennant, A. Construct validity and reliability of the Rivermead Post-Concussion Symptoms Questionnaire. Clin. Rehabil. 2005, 19, 878–887. [Google Scholar] [CrossRef]
- Voormolen, D.C.; Haagsma, J.A.; Polinder, S.; Maas, A.I.R.; Steyerberg, E.W.; Vuleković, P.; Sewalt, C.A.; Gravesteijn, B.Y.; Covic, A.; Andelic, N.; et al. Post-Concussion Symptoms in Complicated vs. Uncomplicated Mild Traumatic Brain Injury Patients at Three and Six Months Post-Injury: Results from the CENTER-TBI Study. J. Clin. Med. 2019, 8, 1921. [Google Scholar] [CrossRef]
- Maruta, J.; Lumba-Brown, A.; Ghajar, J. Concussion Subtype Identification with the Rivermead Post-concussion Symptoms Questionnaire. Front. Neurol. 2018, 9, 1034. [Google Scholar] [CrossRef] [PubMed]
- Wang, Z.; Ma, S.; Wang, C.-Y. Variable selection for zero-inflated and overdispersed data with application to health care demand in Germany: Variable selection for zero-inflated and overdispersed data. Biom. J. 2015, 57, 867–884. [Google Scholar] [CrossRef] [PubMed]
- Lambert, D. Zero-Inflated Poisson Regression, with an Application to Defects in Manufacturing. Technometrics 1992, 34, 1. [Google Scholar] [CrossRef]
- Hinde, J.; Demétrio, C.G.B. Overdispersion: Models and estimation. Comput. Stat. Data Anal. 1998, 27, 151–170. [Google Scholar] [CrossRef]
- Kleiber, C.; Zeileis, A. Visualizing Count Data Regressions Using Rootograms. Am. Stat. 2016, 70, 296–303. [Google Scholar] [CrossRef]
- Tukey, J.W. Some Graphic and Semigraphic Displays. In Statistical Papers in Honor of George W. Snedecor; Bancroft, T.A., Ed.; Iowa State University Press: Ames, IA, USA, 1972; pp. 293–316. [Google Scholar]
- Venables, W.N.; Ripley, B.D.; Venables, W.N. Modern Applied Statistics with S, 4th ed.; Statistics and Computing; Springer: New York, NY, USA, 2002; ISBN 978-0-387-95457-8. [Google Scholar]
- R Core Team. R: A Language and Environment for Statistical Computing; R Foundation for Statistical Computing: Vienna, Austria, 2019. [Google Scholar]
- Zeileis, A.; Kleiber, C. countreg: Count Data Regression. R Package Version 0.2-1. 2018. Available online: https://r-forge.r-project.org/projects/countreg/ (accessed on 17 June 2020).
- Jackman, S. pscl: Classes and Methods for R Developed in the Political Science Computational Laboratory; R Package Version 1.5.2; University of Sydney: Sydney, Australia, 2017. [Google Scholar]
- Prins, M.L.; Giza, C.C. Repeat traumatic brain injury in the developing brain. Int. J. Dev. Neurosci. 2012, 30, 185–190. [Google Scholar] [CrossRef]
- Field, M.; Collins, M.W.; Lovell, M.R.; Maroon, J. Does age play a role in recovery from sports-related concussion? A comparison of high school and collegiate athletes. J. Pediatr. 2003, 142, 546–553. [Google Scholar] [CrossRef]
- Sim, A.; Terryberry-Spohr, L.; Wilson, K.R. Prolonged recovery of memory functioning after mild traumatic brain injury in adolescent athletes. J. Neurosurg. 2008, 108, 511–516. [Google Scholar] [CrossRef]
- La Fountaine, M.F.; Hill-Lombardi, V.; Hohn, A.N.; Leahy, C.L.; Testa, A.J. Preliminary Evidence for a Window of Increased Vulnerability to Sustain a Concussion in Females: A Brief Report. Front. Neurol. 2019, 10, 691. [Google Scholar] [CrossRef]
- Jones, H. Testosterone for the aging male; current evidence and recommended practice. Clin. Interv. Aging 2008, Volume 3, 25–44. [Google Scholar] [CrossRef]
- Ziebell, J.M.; Rowe, R.K.; Muccigrosso, M.M.; Reddaway, J.T.; Adelson, P.D.; Godbout, J.P.; Lifshitz, J. Aging with a traumatic brain injury: Could behavioral morbidities and endocrine symptoms be influenced by microglial priming? Brain. Behav. Immun. 2017, 59, 1–7. [Google Scholar] [CrossRef] [PubMed]
- Barefoot, J.C.; Mortensen, E.L.; Helms, M.J.; Avlund, K.; Schroll, M. A longitudinal study of gender differences in depressive symptoms from age 50 to 80. Psychol. Aging 2001, 16, 342–345. [Google Scholar] [CrossRef] [PubMed]
- King, N. Permanent post concussion symptoms after mild head injury: A systematic review of age and gender factors. NeuroRehabilitation 2014, 34, 741–748. [Google Scholar] [CrossRef] [PubMed]
- Cutler, D.M.; Lleras-Muney, A. Understanding differences in health behaviors by education. J. Health Econ. 2010, 29, 1–28. [Google Scholar] [CrossRef] [PubMed]
- Wang, Y.; Chan, R.; Deng, Y. Examination of postconcussion-like symptoms in healthy university students: Relationships to subjective and objective neuropsychological function performance. Arch. Clin. Neuropsychol. 2006, 21, 339–347. [Google Scholar] [CrossRef]
- Stulemeijer, M.; van der Werf, S.; Bleijenberg, G.; Biert, J.; Brauer, J.; Vos, P.E. Recovery from mild traumatic brain injury: A focus on fatigue. J. Neurol. 2006, 253, 1041–1047. [Google Scholar] [CrossRef]
- Beaulieu-Bonneau, S.; Morin, C.M. Sleepiness and fatigue following traumatic brain injury. Sleep Med. 2012, 13, 598–605. [Google Scholar] [CrossRef]
- Norrie, J.; Heitger, M.; Leathem, J.; Anderson, T.; Jones, R.; Flett, R. Mild traumatic brain injury and fatigue: A prospective longitudinal study. Brain Inj. 2010, 24, 1528–1538. [Google Scholar] [CrossRef]
- Johansson, B.; Wentzel, A.-P.; Andréll, P.; Odenstedt, J.; Mannheimer, C.; Rönnbäck, L. Evaluation of dosage, safety and effects of methylphenidate on post-traumatic brain injury symptoms with a focus on mental fatigue and pain. Brain Inj. 2014, 28, 304–310. [Google Scholar] [CrossRef]
- Mollayeva, T.; Kendzerska, T.; Mollayeva, S.; Shapiro, C.M.; Colantonio, A.; Cassidy, J.D. A systematic review of fatigue in patients with traumatic brain injury: The course, predictors and consequences. Neurosci. Biobehav. Rev. 2014, 47, 684–716. [Google Scholar] [CrossRef] [PubMed]
- Potter, S.; Leigh, E.; Wade, D.; Fleminger, S. The Rivermead Post Concussion Symptoms Questionnaire: A confirmatory factor analysis. J. Neurol. 2006, 253, 1603–1614. [Google Scholar] [CrossRef] [PubMed]


| No. | Variable | Groups (Reference Group in Italic) | N | % | M (SD) |
|---|---|---|---|---|---|
| (1) | Age a | - | 1391 | 100% | 48.75 (19.22) |
| (2) | Sex | female | 483 | 35% | - |
| male | 908 | 65% | - | ||
| (3) | Living situation | alone | 292 | 21% | - |
| not alone | 1099 | 79% | - | ||
| (4) | Employment | full-time | 634 | 46% | - |
| part time | 184 | 13% | - | ||
| in training | 145 | 10% | - | ||
| unemployed | 107 | 8% | - | ||
| retired | 321 | 23% | - | ||
| (5) | Education | none/primary school | 197 | 14% | - |
| at least secondary/high school | 506 | 36% | - | ||
| post-high school training | 298 | 21% | - | ||
| college/university | 390 | 28% | - | ||
| (6) | Stratum | ER | 320 | 23% | - |
| Admission | 520 | 37% | - | ||
| ICU | 551 | 40% | - | ||
| (7) | ISS a | - | 1391 | 100% | 18.13 (14.62) |
| (8) | TBI severity | uncomplicated mild | 564 | 41% | - |
| complicated mild | 492 | 35% | - | ||
| moderate | 103 | 7% | - | ||
| severe | 232 | 17% | - | ||
| (9) | LOC | no | 456 | 33% | - |
| yes | 935 | 67% | - | ||
| (10) | Premorbid problems | none | 903 | 65% | - |
| physical | 89 | 6% | - | ||
| concussion | 94 | 7% | - | ||
| migraine | 25 | 2% | - | ||
| neurological | 53 | 4% | - | ||
| emotional or addiction | 90 | 6% | - | ||
| mixed | 137 | 10% | - | ||
| (-) | No. PCS a | - | 1391 | 100% | 4.15 (4.28) |
| RPQ Total score a | - | 1391 | 100% | 13.57 (12.37) | |
| RPQ-13 score a | - | 1391 | 100% | 11.54 (10.71) | |
| RPQ-3 score a | - | 1391 | 100% | 2.02 (2.41) | |
| Total | 1391 | 100% |
| Post-Concussion Symptoms | ||||||
|---|---|---|---|---|---|---|
| No. | Variable | Occurrence a | Frequency b | Intensity c | Intensity Acute d | Intensity Post-Acute d |
| (1) | Age | +− | +− | +− | ++ | +− |
| (2) | Sex | +− | ++ | ++ | ++ | ++ |
| (1:2) | Age: Sex | +− | ++ | ++ | ++ | +− |
| (3) | Living situation | −− | −− | −− | −− | −− |
| (4) | Employment | ++ | ++ | ++ | ++ | ++ |
| (5) | Education | +− | +− | ++ | ++ | ++ |
| (6) | Stratum (ER, ADM, ICU) | −− | −− | ++ | ++ | ++ |
| (7) | Total ISS | ++ | +− | −− | +− | −− |
| (8) | TBI severity | ++ | +− | −− | ++ | −− |
| (9) | LOC | −− | −− | −− | −− | −− |
| (10) | Premorbid problems | ++ | +− | ++ | ++ | ++ |
© 2020 by the authors. Licensee MDPI, Basel, Switzerland. This article is an open access article distributed under the terms and conditions of the Creative Commons Attribution (CC BY) license (http://creativecommons.org/licenses/by/4.0/).
Share and Cite
Zeldovich, M.; Wu, Y.-J.; Gorbunova, A.; Mikolic, A.; Polinder, S.; Plass, A.M.; Covic, A.; Asendorf, T.; Andelic, N.; Voormolen, D.C.; et al. Influence of Sociodemographic, Premorbid, and Injury-Related Factors on Post-Concussion Symptoms after Traumatic Brain Injury. J. Clin. Med. 2020, 9, 1931. https://doi.org/10.3390/jcm9061931
Zeldovich M, Wu Y-J, Gorbunova A, Mikolic A, Polinder S, Plass AM, Covic A, Asendorf T, Andelic N, Voormolen DC, et al. Influence of Sociodemographic, Premorbid, and Injury-Related Factors on Post-Concussion Symptoms after Traumatic Brain Injury. Journal of Clinical Medicine. 2020; 9(6):1931. https://doi.org/10.3390/jcm9061931
Chicago/Turabian StyleZeldovich, Marina, Yi-Jhen Wu, Anastasia Gorbunova, Ana Mikolic, Suzanne Polinder, Anne Marie Plass, Amra Covic, Thomas Asendorf, Nada Andelic, Daphne C. Voormolen, and et al. 2020. "Influence of Sociodemographic, Premorbid, and Injury-Related Factors on Post-Concussion Symptoms after Traumatic Brain Injury" Journal of Clinical Medicine 9, no. 6: 1931. https://doi.org/10.3390/jcm9061931
APA StyleZeldovich, M., Wu, Y.-J., Gorbunova, A., Mikolic, A., Polinder, S., Plass, A. M., Covic, A., Asendorf, T., Andelic, N., Voormolen, D. C., von Steinbüchel, N., & on behalf of the CENTER-TBI 7 Participants and Investigators. (2020). Influence of Sociodemographic, Premorbid, and Injury-Related Factors on Post-Concussion Symptoms after Traumatic Brain Injury. Journal of Clinical Medicine, 9(6), 1931. https://doi.org/10.3390/jcm9061931