Article

DSC Brain Perfusion Using Advanced Deconvolution Models in the Diagnostic Work-Up of Dementia and Mild Cognitive Impairment: A Semiquantitative Comparison with HMPAO-SPECT-Brain Perfusion

1
Departments of Neuroradiology, Friedrich-Alexander-University Erlangen-Nuremberg, Schwabachanlage 6, 91054 Erlangen, Germany
2
Departments of Neurology, Friedrich-Alexander-University Erlangen-Nuremberg, Schwabachanlage 6, 91054 Erlangen, Germany
3
Department of Nuclear Medicine, Friedrich-Alexander-University Erlangen-Nuremberg, Ulmenweg 18, 91054 Erlangen, Germany
4
Departments of Psychiatry, Friedrich-Alexander-University Erlangen-Nuremberg, Schwabachanlage 6, 91054 Erlangen, Germany
*
Author to whom correspondence should be addressed.
J. Clin. Med. 2020, 9(6), 1800; https://doi.org/10.3390/jcm9061800
Submission received: 5 May 2020 / Revised: 8 June 2020 / Accepted: 8 June 2020 / Published: 9 June 2020
(This article belongs to the Special Issue Imaging of Mental Disorders)

Abstract

:
Background: SPECT (single-photon emission-computed tomography) is used for the detection of hypoperfusion in cognitive impairment and dementia but is not widely available and related to radiation dose exposure. We compared the performance of DSC (dynamic susceptibility contrast) perfusion using semi- and fully adaptive deconvolution models to HMPAO-SPECT (99mTc-hexamethylpropyleneamine oxime-SPECT). Material and Methods: Twenty-seven patients with dementia of different subtypes including frontotemporal dementia (FTD) and mild cognitive impairment (MCI) received a multimodal diagnostic work-up including DSC perfusion at a clinical 3T high-field scanner and HMPAO-SPECT. Nineteen healthy control individuals received DSC perfusion. For calculation of the hemodynamic parameter maps, oscillation-index standard truncated singular value decomposition (oSVD, semi-adaptive) as well as Bayesian parameter estimation (BAY, fully adaptive) were performed. Results: Patients showed decreased cortical perfusion in the left frontal lobe compared to controls (relative cerebral blood volume corrected, rBVc: 0.37 vs. 0.27, p = 0.048, adjusted for age and sex). Performance of rBVc (corrected for T1 effects) was highest compared to SPECT for detection of frontal hypoperfusion (sensitivity 83%, specificity 80% for oSVD and BAY, area under curve (AUC) = 0.833 respectively, p < 0.05) in FTD and MCI. For nonleakage-corrected rBV and for rBF (relative cerebral blood flow), sensitivity of frontal hypoperfusion was above 80% for oSVD and for BAY (rBV: sensitivity 83%, specificity 75%, AUC = 0.908 for oSVD and 0.917 for BAY, p < 0.05 respectively; rBF: sensitivity 83%, specificity 65%, AUC = 0.825, p < 0.05 for oSVD). Conclusion: Advanced deconvolution DSC can reliably detect pathological perfusion alterations in FTD and MCI. Hence, this widely accessible technique has the potential to improve the diagnosis of dementia and MCI as part of an interdisciplinary multimodal imaging work-up. Advances in knowledge: Advanced DSC perfusion has a high potential in the work-up of suspected dementia and correlates with SPECT brain perfusion results in dementia and MCI.

1. Introduction

Prevalence of dementia is rather high in the elderly population (>60 years) with about 5–7% worldwide [1]. Alzheimer’s disease is the most common cause; other etiologies include frontotemporal dementia (FTD), dementia with Lewy bodies (DLB), vascular dementia (VD) and cortico-basal degeneration (CBD) [2]. Early and reliable diagnosis is important to prevent unnecessary procedures, uncertainty for patients and relatives as well as delay in the initiation of symptomatic treatments [3,4,5]. Structural MRI already plays an important role in the diagnosis of early dementia [6], but perfusion imaging helps identifying subtypes, which is important for therapy decisions and further care of patients [3,7]. 99mTc-hexamethylpropyleneamine oxime single-photon emission-computed tomography (HMPAO-SPECT) is used in the diagnostic work-up as specific regional patterns of hypoperfusion have been described for different subtypes of dementia [8]. However, the radiation dose exposure for head SPECT/CT is reported to be as high as 4.1 mSv on average [9]. This is 41-fold the dose of a single chest X-ray examination. Thus, an alternative imaging modality without radiation exposure is desirable.
Earlier evaluation of the potential of DSC-(dynamic susceptibility contrast)-perfusion as an imaging biomarker of the cerebral microcirculation in AD has been promising [10]. However, correlation analysis of DSC-perfusion with SPECT has produced mixed results in the past. Studies investigating rBV (relative cerebral blood volume) and rBF (relative cerebral blood flow) measures in Alzheimer’s disease have partly shown promising results and good correlation with SPECT [11,12]. Several studies demonstrated that DSC perfusion cannot replace SPECT in AD and that SPECT remains superior over DSC perfusion regarding diagnostic accuracy [13,14].
Advanced perfusion deconvolution models like oSVD (oscillation-index standard truncated singular value decomposition) are far less sensitive for differences in tracer arriving time [15] leading to a more robust estimation of rBF and possibly to a superior detection of hypoperfusion in dementia. Another model, Bayesian parameter estimation, a probabilistic method that is considered to deliver even more accurate and robust hemodynamic parameters [16,17], is also a promising technical approach to perfusion imaging in dementia.
These technical improvements as well as higher field strength, higher spatial resolution and advanced deconvolution models for calculation of hemodynamic parameter maps led us to reevaluate DSC perfusion compared to SPECT in early dementia.

2. Material and Methods

2.1. Patients

Our retrospective study comprised a total of 27 patients with clinically suspected dementia (mean age 66 years ± 9.4 years). Suspected diagnosis included MCI (n = 9), FTD (n = 7), AD (n = 6), DLB (n = 2), VD (n = 2) CBD (n = 1). Patients’ clinical characteristics are summarized in Table 1. Informed consent was obtained from all subjects. The Clinical Investigation Ethics Committee of the University of Erlangen-Nuremberg approved the study protocol on 27 January 2016 (ethical code number 231_12Az) and the research was conducted in accordance with the Declaration of Helsinki. All patients underwent a standardized clinical assessment including a mini mental status test (MMST) and received HMPAO-SPECT as well as DSC perfusion. Additionally, we included a group of 19 healthy control individuals (mean age 57 years ± 8.5 years) with no signs of cognitive impairment. Controls received DSC perfusion only.

2.2. Imaging Protocol

DSC perfusion was performed with a clinical high-field scanner at a magnetic field strength of 3T (Magnetom Trio, Siemens, Erlangen, Germany) with a single-shot EPI-(echo planar imaging) -gradient echo sequence (TE (echo time) = 32 ms, TR (repitition time) = 1840 ms, field of view = 230 × 230 mm, slice thickness = 6 mm, slice gap = 1.8 mm, number of slices = 19, matrix = 128 × 128). We used 1 mmol/mL gadubotrol (Gadovist, Bayer Healthcare, Leverkusen, Germany) as a contrast agent. Dose was weight-dependent, 1 mmol/kg, injected as intravenous bolus in the right (preferably) or left cubital vein using an MR-compatible injector (Medtron, Saarbrücken, Germany) at a flow-rate of 5 mL/sec followed by a saline flush of 30 mL (0.9% NaCl). Additionally, anatomical datasets were acquired (3D T2 SPACE dark fluid: TE = 388 ms, TR= 5000 ms, TI (inversion time) = 1800 ms, field of view = 256 × 256 mm, slice thickness = 1 mm isotropic, matrix = 256 × 258 and 3D T1 MPRAGE: TE = 2.52 ms, TR = 1900 ms, TI = 900 ms, field of view = 256 × 256 mm, slice thickness = 1 mm isotropic, matrix = 256 × 256).
A multichannel head coil (32 channels, Siemens, Erlangen, Germany) was used for signal reception.
SPECT/CT acquisitions were carried out as follows: After ten minutes of resting in a quiet surrounding and dimmed light, patients were injected with Tc-99m-HMPAO (Stabilised Ceretec™, GE Healthcare, Munich, Germany). Injected activity was determined by measuring the initially prepared as well as the residual activity in the syringe with proper decay correction. An average of 546 ± 48 MBq (95% CI = 428–637) were injected. The SPECT/CT images were acquired 30 min p.i., using a dual-headed gamma camera (Symbia T2/T6, Siemens Healthcare, Hoffman Estates, IL, USA). The following acquisition parameters were used: low-energy high-resolution collimators, zoom factor 1.23, head-contouring orbit with 60 stops (120 projections) over 360°, acquisition time of 30 s per stop, and 140 keV photopeak window with 15% width. After SPECT, a low-dose CT was acquired for anatomical co-registration and attenuation correction. The images were reconstructed in a 128 × 128 matrix (3.9 mm pixel size) using the OSEM (ordered subset expectation maximization) algorithm (Flash3D). Post-reconstruction smoothing of images was carried out using a Gaussian filter with 6.0 mm FWHM (full width at half maximum). All images were corrected for scattered and attenuated photons using the dual energy window method and the low-dose CT images, respectively.

2.3. Image Processing and Analysis

DSC data were transferred to an external workstation for processing with an FDA-(food and drug administration)-approved software package (Olea Sphere, La Ciotat, France). Background segmentation of data sets was adjusted to remove extracranial tissue. The automatic arterial pixel selection tool implemented in the software and based on cluster analysis was chosen for computing an arterial input function (AIF) [18]. Hemodynamic parameter maps of rBV, rBF and MTT (mean transit time) were calculated. rBV parametric maps were calculated with and without correction for contrast agent leakage (rBV and rBVc). We used two different deconvolution models: semi-adaptive, delay insensitive oSVD [15], a further developed model based on nonadaptive sSVD [19], and with the same presets, Bayesian hemodynamic parameter estimation (BAY), which is considered to lead to a more reliable and accurate estimation of perfusion indices [16,17,20]. Bayesian parameter estimation is a probabilistic method that is considered to deliver even more accurate and robust hemodynamic parameters. Compared with previously reported singular value decomposition algorithms, Bayesian analysis of DSC perfusion has been reported to provide better qualitative and quantitative assessments of rBF [21]. Circular ROIs (regions of interest) were placed in the cortex and in deep white matter of the frontal lobe, the parieto-occipital lobe as well as the temporal lobe. Coordinates in MNI space are given in Table 2.
ROI area was defined as 3 for cortex and 5 for deep white matter in a software inherent arbitrary unit (mean surface for cortex ROI = 25.9 mm2, for deep white matter ROI = 80.7 mm2). For the exact anatomical placement of ROIs, parametric perfusion maps were co-registered and fused with a 3D T2 SPACE dataset (Figure 1). ROI placement was performed by two neuroradiologists well trained in perfusion MRI who were blinded to the patients’ diagnosis. The ratio of deep white matter/cortical perfusion was calculated for every anatomical localization and for both deconvolution models, thus using white matter as a reference region. The same cortical areas were selected for all subjects.
Regarding evaluation of SPECT images, calculated rBF parametric maps were read by a physician with extensive experience in nuclear medicine and SPECT imaging and visually classified according to frontal, parieto-occipital and temporal hypoperfusion.

2.4. Statistical Analysis

Differences in white matter/cortical perfusion ratios between patients and controls were assessed by unpaired Student’s t-tests after verification of normal distribution of the data. Additionally, we corrected for age and sex after principal component analysis and adding them as a combined covariate in a general linear model (ANCOVA).
Classification of actual hypoperfusion in SPECT imaging was considered as standard and the performance of the perfusion ratio deep white matter/cortex of every single DSC parameter, i.e., the potential to predict hypoperfusion in SPECT, was tested using receiver-operating characteristics (ROC) with estimation of the AUC (area under the curve). p < 0.05 was considered statistically significant. The p value is given under the null hypothesis that the area under the curve equals 0.5. Statistical analysis was performed using SPSS version 19 (IBM, Ehningen, Germany).

3. Results

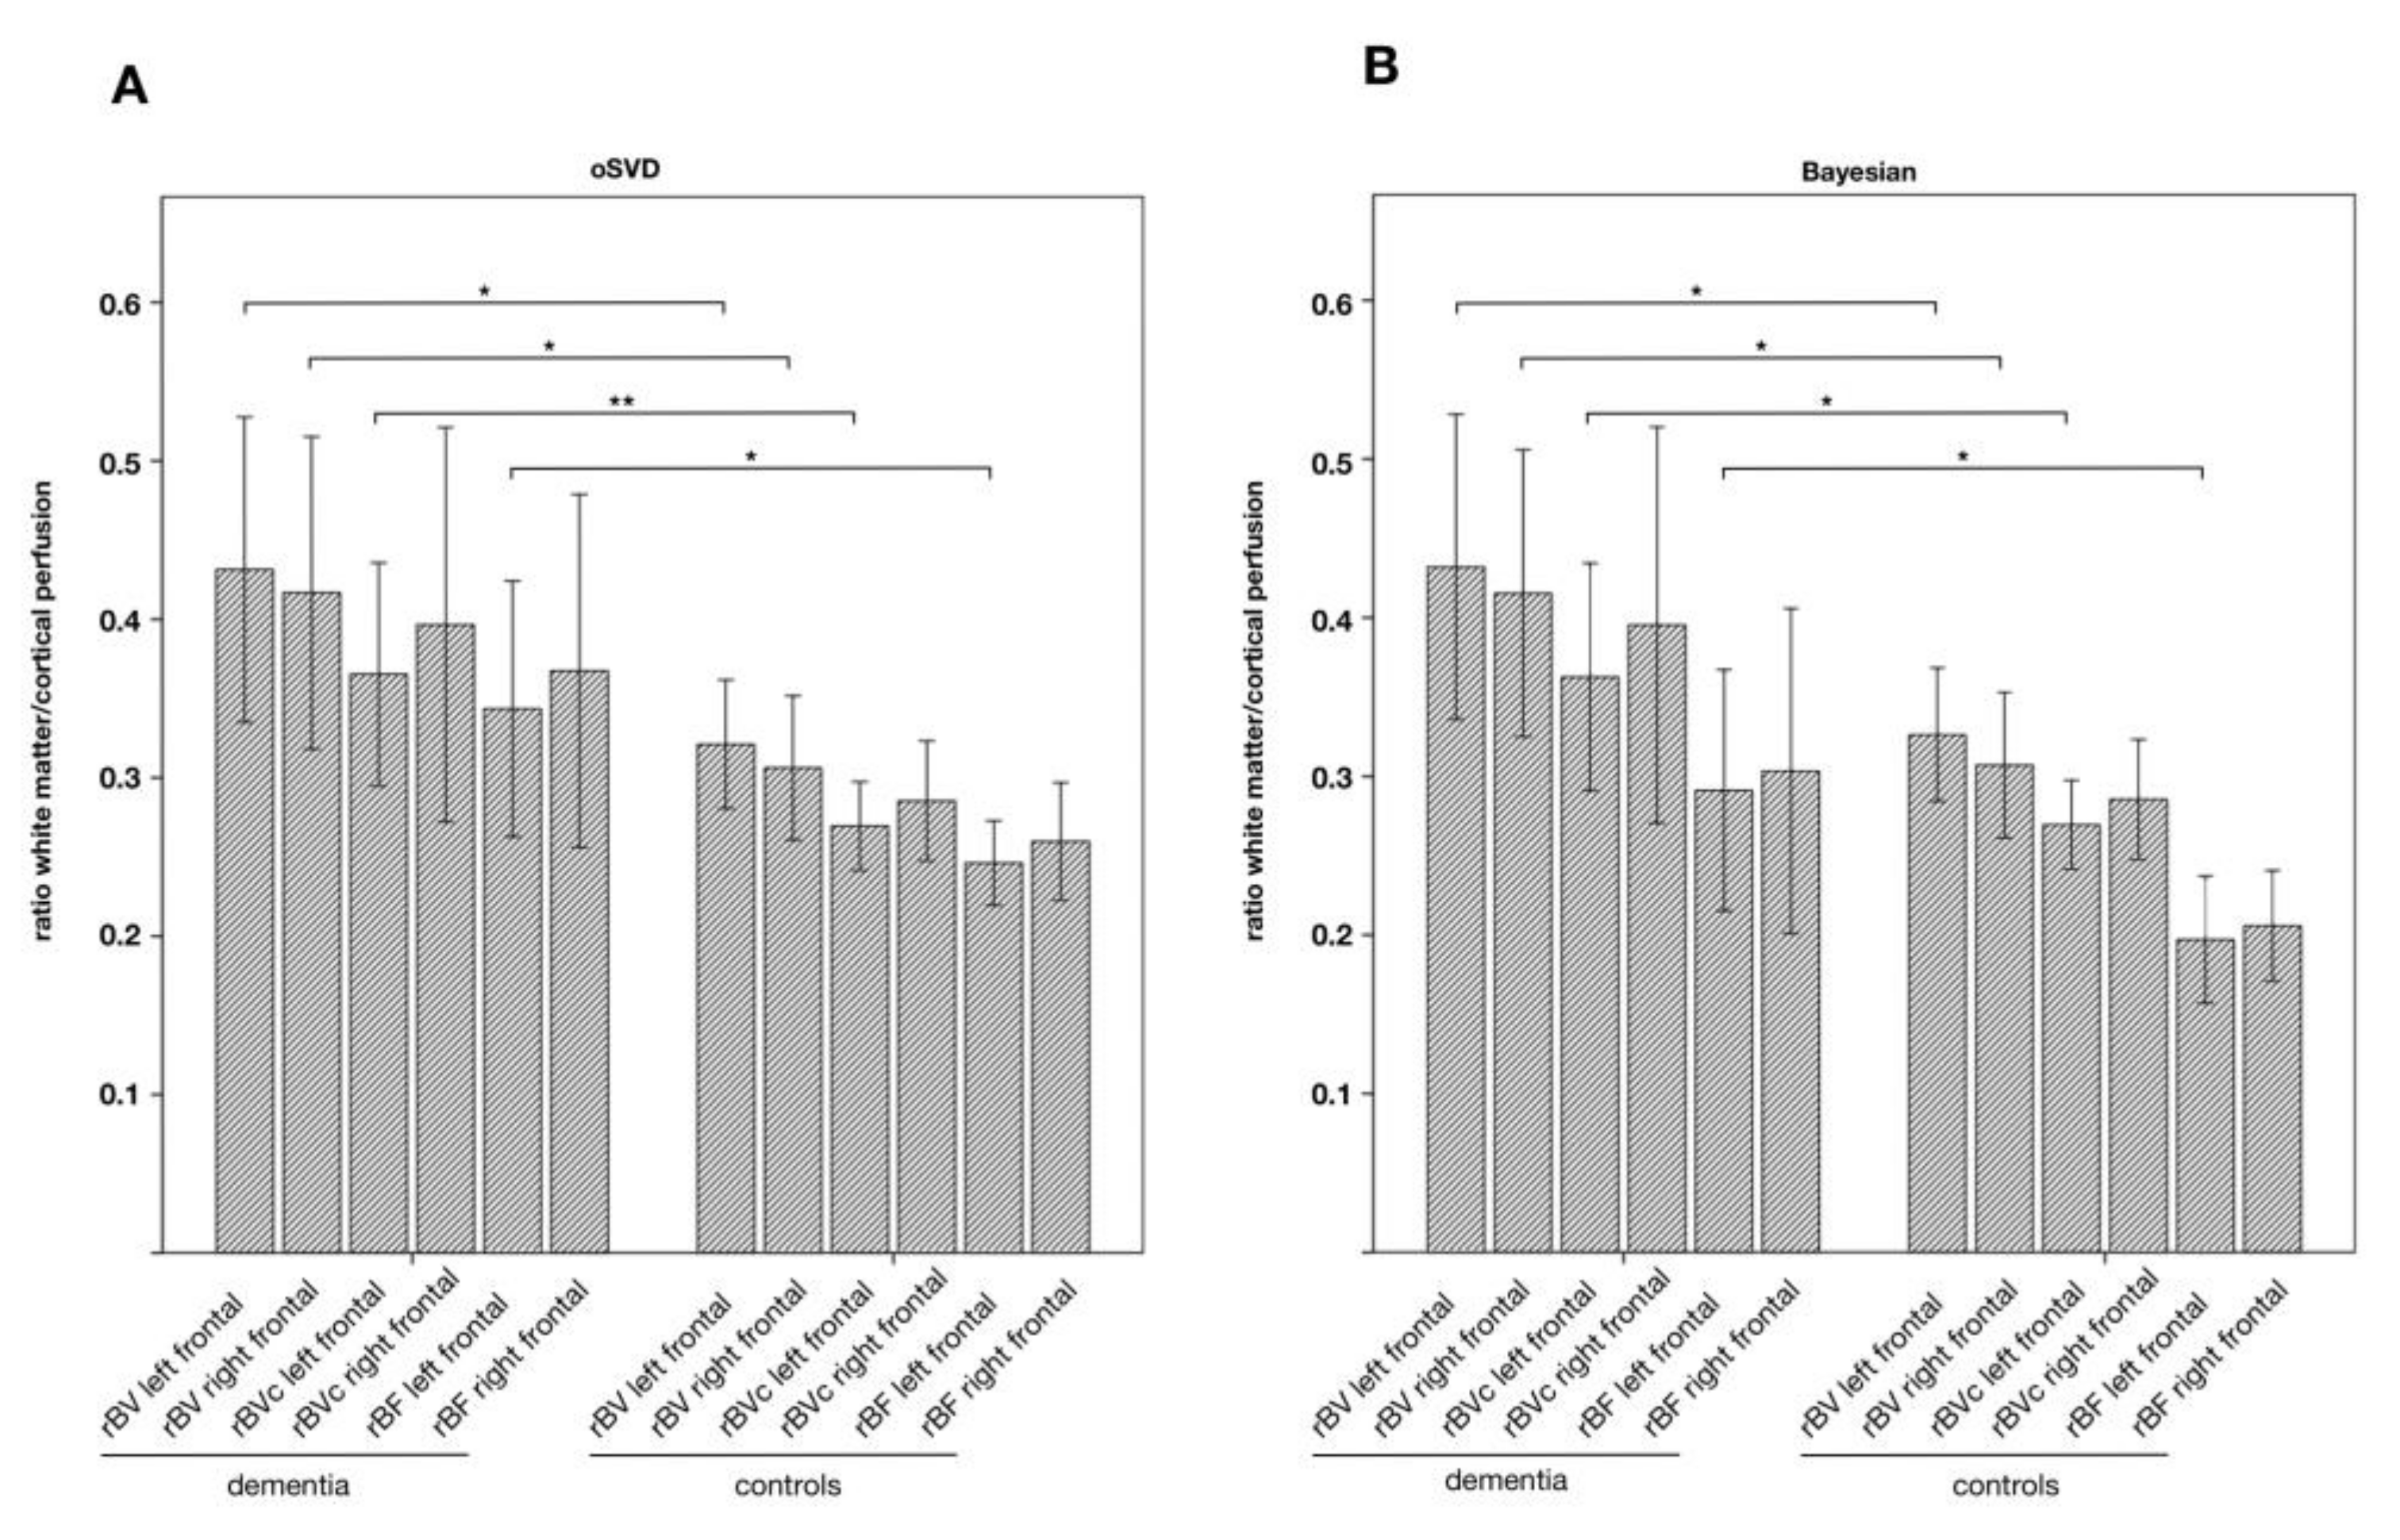
We found a significantly increased ratio of white matter/cortical perfusion, i.e., relative cortical hypoperfusion, measured with DSC in dementia compared to controls for frontal ROIs (Figure 2).
After correction of the covariates age and sex, the difference in means regarding the rBVc parameter of the left frontal ROI remained significant (0.37 vs. 0.27, p = 0.048) whereas it failed to reach statistical significance regarding rBV and rBF for both, the oSVD and the Bayesian approach.
We also looked at the uncorrected values. The ratios of the bilateral frontal lobe for rBV (left: 0.43 vs. 0.32, p = 0.037; right: 0.42 vs. 0.31, p = 0.043) and of the left frontal lobe for rBF (0.34 vs. 0.25, p = 0.025) were significantly higher compared to controls, showing at least a tendency. Regarding Bayesian estimation of parametric perfusion maps, we found similar results for rBV of the bilateral frontal lobe (left: 0.43 vs. 0.33, p = 0.045; right 0.42 vs. 0.31; p = 0.034), for rBVc of the left frontal lobe (0.36 vs. 0.27, p = 0.018) and for rBF of the left frontal lobe (0.29 vs. 0.20, p = 0.029).
Concerning the parietal ROIs, cortical hypoperfusion failed to reach statistical significance. MTT was not significantly different regarding the frontal and parietal ROIs. No significant hypoperfusion was found for temporal ROIs with ether the oSVD or the BAY approach. Results are summarized in Table 3.
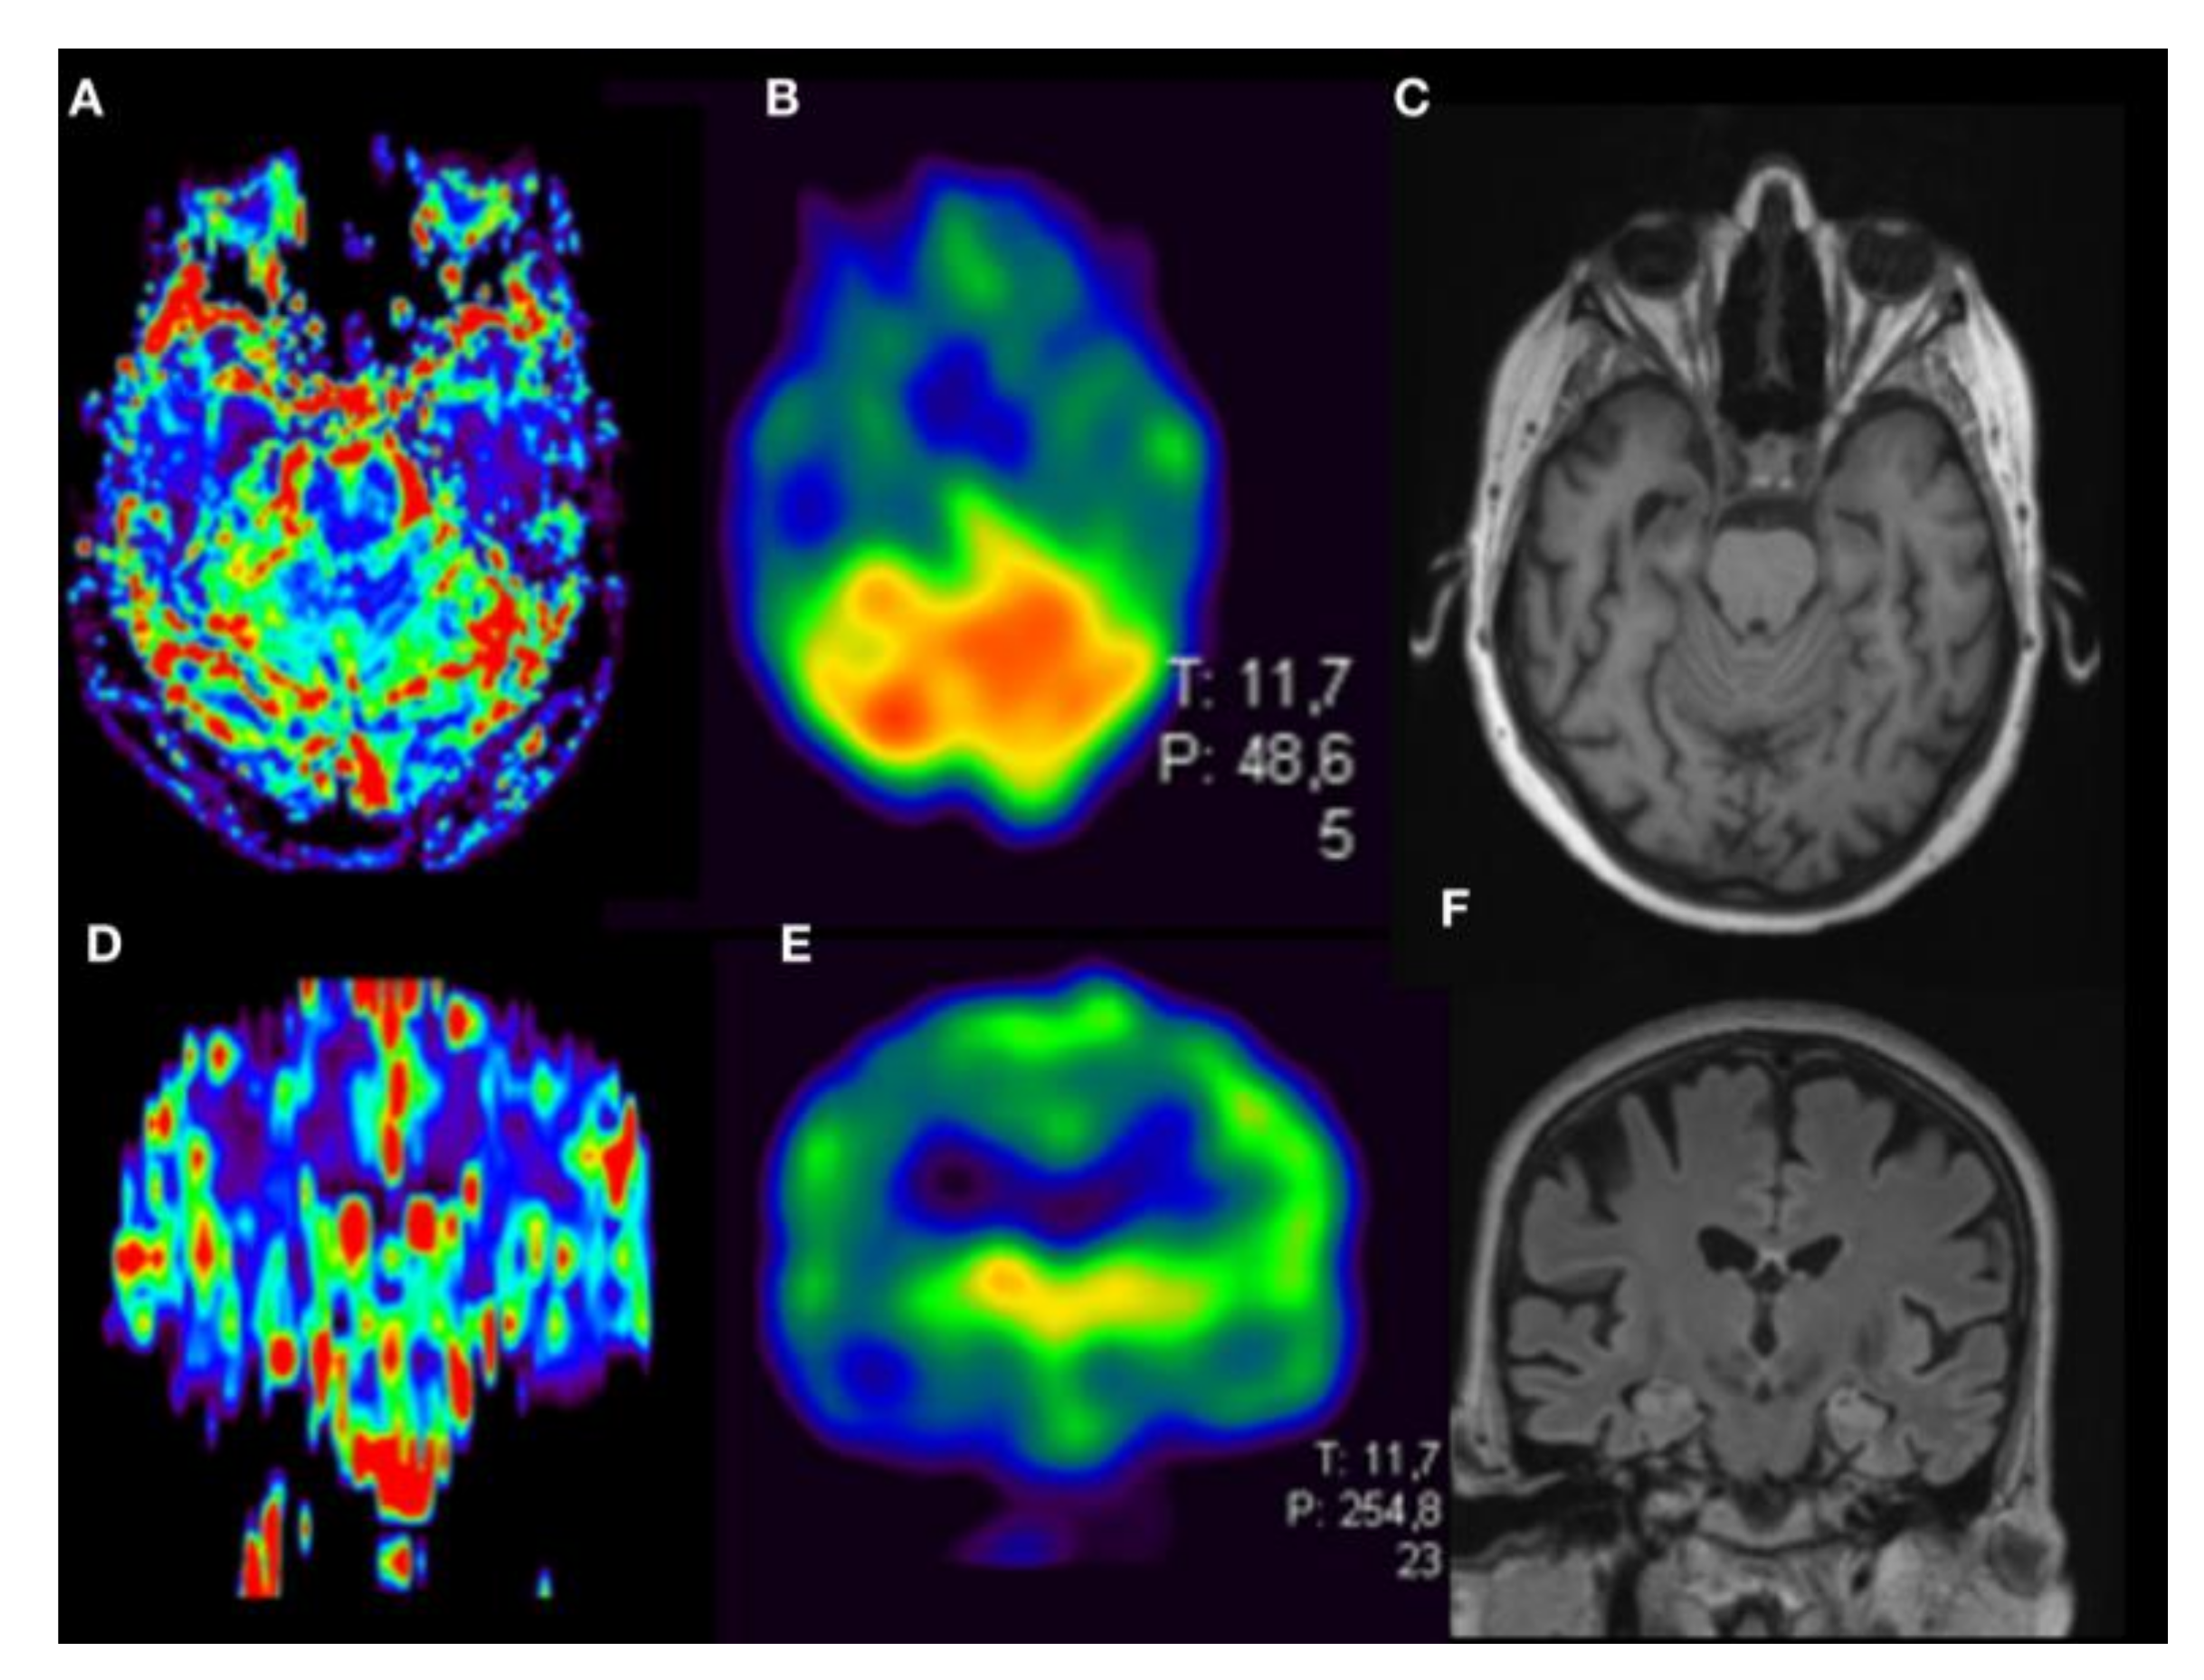
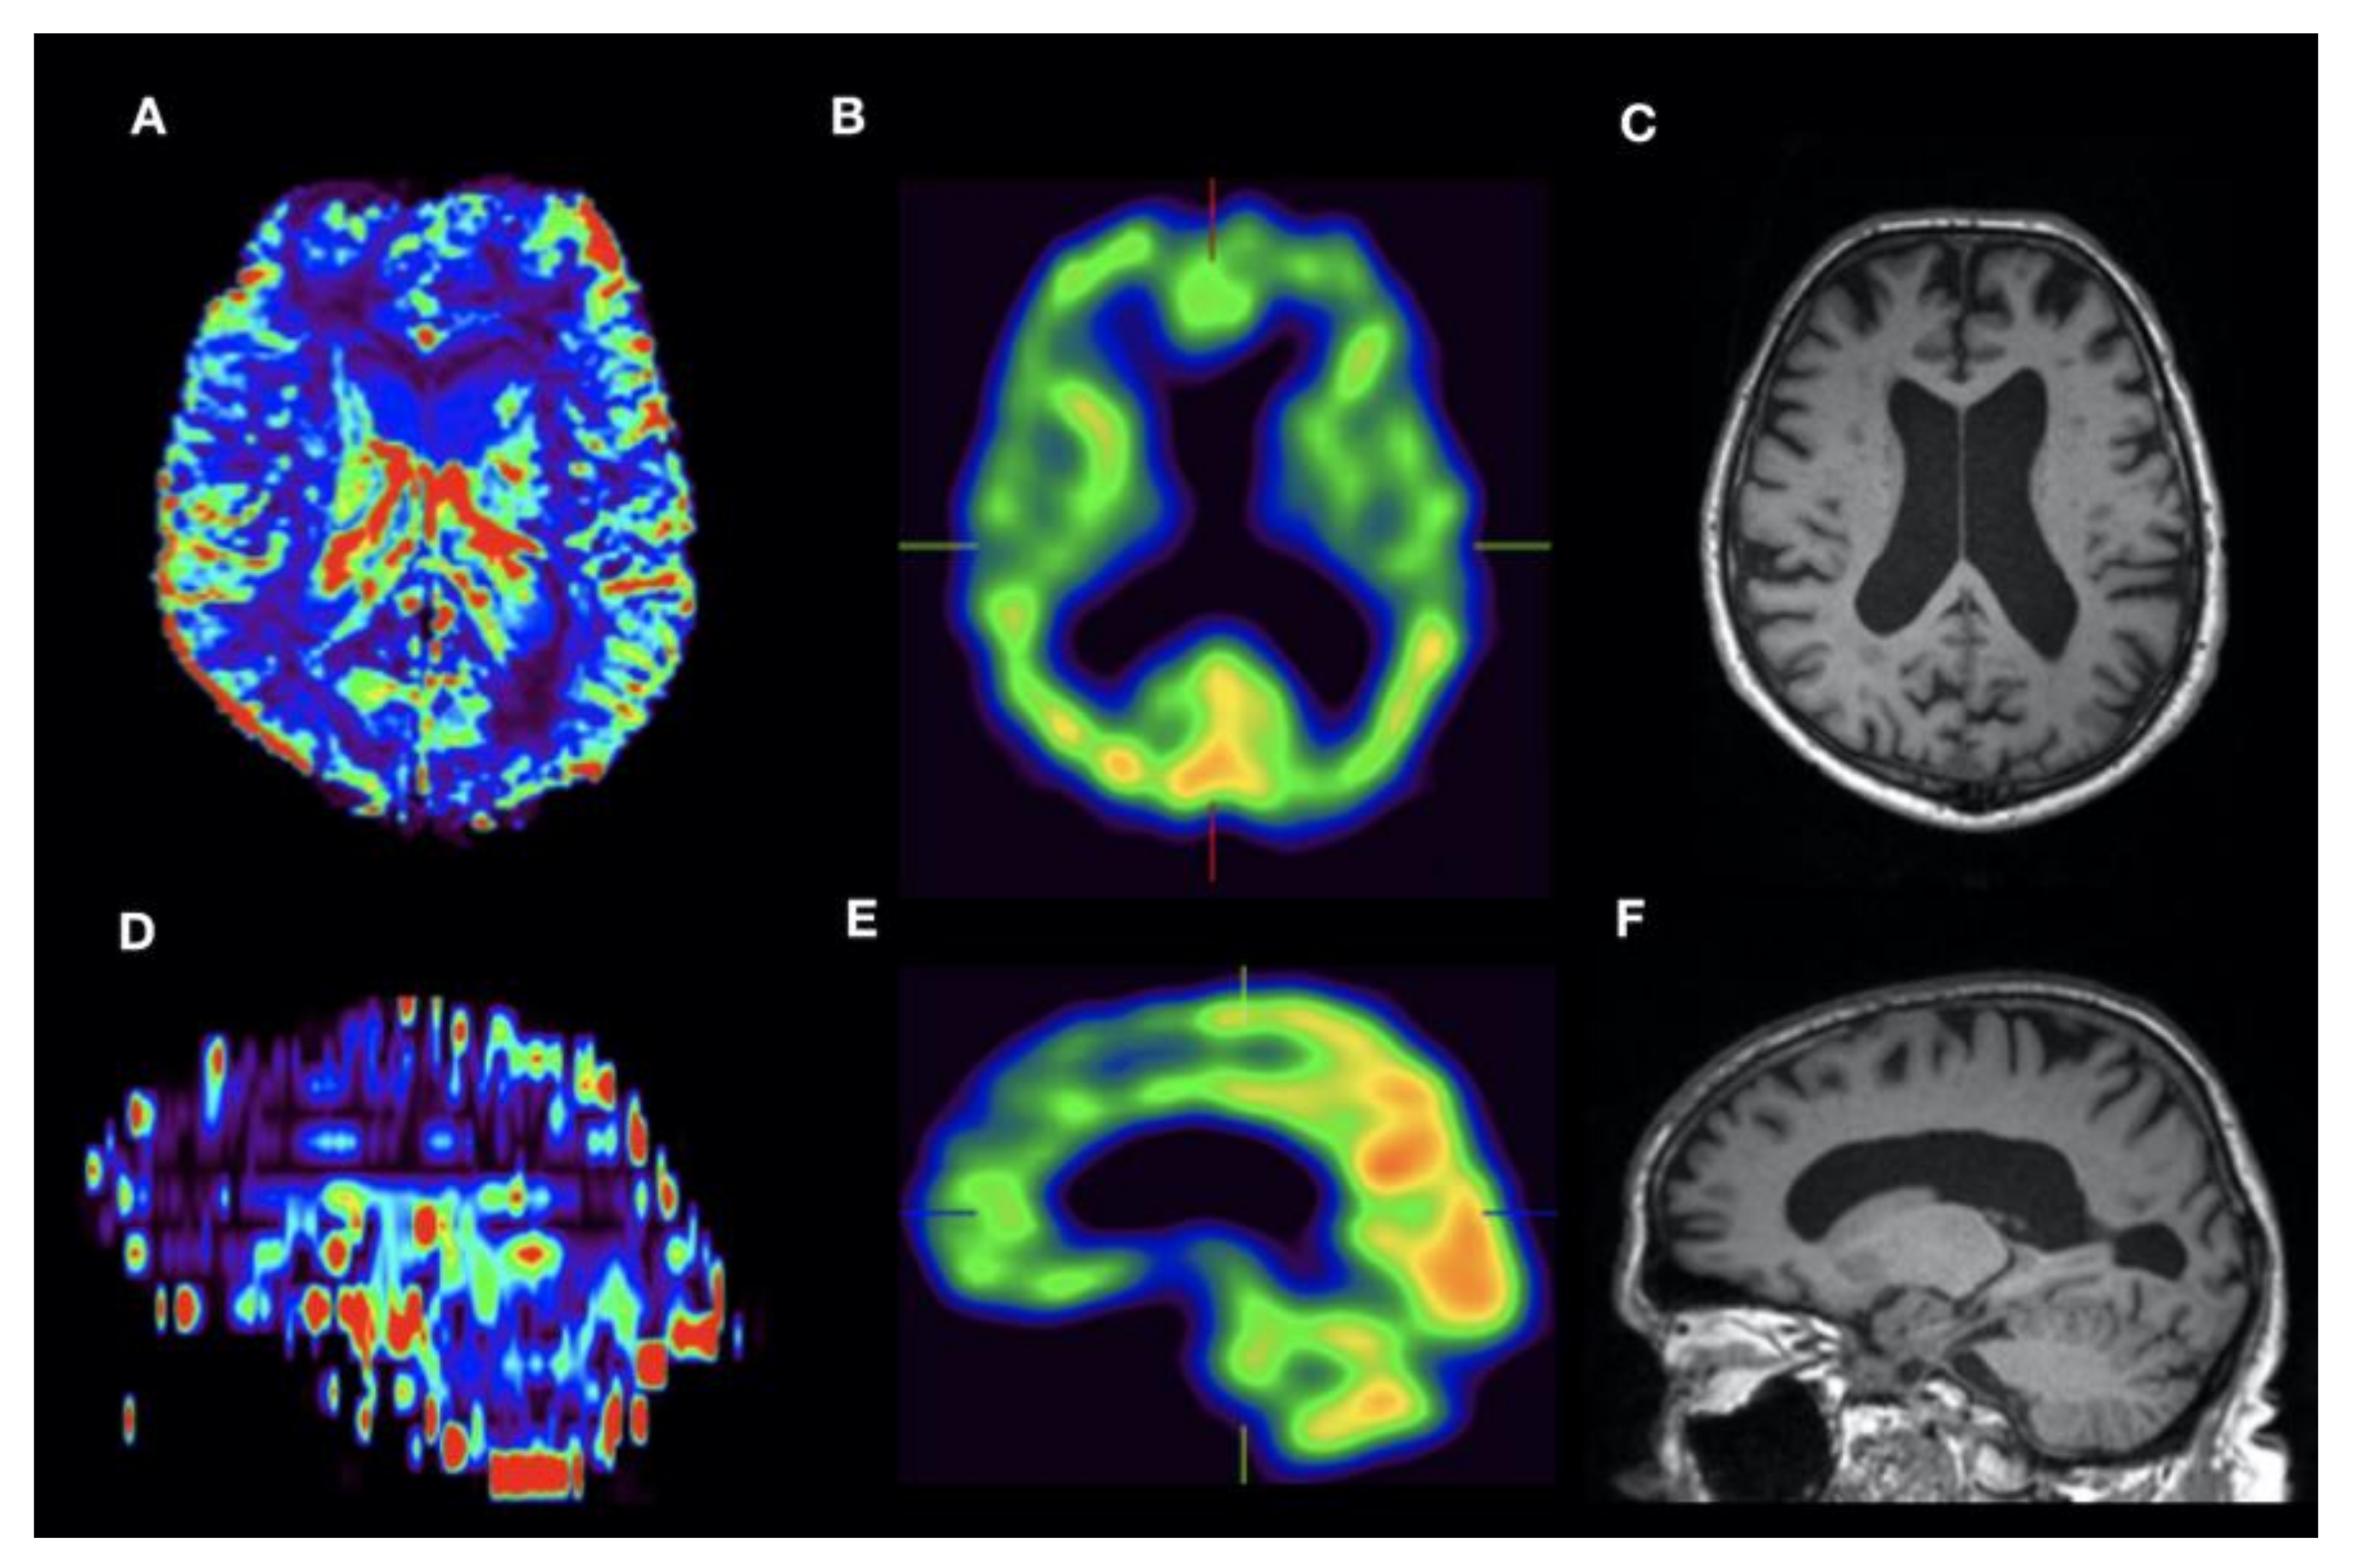
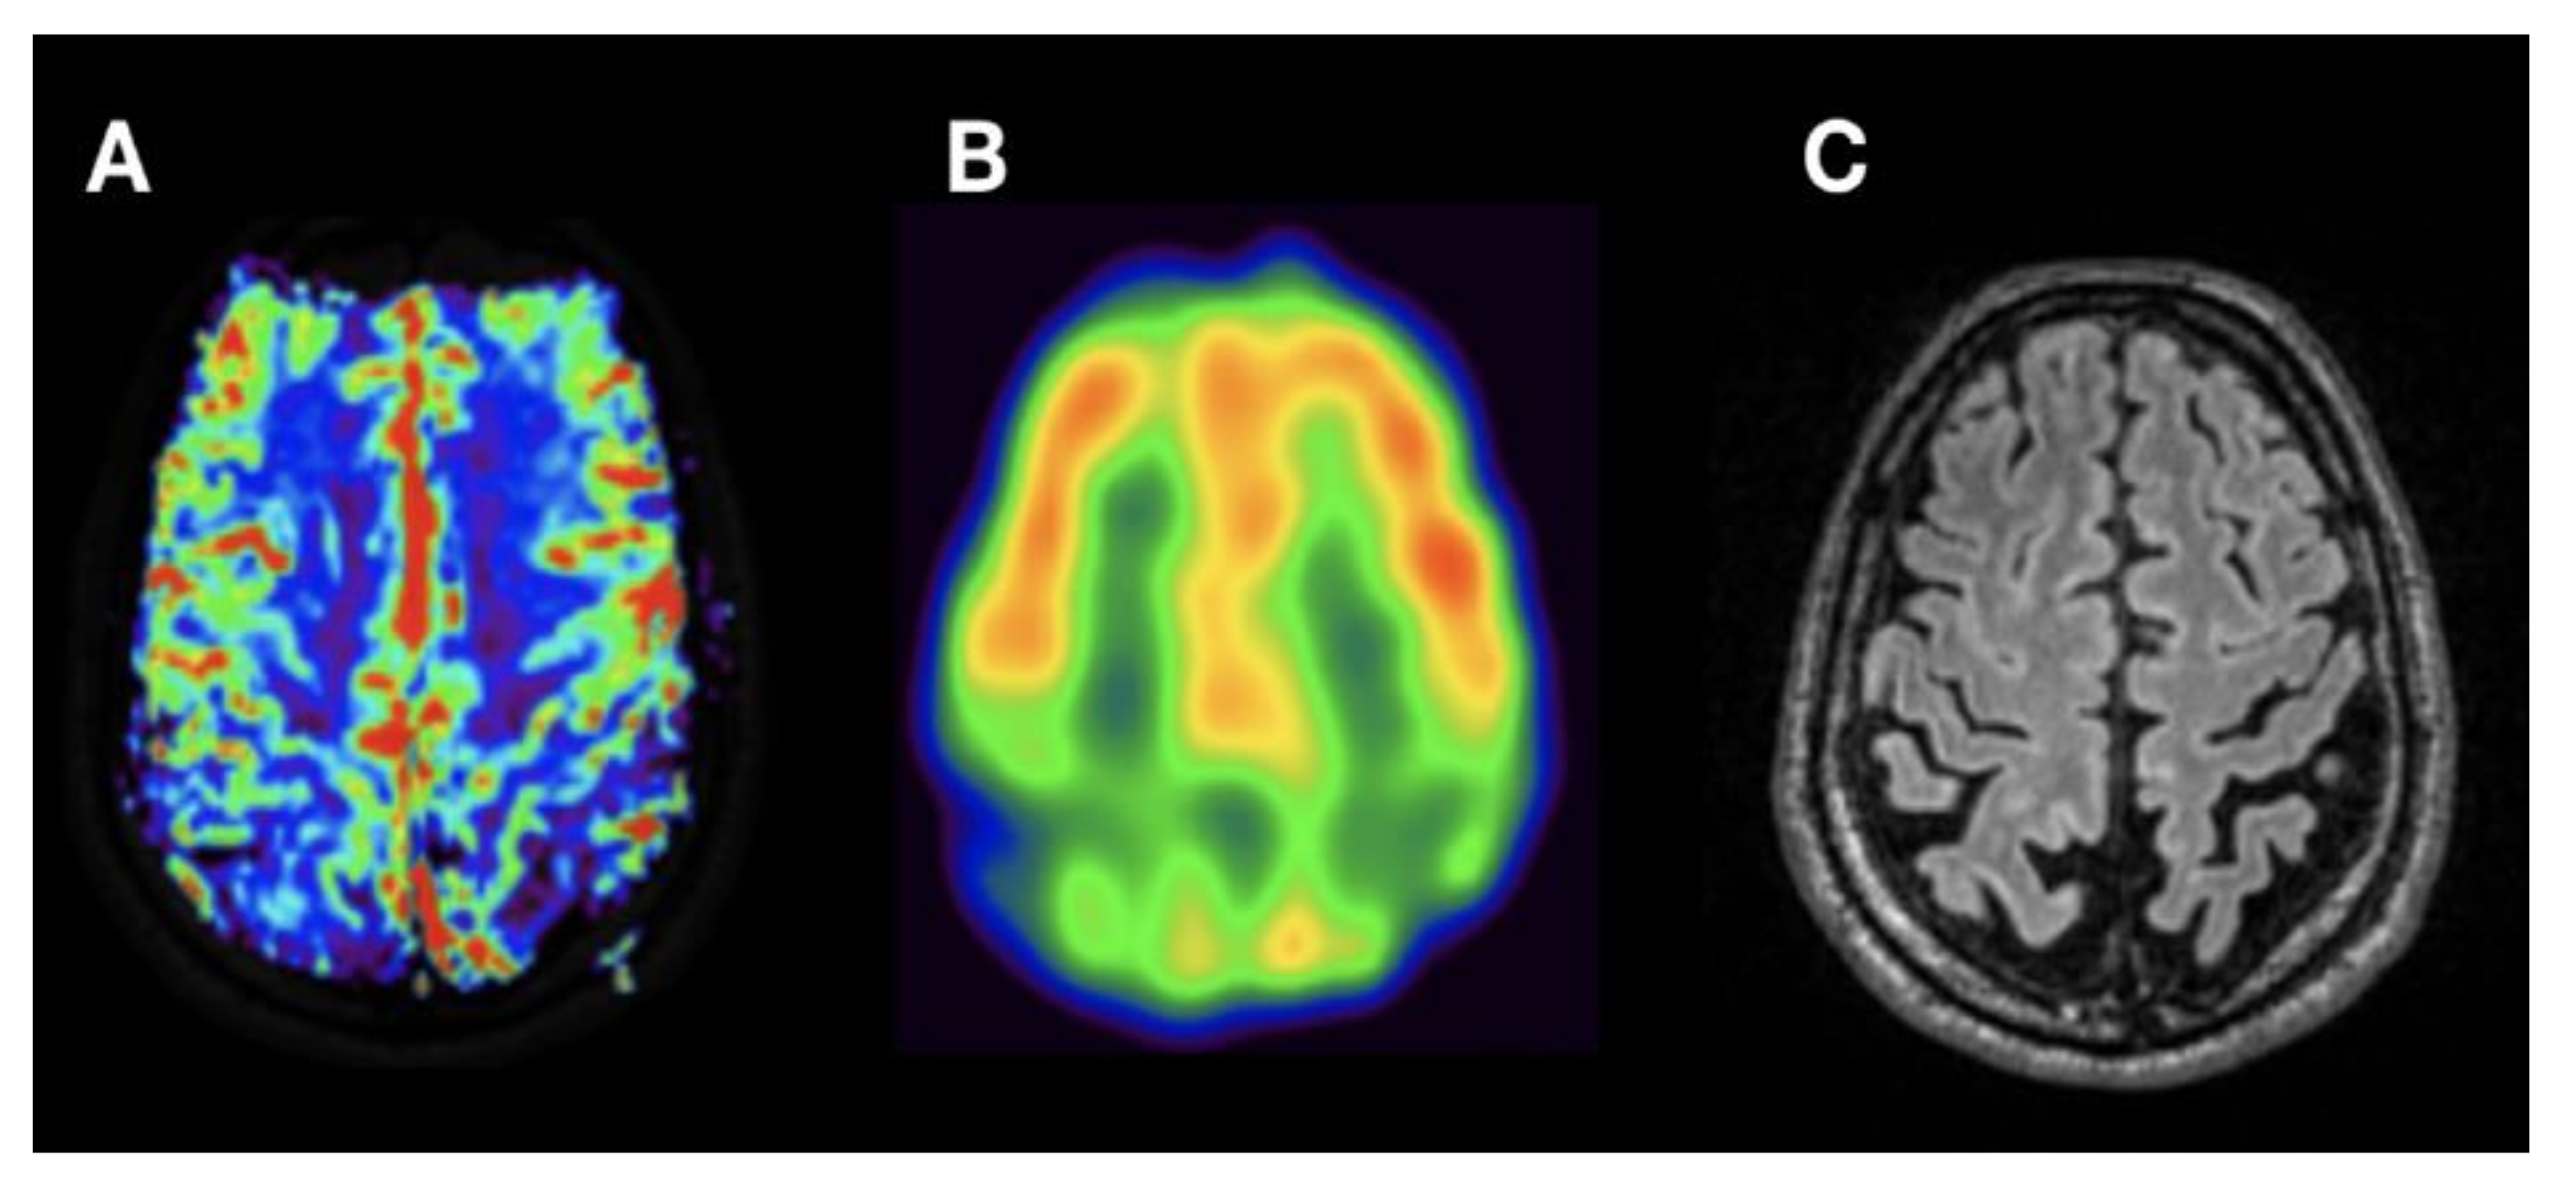
By visual interpretation of DSC perfusion maps, there was a good correlation of reduced cortical rBVc of temporal and parietal lobe with hypoperfusion seen on the respective SPECT dataset in Alzheimer’s disease (pathological MMST score of 10, Figure 3). Frontal cortical hypoperfusion in DSC correlated with hypoperfusion in SPECT in suspected early FTD in a 69-year-old male (Figure 4). Furthermore, parieto-occipital hypoperfusion in DSC in a 60-year-old male with suspected DLB-matched SPECT hypoperfusion (Figure 5) to a great extent. In this patient, absence of temporomesial atrophy in coronal FLAIR imaging corroborated the suspected diagnosis over posterior cortical atrophy as a variant of AD. Overall, regardless of the clinical diagnosis, there was a high correlation of cortical hypoperfusion in frontal lobes when comparing DSC perfusion with SPECT.
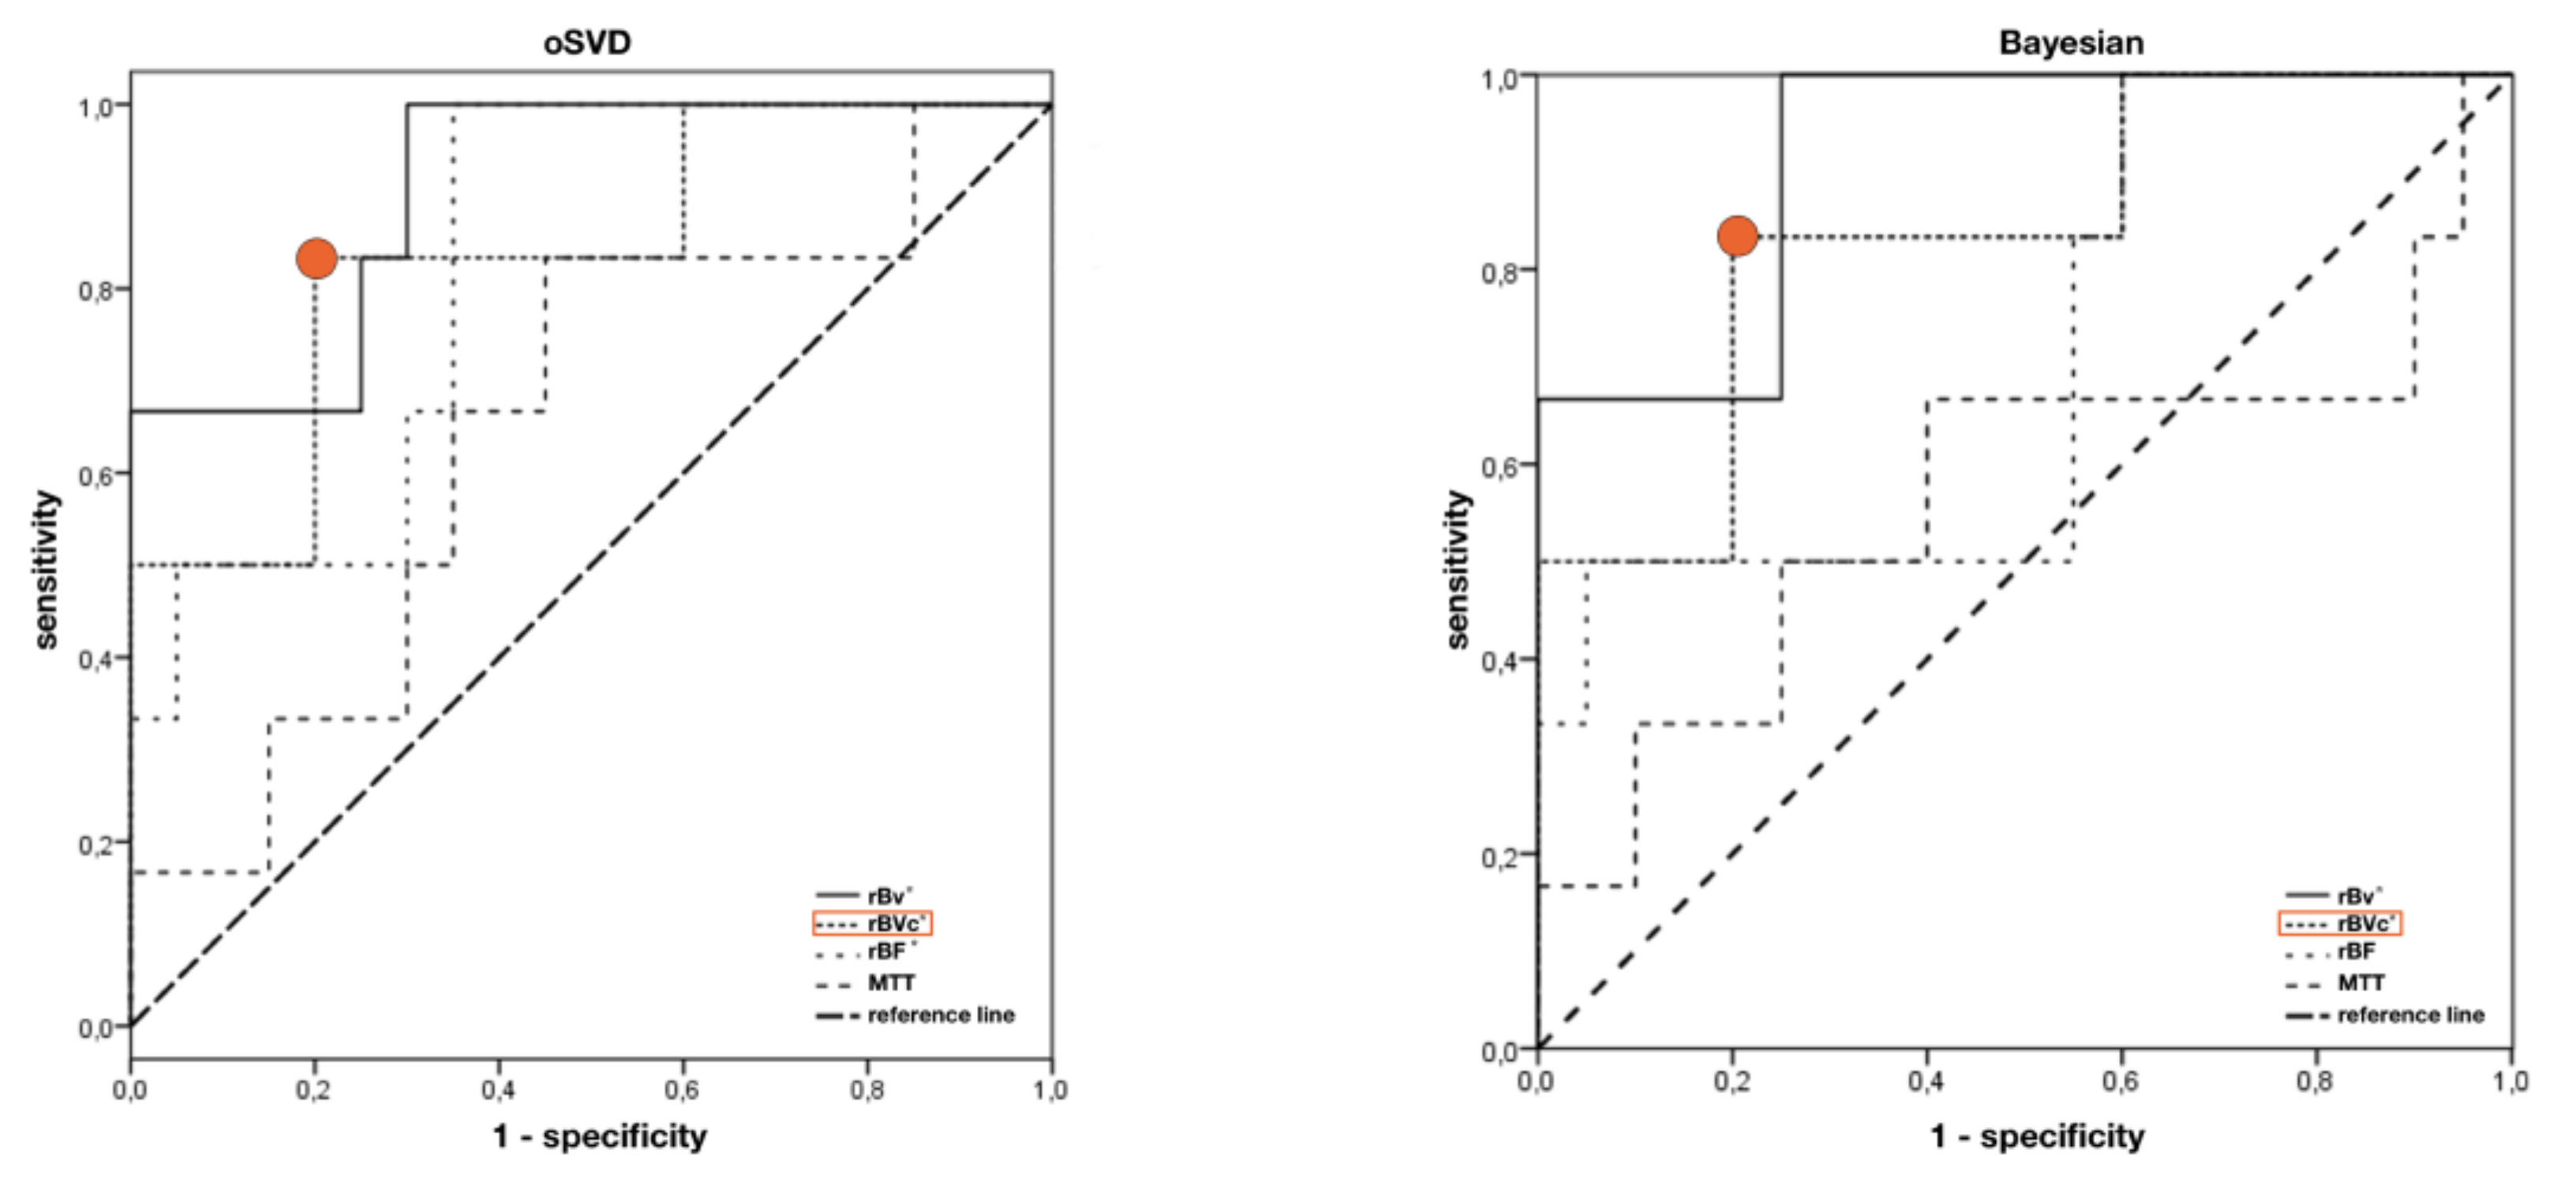
Using ROC analysis, the sensitivity for predicting hypoperfusion in the left frontal lobe in SPECT was 83% for rBV, rBVc, and rBF both for oSVD and Bayesian deconvolution (Figure 6) at a specificity of 75% for rBV (oSVD and BAY), 80% for rBVc (oSVD and BAY), 65% for rBF (oSVD) and 45% for rBF (BAY) with an AUC above 0.8, respectively (p < 0.05). Regarding rBF, only oSVD reached statistical significance (oSVD: AUC = 0.825, p < 0.05; BAY: AUC = 0.708, p > 0.05). AUC of MTT was not significant for both oSVD and BAY. For the right frontal lobe, as well as for the parietal and the temporal lobe, AUCs did also not reach statistical significance. Results are summarized in Table 4.

4. Discussion

DSC perfusion showed cortical hypoperfusion in frontal lobes for both deconvolution models in patients with suspected dementia compared to healthy individuals. The potential of MR-perfusion to detect dementia-induced hypoperfusion in FTD has been shown regarding the arterial spin labeling (ASL) technique, even in early stages of the disease [22,23]. Concerning the composition of our patient group with a majority of patients suspected to develop FTD (7/27) and 2 patients showing signs of an advanced stage of the disease (MMST < 20), our results are in line with these reports. Parieto-occipital cortical hypoperfusion failed to reach statistical significance in our cohort, presumably because of the relatively small sample size of patients with this pattern of hypoperfusion. We could not show cortical hypoperfusion in temporal lobes, although this has been described [23]. This may be due to partial volume effects and susceptibility artifacts near the skull base and air-containing structures.
An age-dependency of brain perfusion parameters has been described [24]. In an extensive and thorough analysis of 175 consecutive scans, Shin et al. report a decrease of rBV of 3.7% per decade in grey matter. Similar decrease rates of CBF and increase rates of MTT per decade are reported. Our results indicate a much stronger effect with a 26% difference of rBV and rBF regarding patients vs. controls. Given the age difference of 9 years between patients and controls, this strong effect cannot be explained as age-effect alone, as one would expect roughly 5% difference of rBV that could be addressed to aging. Additionally, it has been reported that brain perfusion is not homogeneously decreased in the ageing brain but is characterized by decreased rBF in frontal and parietal areas and cerebellum, and relatively preserved in temporal, occipital and orbital frontal areas. Moreover, it has been suggested that observed differences in brain perfusion can also be ascribed to changes in brain volume—at least to a certain extent [25]. Our finding of cortical hypoperfusion remained significant for the left frontal ROI of the rBVc parameter after adjustment of age and sex.
Correlation analysis of DSC perfusion with SPECT has produced mixed results in the past. Studies investigating rBV and rBF measures in Alzheimer’s disease have partly shown promising results and good correlation with SPECT [11,12]. However, several studies demonstrated that DSC perfusion cannot replace SPECT in AD and that SPECT remains superior over DSC perfusion regarding diagnostic accuracy [13,14].
Nevertheless, we show a good visual correlation of cerebral blood volume derived from DSC with SPECT brain perfusion maps in AD (Figure 3). Temporal and parietal hypoperfusion could be clearly delineated on both parametric maps on corresponding slices. In case of temporal hypoperfusion, a potential advantage of DSC perfusion is the higher spatial resolution that can be achieved over SPECT [26,27]. Combination with additional evaluation of anatomical datasets, shows typical temporomesial and frontoparietal atrophy.
Furthermore, we could demonstrate a high correlation of frontal cortical hypoperfusion in rBVc with the respective SPECT rBF image in suspected frontotemporal dementia (Figure 4). As shown, the possibility of multiplanar reconstruction of DSC hemodynamic parameter maps helps in identifying a frontoparietal gradient of cortical perfusion in the color-coded rBVc map when comparing DCS and SPECT datasets.
Moreover, there was good correlation of hypoperfusion in DSC and SPECT in a case of DLB (Figure 5). Although the atrophy pattern of DLB may be very heterogeneous, relative preservation of the medial temporal lobe has been reported [28,29]. Parieto-occipital cortical hypoperfusion can be clearly delineated in the DSC rBVc map and in the SPECT rBF map correlating with focal atrophy. Additional coronal imaging shows absence of temporomesial atrophy (Figure 5B).
Focal patterns of hypoperfusion in DSC rBVc maps for AD, FTD and DLB are in line with previously reported patterns of hypoperfusion in SPECT in these etiologies [8].
Quantitative DSC analysis revealed a rBVc white matter/cortex-ratio greater 0.36 can predict visually detectable frontal hypoperfusion in SPECT with a sensitivity of 83% and a specificity of 80%. Absolute quantification of blood volume and blood flow is not possible because they depend on scanner, applied contrast agent and acquisition parameters and can be influenced by partial volume effects. Thus, we have chosen a ratio of white matter/cortical perfusion, using white matter as a reference region, to overcome these issues. These ratios can be easily calculated and transferred into clinical routine. Performance of rBVc was independent of the chosen deconvolution model (Figure 6), as the calculated blood volume is only dependent on the area under the R2* curve [17,30].
Our results are in line with previous reports of a promising correlation of rBV derived from DSC perfusion compared to rBF by SPECT [11]; however, our settings with higher field strength (3T vs. 1.5T), and thus higher signal-to-noise ratio (SNR), and improved spatial resolution (slice thickness 6 mm/interslice gap 1.8 mm vs. 7 mm/3 mm) make data acquisition more robust in terms of reproducibility and accuracy [31]. Interestingly, specificity was slightly higher for rBVc than for uncorrected (i.e., not corrected for contrast agent leakage) rBV even though no disruption of the blood-brain barrier (BBB) was suspected. One possible reason may be subtle BBB disruption as dysfunction of the BBB. This phenomenon has been described in AD before [32] and might also apply for FTD and DLB.
Despite a high performance of rBVc, we could show an exactly as high sensitivity of 83% for rBF to predict hypoperfusion in SPECT. This seems to be in contrast to previous studies where correlation of DSC derived rBF with SPECT was found to be poor [13,14]. However, in these studies, nonadaptive singular value deconvolution was used for deconvolving the tissue signal from the arterial input function. This technique has been described to be sensitive to delay and dispersion of the arriving contrast agent bolus leading to over- or underestimation of cerebral blood flow in tissues where the bolus arrives earlier than in the chosen AIF [15]. Consequently, formerly poor correlation of rBF with SPECT might have been due to the fact that true rBF has been underestimated by the deconvolution algorithm. oSVD, as used in our setting, in contrast is far less sensitive for differences in tracer arriving time [15] leading to a more robust estimation of rBF and a superior detection of hypoperfusion.
When using Bayesian parameter estimation, a probabilistic method that is considered to deliver even more accurate and robust hemodynamic parameters [16,17], AUC of rBF estimation failed to reach statistical significance (Figure 6).
MTT estimations were generally lower when comparing the values calculated with the Bayesian approach to the values calculated with oSVD. It has been described that SVD techniques have larger errors in slow flow conditions and the parameter estimation performance is poorer compared to high flow conditions [15]. Thus, in slow flow conditions such as suspected dementia, MTT estimation with the Bayesian method may be more accurate, despite the values failed to reach statistical significance. Additionally, Bayesian deconvolution has been reported to outperform oSVD, especially in cases of high cerebral blood flow [20]. This seems to be of less relevance in detecting hypoperfusion in dementia with low CBF.
A combination of delay-insensitive oSVD derived rBVc and rBF perfusion indices thus leads to a high performance in predicting hypoperfusion in SPECT brain perfusion in dementia and MCI.
Our study has certain limitations. Firstly, the number of 27 patients included is rather small. Certainly, larger series are needed to confirm the results and also test for diagnostic accuracy of DSC in dementia. Regarding the known age-dependency of brain perfusion, it has to be taken into account that patients and controls are not age-matched in our analysis. However, the results remain significant after adjusting for age and sex effects and it can be assumed that the age-effect is relatively weak compared to the significant differences of brain perfusion parameters that we observed. Another shortcoming is the lack of quantitative data corroborating the visual correlation of DSC and SPECT hypoperfusion patterns; this also necessitates further case series. The heterogeneity of our cohort probably limits general conclusions about the correlation of DSC and SPECT data, despite providing a way to examine various perfusion patterns regarding the suspected clinical diagnosis.

5. Conclusions

Advanced oSVD deconvolution in DSC perfusion has a high potential and correlates with SPECT brain perfusion results in dementia and MCI. Hence, DSC perfusion could be helpful in an interdisciplinary diagnostic work-up of suspected dementia.

Author Contributions

Conceptualization, M.A.S. and A.D.; methodology, M.A.S., T.E. and A.D.; software, S.L., H.L. and P.H.; validation, K.F., P.R., J.M.M. and T.K.; formal analysis, M.A.S., P.H. and K.F.; investigation, M.A.S., J.K. and A.D.; resources, A.D.; data curation, M.A.S. and A.D.; writing—original draft preparation, M.A.S. and A.D.; writing—review and editing, M.A.S., T.E., S.L., H.L., P.H., K.F., P.R., J.M.M., T.K., J.K. and A.D.; visualization, M.A.S.; supervision, T.K., J.K. and A.D.; funding acquisition, T.E. and A.D. All authors have read and agreed to the published version of the manuscript.

Funding

Investigator-initiated trial supported by Bayer Healthcare.

Conflicts of Interest

The authors declare no conflict of interest.

References

  1. Prince, M.; Bryce, R.; Albanese, E.; Wimo, A.; Ribeiro, W.; Ferri, C.P. The global prevalence of dementia: A systematic review and metaanalysis. Alzheimers Dement. J. Alzheimers Assoc. 2013, 9, 63–75. [Google Scholar] [CrossRef] [PubMed]
  2. Tola-Arribas, M.A.; Yugueros, M.I.; Garea, M.J.; Ortega-Valin, F.; Ceron-Fernandez, A.; Fernandez-Malvido, B.; San Jose-Gallegos, A.; Gonzalez-Touya, M.; Botran-Velicia, A.; Iglesias-Rodriguez, V.; et al. Prevalence of dementia and subtypes in Valladolid, northwestern Spain: The DEMINVALL study. PLoS ONE 2013, 8, e77688. [Google Scholar] [CrossRef] [PubMed] [Green Version]
  3. Swan, A.; Waddell, B.; Holloway, G.; Bak, T.; Colville, S.; Khan, Z.; Pal, S. The diagnostic utility of 99mTc-HMPAO SPECT imaging: A retrospective case series from a tertiary referral early-onset cognitive disorders clinic. Dement. Geriatr. Cogn. Disord. 2015, 39, 186–193. [Google Scholar] [CrossRef] [PubMed]
  4. Greig, N.H.; Lahiri, D.K.; Giacobini, E. Editorial: Advances in Alzheimer therapy: Something old, something new, something borrowed, something blue. Curr. Alzheimer Res. 2005, 2, 275–279. [Google Scholar] [CrossRef]
  5. Karran, E.; Hardy, J. Antiamyloid therapy for Alzheimer’s disease--are we on the right road? N. Engl. J. Med. 2014, 370, 377–378. [Google Scholar] [CrossRef]
  6. Frisoni, G.B.; Fox, N.C.; Jack, C.R., Jr.; Scheltens, P.; Thompson, P.M. The clinical use of structural MRI in Alzheimer disease. Nat. Rev. Neurol. 2010, 6, 67–77. [Google Scholar] [CrossRef] [Green Version]
  7. Fallmar, D.; Lilja, J.; Velickaite, V.; Danfors, T.; Lubberink, M.; Ahlgren, A.; van Osch, M.J.; Kilander, L.; Larsson, E.M. Visual Assessment of Brain Perfusion MRI Scans in Dementia: A Pilot Study. J. Neuroimaging 2015. [Google Scholar] [CrossRef]
  8. Yeo, J.M.; Lim, X.; Khan, Z.; Pal, S. Systematic review of the diagnostic utility of SPECT imaging in dementia. Eur. Arch. Psychiatry Clin. Neurosci. 2013, 263, 539–552. [Google Scholar] [CrossRef]
  9. Rausch, I.; Fuchsel, F.G.; Kuderer, C.; Hentschel, M.; Beyer, T. Radiation exposure levels of routine SPECT/CT imaging protocols. Eur. J. Radiol. 2016, 85, 1627–1636. [Google Scholar] [CrossRef]
  10. Eskildsen, S.F.; Gyldensted, L.; Nagenthiraja, K.; Nielsen, R.B.; Hansen, M.B.; Dalby, R.B.; Frandsen, J.; Rodell, A.; Gyldensted, C.; Jespersen, S.N.; et al. Increased cortical capillary transit time heterogeneity in Alzheimer’s disease: A DSC-MRI perfusion study. Neurobiol. Aging 2017, 50, 107–118. [Google Scholar] [CrossRef] [Green Version]
  11. Harris, G.J.; Lewis, R.F.; Satlin, A.; English, C.D.; Scott, T.M.; Yurgelun-Todd, D.A.; Renshaw, P.F. Dynamic susceptibility contrast MR imaging of regional cerebral blood volume in Alzheimer disease: A promising alternative to nuclear medicine. Am. J. Neuroradiol. 1998, 19, 1727–1732. [Google Scholar]
  12. Yoshiura, T.; Mihara, F.; Kuwabara, Y.; Ogomori, K.; Kaneko, K.; Tanaka, A.; Sasaki, M.; Nakagawa, M.; Koga, H.; Yamanaka, T.; et al. MR relative cerebral blood flow mapping of Alzheimer disease: Correlation with Tc-99m HMPAO SPECT. Acad. Radiol. 2002, 9, 1383–1387. [Google Scholar] [CrossRef]
  13. Cavallin, L.; Danielsson, R.; Oksengard, A.R.; Wahlund, L.O.; Julin, P.; Frank, A.; Engman, E.L.; Svensson, L.; Kristoffersen Wiberg, M. Can dynamic susceptibility contrast magnetic resonance imaging replace single-photon emission computed tomography in the diagnosis of patients with Alzheimer’s disease? A pilot study. Acta Radiol. 2006, 47, 977–985. [Google Scholar] [CrossRef]
  14. Cavallin, L.; Axelsson, R.; Wahlund, L.O.; Oksengard, A.R.; Svensson, L.; Juhlin, P.; Wiberg, M.K.; Frank, A. Voxel-based correlation between coregistered single-photon emission computed tomography and dynamic susceptibility contrast magnetic resonance imaging in subjects with suspected Alzheimer disease. Acta Radiol. 2008, 49, 1154–1161. [Google Scholar] [CrossRef]
  15. Wu, O.; Ostergaard, L.; Weisskoff, R.M.; Benner, T.; Rosen, B.R.; Sorensen, A.G. Tracer arrival timing-insensitive technique for estimating flow in MR perfusion-weighted imaging using singular value decomposition with a block-circulant deconvolution matrix. Magn. Reson. Med. 2003, 50, 164–174. [Google Scholar] [CrossRef]
  16. Kudo, K.; Boutelier, T.; Pautot, F.; Honjo, K.; Hu, J.Q.; Wang, H.B.; Shintaku, K.; Uwano, I.; Sasaki, M. Bayesian analysis of perfusion-weighted imaging to predict infarct volume: Comparison with singular value decomposition. Magn. Reson. Med Sci. MRMS 2014, 13, 45–50. [Google Scholar] [CrossRef] [Green Version]
  17. Sasaki, M.; Kudo, K.; Boutelier, T.; Pautot, F.; Christensen, S.; Uwano, I.; Goodwin, J.; Higuchi, S.; Ito, K.; Yamashita, F. Assessment of the accuracy of a Bayesian estimation algorithm for perfusion CT by using a digital phantom. Neuroradiology 2013, 55, 1197–1203. [Google Scholar] [CrossRef]
  18. Mouridsen, K.; Christensen, S.; Gyldensted, L.; Ostergaard, L. Automatic selection of arterial input function using cluster analysis. Magn. Reson. Med. 2006, 55, 524–531. [Google Scholar] [CrossRef]
  19. Ostergaard, L.; Weisskoff, R.M.; Chesler, D.A.; Gyldensted, C.; Rosen, B.R. High resolution measurement of cerebral blood flow using intravascular tracer bolus passages. Part I: Mathematical approach and statistical analysis. Magn. Reson. Med. 1996, 36, 715–725. [Google Scholar] [CrossRef]
  20. Boutelier, T.; Kudo, K.; Pautot, F.; Sasaki, M. Bayesian hemodynamic parameter estimation by bolus tracking perfusion weighted imaging. IEEE Trans. Med. Imaging 2012, 31, 1381–1395. [Google Scholar] [CrossRef]
  21. Hara, S.; Tanaka, Y.; Hayashi, S.; Inaji, M.; Maehara, T.; Hori, M.; Aoki, S.; Ishii, K.; Nariai, T. Bayesian Estimation of CBF Measured by DSC-MRI in Patients with Moyamoya Disease: Comparison with (15)O-Gas PET and Singular Value Decomposition. Am. J. Neuroradiol. 2019, 40, 1894–1900. [Google Scholar] [CrossRef] [PubMed] [Green Version]
  22. Steketee, R.M.; Bron, E.E.; Meijboom, R.; Houston, G.C.; Klein, S.; Mutsaerts, H.J.; Mendez Orellana, C.P.; de Jong, F.J.; van Swieten, J.C.; van der Lugt, A.; et al. Early-stage differentiation between presenile Alzheimer’s disease and frontotemporal dementia using arterial spin labeling MRI. Eur. Radiol. 2015. [Google Scholar] [CrossRef] [PubMed] [Green Version]
  23. Binnewijzend, M.A.; Kuijer, J.P.; van der Flier, W.M.; Benedictus, M.R.; Moller, C.M.; Pijnenburg, Y.A.; Lemstra, A.W.; Prins, N.D.; Wattjes, M.P.; van Berckel, B.N.; et al. Distinct perfusion patterns in Alzheimer’s disease, frontotemporal dementia and dementia with Lewy bodies. Eur. Radiol. 2014, 24, 2326–2333. [Google Scholar] [CrossRef] [PubMed]
  24. Shin, W.; Horowitz, S.; Ragin, A.; Chen, Y.; Walker, M.; Carroll, T.J. Quantitative cerebral perfusion using dynamic susceptibility contrast MRI: Evaluation of reproducibility and age- and gender-dependence with fully automatic image postprocessing algorithm. Magn. Reson. Med. 2007, 58, 1232–1241. [Google Scholar] [CrossRef]
  25. Henriksen, O.M.; Jensen, L.T.; Krabbe, K.; Guldberg, P.; Teerlink, T.; Rostrup, E. Resting brain perfusion and selected vascular risk factors in healthy elderly subjects. PLoS ONE 2014, 9, e97363. [Google Scholar] [CrossRef]
  26. Menzel, C.; Hufnagel, A.; Grunwald, F.; Pavics, L.; Reichmann, K.; Elger, C.E.; Biersack, H.J. The relevance of interictal rCBF brain SPECT in temporal lobe epilepsy: Diagnostical value and effects of spatial resolution. Ann. Nucl. Med. 1995, 9, 215–223. [Google Scholar] [CrossRef]
  27. Rodriguez, G.; Vitali, P.; Calvini, P.; Bordoni, C.; Girtler, N.; Taddei, G.; Mariani, G.; Nobili, F. Hippocampal perfusion in mild Alzheimer’s disease. Psychiatry Res. 2000, 100, 65–74. [Google Scholar] [CrossRef]
  28. Burton, E.J.; Karas, G.; Paling, S.M.; Barber, R.; Williams, E.D.; Ballard, C.G.; McKeith, I.G.; Scheltens, P.; Barkhof, F.; O’Brien, J.T. Patterns of cerebral atrophy in dementia with Lewy bodies using voxel-based morphometry. NeuroImage 2002, 17, 618–630. [Google Scholar] [CrossRef]
  29. Mak, E.; Su, L.; Williams, G.B.; O’Brien, J.T. Neuroimaging characteristics of dementia with Lewy bodies. Alzheimers Res. Ther. 2014, 6, 18. [Google Scholar] [CrossRef] [Green Version]
  30. Harris, R.J.; Cloughesy, T.F.; Hardy, A.J.; Liau, L.M.; Pope, W.B.; Nghiemphu, P.L.; Lai, A.; Ellingson, B.M. MRI perfusion measurements calculated using advanced deconvolution techniques predict survival in recurrent glioblastoma treated with bevacizumab. J. Neuro Oncol. 2015, 122, 497–505. [Google Scholar] [CrossRef]
  31. Alvarez-Linera, J. 3T MRI: Advances in brain imaging. Eur. J. Radiol. 2008, 67, 415–426. [Google Scholar] [CrossRef] [PubMed]
  32. Erickson, M.A.; Banks, W.A. Blood-brain barrier dysfunction as a cause and consequence of Alzheimer’s disease. J. Cereb. Blood Flow Metab. 2013, 33, 1500–1513. [Google Scholar] [CrossRef] [PubMed] [Green Version]
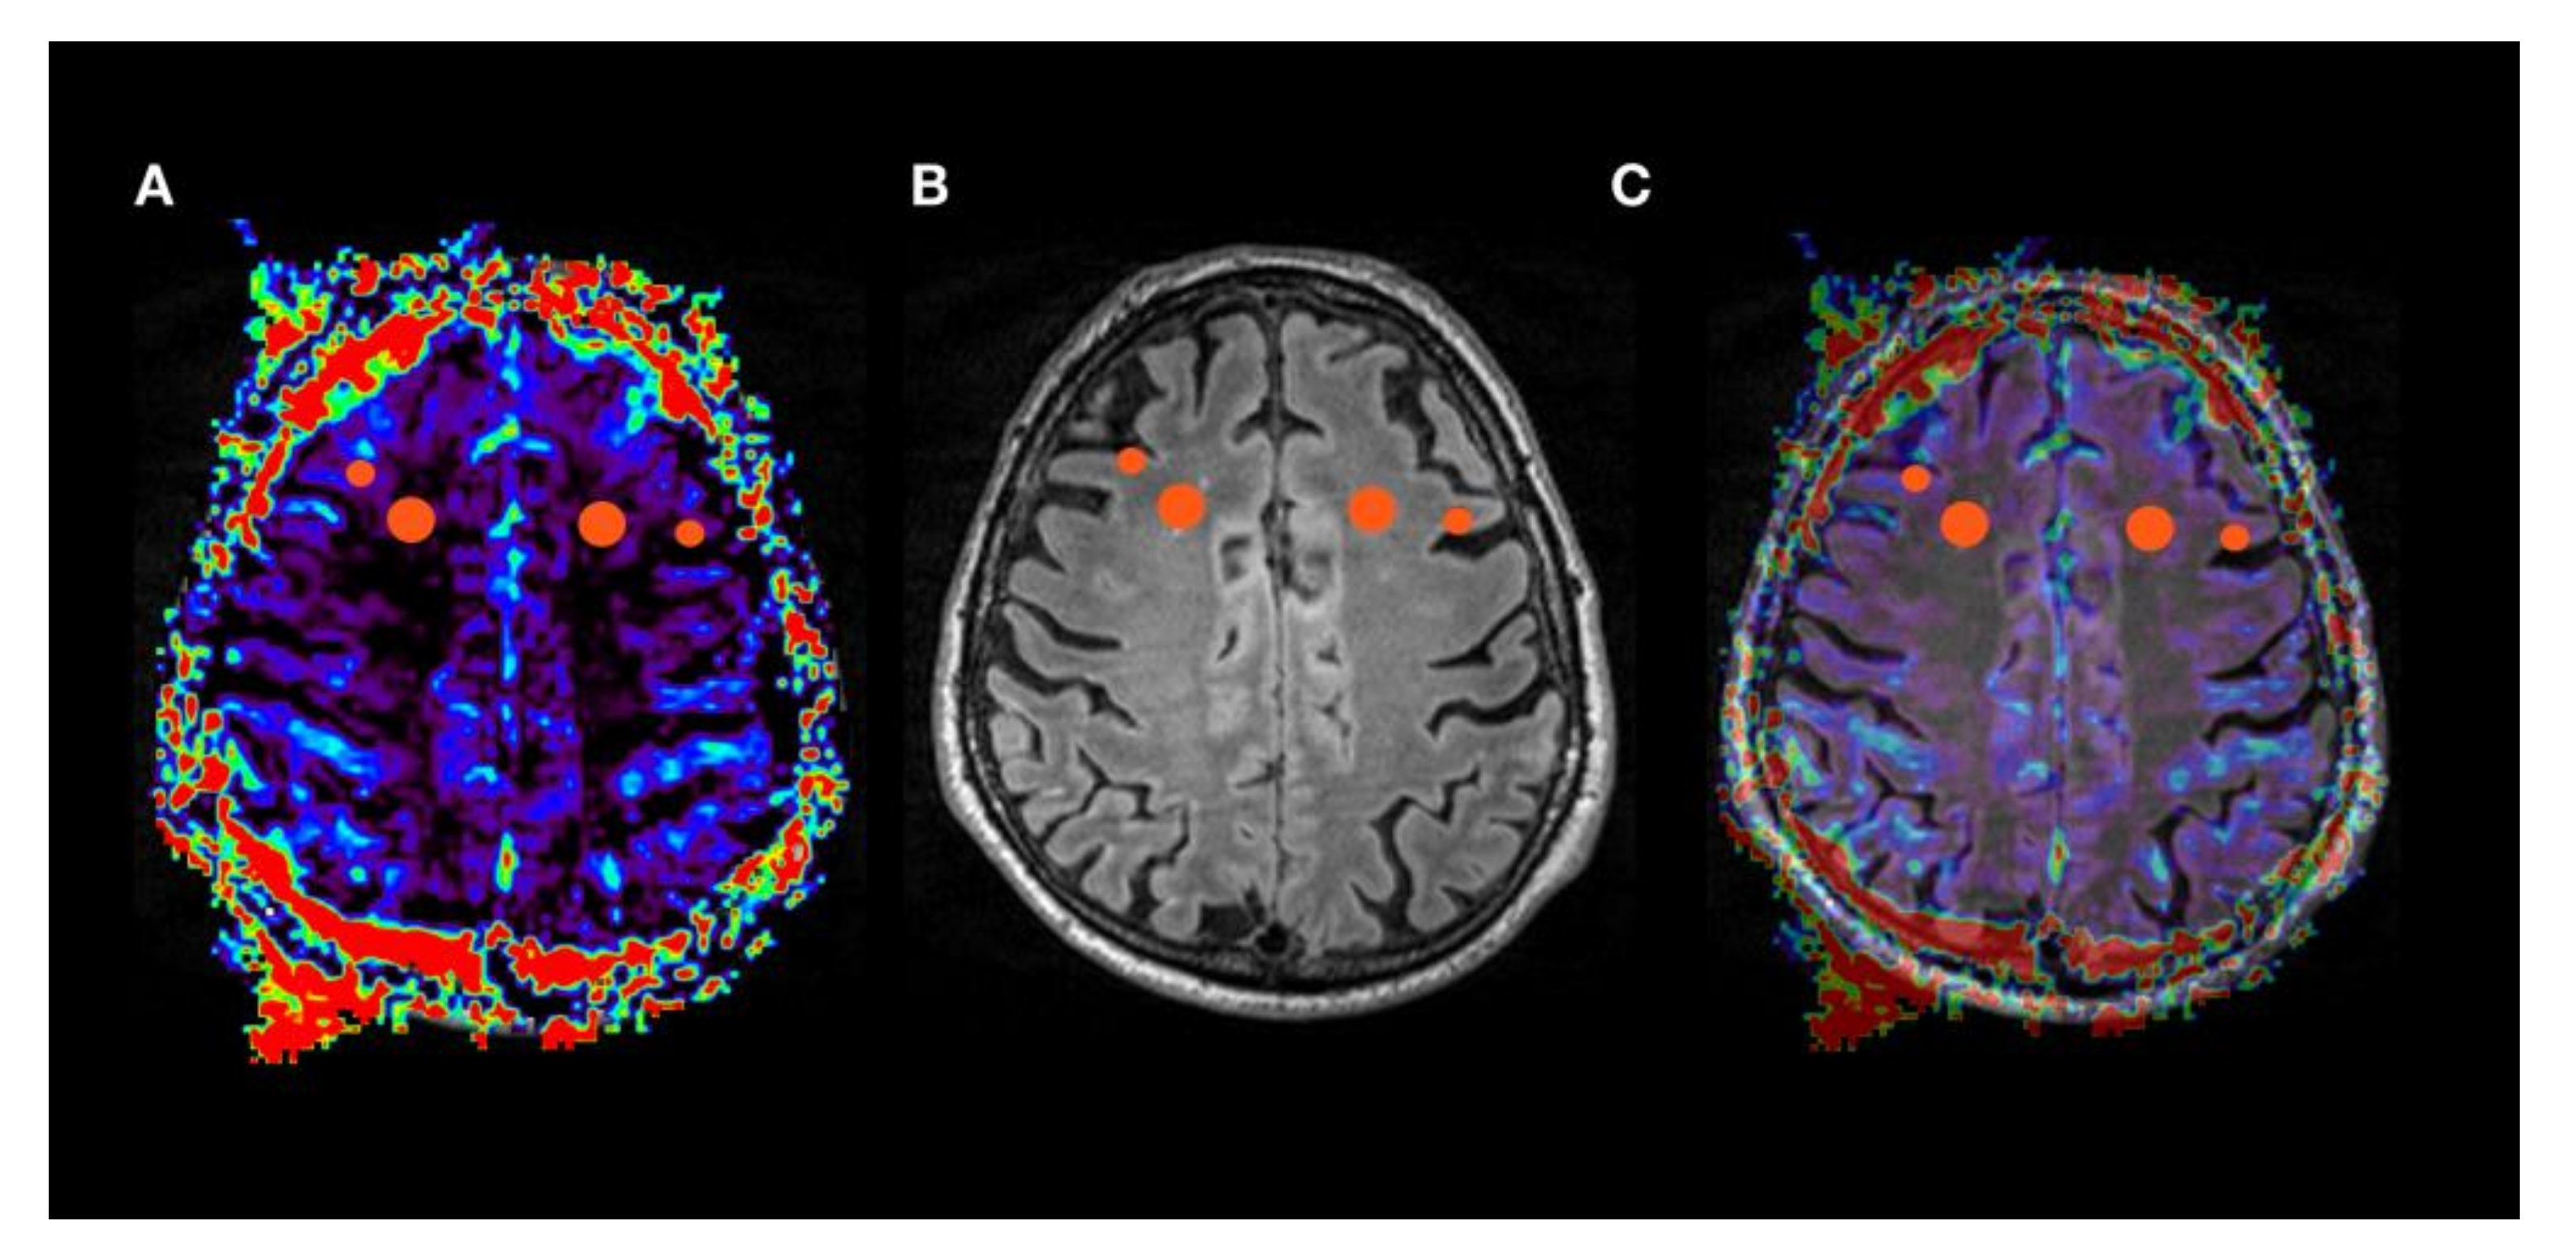
Figure 1. ROIs in rBV (relative cerebral blood volume) map (oSVD - oscillation-index standard truncated singular value decomposition). Circular ROIs were placed in cortex and white matter in frontal lobe (AC), as well as in parietal and temporal lobe and in hippocampus in the respective hemodynamic parameter maps rBV (A), rBVc (relative cerebral blood volume corrected), rBF (relative cerebral blood flow) and MTT (mean transit time) both for oSVD and Bayesian deconvolution. Data sets were coregistered with an anatomical dataset (B, T2 SPACE) and fused (C) for correct placement of ROIs.
Jcm 09 01800 g001
Figure 2. Ratios of white matter/cortical perfusion of the frontal ROIs for both (A) oSVD and (B) Bayesian deconvolution models in patients with suspected dementia compared to healthy controls. Increased ratio in dementia indicates relative cortical hypoperfusion. Significant results (p < 0.05) are marked with *, values that remained significant after correction for age and sex are marked with **.
Jcm 09 01800 g002
Figure 3. Female with Alzheimer’s disease, 54 y, Mini-Mental-Status-Test score 10. DSC Perfusion (A, axial orientation; D, coronal orientation rCBVc map) shows typical pattern of frontotemporal and parietal cortical hypoperfusion. Correlation with HMPAO-SPECT. (B,E) and anatomical datasets with widening of the temporal horns and apico-frontal cisterns as signs of atrophy (T1w in C, T2 SPACE in F).
Jcm 09 01800 g003
Figure 4. Male with FTD, 69 y, Mini-Mental-Status-Test score 30. DSC Perfusion (A, axial orientation; D, sagittal orientation rCBVc map) shows typical pattern of frontal cortical hypoperfusion. Correlation with HMPAO-SPECT (B,E) and the anatomical dataset with ventricular widening as sign of atrophy (T1w in C and F).
Jcm 09 01800 g004
Figure 5. Male with DLB, 60 y, Mini-Mental-Status-Test score 30. DSC Perfusion (A, axial orientation rCBVc) shows typical pattern of parieto-occipital cortical hypoperfusion. Correlation with HMPAO-SPECT (B) and the anatomical dataset with widening of the parieto-occipital subarachnoid spaces as sign of atrophy (C, T2 SPACE).
Jcm 09 01800 g005
Figure 6. Optimal cut-off points for the ratio of cortical/white matter perfusion in the left frontal lobe for calculated hemodynamic parameter maps for oSVD and BAY deconvolution. rBVc ratio cut off = 0.36 marked red; greater values “predict” hypoperfusion in SPECT with a sensitivity of 83% and specificity of 80%. Significant results (p < 0.05) are marked with *.
Jcm 09 01800 g006
Table 1. Patients’ clinical characteristics.
Patient NoAgeGenderSuspected DiagnosisMMST
169fFTD27
257mFTD27
350mAD27
479fFTD23
555mMCI30
683mFTD19
770fFTD29
878fDLB20
953mCBD24
1063mMCI29
1154fAD10
1273fDLB28
1378fMCI25
1458fMCI28
1562fFTD14
1669mFTD30
1768mAD26
1877mAD27
1956mMCI28
2058mMCI29
2173fVD27
2274fMCI27
2360mAD30
2469mVD28
2554mMCI26
2663mMCI26
2769fAD22
f = female, m = male, FTD = frontotemporal dementia, AD = Alzheimer’s disease, MCI = mild cognitive impairment, DLB = dementia with Lewy bodies, CBD = cortico-basal degeneration, VD = vascular dementia; MMST = mini-mental status test score.
Table 2. Coordinates of the chosen frontal, parietal and temporal ROIs (regions of interest) in MNI (Montreal Neurological Institute) space.
MNI
Cortex
MNI
White Matter
XYZXYZ
left frontal−36253−12751
left parietal−28−6841−19−5341
left temporal−53−7−22−42−1−22
right frontal24115317653
right parietal28−684119−5341
right temporal53−7−2242−1−22
Table 3. Ratios of white matter/cortex perfusion values of relative cerebral blood volume (rBV), relative cerebral blood volume corrected for leakage (rBVc), relative cerebral blood flow (rBF) and the value of the cortical ROI of mean transit time (MTT) [ms].
oSVDPatientsControls
rBVrBVcrBFMTT [ms]rBVrBVcrBFMTT [ms]
left frontal0.43 * ± 0.240.37 ** ± 0.170.34 * ± 0.24720 ± 14300.32 ± 0.080.27 ± 0.060.25 ± 0.064930 ± 870
right frontal0.42 * ± 0.240.40 ± 0.210.37 ± 0.184860 ±15200.31 ± 0.10.29 ± 0.080.26 ± 0.084920 ± 850
left parietal0.41 ± 0.180.41 ± 0.20.40 ± 0.2 5990 ± 37100.44 ± 0.140.37 ± 0.120.36 ± 0.134760 ± 750
right parietal0.52 ± 0.250.44 ± 0.280.44 ± 0.255190 ± 22800.43 ± 0.130.35 ± 0.10.35 ± 0.15050 ± 770
left temporal0.58 ± 0.260.49 ± 0.170.51 ± 0.154810 ± 19300.49 ± 0.140.46 ± 0.10.46 ± 0.124880 ± 940
right temporal0.47 ± 0.210.43 ± 0.160.44 ± 0.145540 ± 25200.43 ± 0.170.42 ± 0.120.39 ± 0.125000 ± 1050
Bayesianpatientscontrols
left frontal0.43 * ± 0.240.36* ± 0.180.29 * ± 0.193300 ± 13200.33 ± 0.090.27 ± 0.060.20 ± 0.083290 ± 1680
right frontal0.42 * ± 0.220.40 ± 0.310.30 ± 0.153940 ± 31500.31 ± 0.10.29 ± 0.080.21 ± 0.073370 ± 1240
left parietal0.42 ± 0.170.40 ± 0.20.33 ± 0.184990 ± 40700.44 ± 0.150.37 ± 0.120.26 ± 0.083080 ± 920
right parietal0.52 ± 0.240.44 ± 0.280.39 ± 0.313690 ± 19800.43 ± 0.130.35 ± 0.10.26 ± 0.063320 ± 910
left temporal0.50 ± 0.210.48 ± 0.180.44 ± 0.23840 ± 18900.49 ± 0.150.46 ± 0.10.40 ± 0.153650 ± 1080
right temporal0.52 ± 0.20.42 ± 0.160.39 ± 0.174440 ± 24500.43 ± 0.170.42 ± 0.10.36 ± 0.134250 ± 3060
Patients vs. controls, values given as mean ± standard deviation, significant results (p < 0.05) are marked with an *. Values that remained significant after correction for age and sex are marked with **.
Table 4. Cut-off ratios of white matter/cortex perfusion values of relative cerebral blood volume (rBV), relative cerebral blood volume corrected for leakage (rBVc), relative cerebral blood flow (rBF) and mean transit time (MTT) calculated by ROC analysis.
oSVDBayesian
rBVrBVcrBFMTTrBVrBVcrBFMTT
left frontal
Cut off ratio 0.40.360.291.180.410.360.211.39
Sensitivity83%83%83%83%83%83%83%67%
specificity75%80%65%55%75%80%45%60%
AUC0.908 *0.833 *0.825 *0.6500.917 *0.833 *0.7080.567
right frontal
Cut off ratio 0.330.30.271.180.330.300.210.92
Sensitivity60%60%60%80%60%60%60%60%
specificity42.9%43%47.6%47.6%42.9%42.9%47.6%14.4%
AUC0.6670.6570.6670.5140.6670.6570.5430.581
left parietal
Cut off0.660.910.87-0.660.910.77-
Sensitivity50%50%50%-50%50%50%-
specificity95.8%100%100%-58%100%100%-
AUC0.4790.5210.54200.4790.5210.6880.021
right parietal
Cut off ratio 0.650.970.91-0.670.970.83-
Sensitivity66.7%66.7%66.7%-66.7%66.7%66.7%-
specificity82.6%100%100%-87%%100%100%-
AUC0.6090.6670.6670.2030.6090.6810.7390.072
left temporal
Cut off ratio 0.730.550.851.030.770.550.421.47
Sensitivity50%50%25%75%50%50%75%75%
specificity77.3%72.7%100%50%77.3%72.7%59.1%54.5%
AUC0.5910.5450.4660.5680.6020.5570.6250.602
right temporal
Cut off ratio 0.470.430.451.030.470.430.351.4
Sensitivity75%75%75%75%100%75%75%50%
specificity50%59.1%63.6%36.4%45.5%59.1%54.5%63.6%
AUC0.6590.5910.7160.4660.6250.6020.6480.432
AUC = area under the curve, significant results (p < 0.05) are marked with *.