Inspiratory Muscle Training in Patients with Heart Failure

 ,
,  , and
, and
Abstract
1. Introduction
2. Methods
2.1. Study Design
2.2. Search Strategy
2.3. Selection Criteria
2.4. Data Extraction
3. Results and Discussion
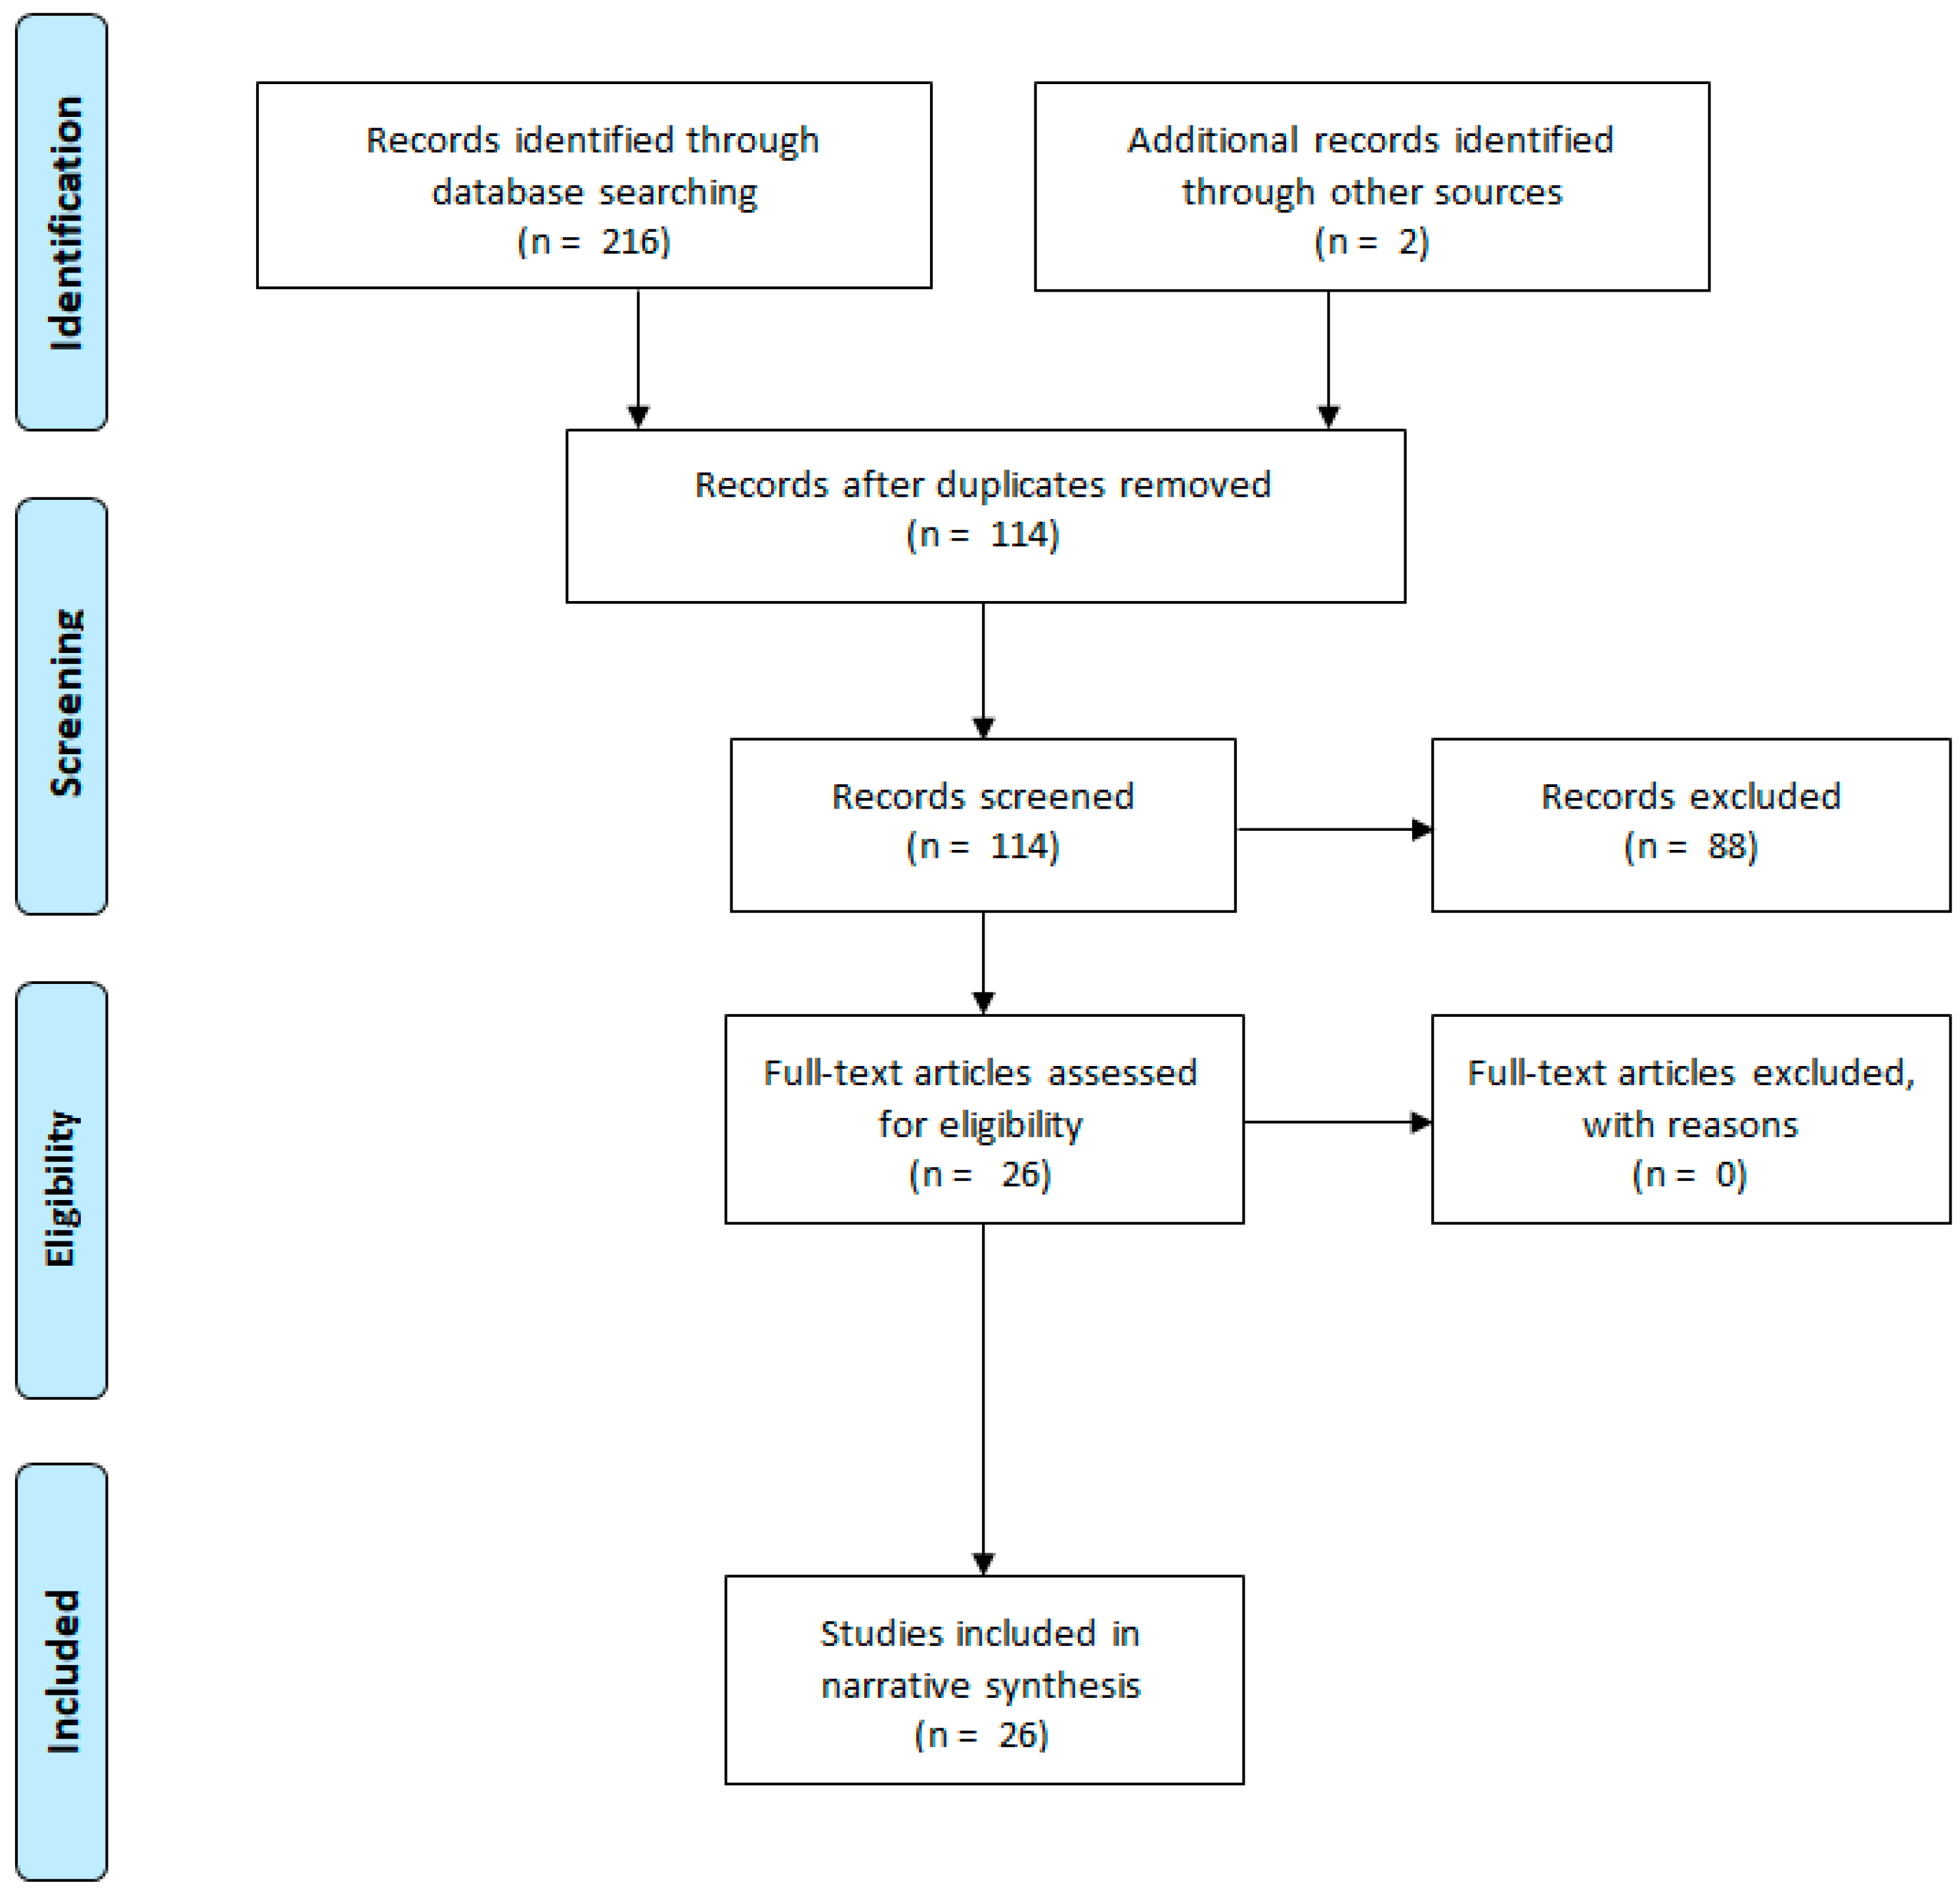
3.1. Flow Diagram
3.2. Inspiratory Muscle Training
3.2.1. IMT Effects on Respiratory Muscle Performance and Lung Function
3.2.2. Dyspnea
3.2.3. Exercise and Functional Capacity
3.2.4. Metaboreflex Activity
3.2.5. Peak VO2
3.2.6. VE/VCO2
3.2.7. Cardiovascular Parameters
3.2.8. Biomarkers
3.2.9. Quality of Life
3.3. Limitations and Future Studies
4. Conclusions
Supplementary Materials
Author Contributions
Funding
Conflicts of Interest
References
- Chaudhry, S.P.; Stewart, G.C. Advanced Heart Failure: Prevalence, Natural History and Prognosis. Heart Fail. Clin. 2016, 12, 323–333. [Google Scholar] [CrossRef] [PubMed]
- Tanai, E.; Frantz, S. Pathophysiology of Heart Failure. In Comprehensive Physiology; John Wiley & Sons, Inc.: Hoboken, NJ, USA, 2015; Volume 6, pp. 187–214. ISBN 9780470650714. [Google Scholar]
- Dickstein, K.; Cohen-Solal, A.; Filippatos, G.; McMurray, J.J.V.; Ponikowski, P.; Poole-Wilson, P.A.; Strömberg, A.; Van Veldhuisen, D.J.; Atar, D.; Hoes, A.W.; et al. ESC Guidelines for the diagnosis and treatment of acute and chronic heart failure 2008. Eur. Heart J. 2008, 29, 2388–2442. [Google Scholar] [PubMed]
- Lloyd-Jones, D.; Adams, R.J.; Brown, T.M.; Carnethon, M.; Dai, S.; De Simone, G.; Ferguson, T.B.; Ford, E.; Furie, K.; Gillespie, C.; et al. Executive summary: Heart disease and stroke statistics—2010 update: A report from the american heart association. Circulation 2010, 121, 948–954. [Google Scholar] [PubMed]
- Fisher, J.D. New York Heart Association Classification. Arch. Intern. Med. 1972, 129, 836. [Google Scholar] [CrossRef]
- Lalande, S.; Cross, T.J.; Keller-Ross, M.L.; Morris, N.R.; Johnson, B.D.; Taylor, B.J. Exercise Intolerance in Heart Failure: Central Role for the Pulmonary System. Exerc. Sport Sci. Rev. 2020, 48, 11–19. [Google Scholar] [CrossRef]
- Nakagawa, N.K.; Diz, M.A.; Kawauchi, T.S.; de Andrade, G.N.; Umeda, I.I.K.; Murakami, F.M.; Oliveira-Maul, J.P.; Nascimento, J.A.; Nunes, N.; Takada, J.Y.; et al. Risk Factors for Inspiratory Muscle Weakness in Chronic Heart Failure. Respir. Care 2020, 65, 507–516. [Google Scholar] [CrossRef]
- Clark, A.L.; Poole-Wilson, P.A.; Coats, A.J.S. Exercise limitation in chronic heart failure: Central role of the periphery. J. Am. Coll. Cardiol. 1996, 28, 1092–1102. [Google Scholar] [CrossRef]
- Hammond, M.D.; Bauer, K.A.; Sharp, J.T.; Rocha, R.D. Respiratory muscle strength in congestive heart failure. Chest 1990, 98, 1091–1094. [Google Scholar] [CrossRef]
- Walsh, J.T.; Andrews, R.; Johnson, P.; Phillips, L.; Cowley, A.J.; Kinnear, W.J.M. Inspiratory muscle endurance in patients with chronic heart failure. Heart 1996, 76, 332–336. [Google Scholar] [CrossRef]
- Laoutaris, I.D. The ‘aerobic/resistance/inspiratory muscle training hypothesis in heart failure’. Eur. J. Prev. Cardiol. 2018, 25, 1257–1262. [Google Scholar] [CrossRef]
- Mancini, D.M.; Henson, D.; Lamanca, J.; Levine, S. Evidence of reduced respiratory muscle endurance in patients with heart failure. J. Am. Coll. Cardiol. 1994, 24, 972–981. [Google Scholar] [CrossRef]
- Nilsson Jr., K.; Duscha, B.; Hranitzky, P.; Kraus, W. Chronic Heart Failure and Exercise Intolerance: The Hemodynamic Paradox. Curr. Cardiol. Rev. 2008, 4, 92–100. [Google Scholar] [CrossRef]
- Clark, A.L. Origin of symptoms in chronic heart failure. Heart 2006, 92, 12–16. [Google Scholar] [CrossRef] [PubMed]
- Boushel, R. Muscle metaboreflex control of the circulation during exercise. Acta Physiol. 2010, 199, 367–383. [Google Scholar] [CrossRef] [PubMed]
- Katayama, K.; Saito, M. Muscle sympathetic nerve activity during exercise. J. Physiol. Sci. 2019, 69, 589–598. [Google Scholar] [CrossRef] [PubMed]
- Vissing, J.; Vissing, S.F.; MacLean, D.A.; Saltin, B.; Quistorff, B.; Haller, R.G. Sympathetic activation in exercise is not dependent on muscle acidosis: Direct evidence from studies in metabolic myopathies. J. Clin. Invest. 1998, 101, 1654–1660. [Google Scholar] [CrossRef]
- Fisher, J.P.; Young, C.N.; Fadel, P.J. Autonomic adjustments to exercise in humans. Compr. Physiol. 2015, 5, 475–512. [Google Scholar]
- Romer, L.M.; Polkey, M.I. Exercise-induced respiratory muscle fatigue: Implications for performance. J. Appl. Physiol. 2008, 104, 879–888. [Google Scholar] [CrossRef]
- Moreno, A.M.; Toledo-Arruda, A.C.; Lima, J.S.; Duarte, C.S.; Villacorta, H.; Nóbrega, A.C.L. Inspiratory Muscle Training Improves Intercostal and Forearm Muscle Oxygenation in Patients With Chronic Heart Failure: Evidence of the Origin of the Respiratory Metaboreflex. J. Card. Fail. 2017, 23, 672–679. [Google Scholar] [CrossRef]
- Yamada, K.; Kinugasa, Y.; Sota, T.; Miyagi, M.; Sugihara, S.; Kato, M.; Yamamoto, K. Inspiratory Muscle Weakness is Associated with Exercise Intolerance in Patients with Heart Failure with Preserved Ejection Fraction: A Preliminary Study. J. Card. Fail. 2016, 22, 38–47. [Google Scholar] [CrossRef]
- Ribeiro, J.P.; Chiappa, G.R.; Callegaro, C.C. The contribution of inspiratory muscles function to exercise limitation in heart failure: Pathophysiological mechanisms. Rev. Bras. Fisioter. 2012, 16, 261–268. [Google Scholar] [CrossRef] [PubMed]
- Taylor, B.J.; Bowen, T.S. Respiratory Muscle Weakness in Patients with Heart Failure: Time to Make It a Standard Clinical Marker and a Need for Novel Therapeutic Interventions? J. Card. Fail. 2018, 24, 217–218. [Google Scholar] [CrossRef] [PubMed]
- Ribeiro, J.P.; Chiappa, G.R.; Neder, A.J.; Frankenstein, L. Respiratory muscle function and exercise intolerance in heart failure. Curr. Heart Fail. Rep. 2009, 6, 95–101. [Google Scholar] [CrossRef] [PubMed]
- Guazzi, M. Alveolar Gas Diffusion Abnormalities in Heart Failure. J. Card. Fail. 2008, 14, 695–702. [Google Scholar] [CrossRef]
- Meyer, F.J.; Zugck, C.; Haass, M.; Otterspoor, L.; Strasser, R.H.; Kubler, W.; Borst, M.M. Inefficient ventilation and reduced respiratory muscle capacity in congestive heart failure. Basic Res. Cardiol. 2000, 95, 333–342. [Google Scholar] [CrossRef]
- Cahalin, L.P.; Arena, R.; Guazzi, M.; Myers, J.; Cipriano, G.; Chiappa, G.; Lavie, C.J.; Forman, D.E. Inspiratory muscle training in heart disease and heart failure: A review of the literature with a focus on method of training and outcomes. Expert Rev. Cardiovasc. Ther. 2013, 11, 161–177. [Google Scholar] [CrossRef]
- Ross Arena; Marco Guazzi; Jonathan Myers Ventilatory Abnormalities During Exercise in Heart Failure: A Mini Review. Curr. Respir. Med. Rev. 2007, 3, 179–187. [CrossRef]
- Wasserman, K.; Zhang, Y.Y.; Gitt, A.; Belardinelli, R.; Koike, A.; Lubarsky, L.; Agostoni, P.G. Lung function and exercise gas exchange in chronic heart failure. Circulation 1997, 96, 2221–2227. [Google Scholar] [CrossRef]
- Dall’Ago, P.; Chiappa, G.R.S.; Guths, H.; Stein, R.; Ribeiro, J.P. Inspiratory muscle training in patients with heart failure and inspiratory muscle weakness: A randomized trial. J. Am. Coll. Cardiol. 2006, 47, 757–763. [Google Scholar] [CrossRef]
- Padula, C.A.; Yeaw, E.; Mistry, S. A home-based nurse-coached inspiratory muscle training intervention in heart failure. Appl. Nurs. Res. 2009, 22, 18–25. [Google Scholar] [CrossRef]
- Meyer, F.J.; Borst, M.M.; Zugck, C.; Kirschke, A.; Schellberg, D.; Kübler, W.; Haass, M. Respiratory muscle dysfunction in congestive heart failure: Clinical correlation and prognostic significance. Circulation 2001, 103, 2153–2158. [Google Scholar] [CrossRef] [PubMed]
- Montemezzo, D.; Fregonezi, G.A.; Pereira, D.A.; Britto, R.R.; Reid, W.D. Influence of inspiratory muscle weakness on inspiratory muscle training responses in chronic heart failure patients: A systematic review and meta-analysis. Arch. Phys. Med. Rehabil. 2014, 95, 1398–1407. [Google Scholar] [CrossRef] [PubMed]
- Plentz, R.D.M.; Sbruzzi, G.; Ribeiro, R.A.; Ferreira, J.B.; Dal Lago, P. Inspiratory muscle training in patients with heart failure: Meta-analysis of randomized trials. Arq. Bras. Cardiol. 2012, 99, 762–771. [Google Scholar] [CrossRef] [PubMed]
- Weiner, P.; Waizman, J.; Magadle, R.; Berar-Yanay, N.; Pelled, B. The effect of specific inspiratory muscle training on the sensation of dyspnea and exercise tolerance in patients with congestive heart failure. Clin. Cardiol. 1999, 22, 727–732. [Google Scholar] [CrossRef] [PubMed]
- Hamazaki, N.; Masuda, T.; Kamiya, K.; Matsuzawa, R.; Nozaki, K.; Maekawa, E.; Noda, C.; Yamaoka-Tojo, M.; Ako, J. Respiratory muscle weakness increases dead-space ventilation ratio aggravating ventilation–perfusion mismatch during exercise in patients with chronic heart failure. Respirology 2019, 24, 154–161. [Google Scholar] [CrossRef]
- McParland, C.; Krishnan, B.; Wang, Y.; Gallagher, C.G. Inspiratory muscle weakness and dyspnea in chronic heart failure. Am. Rev. Respir. Dis. 1992, 146, 467–472. [Google Scholar] [CrossRef] [PubMed]
- Tikunov, B.; Levine, S.; Mancini, D. Chronic congestive heart failure elicits adaptations of endurance exercise in diaphragmatic muscle. Circulation 1997, 95, 910–916. [Google Scholar] [CrossRef]
- Hart, N.; Kearney, M.T.; Pride, N.B.; Green, M.; Lofaso, F.; Shah, A.M.; Moxham, J.; Polkey, M.I. Inspiratory muscle load and capacity in chronic heart Failure. Thorax 2004, 59, 477–482. [Google Scholar] [CrossRef]
- Giallauria, F.; Piccioli, L.; Vitale, G.; Sarullo, F.M. Exercise training in patients with chronic heart failure: A new challenge for cardiac rehabilitation community. Monaldi Arch. Chest Dis. 2018, 88, 38–44. [Google Scholar] [CrossRef]
- Cahalin, L.P.; Arena, R.A. Breathing exercises and inspiratory muscle training in heart failure. Heart Fail. Clin. 2015, 11, 149–172. [Google Scholar] [CrossRef]
- Reis, M.S.; Arena, R.; Archiza, B.; De Toledo, C.F.; Catai, A.M.; Borghi-Silva, A. Deep breathing heart rate variability is associated with inspiratory muscle weakness in chronic heart failure. Physiother. Res. Int. 2014, 19, 16–24. [Google Scholar] [CrossRef] [PubMed]
- Freeman, A.M.; Taub, P.R.; Lo, H.C.; Ornish, D. Intensive Cardiac Rehabilitation: An Underutilized Resource. Curr. Cardiol. Rep. 2019, 21, 19. [Google Scholar] [CrossRef] [PubMed]
- Smart, N.A.; Giallauria, F.; Dieberg, G. Efficacy of inspiratory muscle training in chronic heart failure patients: A systematic review and meta-analysis. Int. J. Cardiol. 2013, 167, 1502–1507. [Google Scholar] [CrossRef] [PubMed]
- Moher, D.; Liberati, A.; Tetzlaff, J.; Altman, D.G. Preferred reporting items for systematic reviews and meta-analyses: The PRISMA statement. Int. J. Surg. 2010, 8, 336–341. [Google Scholar] [CrossRef]
- Wong, E.; Selig, S.; Hare, D.L. Respiratory muscle dysfunction and training in chronic heart failure. Heart Lung Circ. 2011, 20, 289–294. [Google Scholar] [CrossRef]
- Lin, S.-J.; McElfresh, J.; Hall, B.; Bloom, R.; Farrell, K. Inspiratory Muscle Training in Patients with Heart Failure: A Systematic Review. Cardiopulm. Phys. Ther. J. 2012, 23, 29–36. [Google Scholar] [CrossRef]
- Chiappa, G.R.; Roseguini, B.T.; Vieira, P.J.C.; Alves, C.N.; Tavares, A.; Winkelmann, E.R.; Ferlin, E.L.; Stein, R.; Ribeiro, J.P. Inspiratory Muscle Training Improves Blood Flow to Resting and Exercising Limbs in Patients With Chronic Heart Failure. J. Am. Coll. Cardiol. 2008, 51, 1663–1671. [Google Scholar] [CrossRef]
- Stein, R.; Chiappa, G.R.; Güths, H.; Dall’Ago, P.; Ribeiro, J.P. Inspiratory muscle training improves oxygen uptake efficiency slope in patients with chronic heart failure. J. Cardiopulm. Rehabil. Prev. 2009, 29, 392–395. [Google Scholar] [CrossRef]
- Winkelmann, E.R.; Chiappa, G.R.; Lima, C.O.C.; Viecili, P.R.N.; Stein, R.; Ribeiro, J.P. Addition of inspiratory muscle training to aerobic training improves cardiorespiratory responses to exercise in patients with heart failure and inspiratory muscle weakness. Am. Heart J. 2009, 158, 768.e1–768.e7. [Google Scholar] [CrossRef]
- Bosnak-Guclu, M.; Arikan, H.; Savci, S.; Inal-Ince, D.; Tulumen, E.; Aytemir, K.; Tokgözoglu, L. Effects of inspiratory muscle training in patients with heart failure. Respir. Med. 2011, 105, 1671–1681. [Google Scholar] [CrossRef]
- Laoutaris, I.D.; Adamopoulos, S.; Manginas, A.; Panagiotakos, D.B.; Kallistratos, M.S.; Doulaptsis, C.; Kouloubinis, A.; Voudris, V.; Pavlides, G.; Cokkinos, D.V.; et al. Benefits of combined aerobic/resistance/inspiratory training in patients with chronic heart failure. A complete exercise model? A prospective randomised study. Int. J. Cardiol. 2013, 167, 1967–1972. [Google Scholar] [CrossRef] [PubMed]
- Adamopoulos, S.; Schmid, J.P.; Dendale, P.; Poerschke, D.; Hansen, D.; Dritsas, A.; Kouloubinis, A.; Alders, T.; Gkouziouta, A.; Reyckers, I.; et al. Combined aerobic/inspiratory muscle training vs. aerobic training in patients with chronic heart failure: The Vent-HeFT trial: A European prospective multicentre randomized trial. Eur. J. Heart Fail. 2014, 16, 574–582. [Google Scholar] [CrossRef] [PubMed]
- Marco, E.; Ramírez-Sarmiento, A.L.; Coloma, A.; Sartor, M.; Comin-Colet, J.; Vila, J.; Enjuanes, C.; Bruguera, J.; Escalada, F.; Gea, J.; et al. High-intensity vs. sham inspiratory muscle training in patients with chronic heart failure: A prospective randomized trial. Eur. J. Heart Fail. 2013, 15, 892–901. [Google Scholar] [CrossRef]
- Mello, P.R.; Guerra, G.M.; Borile, S.; Rondon, M.U.; Alves, M.J.; Negrão, C.E.; Dal Lago, P.; Mostarda, C.; Irigoyen, M.C.; Consolim-Colombo, F.M. Inspiratory muscle training reduces sympathetic nervous activity and improves inspiratory muscle weakness and quality of life in patients with chronic heart failure. J. Cardiopulm. Rehabil. Prev. 2012, 32, 255–261. [Google Scholar] [CrossRef] [PubMed]
- Palau, P.; Domínguez, E.; Núñez, E.; Schmid, J.P.; Vergara, P.; Ramón, J.M.; Mascarell, B.; Sanchis, J.; Chorro, F.J.; Núñez, J. Effects of inspiratory muscle training in patients with heart failure with preserved ejection fraction. Eur. J. Prev. Cardiol. 2014, 21, 1465–1473. [Google Scholar] [CrossRef]
- Palau, P.; Domínguez, E.; López, L.; Ramón, J.M.; Heredia, R.; González, J.; Santas, E.; Bodí, V.; Miñana, G.; Valero, E.; et al. Inspiratory Muscle Training and Functional Electrical Stimulation for Treatment of Heart Failure With Preserved Ejection Fraction: The TRAINING-HF Trial. Rev. Española Cardiol. 2019, 72, 288–297. [Google Scholar] [CrossRef]
- Palau, P.; Domínguez, E.; Ramón, J.M.; López, L.; Briatore, A.E.; Tormo, J.P.; Ventura, B.; Chorro, F.J.; Núñez, J. Home-based inspiratory muscle training for management of older patients with heart failure with preserved ejection fraction: Does baseline inspiratory muscle pressure matter? Eur. J. Cardiovasc. Nurs. 2019, 18, 621–627. [Google Scholar] [CrossRef]
- Taya, M.; Amiya, E.; Hatano, M.; Maki, H.; Hosoya, Y.; Ishida, J.; Bujo, C.; Tsuji, M.; Konishi, Y.; Yokota, K.; et al. Inspiratory muscle training for advanced heart failure with lamin-related muscular dystrophy. J. Cardiol. Cases 2019, 20, 232–234. [Google Scholar] [CrossRef]
- Kawauchi, T.S.; Umeda, I.I.K.; Braga, L.M.; Mansur, A. de P.; Rossi-Neto, J.M.; Guerra de Moraes Rego Sousa, A.; Hirata, M.H.; Cahalin, L.P.; Nakagawa, N.K. Is there any benefit using low-intensity inspiratory and peripheral muscle training in heart failure? A randomized clinical trial. Clin. Res. Cardiol. 2017, 106, 676–685. [Google Scholar] [CrossRef]
- Hossein Pour, A.H.; Gholami, M.; Saki, M.; Birjandi, M. The effect of inspiratory muscle training on fatigue and dyspnea in patients with heart failure: A randomized, controlled trial. Jpn. J. Nurs. Sci. 2019. [Google Scholar] [CrossRef]
- Hornikx, M.; Buys, R.; Cornelissen, V.; Deroma, M.; Goetschalckx, K. Effectiveness of high intensity interval training supplemented with peripheral and inspiratory resistance training in chronic heart failure: A pilot study. Acta Cardiol. 2019. [Google Scholar] [CrossRef] [PubMed]
- Martínez, A.; Lisboa, C.; Jalil, J.; Muñoz, V.; Díaz, O.; Casanegra, P.; Corbalán, R.; Vásquez, A.M.; Leiva, A. [Selective training of respiratory muscles in patients with chronic heart failure]. Rev. Med. Chil. 2001, 129, 133–139. [Google Scholar] [PubMed]
- Mancini, D.M.; Henson, D.; La Manca, J.; Donchez, L.; Levine, S. Benefit of selective respiratory muscle training on exercise capacity in patients with chronic congestive heart failure. Circulation 1995, 91, 320–329. [Google Scholar] [CrossRef] [PubMed]
- Cahalin, L.P.; Semigran, M.J.; Dec, G.W. Inspiratory muscle training in patients with chronic heart failure awaiting cardiac transplantation: Results of a pilot clinical trial. Phys. Ther. 1997, 77, 830–838. [Google Scholar] [CrossRef] [PubMed]
- Johnson, P. A randomized controlled trial of inspiratory muscle training in stable chronic heart failure. Eur. Heart J. 1998, 19, 1249–1253. [Google Scholar] [CrossRef] [PubMed]
- Laoutaris, I.; Dritsas, A.; Brown, M.D.; Manginas, A.; Alivizatos, P.A.; Cokkinos, D.V. Inspiratory muscle training using an incremental endurance test alleviates dyspnea and improves functional status in patients with chronic heart failure. Eur. J. Prev. Cardiol. 2004, 11, 489–496. [Google Scholar] [CrossRef]
- Laoutaris, I.D.; Dritsas, A.; Brown, M.D.; Manginas, A.; Kallistratos, M.S.; Degiannis, D.; Chaidaroglou, A.; Panagiotakos, D.B.; Alivizatos, P.A.; Cokkinos, D.V. Immune response to inspiratory muscle training in patients with chronic heart failure. Eur. J. Prev. Cardiol. 2007, 14, 679–686. [Google Scholar] [CrossRef]
- Laoutaris, I.D.; Dritsas, A.; Brown, M.D.; Manginas, A.; Kallistratos, M.S.; Chaidaroglou, A.; Degiannis, D.; Alivizatos, P.A.; Cokkinos, D.V. Effects of inspiratory muscle training on autonomic activity, endothelial vasodilator function, and N-terminal pro-brain natriuretic peptide levels in chronic heart failure. J. Cardiopulm. Rehabil. Prev. 2008, 28, 99–106. [Google Scholar] [CrossRef]
- Olson, T.P.; Joyner, M.J.; Dietz, N.M.; Eisenach, J.H.; Curry, T.B.; Johnson, B.D. Effects of respiratory muscle work on blood flow distribution during exercise in heart failure. J. Physiol. 2010, 588, 2487–2501. [Google Scholar] [CrossRef]
- Palau, P.; Domínguez, E.; Núñez, E.; Ramón, J.M.; López, L.; Melero, J.; Bellver, A.; Chorro, F.J.; Bodí, V.; Bayés-Genis, A.; et al. Inspiratory Muscle Function and Exercise Capacity in Patients With Heart Failure With Preserved Ejection Fraction. J. Card. Fail. 2017, 23, 480–484. [Google Scholar] [CrossRef]
- Llàcer, P.; Bayés-Genís, A.; Núñez, J. Carbohydrate antigen 125 in heart failure. New era in the monitoring and control of treatment. Med. Clin. 2019, 152, 266–273. [Google Scholar] [CrossRef] [PubMed]


| Year and Authors | Subjects Characteristics | Training Protocol |
|---|---|---|
| 1998. Johnson et al. [66] | Baseline sample n = 18 Final sample n= 16 M/W: 15/3 FEV1 (%): N/A NYHA (II/III): 12/6 | Duration: 8 weeks IMT with threshold device F: 7 ×/week. All sessions supervised |
| (1) IMT: baseline n = 9, final n = 8 Age (years): 70 ± 4.6 PImax (cmH2O): 70 ± 33 | (1) IMT: I: 30% PImax, weekly adjusted. T: 15 min, 2 ×/day | |
| (2) IMT control: baseline n = 9, final n = 8 Age (years): 63.4 ± 4.5 PImax(cmH2O): 84 ± 18 | (2) IMT control: I: 15% PImax initial, non-readjusted. T: 15 min, 2 ×/day | |
| 1999. Weiner et al. [35] | Baseline sample n = 20 Final sample n = 16 M/W: 18/2 NYHA: II-III | Duration: 12 weeks IMT with threshold device F: 6 ×/week. All sessions supervised T: 30 min for each session |
| (1) IMT n= 10 Age (years): 66.2 ± 4.6 FEV1 (%): 24.7 ± 1.6 NYHA: 2.3 ± 0.2 PImax (%): 46.5 ± 4.7 | (1) IMT: 1st month: I: Initial 15% to get up to 60% PImax gradually Adjusted weekly | |
| (2) IMT control (baseline n= 10, final n= 6) Age (years): 63.8 ± 4 FEV1 (%): 22.9 ± 2.4 NYHA: 2.4 ± 0.2 PImax (%): 50.7 ± 4.2 | (2) IMT control: Simulated training without resistance | |
| 2001. Martínez et al. [63] | Baseline sample n = 20 M/W: 16/4 | Duration: 6 weeks IMT with threshold device F: 6 ×/week. One weekly session supervised. T: 15 min. 2 ×/day. |
| (1) IMT n = 11 Age (years): 60 ± 14 FEV1 (%): 28.7 ± 11 NYHA (II/III): 5/6 PImax (cmH2O): 78 ± 22 | (1) IMT I: 30% PImax. PImax weekly adjusted | |
| (2) IMT control n = 9 Age (years): 57 ± 13 FEV1 (%): 27.1 ± 7 NYHA (II/III): 2/7 PImax (cmH2O): 72 ± 34 | (2) IMT control. I: minimum charge of the device equal to ±10% PImax | |
| 2004. Laoutaris et al. [67] | Baseline sample n = 37 Final sample n = 35 NYHA: II (19) y III (18) | Duration: 10 weeks IMT with resistive charge device F: 3 ×/week. All sessions supervised %SMIP readjusted for each session |
| (1) IMT: (n = 20) H/M: 18/2 Age (years): 57.6 ± 2.3 FEV1 (%): 23.4 ± 1.5 NYHA (II/III): 12/8 PImax (cmH2O): 82.8 ± 5.7 | (1) IMT: I: 60% SMIP, readjusted weekly T: 6 efforts for each level: Level 1: 60 s of rest for each 6 inspiratory efforts Level 2: 45 s of rest between series Level 3: 30 s of rest between series Level 4: 15 s of rest between series Level 5: 10 s of rest between series Level 6: 5 s of rest between series. After level 6, a rest of 5 s was maintained up to get respiratory fatigue | |
| (2) Control IMT: (baseline n = 17, final n = 15) M/W: 13/2. Age (years): 60 ± 2.6 FEV1 (%): 25.7 ± 2.1 NYHA (II/III): 7/8 PImax (cmH2O): 78.4 ± 6.9 | (2) Control by IMT: I: fixed at 15% SMIP T: completed 6 efforts for the 6 levels | |
| 2006. Dall’ago et al. [30] | Total sample n = 32 | Duration: 12 weeks. IMT with threshold device F: 7 ×/week. One weekly session supervised T: 30 min for each session |
| (1) IMT n = 16 M/W: 10/6 Age (years): 54 ± 3 FEV1 (%): 38 ± 3 NYHA: N/A PImax (cmH2O): 59.8 ± 2 | (1) IMT: IMT: 7 ×/week I: 30% PImax, readjusted for each week | |
| (2) Sham IMT n = 16 H/M: 11/5 Age (years): 58 ± 2 FEVI (%): 39 ± 3 NYHA: N/A PImax (cmH2O): 59.5 ± 2.2 | (2) Sham IMT: I: without charge | |
| 2007. Laoutaris et al. [68] | Total sample n = 38 | Duration: 10 weeks. IMT with resistive charge device. F: 3 ×/week. All sessions supervised Readjustment %SMIP foe each session |
| (1) High intensity IMT n = 15 M/W: 12/3 Age (years): 53 ± 2 FEV1 (%): 28 ± 1 NYHA (II/III) = 10/5 PImax (cmH2O): 79.8 ± 4.7 | (1) IMT: I: 60% SMIP, weekly readjusted T: 6 efforts for each level: Level 1: 60 s of rest for each 6 inspiratory efforts Level 2: 45 s of rest between series Level 3: 30 s of rest between series Level 4: 15 s of rest between series Level 5: 10 s of rest between series Level 6: 5 s of rest between series. After level 6, a rest of 5 s was maintained up to get respiratory fatigue | |
| (2) Low intensity IMT: n = 23 M/W: 20/3 Age (years): 59 ± 2 FEV1 (%): 28 ± 1 NYHA (II/III) = 12/11 PImax (cmH2O): 80.2 ± 5 | (2) Low intensity IMT: I: fixed at 15% SMIP T: completed 6 efforts in the 6 levels | |
| 2008. Laoutaris et al. [69] | Total sample n = 23 | Duration: 10 weeks IMT with resistive charge device F: 3 ×/week. All sessions supervised Readjustment of %SMIP foe each session. |
| (1) High intensity IMT n = 14 M/W: 11/3 Age (years): 53.4 ± 2.1 FEV1 (%): 28.9 ± 2.4 NYHA (II/III): 9/5 PImax (cmH2O): 78.5 ± 4.9 | (1) IMT: I: 60% SMIP, weekly readjusted T: 6 efforts for each level: Level 1: 60 s of rest for each 6 inspiratory efforts Level 2: 45 s of rest between series Level 3: 30 s of rest between series Level 4: 15 s of rest between series Level 5: 10 s of rest between series Level 6: 5 s of rest between series. After level 6, a rest of 5 s was maintained up to get respiratory fatigue | |
| (2) Low intensity IMT n = 9 M/W: 9/0 Age (years): 57.3 ± 4 FEV1 (%): 28.6 ± 1.9 NYHA (II/III): 6/3 PImax (cmH2O): 84.6 ± 5.9 | (2) Low intensity IMT: I: fixed at 15% SMIP. T: completed 6 efforts in the 6 levels | |
| 2009. Stein et al. [49] | Total sample n = 32 M/W: N/A Age (years): N/A FEV1 (%):38 ± 3. NYHA: N/A PImax (%): <70% | Duration: 12 weeks IMT with threshold device F: 7 ×/week T: 30 min for each session |
| (1) IMT n = 16 | (1) IMT: I: 30% PImax, weekly readjusted | |
| (2) Sham IMT n = 16 | (2) Sham IMT: I: Without charge. | |
| 2009. Padula et al. [31] | Total sample n = 32 FEV1 (%): <45 | Duration: 12 weeks |
| (1) IMT n = 15 M/W: 5/10 Age (years): 76 (51–89) PImax (cmH2O): 48 ± 25 NYHA (II/III): 5/7 | (1) IMT: IMT with threshold device F: 6–7 ×/week I: 30% PImax, readjusted each 3 weeks T: 10–20 min/day | |
| (2) Control group n = 17 M/W: 7/10 Age (years): 73 (32–95) PImax (cmH2O): 52 ± 27 NYHA (II/III): 9/6 | (2) Control: Education about auto-efficacy, anatomy and physiology | |
| 2011. Bosnak-Guclu et al. [51] | Total sample n = 30 | Duration: 6 weeks IMT with threshold device F: 7 ×/week. One session weekly supervised T: 30 min for each session |
| (1) IMT n = 16 M/W: 12/4 Age (years): 70 ± 8 FEV1 (%): 33 ± 7 NYHA (II/III): 11/5 PImax (cmH2O): 62 ± 33 | (1) IMT group: I: 40% PImax, readjusted each week | |
| (2) Sham IMT n = 14 M/W: 12/2 Age (years): 66 ± 11 FEVI (%): 36 ± 8 NYHA (II/III): 9/5 PImax (cmH2O): 78 ± 35 | (2) Sham IMT group: I: fixed at 15% PImax | |
| 2012. Mello et al. [55] | Total sample n= 27 NYHA: II | Duration: 12 weeks |
| (1) IMT n = 15 M/W: 9/6 Age (years): 54.3 ± 2 FEV1 (%): 33.6 ± 2.3 PImax (cmH2O): 56.1 ± 2.3 | (1) IMT: IMT with threshold device I: 30% PImax, weekly readjusted F: 7 ×/week. One session weekly supervised T: 10 min × 3/day. | |
| (2) Control group n = 12 M/W: 5/7 Age (years): 53.3 ± 2 FEV1 (%): 37.6 ± 1.6 PImax (cmH2O): 56.2 ± 2.1 | (2) Control group Usual care | |
| 2013. Marco et al. [54] | Total sample n = 22 | Duration: 4 weeks IMT with threshold device F: 7 ×/week. One session weekly supervised IMT was performed 5 × 10 with 1/2 min of rest between series at 2 times per day |
| (1) High intensity IMT n = 11 M/W: 7/4 Age (years): 68.5 ± 8.9 FEV1 (%): 38.3 ± 16 NYHA (II/III): 8/3 PImax (cmH2O): 55.1 ± 23.6 | (1) High intensity IMT: I: 100% of 10 RM, weekly adjusted | |
| (2) Sham IMT n =11 M/W: 10/1 Age (years): 70.1 ± 10.1 FEV1 (%): 35.5 ± 17.5 NYHA (II/III): 9/2 PImax (cmH2O): 58.1 ± 24.3 | (2) Sham IMT: I: 10 cmH2O was weekly increased up to 2.5 cmH2O | |
| 2014. Palau et al. [56] | Total sample n = 26 | Duration: 12 weeks IMT with threshold device |
| (1) IMT n = 14 M/W: 7/7 Age (years): 68 (60–76) FEV1 (%): 69 (63–77) NYHA (II/III-IV): 5/9 PImax (cmH2O): 70 (55.7–84) | (1) IMT: I: 25/30% of PImax weekly readjusted F: 7 ×/week. One session weekly supervised T: 20 min ×2/day | |
| (2) Control group n = 12 M/W: 6/6 Age (years): 74 (73–77) FEV1 (%): 76 (68–83) NYHA (II/III-IV): 3/9 PImax (cmH2O): 68 (60.5–88.5) | (2) Control group: Usual care | |
| 2017. Moreno et al. [20] | Total sample n = 26 | Duration: 8 weeks IMT with threshold or resistive charge device |
| (1) IMT n = 13 M/W: 8/5 Age (years): 61 ± 14 FEV1 (%): 35 ± 9 NYHA (II/III): 6/7 PImax (cmH2O): 60 ± 13 | (1) IMT: I: 30% PImax, weekly readjusted. F: 6 ×/week. One session weekly supervised T: 30 min for each session | |
| (2) Control group n = 13 M/W: 8/5 Age (years): 60 ± 13 FEV1 (%): 37 ± 6 NYHA (II/III): 7/6 PImax (cmH2O): 60 ± 16 | (2) Control group: Without intervention |
| Year and Authors | Subjects Characteristics | Training Protocol |
|---|---|---|
| 2009. Winkelmann et al. [50] | Total sample n = 38 NYHA: N/A | Duration: 12 weeks All groups carried out AT which consisted of: Static bicycle training with a cadence of 60 rpm I: RPE of 5/10 T: initial 20 min, and 5 min added for each 2 weeks up to get 45 min |
| (1) AT + IMT baseline n = 19, final n = 12 M/W: 4/8 Age (years): 54 ± 12 FEV1 (%): 39 ± 12 PImax (cmH2O): 57 ± 12 | (1) IMT + AT: IMT with threshold device F: 7 ×/week. One session weekly supervised I: 30% PImax, readjusted for each week T: 30 min per session | |
| (2) AT baseline n i = 19, final n = 12 M/W: 7/5 Age (years): 59 ± 9 FEV1 (%): 34 ± 11 PImax (cmH2O): 56 ± 13 | (2) AT: Isolated AT was performed | |
| 2013. Laoutaris et al. [52] | Total sample n = 27 | Duration: 12 weeks F: 3 ×/week. All sessions supervised AT was carried out by both groups at 70/80% of maximum HR during static bicycle |
| (1) ARIS n = 13 M/W: 10/3 Age (years): 57.1 ± 11 FEV1 (%): 27.8 ± 8 NYHA (II/III): 6/7 PImax (cmH2O): 75.3 ± 11 | (1) ARIS: AT began with 20 min and was minimum increased 1 min for each session up to get 30 min. RT consisted of 3 × 12 quadriceps bench strengthening exercises at 50% of 1 RM (adjusted each 2 weeks, 4 × 12 exercises performing elbow flexion, abduction and elbow flexion with weights from 1 to 2 kg IMT was performed with a resistive charge device; rest duration was decreased between inspiratory efforts according to the patients’ clinical course. I: 60% SMIP, adjusted in each session T: 1 h 15 min for the total session | |
| (2) AT n = 14 M/W: 12/2 Age (years): 58.6 ± 8 FEVI (%): 30.6 ± 5.4 NYHA (II/III): 8/6 PImax (cmH2O): 79 ± 9.1 | (2) AT: AT was expanded up to 45 min. T: 55 min for the total session duration | |
| 2014. Adamopoulos et al. [53] | Total sample n= 43 | Duration: 12 weeks F: 3 ×/week. All sessions supervised. AT was carried out by both groups at 70%/80% of the maximum HR in static bicycle during 45 min. |
| IMT was performed with a resistive charge device. Both groups carried out the following protocol. Six efforts were performed for each level Level 1: 60 s of rest for each 6 inspiratory efforts Level 2: 45 s of rest between series Level 3: 30 s of rest between series Level 4: 15 s of rest between series Level 5: 10 s of rest between series Level 6: 5 s of rest between series. After level 6, a rest of 5 s was maintained up to get 30 min of IMT. | ||
| (1) AT + IMT n = 21 M/W: 19/2 Age (years): 57.8 ± 11.7 FEV1 (%): 27.7 ± 6.7 NYHA (II/III): 9/12 PImax (cmH2O): 81.9 ± 21.5 | (1) AT/IMT: I: 60% SMIP, adjusted for each session | |
| (2) AT+ Sham IMT n = 22 M/W: 17/5 Age (years): 58.3 ± 13.2 FEV1 (%): 30.1 ± 5 NYHA (II/III): 12/10 PImax (cmH2O): 79.1 ± 19.4 | (2) AT/IMT simulated: I: 10% SMIP, adjusted for each session | |
| 2017. Kawauchi et al. [60] | Total sample n = 35 | Duration: 8 weeks. IMT was performed with a threshold device F: 7 ×/week. One session supervised each 15 days, and IMT progressions and RT were performed each 15 days. IMT lasted 30 min for each session in both groups. RT was performed 1 x10 for each exercise (elbow flexion and extension, shoulder flexion and abduction, hip flexion, extension and abduction, plantar and dorsal flexion) during the first 2 weeks and 2 series of 10 repetitions during the rest 6 weeks |
| (1) MIPRT n = 13 M/W: 8/5 Age (years): 56 ± 7 FEV1 (%): 28 ± 5 NYHA (II/III): 5/8 PImax (cmH2O): 70 ± 14 | (1) MIPRT: IMT was performed at an intensity of 30% PImax RT at an intensity of 50% 1 RM | |
| (2) LIPRT n = 13 M/W: 6/7 Age (years): 54 ± 10 FEV1 (%): 30 ± 6 NYHA (II/III): 6/7 PImax (cmH2O): 72 ± 20 | (2) LIPRT: IMT was performed at an intensity of 15% PImax RT with weights of 0.5 kg | |
| (3) Control group n = 9 M/W: 5/4 Age (years): 56 ± 7 FEV1 (%): 29 ± 7 NYHA (II/III): 5/4 PImax (cmH2O): 74 ± 24 | (3) Control group: Without intervention | |
| 2018. Palau et al. [57] | Total sample n = 59 | Duration: 12 weeks IMT with threshold device |
| (1) IMT n = 15 M/W: 7/8 Age (years): 75 ± 10 FEV1 (%): 70 ± 9 NYHA (II/III): 12/3 PImax (cmH2O): 58 ± 20 | (1) IMT: F: 7 ×/weeks. One session supervised I: 25/30% PImax, weekly readjusted T: 20 min x2/day. | |
| (2) FES n = 15 M/W: 6/8 Age (years): 72 ± 9 FEV1 (%): 68 ± 11 NYHA (II/III): 10/5 PImax (cmH2O): 53 ± 16 | (2) FES: F: 2 ×/week. All sessions supervised T: 45 min for each session FES consisted of functional electric stimulation in lower limbs with a low frequency biphasic electric current | |
| (3) IMT + FES n = 16 M/W: 8/8 Age (years): 73 ± 10 FEV1 (%): 63 ± 11 NYHA (II/III): 11/5 PImax (cmH2O): 59 ± 26 | (3) IMT + FES: IMT + FES was applied during 12 weeks | |
| (4) Control group n = 13 M/W: 4/9 Age (years): 75 ± 9 FEVI1(%): 66 ± 8 NYHA (II/III): 8/5 PImax (cmH2O): 58 ± 25 | (4) Control group: Usual care | |
| 2019. Hornikx et al. [62] | Total sample n = 20 NYHA: n/A | Duration: 3 months IMT was carried out with a resistive charge device F: 3 ×/week. All sessions supervised |
| (1) RHIIT n = 10 M/W: 5/5 Age (years): 64 ± 8 FEV1 (%): 30 ± 14 PImax (cmH2O): 64 ± 27 | (1) RHIIT: IMT, RT and HIIT were performed IMT: F: 7 ×/week. I: 50% PImax, weekly readjusted This protocol comprised 30 repetitions at 2 time per day RT: 2 × 10 at 65% of 1 RM leg press exercise, increasing weights according to subjective patients’ sensations HIIT: 5 series of 3 min at 80% maximum charge work (Wpeak) and between series an active recuperation of 3 min was added (40% Wpeak) | |
| (2) SP n = 10 M/W: 6/4 Age (years): 58 ± 11 FEV1 (%): 31 ± 14 PImax (cmH2O): 89 ± 28 | (2) SP: SP comprised active 60 min. Training intensity began at 50% Wpeak and was progressively increased during 3 months up to 98% Wpeak in the last week. Each session included a 3 min warm-up, followed by 2 × 7 min cycling, 2 × 7 min walking in the treadmill, followed by rowing exercise, steps and arm ergometry during 12 min. Finally, calisthenics of all large muscle groups were added during 20 min | |
| 2019. Hossein Pour et al. [61] | Total sample n = 84 | Duration: 6 weeks IMT was performed with threshold device F: 7 ×/week. One session weekly supervised T: 30 min for each session |
| (1) IMT n = 42 M/W: 23/19 Age (years): 56 ± 9.4 FEV1 (%): 33.7 ± 6.1 NYHA (II/III/IV): 15/23/4 PImax (cmH2O): 59 ± 42.5 | (1) IMT: I: 40% PImax, weekly readjusted | |
| (2) Sham IMT n = 42 M/W: 21/21 Age (years): 57.3 ± 9 FEV1 (%): 32.5 ± 4.4 NYHA (II/III/IV): 17/19/6 PImax (cmH2O): 61.2 ± 72.3 | (2) Sham IMT: I: fixed at 10% PImax |
| Year and Authors | Subjects Characteristics | Training Protocol |
|---|---|---|
| 1995. Mancini et al. [64] | Baseline sample n = 14 Final sample n = 8 NYHA (I/II/III/IV): 2/2/6/4 PImax (cmH2O): 64 ± 31 | Duration: 3 months F: 3 ×/week. All sessions were supervised T: 90 min per session |
| Protocol: (1) Isocapnic hyperpnea with 20 min per session | ||
| (1) Training group n= 8 Age (years): 56 ± 15 FEV1 (%): 20 ± 8 NYHA: 2.8 ± 1 | (2) IMT with threshold device: T: 20 min I: 30% PImax F: 3 ×/week supervised, 2 x/day non-supervised, 15 min. Each 2 weeks training intensity was increase at +5 cmH2O. | |
| (2) Control group (loss to follow-up) n = 6 Age (years): 55 ± 15 FEV1 (%): 24 ± 10 NYHA: 2.3 ± 1.2 | (3) 10 repetitions of maximum inspiration and 10 repetitions of maximum expiration. These were maintained for 10 s and rest for 15 s between repetitions | |
| (4) Rehabilitation respiratory exercises, 8 repetitions for exercise/session. | ||
| 1997. Cahalin et al. [65] | Baseline sample n =14, M/W: 12/2 Final sample n = 8 Age (years): 52 ± 8.5 FEV1 (%): 23 ± 13 NYHA: 3.6 ± 0.6 PImax (%): 44 ± 15 | Duration: 8 weeks |
| (1) IMT with threshold device: T: 5 to 15 min. Initially 5 min and progressively increasing to 15 min for each session I: 20% PImax. PImax weekly readjusted F: 3 times daily. 2 times weekly. Supervised sessions | ||
| 2008. Chiappa et al. [48] | Total sample n = 28 | Duration: 4 weeks IMT with threshold device |
| (1) IMT n = 18 M/W: 12/6 Age (years): 57 ± 11 FEV1 (%): 24 ± 3 NYHA (I-II/III-IV): 10/8 PImax (cmH2O): 60 ± 8 | (1) IMT F: 7 ×/week. One session weekly supervised I: 30% PImax, weekly readjusted T: 30 min per session | |
| (2) Control group n = 10 Healthy subjects M/W: 8/2 Age: 38 ± 12. PImax (cmH2O): 153 ± 26 | (2) Control group Without intervention | |
| 2019. Palau et al. [58] | Total sample n = 45 M/W: 24/21 Age (years): 73 (68–77) FEV1 (%): 67.8 ± 10.3 NYHA (II/III-IV): 29/16 PImax (cmH2O): 61.3 (51.3–72.5) | Duration: 12 weeks IMT with threshold device I: 25/30% PImax, readjusted at 7/10 days. F: 7 ×/week. One session supervised at 7/10 days T: 20 min ×2/day. |
| 2019. Taya et al. [59] | Total sample n = 1 M/W: 1/0 Age (years): 55 FEV1 (%): 21 NYHA: N/A PImax (cmH2O): 45 | Duration: 7 weeks AT was carried out with an ergometer at 15–20 W during 7–15 min and 1–2 series were performed; training and charge duration were progressively increased. IMT: Training performed with a resistive charge device F: 7 ×/week. One session weekly supervised I: 20% PImax weekly readjusted Training protocol comprised 2 series of 30 repetitions |
| Studies | Groups | PImax (cmH2O, kPa o %) * | PEmax (cmH2O o %) * | Inspiratory Muscle Resistance | ||||||||||
|---|---|---|---|---|---|---|---|---|---|---|---|---|---|---|
| Pre | Post | p-Value * | p-Value ** | Pre | Post | p-Value * | p-Value ** | A.I. | Pre | Post | p-Value * | p-Value ** | ||
| Mancini, 1995 | Training n = 8 | 64 ± 31 | 88 ± 34 | <0.01 | <0.05 | 94 ± 30 | 152 ± 40 | <0.001 | <0.05 | - | - | - | - | |
| Ctl. n = 6 | N/A | N/A | N’S | N/A | N/A | N’S | - | - | - | |||||
| Cahalin, 1997 | IMT n = 8 | 51 ± 21 | 63 ± 23 | 0.0001 | - | 85 ± 22 | 96 ± 19 | 0.0001 | - | - | - | - | - | |
| Johnson, 1998 | IMT n = 8 | 70 ± 33 | +25.4 ± 11.2 | n/A | 0.04 | - | - | - | - | - | - | - | - | |
| C.IMT n = 8 | 84 ± 18 | +12.3 ± 12.1 | N/A | - | - | - | - | - | - | |||||
| Weiner, 1999 | IMT n = 10 | 46.5 ± 4.5 | 63.6 ± 4 | <0.005 | N/A | 82.1 ± 6.1 | N/A | N’S | N/A | PMpeak/PImax were calculated and expressed as % | 47.8 ± 3.6 | 67.7 ± 1.7 | <0.005 | N/A |
| C.IMT n = 6 | 50.7 ± 4.2 | N/A | N’S | 80.8 ± 5.7 | N/A | N’S | 45.6 ± 3.5 | N/A | N’S | |||||
| Martínez, 2001 | IMT n = 11 | 78 ± 22 | 99 ± 22 | <0.01 | N/A | - | - | - | N/A | Sustained PImax (SMIP) was calculated for 2 min (cmH2O) | 63 ± 18 | 90 ± 22 | <0.01 | N/A |
| C.IMT n = 9 | 72 ± 34 | 83 ± 30 | <0.05 | - | - | - | 58 ± 30 | 69 ± 30 | <0.05 | |||||
| Laoutaris, 2004 | IMT n = 20 | 82.8 ± 5.7 | 111.9 ± 6.8 | 0.000 | N/A | - | - | - | - | SMIP was measured for a variable duration (cmH2O/s^10−1) | 367360 ± 41111 | 527822 ± 51358 | 0.000 | N/A |
| C.IMT n = 15 | 78.4 ± 6.8 | 86.6 ± 6.3 | 0.03 | - | - | - | 271995 ± 30308 | 209065 ± 34896 | 0.003 | |||||
| Dall’ago, 2006 | IMT n = 16 | 59.5 ± 2.2% | N/A | N/A | <0.01 | - | - | - | - | SMIP measured for 1 min by an incremental test (Pthmax) (kPa) | 3.2 ± 0.5 | 3.8 ± 0.5 | <0.05 | <0.001 |
| S.IMT n = 16 | 59.8 ± 2% | N/A | N/A | - | - | - | 3.1 ± 0.5 | 3.2 ± 0.6 | N’S | |||||
| Laoutaris, 2007 | H.IMT n = 15 | 79.8 ± 4.7 | 105.1 ± 4.9 | <0.001 | N’S | - | - | - | - | SMIP measured for a variable duration (cmH2O/s^103) | 312 ± 27 | 504 ± 40 | <0.001 | <0.01 |
| L.IMT n = 23 | 80.2 ± 5 | 90.3 ± 5.9 | <0.01 | - | - | - | 286 ± 27 | 257 ± 35 | N’S | |||||
| Chiappa, 2008 | IMT n = 18 | 60 ± 8 | 103 ± 16 | <0.05 | - | - | - | - | - | - | - | - | - | |
| Laoutaris, 2008 | H.IMT n = 14 | 79 ± 5 | 105 ± 5.3 | <0.05 | N’S | - | - | - | - | SMIP measured for a variable duration (cmH2O/s^103) | 308 ± 28 | 511 ± 42 | <0.05 | <0.05 |
| L.IMT n = 9 | 82.2 ± 8.7 | 97.6 ± 11.3 | <0.05 | - | - | - | N/A | N/A | N’S | |||||
| Padula, 2009 | IMT n = 15 | 48.7 ± 25.7 | 78.5 ± 37.1 | N/A | <0.0001 | - | - | - | - | - | - | - | - | |
| Ctl. n = 17 | 52.3 ± 27.3 | 52.6 ± 28.3 | N/A | - | - | - | - | - | - | |||||
| Stein, 2009 | IMT n = 16 | 5.9 ± 0.9 kPa | 12.7 ± 0.9 kPa | <0.001 | N/A | - | - | - | - | - | - | - | - | |
| S.IMT n = 16 | N/A | N/A | N’S | - | - | - | - | - | - | |||||
| Winkelmann, 2009 | ATIMT, n = 12 | 57 ± 12 | N/A | <0.05 | <0.01 | 79 ± 31 | 123 ± 31 | <0.001 | <0.05 | Pthmax (cmH2O) | 28 ± 6 | 41 ± 2 | N/A | <0.001 |
| AT n = 12 | 56 ± 13 | N/A | <0.05 | 74 ± 23 | 108 ± 27 | N/A | 29 ± 6 | 36 ± 3 | N/A | |||||
| Bosnak-Guclu, 2011 | IMT n = 16 | 62 ± 33.6 | 97.1 ± 32.6 | <0.001 | <0.001 | 102.6 ± 55.2 | 125.1 ± 56.2 | <0.001 | 0.009 | - | - | - | - | |
| S.IMT n = 14 | 78.6 ± 36 | 90.9 ± 30.2 | 0.001 | 115.9 ± 43.2 | 124.7 ± 50.4 | 0.026 | - | - | - | |||||
| Mello, 2012 | IMT n = 15 | 59.2 ± 4.9 | 87.5 ± 6.5 | 0.001 | <0.05 | - | - | - | - | - | - | - | - | |
| Ctl. n = 12 | 63.2 ± 5.3 | 67.8 ± 5.8 | N’S | - | - | - | - | - | - | |||||
| Laoutaris, 2013 | ARIS n = 13 | 75.3 ± 11 | 102 ± 19 | <0.001 | N’S | - | - | - | - | SMIP measured for a variable duration (cmH2O/s^103) | 310 ± 27 | 413 ± 24 | <0.001 | <0.001 |
| AT n = 14 | 79 ± 9.1 | 83.5 ± 9.7 | 0.02 | - | - | - | 306 ± 21 | 307 ± 23 | N | |||||
| Marco 2013 | H.IMT n = 11 | 56.1 ± 19.9 | 88.2 ± 21.3 | N/A | 0.001 | - | - | - | - | 10 RM of maximum inspiratory charge measured (cmH2O) | 34.4 ± 12.8 | 59.4 ± 17.5 | - | <0.001 |
| L.IMT n = 11 | 56.1 ± 15.6 | 70.8 ± 16.4 | N/A | - | - | - | 33 ± 12.1 | 39 ± 10.1 | - | |||||
| Adamopoulos, 2014 | AT + IMT n = 21 | 81.9 ± 21.5 | 100.7 ± 23 | <0.001 | N’S | - | - | - | - | SMIP measured for a variable duration (cmH2O/s^103) | 343 ± 120 | 521 ± 146 | <0.001 | 0.02 |
| ATSIMT n = 22 | 79.2 ± 19.4 | 85.1 ± 25 | 0.02 | - | - | - | 330 ± 125 | 350 ± 159 | N’S | |||||
| Palau, 2014 | IMT n = 14 | 70 (55.7–84) | 133 (92–190) | <0.001 | N/A | - | - | - | - | - | - | - | - | |
| Ctl. n = 12 | 68 (61–89) | 68 (58–90) | N’S | - | - | - | - | - | - | |||||
| Kawauchi, 2017 | MIPRT n = 13 | 70 ± 14 | 92 ± 26 | <0.05 | <0.05 *** | 90 ± 32 | 114 ± 32 | <0.05 | <0.05 *** | - | - | - | - | |
| LIPRT n = 13 | 72 ± 20 | 89 ± 28 | <0.05 | <0.05 *** | 100 ± 30 | 107 ± 33 | <0.05 | N’S | - | - | - | - | ||
| Ctl. n = 9 | 74 ± 24 | 69 ± 25 | N’S | - | 98 ± 31 | 93 ± 27 | N’S | - | - | - | - | - | ||
| Moreno, 2017 | IMT n = 15 | 60 ± 13 | N/A | <0.001 | <0.001 | - | - | - | - | - | - | - | - | |
| Ctl. n = 13 | 60 ± 16 | N/A | N’S | - | - | - | - | - | - | |||||
| Hornikx, 2019 | RHIIT n = 10 | 64 ± 27 | +44.9 ± 29.9 | <0.01 | <0.01 | - | - | - | - | - | - | - | - | |
| SP n = 10 | 89 ± 28 | −0.56 ± 19.4 | N’S | - | - | - | - | - | - | |||||
| Palau, 2019 | IMT n = 45 | 61 (51–73) | 97 (82–150) | <0.001 | - | - | - | - | - | - | - | - | - | |
| Taya, 2019 | IMT + AT n = 1 | 54.9% | 102.3% | N/A | - | 48.8% | 62.7% | N/A | - | - | - | - | - | |
| Studies | Groups | FVC (% Predicted or L) | FEV1(% Pred o L) | FEV1/FVC | |||||||||
|---|---|---|---|---|---|---|---|---|---|---|---|---|---|
| Pre | Post | p-Value * | p-Value ** | Pre | Post | p-Value * | p-Value ** | Pre | Post | p-Value * | p-Value ** | ||
| Mancini, 1995 | Training n = 8 | - | - | - | - | N/A | 2.3 ± 0.7 L | N’S | N’S | N/A | 72 ± 8 | N’S | N’S |
| Ctl. n = 6 | - | - | - | N/A | 3.1 ± 1.4 L | N’S | N/A | 73 ± 10 | N’S | ||||
| Weiner, 1999 | IMT n = 10 | 3.14 ± 0.2 L | 3.37 ± 0.2 L | <0.05 | N/A | 2.46 ± 0.2 L | N/A | N’S | N/A | - | - | - | - |
| C.IMT n = 6 | 3.02 ± 0.6 L | N/A | N/A | 2.33 ± 0.2 L | N/A | N’S | - | - | - | ||||
| Laoutaris, 2004 | IMT n = 20 | 92.4 ± 4.2% | 98.1 ± 4.2% | N’S | N/A | 90.5 ± 4.5% | 91.6 ± 5% | N’S | N/A | 78 ± 2 | 74 ± 2 | 0.006 | N/A |
| C.IMT n = 15 | 87.9 ± 3.1% | 89.9 ± 3.3% | N’S | 83.2 ± 4.9% | 81.3 ± 4.4% | N’S | 77.1 ± 3.2 | 73.2 ± 3 | N’S | ||||
| Dall’ago, 2006 | IMT n = 16 | 85.3 ± 13.4% | 84.8 ± 15.2% | N’S | N’S | 83.7 ± 14.5% | 82.4 ± 15.1% | N’S | N’S | - | - | - | - |
| S.IMT n = 16 | 84.7 ± 8.8% | 83 ± 9.5% | N’S | 90.1 ± 12.6% | 90.1 ± 12.6% | N’S | - | - | - | ||||
| Laoutaris, 2007 | H.IMT n = 15 | 96 ± 3.3% | 98.9 ± 3.9% | <0.05 | <0.05 | 91.3 ± 4.1% | 93.3 ± 4.1% | N’S | <0.05 | 76.7 ± 1.8 | 76.4 ± 1.9 | N’S | N’S |
| L. IMT n = 23 | 85.8 ± 2.6% | 88 ± 2.6% | N’S | 80.1 ± 3.8% | 79.9 ± 3.7% | N’S | 75.8 ± 2.5 | 72.7 ± 2.5 | 0.05 | ||||
| Bosnak-Guclu, 2011 | IMT n = 16 | 92.1 ± 15% | 102.5 ± 15.9% | 0.001 | N’S | 84.6 ± 16% | 89.6 ± 14.6% | 0.024 | N’S | 71.2 ± 10.3 | 69 ± 11.3 | N’S | 0.02 |
| S.IMT n = 14 | 91.6 ± 14.7% | 97.6 ± 15.3% | 0.023 | 86.8 ± 20.8% | 89.7 ± 20% | N’S | 71.8 ± 8.3 | 74.3 ± 5.9 | N’S | ||||
| Adamopoulos, 2014 | AT + IMT n = 21 | 85.4 ± 16.1% | 84.7 ± 20% | N’S | N’S | 85.1 ± 14.9% | 82.5 ± 21.4% | N’S | N’S | 91 ± 12.5 | 85.9 ± 19.7 | N’S | N’S |
| AT + S.IMT n = 22 | 89.9 ± 20.4% | 94.5 ± 18.6% | N’S | 84.8 ± 18.3% | 90.4 ± 18% | N’S | 89.4 ± 15.2 | 91.6 ± 9.7 | N’S | ||||
| Kawauchi, 2017 | MIPRT n = 13 | 76 ± 13% | 76 ± 10% | N’S | N’S *** | 71 ± 16% | 73 ± 14% | N’S | N’S *** | 75 ± 7 | 76 ± 8 | N’S | N’S *** |
| LIPRT n = 13 | 78 ± 19% | 79 ± 18% | N’S | N’S *** | 74 ± 22% | 73 ± 19% | N’S | N’S *** | 76 ± 7 | 75 ± 7 | N’S | N’S *** | |
| Ctl. n = 9 | 77 ± 9% | 75 ± 11% | N’S | - | 68 ± 13% | 66 ± 12% | N’S | - | 70 ± 9 | 70 ± 8 | N’S | - | |
| Study | Groups | Borg Scale | MMRC | Mahler Index | Dyspnea Index | ||||||||||||
|---|---|---|---|---|---|---|---|---|---|---|---|---|---|---|---|---|---|
| Pre | Post | p-Value * | p-Value ** | Pre | Post | p-Value * | p-Value ** | Pre | Post | p-Value * | p-Value ** | Pre | Post | p-Value * | p-Value ** | ||
| Mancini, 1995 | Training n = 8 | 11 ± 4 (6) | 10 ± 2 (6) | N’S | N/A | - | - | - | - | - | - | - | - | - | - | - | - |
| Ctl. n = 6 | 10.3 ± 2.9 (6) | 10.7 ± 2.3 (6) | N’S | - | - | - | - | - | - | - | - | - | |||||
| Cahalin, 1997 | IMT n = 8 | 2 ± 0.7 (R) | 1.3 ± 0.05 (R) | 0.0001 | - | - | - | - | - | - | - | - | - | - | - | - | - |
| 3.6 ± 0.5 (E) | 2.6 ± 0.6 (E) | 0.003 | - | - | - | - | - | - | - | - | - | ||||||
| Johnson, 1998 * | IMT n = 8 | 8.9 ± 1.9 (S) | −1.2 (S) | N/A | N’S (S) * | - | - | - | - | - | - | - | - | - | - | - | - |
| 10.7 ± 1.9 (n) | −0.5 (n) | N/A | N’S (N) * | - | - | - | - | - | - | - | - | - | |||||
| 12.8 ± 2.3 (F) | −1.3 (F) | N/A | N’S (F) * | - | - | - | - | - | - | - | - | - | |||||
| C.IMT n = 8 | 8.8 ± 1.9 (S) | +0.4 (S) | N/A | - | - | - | - | - | - | - | - | - | |||||
| 10.4 ± 1.8 (n) | −0.1 (n) | N/A | - | - | - | - | - | - | - | - | - | ||||||
| 13.1 ± 2.4 (F) | +0.2 (F) | N/A | - | - | - | - | - | - | - | - | - | ||||||
| Weiner, 1999 | IMT n = 10 | - | - | - | - | - | - | - | - | - | - | - | - | 1.70 ± 0.2 | 2.70 ± 0.2 | <0.005 | N/A |
| C.IMT n = 6 | - | - | - | - | - | - | - | - | - | 1.75 ± 0.2 | N/A | N’S | |||||
| Martínez, 2001 | IMT n = 11 | - | - | - | - | - | - | - | - | 6.2 ± 2 | 2.7 ± 1.8 | N/A | N/A | - | - | - | - |
| C.IMT n = 9 | - | - | - | - | - | - | 5 ± 2 | 2.8 ± 1.8 | N/A | - | - | - | |||||
| Laoutaris, 2004 * | IMT n = 20 | 14.2 ± 0.5 (T) | 12.8 ± 0.6 (T) | 0.000 | N/A | - | - | - | - | - | - | - | - | - | - | - | - |
| 10.5 ± 0.7 (6) | 9 ± 0.5 (6) | 0.001 | - | - | - | - | - | - | - | - | - | ||||||
| C.IMT n = 15 | 14.3 ± 0.5 (T) | 14.4 ± 0.5 (T) | N’S | - | - | - | - | - | - | - | - | - | |||||
| 12.7 ± 0.8 (6) | 12.6 ± 0.8 (6) | N’S | - | - | - | - | - | - | - | - | - | ||||||
| Dall’ago, 2006 | IMT n = 16 | 3.7 ± 2.0 (6) | 1.5 ± 1.4 (6) | N/A | <0.002 | - | - | - | - | - | - | - | - | - | - | - | - |
| S.IMT n = 16 | 3.1 ± 1.3 (6) | 3.0 ± 1.4 (6) | N/A | - | - | - | - | - | - | - | - | - | |||||
| Laoutaris, 2007 * | H.IMT n = 15 | 9.2 ± 0.4 (6) | 8 ± 0.4 (6) | <0.01 | <0.001 | - | - | - | - | - | - | - | - | - | - | - | - |
| L.IMT n = 23 | 11.8 ± 0.6 (6) | 11.5 ± 0.6 (6) | N’S | - | - | - | - | - | - | - | - | - | |||||
| Laoutaris, 2008 * | H.IMT n = 14 | 18.1 ± 0.1 (C) | 17.6 ± 0.2 (C) | 0.02 | 0.05 | - | - | - | - | - | - | - | - | - | - | - | - |
| L.IMT n = 9 | 17.6 ± 0.2 (C) | 17.9 ± 0.3 (C) | N’S | - | - | - | - | - | - | - | - | - | |||||
| Padula, 2009 | IMT n = 15 | N/A | N/A | N/A | N/A | - | - | - | - | - | - | - | - | - | - | - | - |
| Ctl. n = 17 | N/A | N/A | N/A | - | - | - | - | - | - | - | - | - | |||||
| Bosnak-Guclu, 2011 | IMT n = 16 | - | - | - | - | 2.27 ± 0.88 | 1.07 ± 0.79 | <0.001 | <0.001 | - | - | - | - | - | - | - | - |
| S.IMT n = 14 | - | - | - | 1.93 ± 0.92 | 1.71 ± 0.83 | 0.024 | - | - | - | - | - | - | |||||
| Laoutaris, 2013 * | ARIS n = 13 | 17.8 ± 0.6 (C) | 17.3 ± 0.9 (C) | N’S | 0.03 | - | - | - | - | - | - | - | - | - | - | - | - |
| AT n = 14 | 18.1 ± 0.5(C) | 17.8 ± 0.7(C) | N’S | - | - | - | - | - | - | - | - | - | |||||
| Marco, 2013 | H.IMT n = 11 | - | - | - | - | 2.1 ± 1 | −0.8 ± 1.39 | N/A | N’S | - | - | - | - | - | - | - | - |
| S.IMT n = 11 | - | - | - | 1.6 ± 1.03 | −0.3 ± 0.46 | N/A | - | - | - | - | - | - | |||||
| Adamopoulos, 2014 | AIMT n = 21 | 8.6 ± 0.5 (C) | 8 ± 0.8 (C) | 0.05 | 0.004 | - | - | - | - | - | - | - | - | - | - | - | - |
| ASIMT n = 22 | 9.1 ± 0.5 (C) | 8.9 ± 0.7 (C) | N’S | - | - | - | - | - | - | - | - | - | |||||
| Hossein Pour, 2019 | IMT n = 42 | - | - | - | - | 2.63 ± 0.79 | 1.38 ± 0.66 | <0.001 | <0.001 | - | - | - | - | - | - | - | - |
| S.IMT n = 42 | - | - | - | 2.19 ± 0.89 | 2.28 ± 0.94 | 0.036 | - | - | - | - | - | - | |||||
| Studies | Groups | Fatigue Severity Scale | |||
|---|---|---|---|---|---|
| Pre | Post | p-Value * | p-Value ** | ||
| Bosnak-Guclu, 2011 | IMT n = 16 | 42.73 ± 11.75 | 29.07 ± 13.96 | <0.001 | N’S |
| Sham IMT n = 14 | 42.86 ± 12.67 | 32.93 ± 15.87 | 0.008 | ||
| Hossein Pour, 2019 | IMT n = 42 | 43.86 ± 8.50 | 28.95 ± 9.11 | <0.001 | <0.001 |
| Sham IMT n = 42 | 40.64 ± 10.89 | 41.47 ± 10.67 | 0.018 | ||
| Studies | Groups | 6 MWT (Feet or Meters) * | CWT (s) | Exercise Period 1 | NYHA | ||||||||||||
|---|---|---|---|---|---|---|---|---|---|---|---|---|---|---|---|---|---|
| Pre | Post | p-Value * | p-Value ** | Pre | Post | p-Value * | p-Value ** | Pre | Post | p-Value * | p-Value ** | Pre | Post | p-Value * | p-Value ** | ||
| Mancini, 1995 | T.G. n = 8 | 1110 ± 351 ft | 1420 ± 328 ft | <0.001 | N/A | - | - | - | - | N/A | 785 ± 230 | <0.05 | N/A | - | - | - | - |
| Ctl. n = 6 | 1212 ± 541 ft | 1243 ± 565 ft | N’S | - | - | - | N/A | N/A | N/A | - | - | - | |||||
| Johnson, 1998 | IMT n = 8 | - | - | - | - | 93.5 ± 16.4 (S) | −3.8 ± 9.5 (S) | N/A | N’S (S) | 542 ± 383 ″ | +152 ± 144 ″ | N/A | N’S | - | - | - | - |
| 79.8 ± 12.3 (n) | −4.4 (n) | N/A | |||||||||||||||
| 66.1 ± 11.5 (F) | −6.3 (F) | N/A | |||||||||||||||
| C.IMT n = 8 | - | - | - | 96.5 ± 25.7 (S) | −4.1 ± 16.3(S) | N/A | N’S (n) | 543 ± 287 ″ | +82 ± 118 ″ | N/A | - | - | - | ||||
| 76.1 ± 11.2 (n) | + 1.5 (n) | N/A | N’S (F) | ||||||||||||||
| 66.8 ± 20.2 (F) | −4.1 (F) | N/A | |||||||||||||||
| Weiner, 1999 | IMT n = 10 | 458 ± 29 2 | 562 ± 32 2 | <0.01 | N/A | - | - | - | - | - | - | - | - | - | - | - | - |
| C.IMT n = 6 | 428 ± 31 2 | 419 ± 25 2 | N’S | - | - | - | - | - | - | - | - | - | |||||
| Martínez, 2001 | IMT n = 11 | 451 ± 78 | 486 ± 68 | <0.05 | N/A | - | - | - | - | - | - | - | - | - | - | - | - |
| C.IMT n = 9 | 430 ± 110 | 449 ± 102 | N’S | - | - | - | - | - | - | - | - | - | |||||
| Laoutaris, 2004 | IMT n = 20 | 367.1 ± 22.3 | 433.4 ± 16.9 | 0.000 | N/A | - | - | - | - | 8.7 ± 0.7 ′ | 9.9 ± 0.7 ′ | 0.002 | N/A | - | - | - | - |
| C.IMT n = 15 | 343.7 ± 24.8 | 352.1 ± 22.1 | N’S | - | - | - | 8.2 ± 0.7 ′ | 7.7 ± 0.6 ′ | N’S | - | - | - | |||||
| Dall’ago, 2006 | IMT n = 16 | 449 ± 17 | 550 ± 17 | N/A | <0.002 | - | - | - | - | 298 ± 154 ″ | 924 ± 503 ″ | <0.001 | <0.001 | - | - | - | - |
| S.IMT n = 16 | 432 ± 41 | 411 ± 60 | N/A | - | - | - | 256 ± 132 ″ | 246 ± 121 ″ | N’S | - | - | - | |||||
| Laoutaris, 2007 | H.IMT n = 15 | 378.2 ± 10.4 | 404.3 ± 11.9 | <0.01 | N’S | - | - | - | - | 9.9 ± 0.5 ′ | 10.4 ± 0.5 ′ | N’S | <0.01 | - | - | - | - |
| L.IMT n = 23 | 358 ± 10 | 366 ± 16.5 | N’S | - | - | - | 8.3 ± 0.5 ′ | 8.1 ± 0.5 ′ | N’S | - | - | - | |||||
| Laoutaris, 2008 | H.IMT n = 14 | - | - | - | - | - | - | - | - | 9.8 ± 0.5 ′ | 10.2 ± 0.5 ′ | N’S | N’S | - | - | - | - |
| L.IMT n = 9 | - | - | - | - | - | - | 9.1 ± 0.7 ′ | 9.2 ± 0.6 ′ | N’S | - | - | - | |||||
| Winkelmann, 2009 | ATIMT n = 12 | 420 ± 90 | 500 ± 72 | <0.001 | N/A | - | - | - | - | - | - | - | - | - | - | - | - |
| AT n = 12 | 433 ± 108 | 489 ± 81 | <0.05 | - | - | - | - | - | - | - | - | - | |||||
| Bosnak-Guclu, 2011 | IMT n = 16 | 419 ± 123 | 479 ± 132 | <0.001 | <0.001 | - | - | - | - | - | - | - | - | - | - | - | - |
| S.IMT n = 14 | 462 ± 134 | 476 ± 136 | N’S | - | - | - | - | - | - | - | - | - | |||||
| Laoutaris, 2013 | ARIS n = 13 | - | - | - | - | - | - | - | - | 9 ± 2 ′ | 10.5 ± 1.9 ′ | 0.001 | 0.01 | 2.5 ± 0.5 | 1.9 ± 0.8 | 0.001 | N’S |
| AT n = 14 | - | - | - | - | - | - | 9.1 ± 1.2 ′ | 9.9 ± 0.9 ′ | 0.04 | 2.4 ± 0.5 | 2.2 ± 0.8 | N’S | |||||
| Adamopoulos, 2014 | ATIMT n = 21 | - | - | - | - | - | - | - | - | 8.6 ± 2.5 ′ | 10.1 ± 2.1 ′ | <0.001 | N’S | 2.5 ± 0.5 | 2 ± 0.5 | 0.001 | N’S |
| ATSIMT n = 22 | - | - | - | - | - | - | 9.8 ± 3.4 ′ | 10.6 ± 2.8 ′ | N’S | 2.5 ± 0.5 | 2.1 ± 0.6 | 0.02 | |||||
| Palau, 2014 | IMT n = 14 | 345 (189–400) | 389 (347–423) | <0.001 | <0.001 | - | - | - | - | - | - | - | - | - | - | - | - |
| Ctl. n = 12 | 254 (202–384) | 231 (203–375) | N’S | - | - | - | - | - | - | - | - | - | |||||
| Kawauchi, 2017 | MIPRT n = 13 | 393 ± 81 | 462 ± 69 | <0.05 | <0.05 *** | - | - | - | - | - | - | - | - | II(5)/III(8) | II(11)/III(1) | 0.031 | N/A *** |
| LIPRT n = 13 | 422 ± 114 | 458 ± 97 | <0.05 | <0.05 *** | - | - | - | - | - | - | - | - | II(6)/III(7) | II(10)/III(3) | N’S | N/A *** | |
| Ctl. n = 9 | 425 ± 47 | 441 ± 58 | N’S | - | - | - | - | - | - | - | - | - | II(5)/III(4) | II(5)/III(4) | N’S | - | |
| Palau, 2018 | IMT n = 15 | N/A | N/A | <0.05 | N/A | - | - | - | - | - | - | - | - | - | - | - | - |
| IMTFES n = 16 | N/A | N/A | <0.05 | - | - | - | - | - | - | - | - | - | |||||
| FES n = 15 | N/A | N/A | <0.05 | - | - | - | - | - | - | - | - | - | |||||
| Ctl. n = 13 | N/A | N/A | N’S | - | - | - | - | - | - | - | - | - | |||||
| Hossein Pour, 2019 | IMT n = 42 | - | - | - | - | - | - | - | - | - | - | - | - | 2.73 ± 0.5 | 2.1 ± 0.6 | 0.001 | 0.003 |
| S.IMT n = 42 | - | - | - | - | - | - | - | - | - | 2.73 ± 0.8 | 2.65 ± 0.5 | N’S | |||||
| Studies | Groups | Hand Grip Strength | Quadriceps Strength | ||||||
|---|---|---|---|---|---|---|---|---|---|
| Pre | Post | p * | p ** | Pre | Post | p * | p ** | ||
| Bosnak-Guclu, 2011 | IMT n = 16 | - | - | - | - | 241 ± 106 n | 302 ± 112 n | <0.001 | 0.031 |
| S.IMT n = 14 | - | - | - | 292 ± 103 n | 309 ± 133 n | N’S | |||
| Laoutaris, 2013 | ARIS n = 13 | - | - | - | - | 1.9 ± 0.3 N·m | 2.4 ± 0.38 N·m | <0.001 | 0.003 |
| AT n = 14 | - | - | - | 1.8 ± 0.1 N·m | 1.9 ± 0.2 N·m | N’S | |||
| Marco 2013 | IMT n = 11 | 26.9 ± 10.4 N (D) | 29.8 ± 10.9 N (D) | N/A | N’S (D) | - | - | - | - |
| 26.6 ± 11.4 N (NO) | 27.3 ± 8.1 N (NO) | ||||||||
| S.IMT n = 11 | 31.3 ± 9.9 N (D) | 31.2 ± 11.1 N (D) | N/A | N’S (NO) | - | - | - | ||
| 30.4 ± 9.5 N (NO) | 30.5 ± 10.2 N (NO) | ||||||||
| Kawauchi, 2017 | MIRPT n = 13 | N/A | N/A | - | - | 234 ± 75 N | 279 ± 79 N | <0.05 | <0.05 *** |
| LIRPT n = 13 | N/A | N/A | - | - | 248 ± 80 N | 290 ± 94 N | <0.05 | <0.05 *** | |
| Ctl. n = 9 | N/A | N/A | - | - | 204 ± 45 N | 203 ± 54 N | N’S | - | |
| Hornikx, 2019 | RHIIT n = 10 | - | - | - | - | 107 ± 32 N·m | +19.3 ± 11.8 N·m | <0.01 | <0.01 |
| SP n = 10 | - | - | - | 144 ± 52 N·m | −6.89 ± 19 N·m | N’S | |||
| Taya, 2019 | ATIMT n = 1 | 29.8 kg | 29.2 kg | N/A | - | 164 N (D) 154 N (NO) | 223 N (D) 185 N (NO) | N/A | - |
| Studies | Groups | Peak VO2 (mL/kg/min) | VO2 AT (mL/kg/min) | CP (mmHg·mL/kg/min) | OUES (mL·min−1O2/Lmin−1VE) | ||||||||||||
|---|---|---|---|---|---|---|---|---|---|---|---|---|---|---|---|---|---|
| Pre | Post | p * | p ** | Pre | Post | p * | p ** | Pre | Post | p * | p ** | Pre | Post | p * | p ** | ||
| Mancini, 1995 | T.G. n = 8 | 11.4 ± 3.3 | 13.3 ± 2.7 | <0.05 | N/A | N/A | 7.8 ± 1.3 | N/A | N/A | - | - | - | - | - | - | - | - |
| Ctl. n = 6 | 16.1 ± 5.5 | 15 ± 6 | N’S | N/A | N/A | N/A | - | - | - | - | - | - | |||||
| Weiner, 1999 | IMT n = 10 | 13.1 ± 0.8 | N/A | N’S | N/A | - | - | - | - | - | - | - | - | - | - | - | - |
| C.IMT n = 6 | 13.5 ± 0.9 | N/A | N’S | - | - | - | - | - | - | - | - | - | |||||
| Martínez, 2001 | IMT n = 11 | 19 ± 3 | 21.6 ± 5 | <0.05 | N/A | - | - | - | - | - | - | - | - | - | - | - | - |
| C.IMT n = 9 | 16 ± 5 | 18.6 ± 7 | <0.05 | - | - | - | - | - | - | - | - | - | |||||
| Laoutaris, 2004 | IMT n = 20 | 15.4 ± 0.9 | 17.8 ± 1.2 | 0.002 | N/A | 13.1 ± 1 | 13.4 ± 1 | N’S | N/A | - | - | - | - | - | - | - | - |
| C.IMT n = 15 | 14.7 ± 1 | 14.7 ± 1 | N’S | 12.2 ± 1.1 | 11.3 ± 1 | N’S | - | - | - | - | - | - | |||||
| Dall’ago, 2006 | IMT n = 16 | 17 ± 0.6 | 21 ± 0.7 | <0.001 | <0.001 | - | - | - | - | 2829 ± 409 | 3696 ± 524 | <0.001 | <0.001 | - | - | - | - |
| S.IMT n = 16 | 17 ± 0.6 | 17 ± 0.8 | N’S | - | - | - | 2714 ± 505 | 2592 ± 421 | N’S | - | - | - | |||||
| Laoutaris, 2007 | H.IMT n = 15 | 17.3 ± 0.9 | 19.4 ± 1.2 | <0.01 | <0.01 | 14.3 ± 1.1 | 14.8 ± 1.2 | N’S | N’S | - | - | - | - | - | - | - | - |
| L.IMT n = 23 | 15.7 ± 0.8 | 14.8 ± 0.8 | N’S | 13.1 ± 0.9 | 11.5 ± 0.8 | N’S | - | - | - | - | - | - | |||||
| Laoutaris, 2008 | H.IMT n = 14 | 17.1 ± 0.7 | 19 ± 1.2 | 0.01 | N’S | 14.1 ± 1.1 | 14.4 ± 1.2 | N’S | N’S | 1908 ± 97 | 2343 ± 169 | 0.002 | N’S | - | - | - | - |
| L.IMT n = 9 | 17.7 ± 1.3 | 17.3 ± 1.5 | N’S | 14.8 ± 1.3 | 12.9 ± 1.4 | N’S | 2192 ± 232 | 2127 ± 225 | N’S | - | - | - | |||||
| Stein, 2009 | IMT n = 16 | - | - | - | - | - | - | - | - | - | - | - | - | 1554 ± 617 | 2037 ± 747 | <0.01 | <0.01 |
| S.IMT n = 16 | - | - | - | - | - | - | - | - | - | 1428 ± 626 | 1597 ± 615 | N’S | |||||
| Winkelmann, 2009 | ATIMT n = 12 | 15.1 ± 4.2 | 19.7 ± 4.1 | <0.001 | <0.001 | - | - | - | - | 2250 ± 815 | 3276 ± 857 | <0.001 | <0.001 | 1323 ± 766 | 2040 ± 545 | <0.001 | <0.1 |
| AT n = 12 | 16.1 ± 4.6 | 19.2 ± 4.2 | <0.001 | - | - | - | 2569 ± 880 | 3065 ± 869 | N’S | 1398 ± 657 | 1880 ± 617 | N’S | |||||
| Mello, 2012 | IMT n = 15 | 14.4 ± 0.7 | 18.9 ± 0.8 | 0.002 | <0.05 | - | - | - | - | - | - | - | - | - | - | - | - |
| Ctl. n = 12 | 16.2 ± 0.5 | 16.3 ± 0.6 | N’S | - | - | - | - | - | - | - | - | - | |||||
| Laoutaris, 2013 | ARIS n = 13 | 16.8 ± 5.2 | 19.6 ± 6.2 | 0.01 | N’S | - | - | - | - | 2337 ± 340 | 3089 ± 984 | 0.001 | 0.05 | - | - | - | - |
| AT n = 14 | 17.6 ± 3.6 | 19.5 ± 4.1 | 0.04 | - | - | - | 2527 ± 149 | 2697 ± 274 | 0.03 | - | - | - | |||||
| Adamopoulos, 2014 | ATIMT n = 21 | 17.3 ± 5.6 | 18.9 ± 5.3 | 0.008 | N’S | - | - | - | - | 2583 ± 1092 | 2799 ± 1051 | N’S | N’S | - | - | - | - |
| ATSIMT n = 22 | 18.6 ± 4.4 | 20.2 ± 5.5 | 0.04 | - | - | - | 2859 ± 901 | 3079 ± 1039 | N’S | - | - | - | |||||
| Palau, 2014 | IMT n = 14 | 10.3 (7.7–12.8) | 13.2 (10.6–14.6) | <0.001 | <0.001 | 8.4 (6.6–10) | 10.2 (9–11.6) | <0.001 | 0.001 | - | - | - | - | - | - | - | - |
| Ctl. n = 12 | 10 (6.8–10.9) | 9 (6.9–10.5) | N’S | 8 (6.3–9.3) | 7.4 (6.3–8) | N’S | - | - | - | - | - | - | |||||
| Palau, 2018 | IMT n = 15 | 9.9 ± 2.3 | 12.6 ± 3.4 | <0.001 | N/A | - | - | - | - | - | - | - | - | - | - | - | - |
| IMTFES n = 16 | 10.7 ± 2.9 | 12.9 ± 3.7 | <0.001 | - | - | - | - | - | - | - | - | - | |||||
| FES n = 15 | 9.6 ± 2.0 | 11.8 ± 2.6 | <0.001 | - | - | - | - | - | - | - | - | - | |||||
| Ctl. n = 13 | 9.3 ± 2.5 | 8.8 ± 2.6 | N’S | - | - | - | - | - | - | - | - | - | |||||
| Palau 2019 | IMT n = 45 | 10.4 ± 2.8 | 12.6 ± 3.2 | <0.001 | - | - | - | - | - | - | - | - | - | - | - | - | - |
| Hornikx 2019 | RHIIT n = 10 | 13.5 ± 3.7 | 3.4 ± 2.6 | <0.01 | N’S | - | - | - | - | - | - | - | - | - | - | - | - |
| SP n = 10 | 14.7 ± 3.6 | 3.3 ± 1.8 | <0.01 | - | - | - | - | - | - | - | - | - | |||||
| Taya, 2019 | AT + IMT n = 1 | 6.8 | 10.9 | N/A | - | - | - | - | - | - | - | - | - | - | - | - | - |
| Studies | Groups | VE/VCO2 Slope | VE (l/min) | ||||||
|---|---|---|---|---|---|---|---|---|---|
| Pre | Post | p-Value * | p-Value ** | Pre | Post | p-Value * | p-Value ** | ||
| Mancini, 1995 | Training n = 8 | 38.2 ± 5.9 | 38.3 ± 5.3 | N’S | N/A | 44 ± 15 | 55 ± 12 | <0.05 | N/A |
| Ctl. n = 6 | N/A | N/A | N/A | N/A | N/A | N/A | |||
| Martínez, 2001 | IMT n = 11 | N/A | N/A | N’S | N/A | - | - | - | - |
| C.IMT n = 9 | N/A | N/A | N’S | - | - | - | |||
| Laoutaris, 2004 | IMT n = 20 | 36.7 ± 1.6 | 36.2 ± 2.1 | N’S | N/A | 51.9 ± 3.9 | 63.6 ± 5.8 | 0.003 | N/A |
| C.IMT n = 15 | 40.5 ± 1 | 42.5 ± 2.3 | N’S | 54.5 ± 4.2 | 51.7 ± 3.2 | N’S | |||
| Dall’ago 2006 | IMT n = 16 | 35 ± 3.5 | 30 ± 3 | <0.001 | <0.001 | 48 ± 2.7 | 62 ± 4 | <0.001 | <0.001 |
| S.IMT n = 16 | 37 ± 4 | 37 ± 4 | N’S | 47 ± 3 | 49 ± 4 | N’S | |||
| Laoutaris, 2007 | H.IMT n = 15 | 33.9 ± 2.2 | 33.4 ± 2 | N’S | <0.05 | 56.9 ± 4.7 | 63.5 ± 6.6 | N’S | N’S |
| LIMT n = 23 | 38.9 ± 1.5 | 40.4 ± 1.8 | N’S | 57.3 ± 3.4 | 55.3 ± 2.8 | N’S | |||
| Laoutaris, 2008 | H.IMT n = 14 | 34.2 ± 2.1 | 33.9 ± 2.1 | N’S | N’S | 57.2 ± 5.1 | 64.1 ± 7.1 | N’S | N’S |
| L.IMT n = 9 | 35.3 ± 2.3 | 35.2 ± 2.4 | N’S | 61.3 ± 5.2 | 61 ± 4.2 | N’S | |||
| Winkelmann, 2009 | ATIMT n = 12 | 44 ± 5 | 30 ± 7 | <0.001 | <0.001 | 48 ± 21 | 56 ± 30 | <0.001 | N’S |
| AT n = 12 | 37 ± 7 | 33 ± 6 | N’S | 48 ± 17 | 52 ± 13 | N’S | |||
| Mello, 2012 | IMT n = 15 | 37.3 ± 1.1 | 31.3 ± 1.1 | 0.001 | <0.05 | - | - | - | - |
| Ctl. n = 12 | 36.6 ± 1.2 | 38.7 ± 3 | N’S | - | - | - | |||
| Laoutaris, 2013 | ARIS n = 13 | 37.9 ± 6.4 | 35.8 ± 5.8 | 0.009 | N’S | 66.9 ± 39 | 70 ± 29 | N’S | N’S |
| AT n = 14 | 35.9 ± 4.8 | 34.8 ± 5.4 | N’S | 54.1 ± 13 | 58.4 ± 12 | N’S | |||
| Adamopoulos, 2014 | ATIMT n = 21 | 36.4 ± 5.6 | 35.8 ± 6.6 | N’S | N’S | 63.3 ± 20.3 | 73.6 ± 17.3 | 0.002 | N’S |
| ATSIMT n = 22 | 37.5 ± 6.9 | 36.2 ± 6.4 | N’S | 64.2 ± 15.6 | 65.3 ± 14.1 | N’S | |||
| Palau, 2014 | IMT n = 14 | 31 (23–35.1) | 26 (22–30) | 0.016 | 0.007 | - | - | - | - |
| Ctl. n = 12 | 33.8 (26.5–40) | 34.9 (30–41) | N’S | - | - | - | |||
| Palau, 2018 | IMT n = 15 | 38.5 ± 5.7 | 35.3 ± 5.8 | 0.011 | N/A | - | - | - | - |
| IMT + FES n = 16 | 38.4 ± 4.5 | 35.4 ± 4.5 | 0.009 | - | - | - | |||
| FES n = 15 | 35.1 ± 4.5 | 34.5 ± 6.3 | N’S | - | - | - | - | ||
| Ctl. n = 13 | 37.9 ± 6.3 | 37 ± 5.9 | N’S | - | - | - | |||
| Hornikx, 2019 | RHIIT n = 10 | 39 ± 12 | −4.4 ± 12 | N’S | N’S | - | - | - | - |
| SP n = 10 | 34 ± 7 | +1.3 ± 9.8 | N’S | - | - | - | |||
| Taya, 2019 | AT + IMT n = 1 | 57.5 | 45.3 | N/A | - | - | - | - | - |
| Studies | Groups | HR at Rest (bpm) | Maximum HR (bpm) | LVEF (%) | LVEDD (mm) | ||||||||||||
|---|---|---|---|---|---|---|---|---|---|---|---|---|---|---|---|---|---|
| Pre | Post | p * | p ** | Pre | Post | p * | p ** | Pre | Post | p * | p ** | Pre | Post | p * | p ** | ||
| Laoutaris, 2004 | IMT n = 20 | 80.2 ± 3 | 76.8 ± 3.3 | 0.04 | N/A | 134.9 ± 5.5 | 132.3 ± 5.9 | N’S | N/A | 23.5 ± 1.5 | 24.5 ± 1.5 | N’S | N/A | 70.94 ± 2.1 | 70.89 ± 2 | N’S | N/A |
| C.IMT n = 15 | 78.6 ± 5.3 | 76.1 ± 4.7 | N’S | 129.7 ± 6.5 | 129.3 ± 8.6 | N’S | 25.7 ± 2.1 | 25.3 ± 2.2 | N’S | 67.47 ± 2.9 | 68.13 ± 2.9 | N’S | |||||
| Laoutaris, 2007 | H.IMT n = 15 | 82 ± 5 | 81 ± 3 | N’S | N’S | 140 ± 7 | 134 ± 6 | <0.05 | N’S | - | - | - | - | - | - | - | - |
| L.IMT n = 23 | 82 ± 4 | 81 ± 4 | N’S | 133 ± 5 | 132 ± 6 | N’S | - | - | - | - | - | - | |||||
| Laoutaris, 2008 | H.IMT n = 14 | 83 ± 6 | 80 ± 3 | N’S | N’S | 140 ± 8 | 134 ± 7 | 0.03 | N’S | - | - | - | - | - | - | - | - |
| L.IMT n = 9 | 86 ± 5 | 89 ± 5 | N’S | 140 ± 7 | 138 ± 8 | N’S | - | - | - | - | - | - | |||||
| Winkelmann, 2009 | ATIMT n = 12 | - | - | - | - | 136 ± 24 | 135 ± 33 | N’S | N’S | - | - | - | - | - | - | - | - |
| AT n = 12 | - | - | - | 144 ± 26 | 142 ± 24 | N’S | - | - | - | - | - | - | |||||
| Mello, 2012 | IMT n = 15 | 70.3 ± 3.3 | 68.5 ± 3.4 | N’S | N/A | - | - | - | - | - | - | - | - | - | - | - | - |
| Ctl. n = 12 | 65.6 ± 3 | 63.6 ± 2.3 | N’S | - | - | - | - | - | - | - | - | - | |||||
| Laoutaris, 2013 | ARIS n = 13 | 76 ± 16 | 71 ± 18 | N’S | N’S | 130 ± 26 | 134 ± 21 | N’S | N’S | 27.8 ± 8 | 30.4 ± 8.2 | 0.003 | N’S | 69.4 ± 4.6 | 67.5 ± 3.9 | 0.01 | N’S |
| AT n = 14 | 81 ± 12 | 78 ± 12 | N’S | 140 ± 18 | 141 ± 17 | N’S | 30.6 ± 5.4 | 33.4 ± 5.7 | 0.01 | 66.1 ± 3.8 | 65.3 ± 3.7 | N’S | |||||
| Adamopoulos, 2014 | ATIMT n = 21 | 74 ± 11 | 76 ± 12 | N’S | N’S | 124 ± 21 | 129 ± 24 | N’S | N’S | 28 ± 7 | 36 ± 11 | 0.005 | N’S | 65 ± 9 | 64 ± 9 | N’S | N’S |
| ASIMT n = 22 | 78 ± 15 | 76 ± 11 | N’S | 140 ± 26 | 138 ± 23 | N’S | 30 ± 5 | 36 ± 9 | 0.002 | 63 ± 7 | 62 ± 6 | N’S | |||||
| Palau, 2014 | IMT n = 14 | 72 (63–82) | 67 (54–71) | <0.001 | 0.01 | 121 (102–134) | 124 (104–138) | 0.004 | 0.004 | 69 (63–77) | 68 (60–72) | N’S | N’S | - | - | - | - |
| Ctl. n = 12 | 69 (61–90) | 70 (63–82) | N’S | 113 (110–125) | 111 (98–119) | <0.001 | 76 (68–83) | 78 (69–81) | N’S | - | - | - | |||||
| Moreno, 2017 | IMT n = 15 | 70 ± 12 | 63 ± 5.8 | <0.05 | N/A | - | - | - | - | - | - | - | - | - | - | - | - |
| Ctl. n = 13 | 69 ± 16.5 | 68 ± 9.8 | N’S | - | - | - | - | - | - | - | - | - | |||||
| Studies | Groups | NT-proBNP (pg/mL) | CRP (ng/l) | CA-125 (U/mL) | |||||||||
|---|---|---|---|---|---|---|---|---|---|---|---|---|---|
| Pre | Post | p-Value * | p-Value ** | Pre | Post | p-Value * | p-Value ** | Pre | Post | p-Value * | p-Value ** | ||
| Laoutaris, 2007 | H.IMT n = 15 | - | - | - | - | 7.3 ± 2.6 | 8.5 ± 2.7 | N’S | N’S | - | - | - | - |
| L.IMT n = 23 | - | - | - | 7.1 ± 1.9 | 8.1 ± 1.8 | N’S | - | - | - | ||||
| Laoutaris, 2008 | H.IMT n = 14 | 527 ± 74 | 530 ± 78 | N’S | N’S | - | - | - | - | - | - | - | - |
| L.IMT n = 9 | 675 ± 126 | 637 ± 121 | N’S | - | - | - | - | - | - | ||||
| Marco, 2013 | H.IMT n = 11 | 1677 (SD 1658) | 1593 (SD 1308) | N/A | N’S | 0.6 (SD 0.6) | 0.4 (SD 0.4) | N/A | N’S | - | - | - | - |
| S.IMT n = 11 | 2212 (SD 3155) | 2294 (SD 3567) | N/A | 1.5 (SD 1.5) | 3.3 (SD 3.9) | N/A | - | - | - | ||||
| Adamopoulos, 2014 | ATIMT n = 21 | 1046 ± 766 | 790 ± 683 | N’S | 0.004 | 2.8 ± 1.5 | 1.4 ± 0.8 | 0.05 | 0.03 | - | - | - | - |
| ATSIMT n = 22 | 1525 ± 1657 | 1866 ± 1196 | N’S | 4.6 ± 5.8 | 3.5 ± 2.9 | N’S | - | - | - | ||||
| Palau, 2014 | IMT n = 14 | 983 (325–1932) | 674 (127–1878) | N’S | N’S | - | - | - | - | 13 (8–29) | 12 (7–23) | N’S | N’S |
| Ctl. n = 12 | 1314 (255–1868) | 1525 (204–2799) | N’S | - | - | - | 16 (11–36) | 22 (14–37) | N’S | ||||
| Palau, 2018 | IMT n = 15 | 1316 (282–3546) | 910 (183–2301) | N’S | N/A | - | - | - | - | 15 (9–49) | 13 (8–19) | N’S | N/A |
| IMT + FES n = 16 | 767 (369–1974) | 615 (344–1242) | N’S | - | - | - | 18 (10–23) | 17 (10–21) | N’S | ||||
| FES n = 15 | 567 (302–1583) | 667 (247–1310) | N’S | - | - | - | 15 (8–19) | 14 (10–16) | N’S | ||||
| Ctl. n = 13 | 755 (383–999 | 983 (246–1193) | N’S | - | - | - | 11 (9–18) | 16 (8–21) | N’S | ||||
| Studies | Groups | MLwHFQ | SF-36 | CHFJ | |||||||||
|---|---|---|---|---|---|---|---|---|---|---|---|---|---|
| Pre | Post | p-Value * | p-Value ** | Pre | Pro | p-Value * | p-Value ** | Pre | Post | p-Value * | p-Value ** | ||
| Johnson, 1998 | IMT n = 8 | - | - | - | - | - | - | - | - | 5.3 ± 0.9 | +0.55 ± 0.48 | N/A | N’S |
| C.IMT n = 8 | - | - | - | - | - | - | 4.6 ± 0.8 | +0.06 ± 0.38 | N/A | ||||
| Laoutaris, 2004 | IMT n = 20 | 25.2 ± 4 | 21.1 ± 3.5 | 0.004 | N/A | - | - | - | - | - | - | - | - |
| C.IMT n = 15 | 22.9 ± 2.6 | 22.6 ± 2.5 | N’S | - | - | - | - | - | - | ||||
| Dall’ago, 2006 | IMT n = 16 | 27 ± 4 | 6 ± 2 | N/A | <0.001 | - | - | - | - | - | - | - | - |
| S.IMT n = 16 | 30 ± 13 | 30 ± 13 | N/A | - | - | - | - | - | - | ||||
| Padula, 2009 | IMT n = 15 | - | - | - | - | 29.15 | N/A | N’S | N’S | - | - | - | - |
| C.IMT n = 17 | - | - | - | 29.11 | N/A | N’S | - | - | - | ||||
| Winkelmann, 2009 | ATIMT n = 12 | 45 ± 21 | 20 ± 15 | <0.001 | N/A | - | - | - | - | - | - | - | - |
| AT n = 12 | 45 ± 18 | 18 ± 15 | <0.05 | - | - | - | - | - | - | ||||
| Bosnak-Guclu, 2011 | IMT n = 16 | - | - | - | - | 46 ± 28 (p) | 67 ± 24 (p) | <0.001 | N’S (p) | - | - | - | - |
| 58 ± 24 (M) | 70 ± 21 (M) | 0.004 | |||||||||||
| S.IMT n = 14 | - | - | - | 52 ± 23 (p) | 69 ± 22 (p) | <0.001 | N’S (M) | - | - | - | |||
| 55 ± 24 (M) | 72 ± 22 (M) | 0.001 | |||||||||||
| Mello, 2012 | IMT n = 15 | 26.6 ± 3.8 | 9.2 ± 2.4 | <0.05 | <0.05 | - | - | - | - | - | - | - | - |
| Ctl. n = 12 | 30.8 ± 6.1 | 32.7 ± 5.6 | N’S | - | - | - | - | - | - | ||||
| Laoutaris, 2013 | ARIS n = 13 | 41.6 ± 3.6 | 33.7 ± 3.2 | <0.001 | 0.03 | - | - | - | - | - | - | - | - |
| AT n = 14 | 42.4 ± 4.8 | 37.8 ± 7 | N’S | - | - | - | - | - | - | ||||
| Marco, 2013 | IMT n = 11 | - | - | - | - | N/A | N/A | N/A | N/A | - | - | - | - |
| S.IMT n = 11 | - | - | - | N/A | N/A | N/A | - | - | - | ||||
| Adamopoulos, 2014 | AT + IMT n = 21 | 38 ± 10.4 | 27.7 ± 11.3 | <0.001 | 0.002 | - | - | - | - | - | - | - | - |
| AT + S.IMT n = 22 | 42 ± 8.1 | 38.8 ± 8.4 | N’S | - | - | - | - | - | - | ||||
| Palau, 2014 | IMT n = 14 | 41 (34–48) | 30 (25–35) | 0.002 | 0.037 | - | - | - | - | - | - | - | - |
| Ctl. n = 12 | 48 (25–61) | 45 (24–52) | N’S | - | - | - | - | - | - | ||||
| Kawauchi, 2017 | MIRPT n = 13 | 36 ± 23 | 20 ± 10 | <0.05 | N’S *** | - | - | - | - | - | - | - | - |
| LIRPT n = 13 | 42 ± 24 | 28 ± 19 | <0.05 | N’S *** | - | - | - | - | - | - | - | - | |
| Ctl. n = 9 | 37 ± 25 | 28 ± 21 | <0.05 | - | - | - | - | - | - | - | - | - | |
| Moreno, 2017 | IMT n = 15 | N/A | N/A | <0.001 | <0.01 | - | - | - | - | - | - | - | - |
| Ctl. n = 13 | N/A | N/A | N’S | - | - | - | - | - | - | ||||
| Palau, 2018 | IMT n = 15 | 42.3 ± 16.5 | 27.2 ± 14.5 | <0.001 | n/A | - | - | - | - | - | - | - | - |
| IMT + FES n = 16 | 34.9 ± 21.6 | 25.3 ± 14.1 | <0.001 | - | - | - | - | - | - | ||||
| FES n = 15 | 39.7 ± 21.2 | 31.1 ± 20.5 | 0.014 | - | - | - | - | - | - | ||||
| Ctl. n = 13 | 42.8 ± 21.3 | 40.4 ± 22.4 | N’S | - | - | - | - | - | - | ||||
| Hornikx, 2019 | RHIIT n = 10 | 33 ± 17 | −18.2 ± 13.1 | <0.01 | N’S | - | - | - | - | - | - | - | - |
| SP n = 10 | 24 ± 20 | −10.4 ± 19.5 | N’S | - | - | - | - | - | - | ||||
© 2020 by the authors. Licensee MDPI, Basel, Switzerland. This article is an open access article distributed under the terms and conditions of the Creative Commons Attribution (CC BY) license (http://creativecommons.org/licenses/by/4.0/).
Share and Cite
Fernandez-Rubio, H.; Becerro-de-Bengoa-Vallejo, R.; Rodríguez-Sanz, D.; Calvo-Lobo, C.; Vicente-Campos, D.; Chicharro, J.L. Inspiratory Muscle Training in Patients with Heart Failure. J. Clin. Med. 2020, 9, 1710. https://doi.org/10.3390/jcm9061710
Fernandez-Rubio H, Becerro-de-Bengoa-Vallejo R, Rodríguez-Sanz D, Calvo-Lobo C, Vicente-Campos D, Chicharro JL. Inspiratory Muscle Training in Patients with Heart Failure. Journal of Clinical Medicine. 2020; 9(6):1710. https://doi.org/10.3390/jcm9061710
Chicago/Turabian StyleFernandez-Rubio, Hugo, Ricardo Becerro-de-Bengoa-Vallejo, David Rodríguez-Sanz, César Calvo-Lobo, Davinia Vicente-Campos, and J. L. Chicharro. 2020. "Inspiratory Muscle Training in Patients with Heart Failure" Journal of Clinical Medicine 9, no. 6: 1710. https://doi.org/10.3390/jcm9061710
APA StyleFernandez-Rubio, H., Becerro-de-Bengoa-Vallejo, R., Rodríguez-Sanz, D., Calvo-Lobo, C., Vicente-Campos, D., & Chicharro, J. L. (2020). Inspiratory Muscle Training in Patients with Heart Failure. Journal of Clinical Medicine, 9(6), 1710. https://doi.org/10.3390/jcm9061710