Effectiveness and Safety of Oral Anticoagulants among NVAF Patients with Obesity: Insights from the ARISTOPHANES Study


Abstract
1. Introduction
2. Experimental Section
2.1. Data Sources
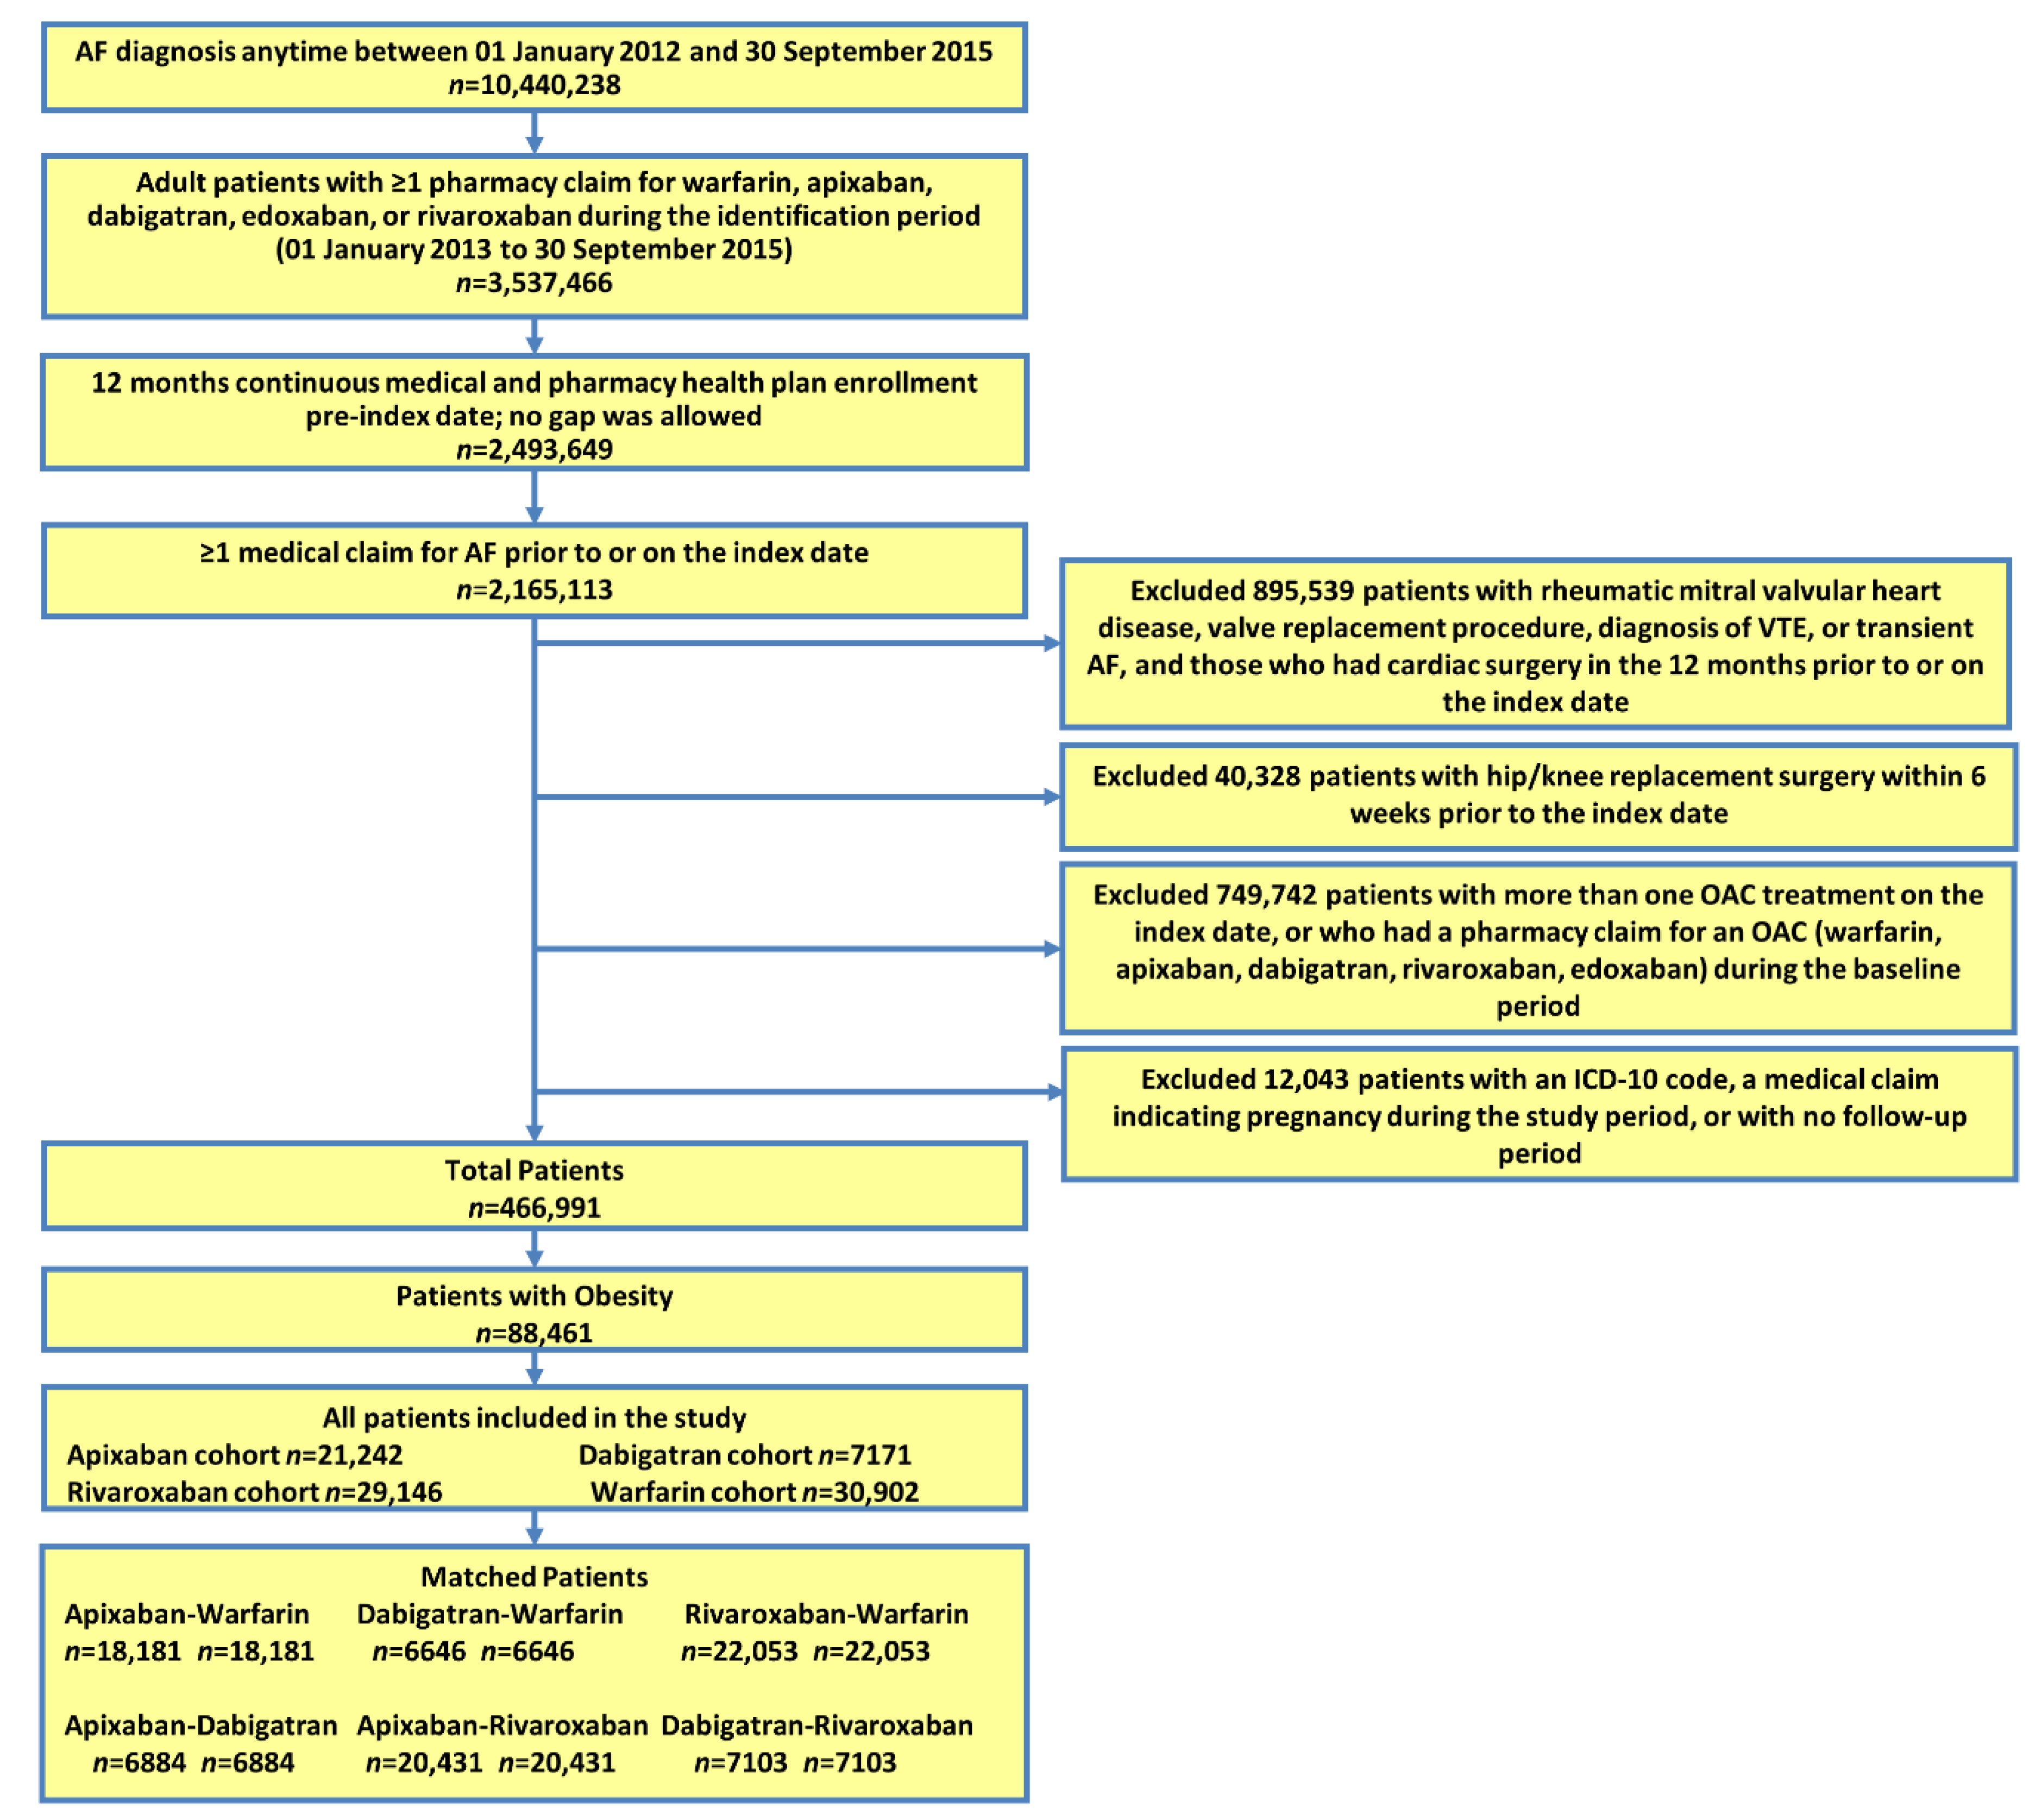
2.2. Patient Selection
2.3. Outcome Measures
2.4. Statistical Methods
2.5. Subgroup Analyses
3. Results
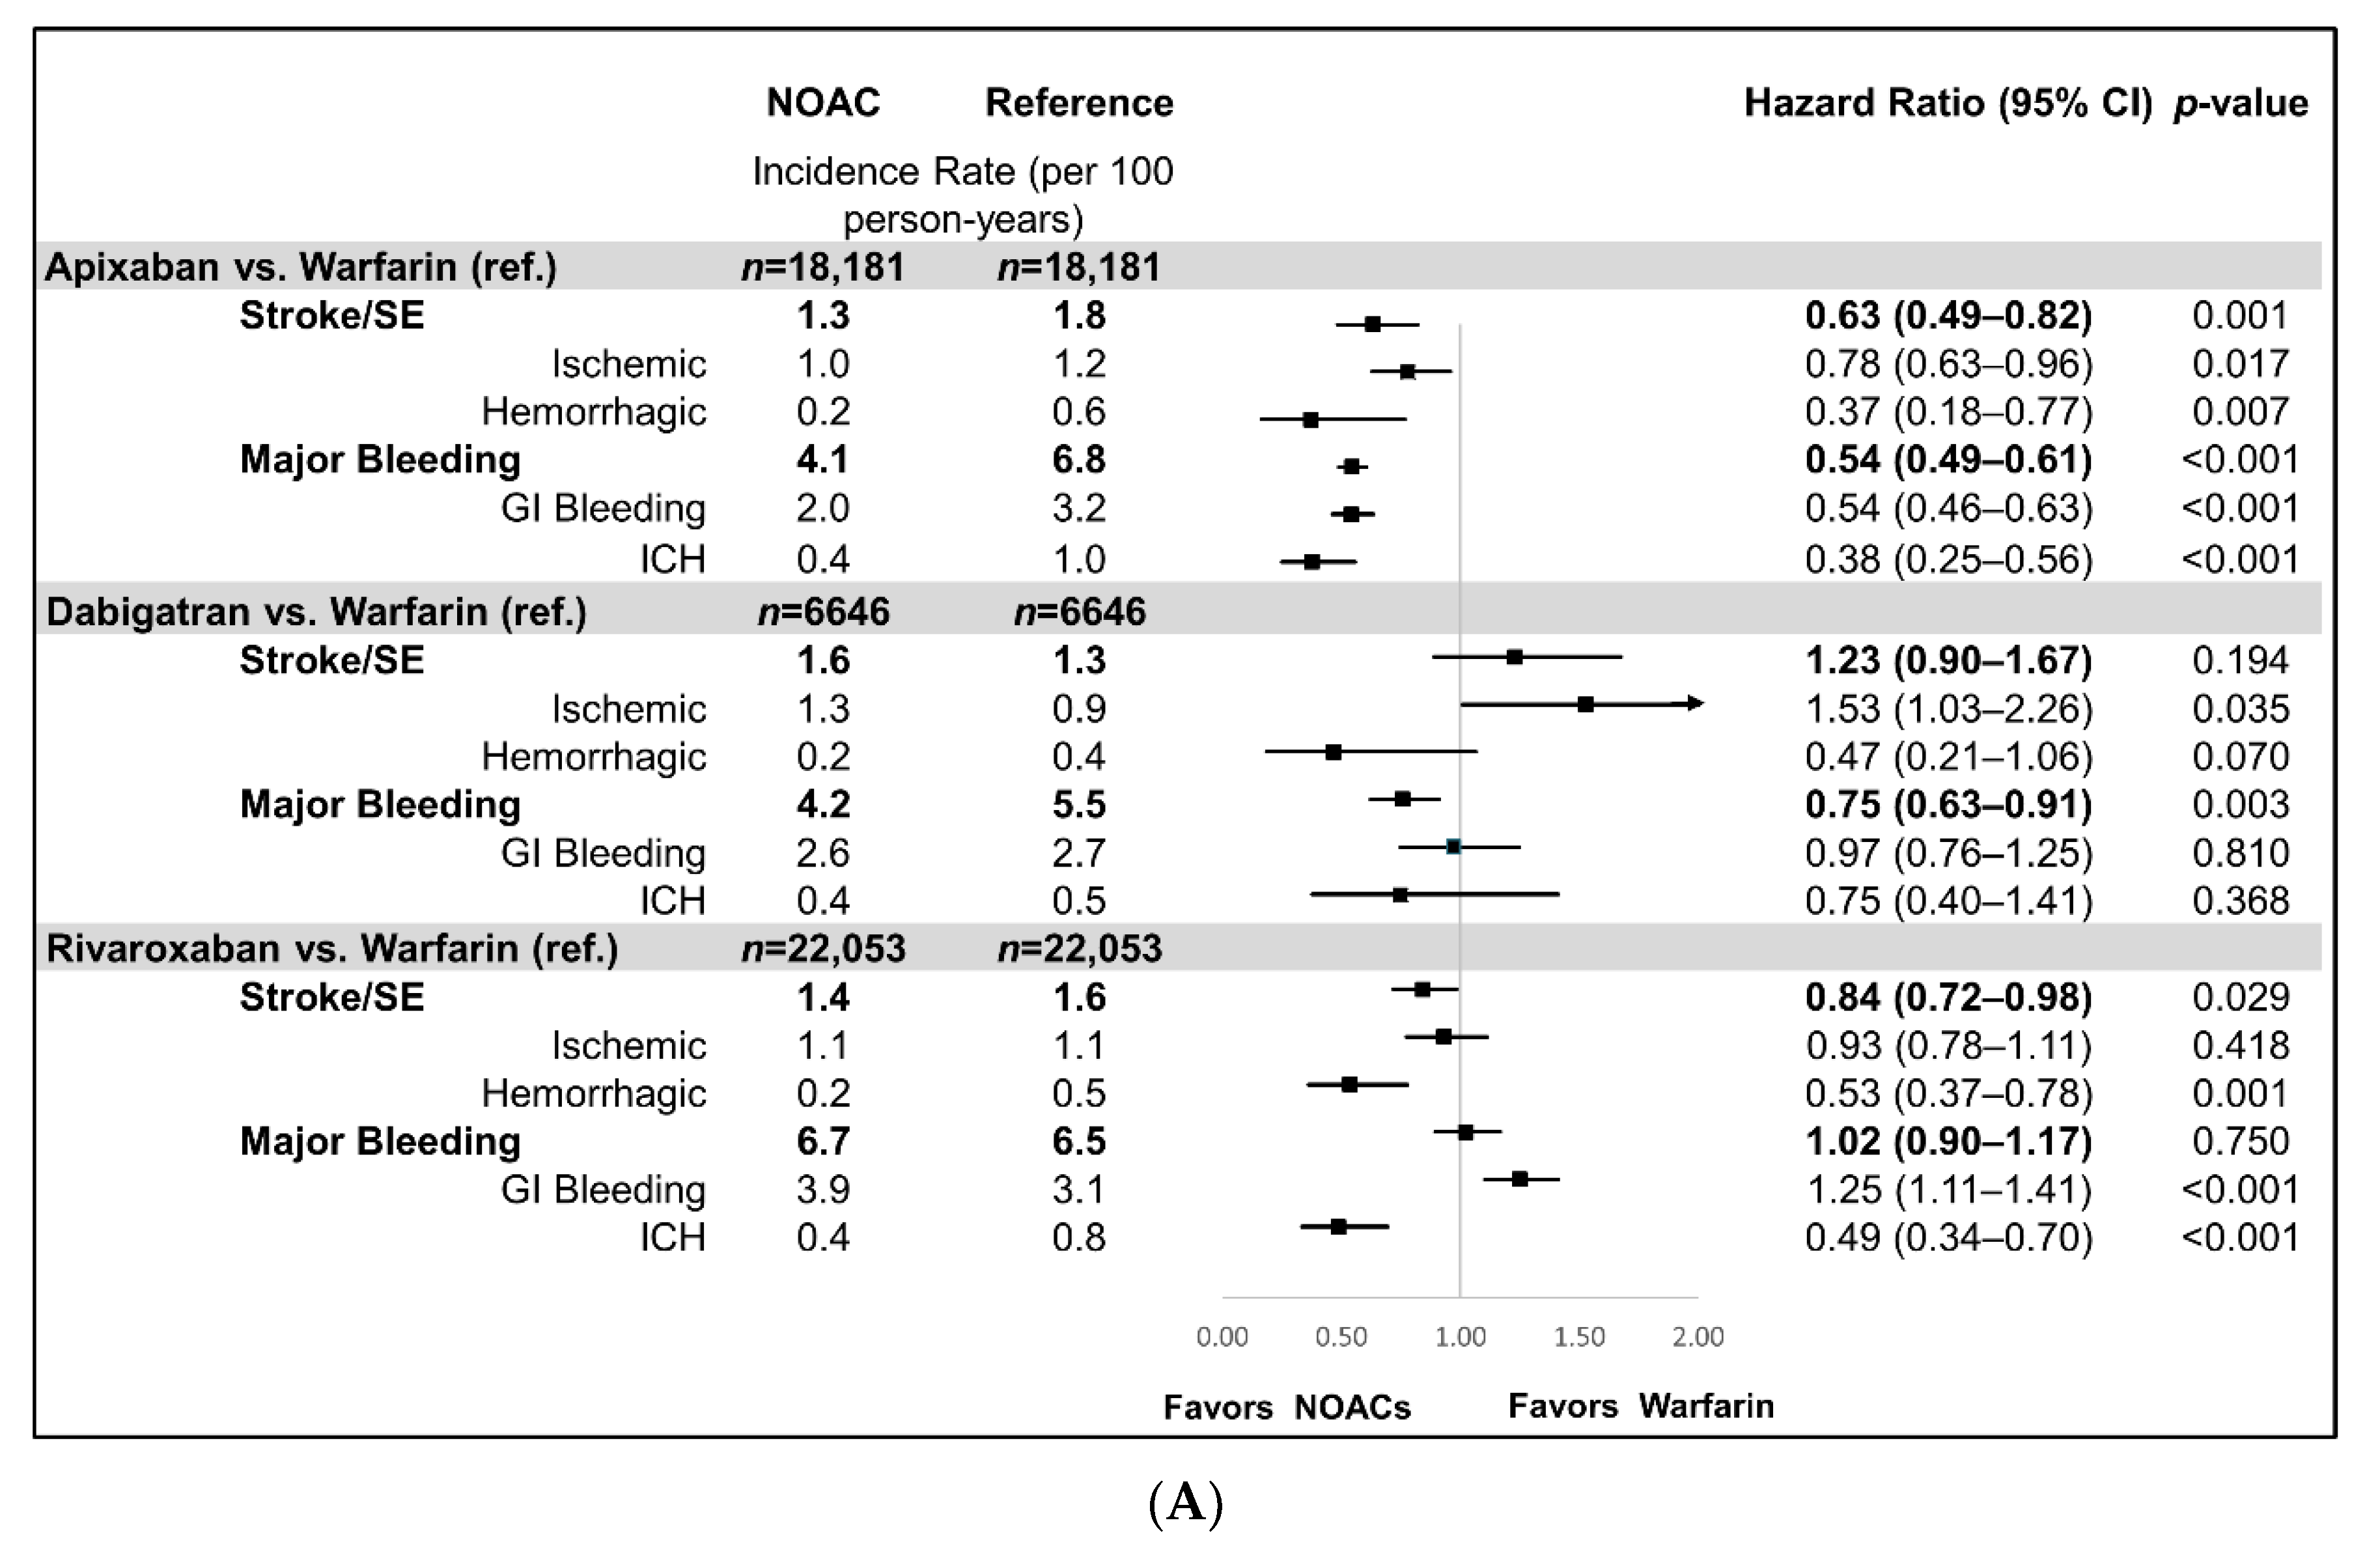
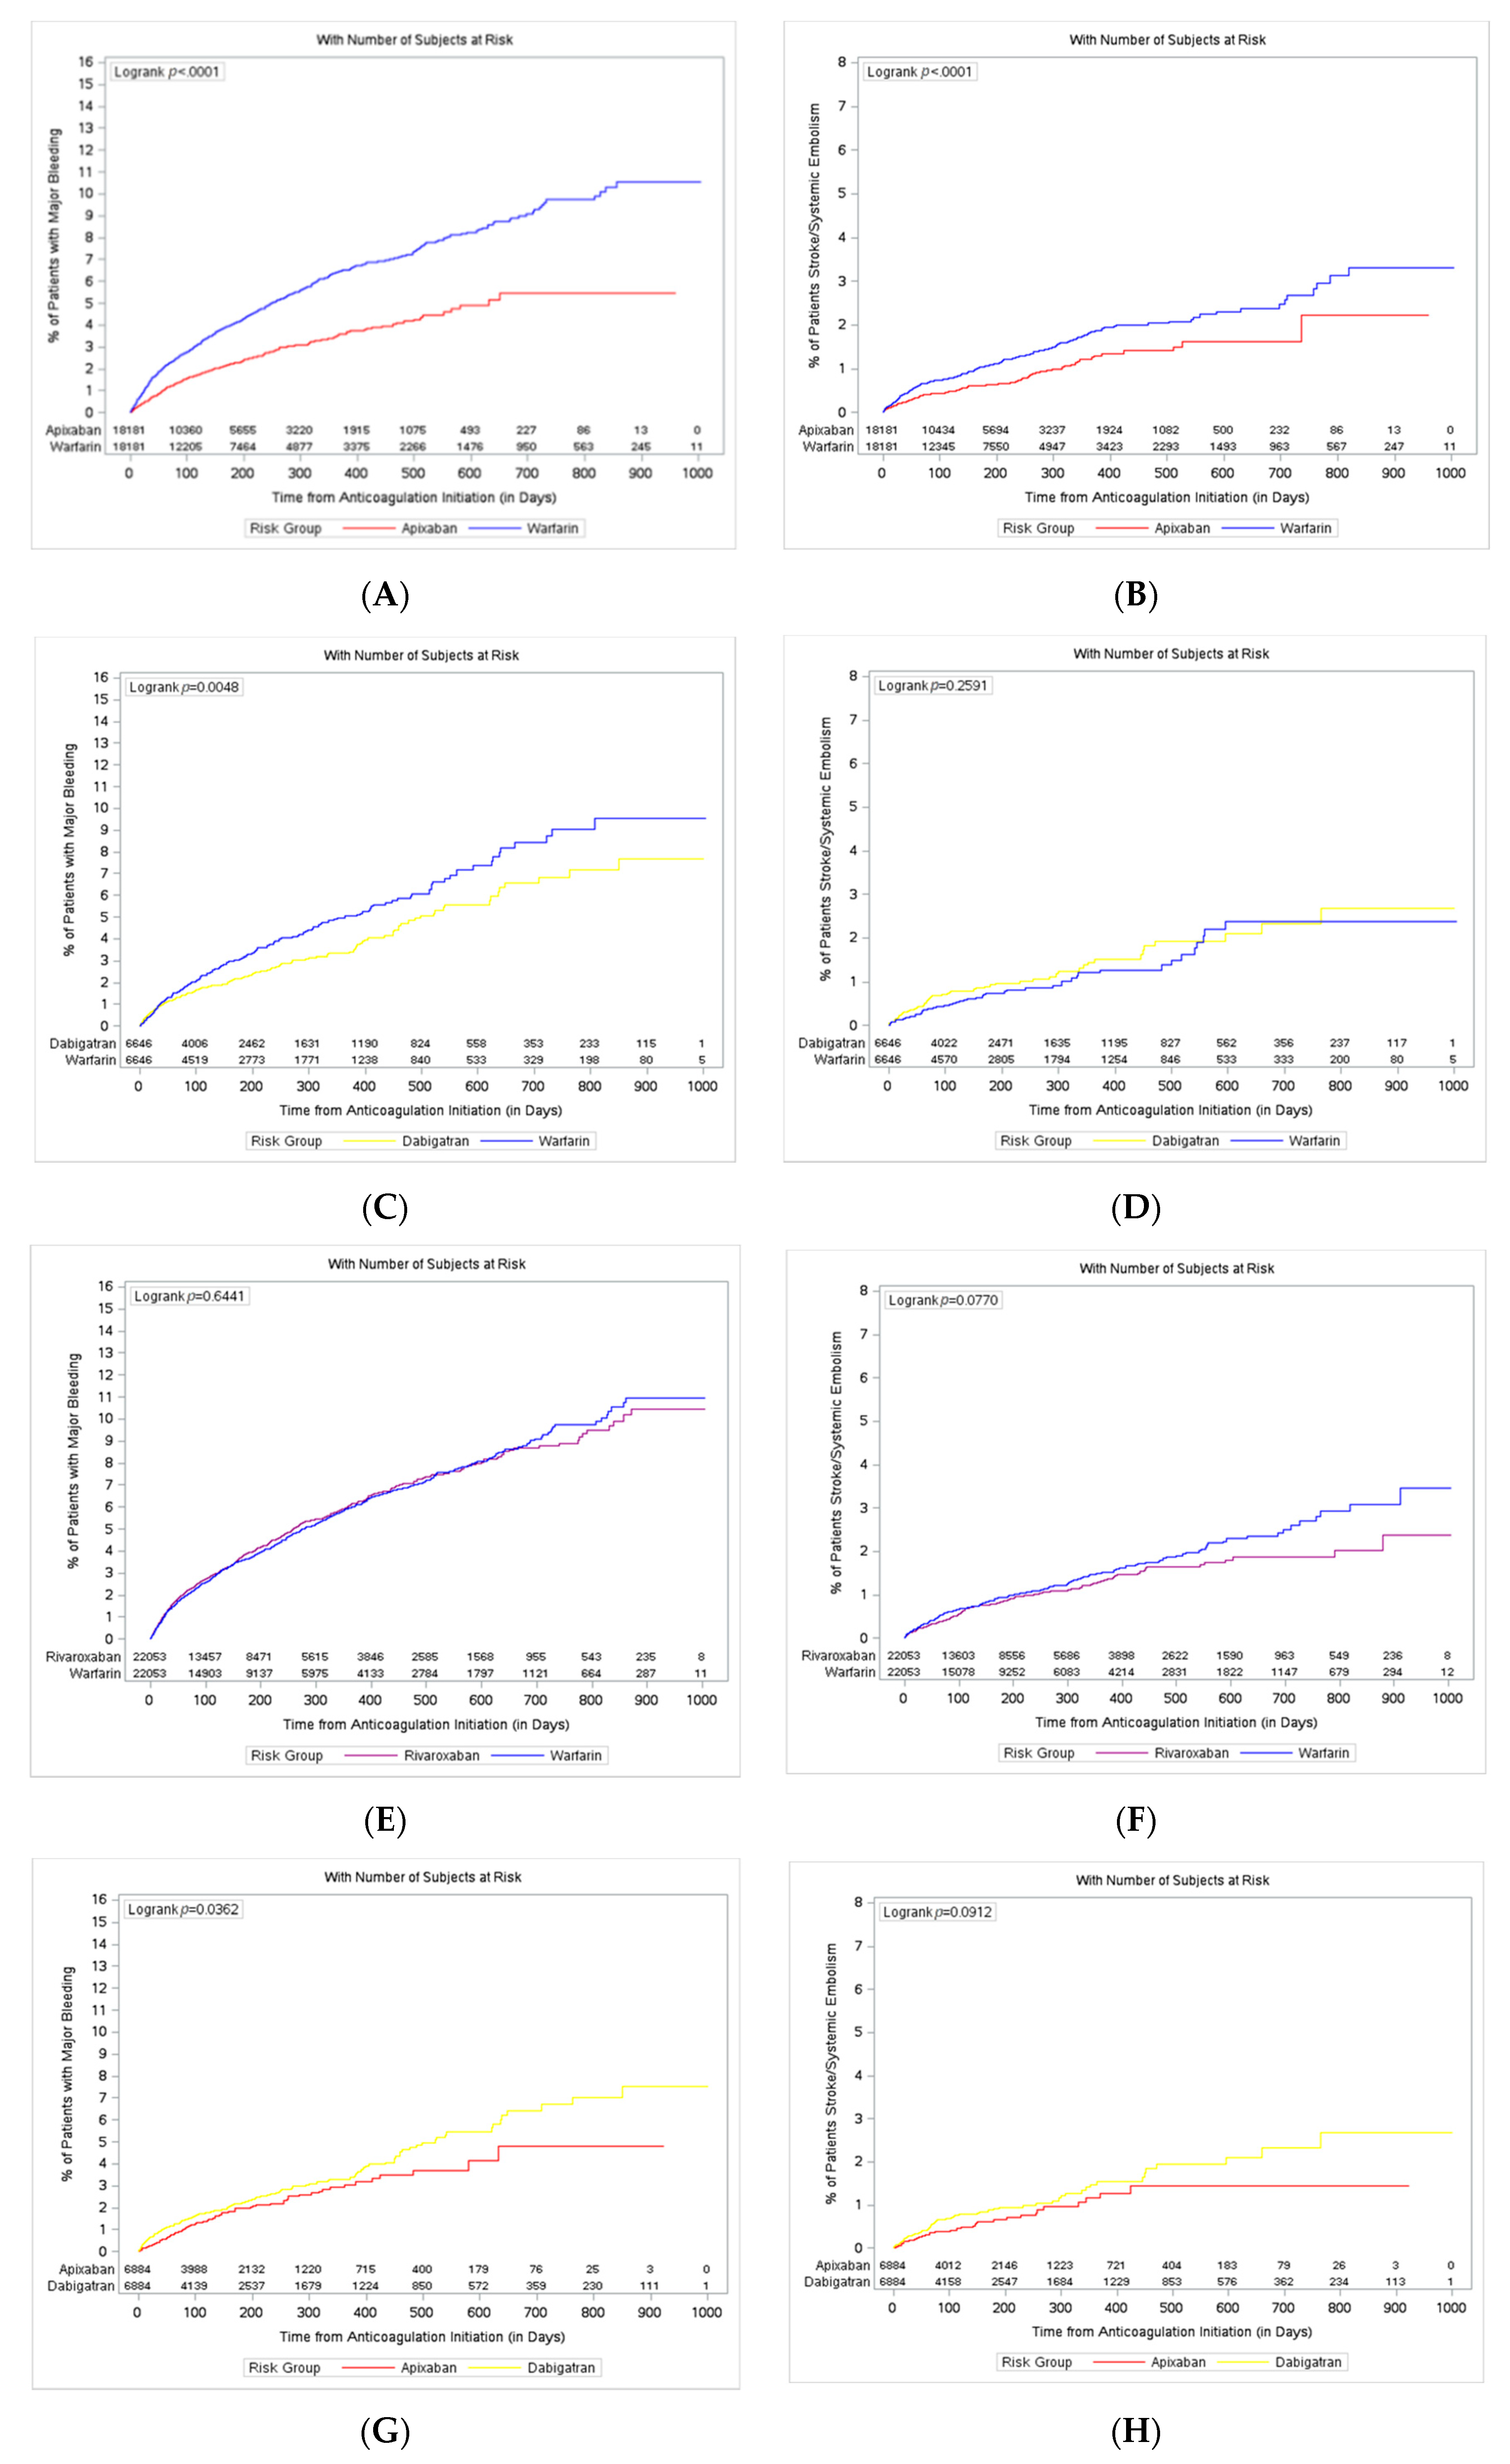
3.1. NOAC vs. Warfarin Comparison
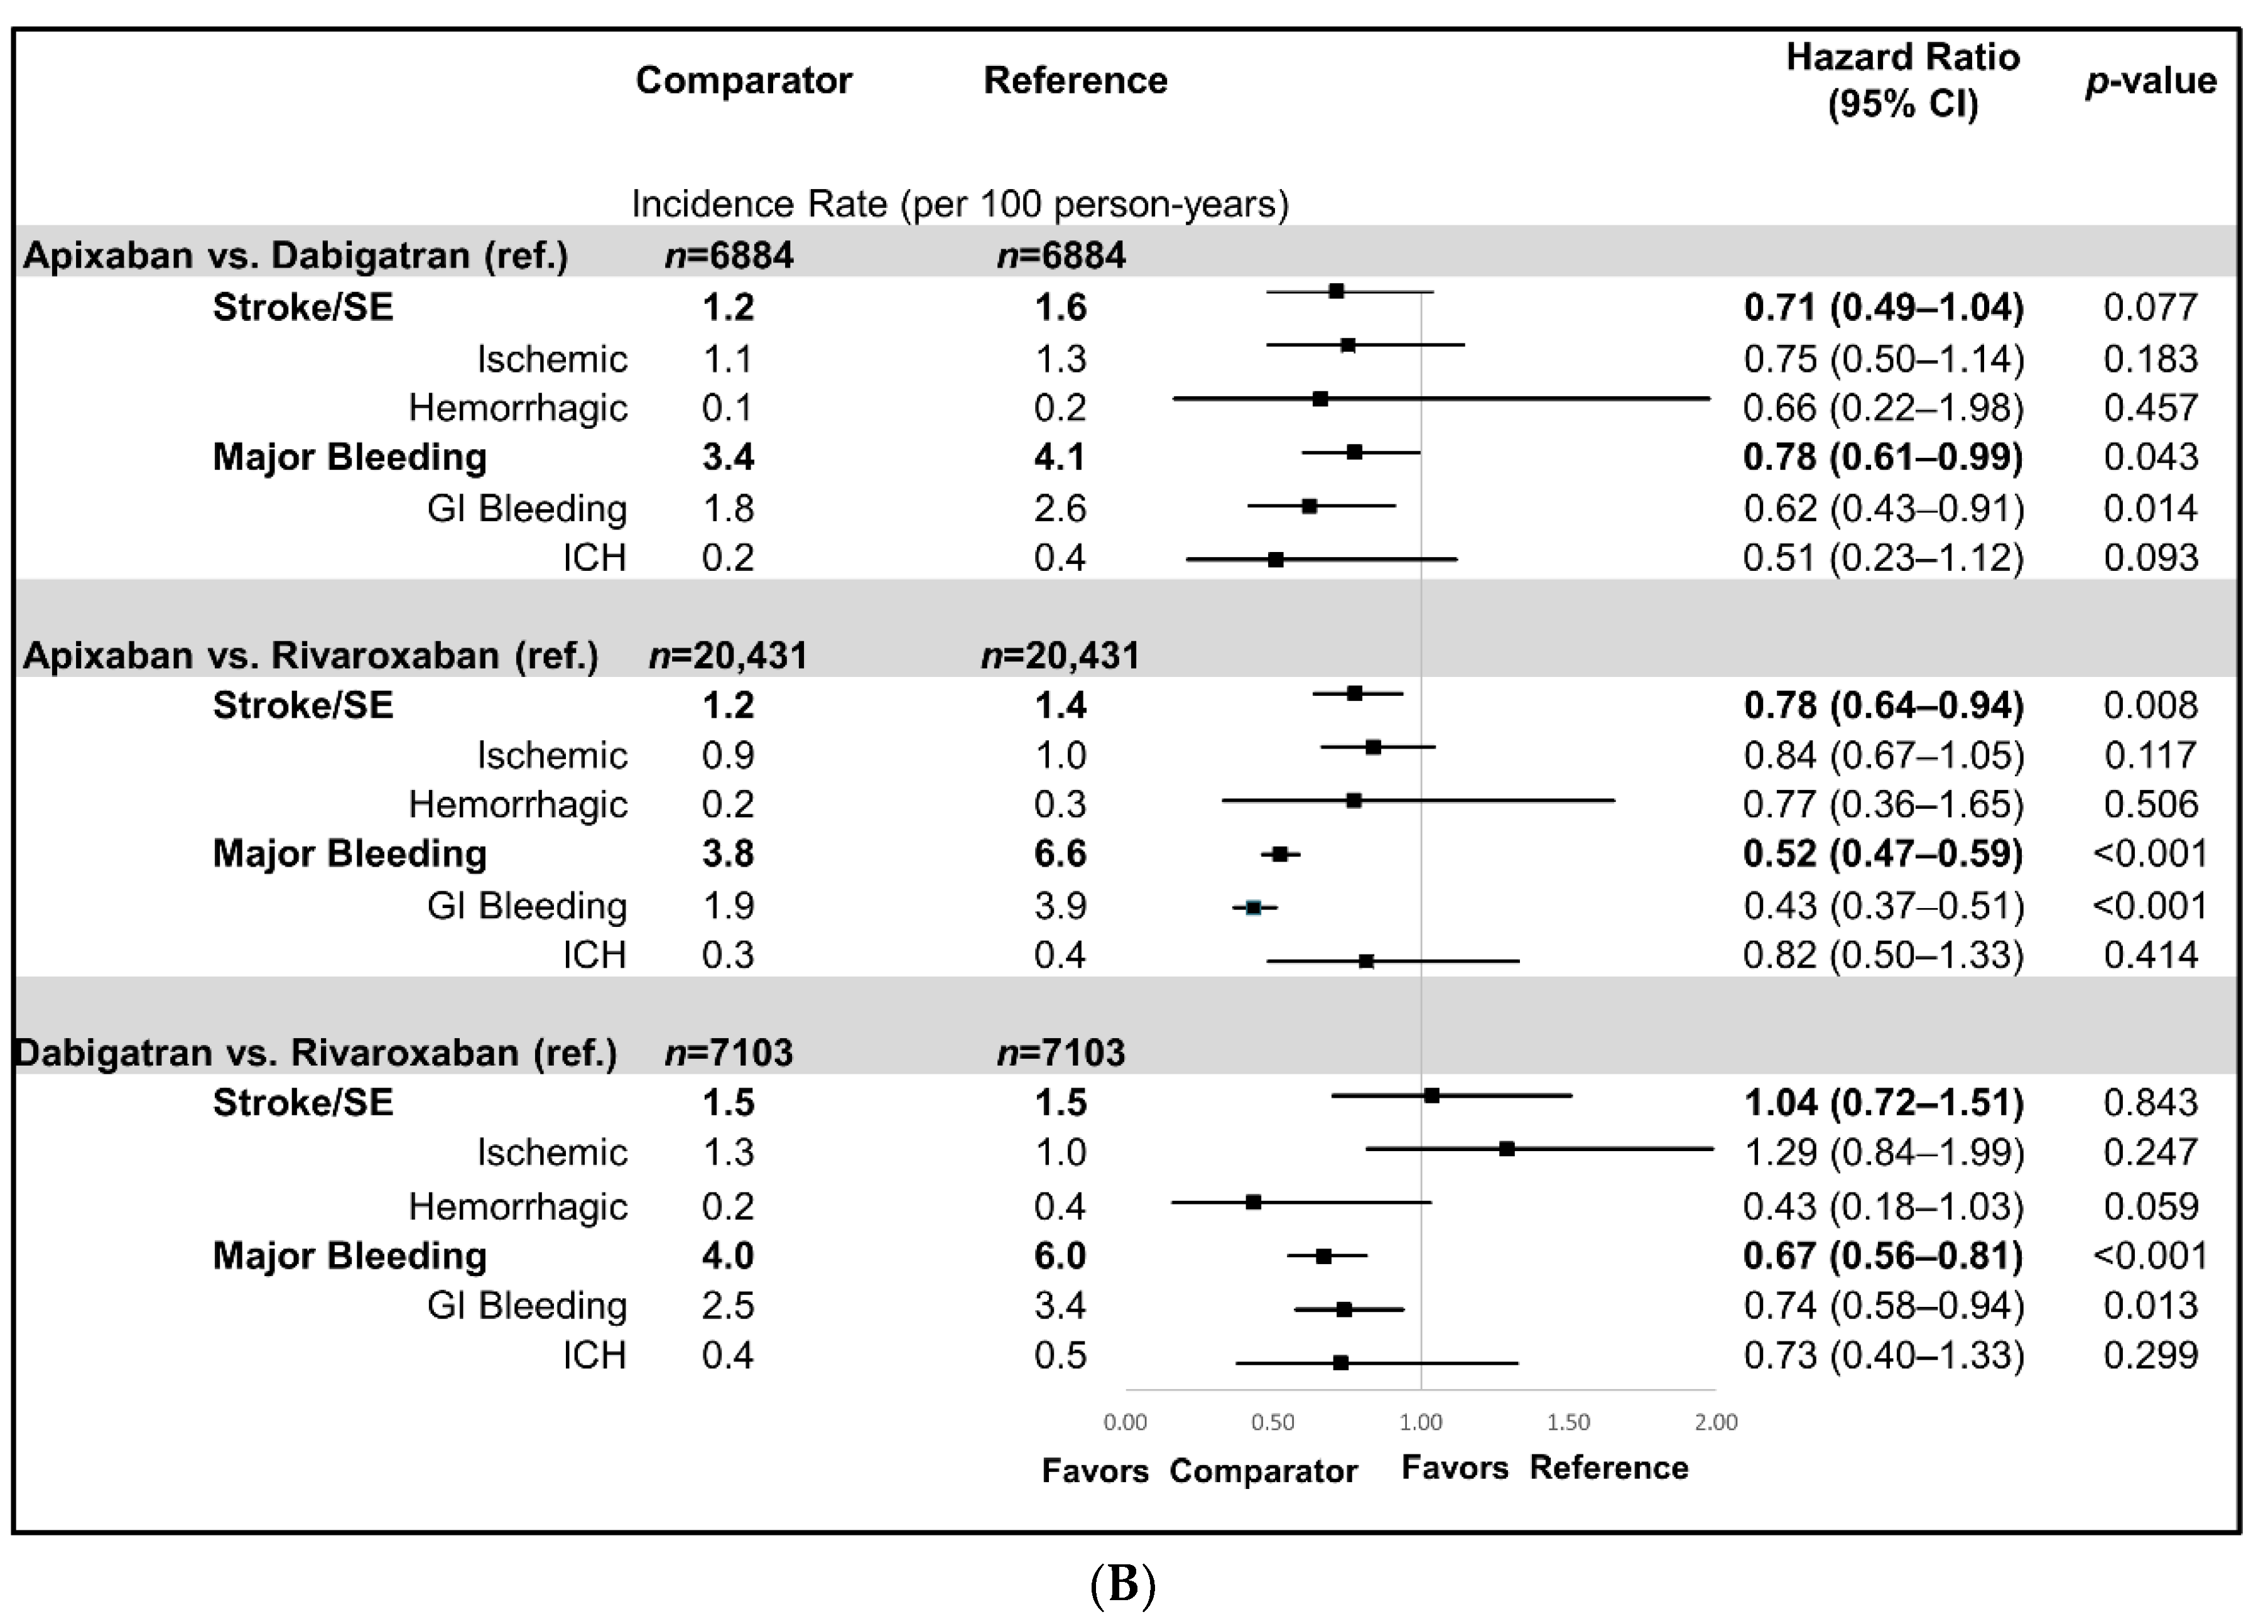
3.2. NOAC vs. NOAC Comparisons
3.3. Subgroup Analyses
4. Discussion
5. Limitations
6. Conclusions
Author Contributions
Funding
Conflicts of Interest
Appendix A

| Diagnosis | ICD-9-CM Diagnosis and Procedure Codes |
|---|---|
| Selection Criteria | |
| Atrial Fibrillation | 427.31 |
| Valvular Heart Disease | 394.0, 394.1, 394.2, 394.9, 396.0, 396.1, 396.8, 396.9, 424.0, 745.xx |
| Heart Valve Replacement | V42.2, V43.3, 35.05–35.09, 35.20–35.28, 35.97 |
| VTE | 451–453, 671.3, 671.4, 671.9, 415.1, 673.2, 673.8 |
| Transient AF (Heart Valve Replacement/Transplant, Pericarditis, Thyrotoxicity) | Pericarditis: 006.8, 017.9, 036.41, 074.21, 093.81, 098.83, 115.93, 390, 391, 392.0, 393, 411.0, 420.90, 420.91, 420.99, 423.0, 423.1, 423.2, 423.8, 423.9 |
| Thyrotoxicity: 242.0, 242.1, 242.2, 242.3, 242.4, 242.8, 242.9 | |
| Pregnancy | ICD-9-CM: 630–679, V22, V23, V24, V27, V28, V61.6, V61.7, 792.3, 796.5, 72–75.99 |
| HCPCS: 59000–59350, 76801–76828, 83661–83664 | |
| Obesity | 278.00 (obesity, unspecified), 278.01 (morbid obesity), 278.03 (obesity hypoventilation syndrome), V85.3 (BMI of 30–39), V85.4 (BMI 40 and over) |
| Morbid Obesity | 278.01 (morbid obesity), V85.4 (BMI 40 and over) |
| Outcomes | |
| Hemorrhagic Stroke | 430.xx–432.xx |
| Cases were excluded if traumatic brain injury (ICD-9-CM: 800–804, 850–854) was present during hospitalization. | |
| Ischemic Stroke | 433.x1, 434.x1, 436 |
| Systemic Embolism | 444.x, 445.x |
| Major Gastrointestinal Bleeding | 456.0, 456.20, 530.82, 531.0x, 531.2x, 531.4x, 531.6x, 532.0x, 532.2x, 532.4x, 532.6x, 533.0x, 533.2x, 533.4x, 533.6x, 534.0x, 534.2x, 534.4x, 534.6x, 535.01, 535.11, 535.21, 535.31, 535.41, 535.51, 535.61, 537.83, 562.02, 562.03, 562.12, 562.13, 568.81, 569.3, 569.85, 578.x |
| Procedure code: 44.43 | |
| Major Intracranial Hemorrhage | 430, 431, 432.0, 432.1, 432.9, 852.0x, 852.2x, 852.4x, 853.0x, |
| Major Other Hemorrhage | 285.1, 360.43, 362.43, 362.81, 363.61, 363.62, 363.72, 364.41, 372.72, 374.81, 376.32, 377.42, 379.23, 423.0x, 596.7x, 599.7x, 602.1x, 620.1, 621.4, 626.2, 626.5, 626.7, 626.8, 626.9, 719.1x, 782.7, 784.7, 784.8, 786.3x, 958.2, 997.02, 998.11 |
| Procedure code: 99.04 | |
| Warfarin Cohort | Apixaban Cohort | Dabigatran Cohort | Rivaroxaban Cohort | |||||
|---|---|---|---|---|---|---|---|---|
| n/Mean | %/SD | n/Mean | %/SD | n/Mean | %/SD | n/Mean | %/SD | |
| Sample Size | 30,902 | 21,242 | 7171 | 29,146 | ||||
| Age | 72.8 | 8.8 | 71.5 | 9.9 | 69.6 | 10.0 | 70.0 | 10.3 |
| 18–54 | 1038 | 3.4% | 1285 | 6.0% | 606 | 8.5% | 2346 | 8.0% |
| 55–64 | 2895 | 9.4% | 2793 | 13.1% | 1112 | 15.5% | 4636 | 15.9% |
| 65–74 | 14,044 | 45.4% | 8977 | 42.3% | 3215 | 44.8% | 12,486 | 42.8% |
| ≥75 | 12,925 | 41.8% | 8187 | 38.5% | 2238 | 31.2% | 9678 | 33.2% |
| Gender | ||||||||
| Male | 15,974 | 51.7% | 11,027 | 51.9% | 4033 | 56.2% | 15,647 | 53.7% |
| Female | 14,928 | 48.3% | 10,215 | 48.1% | 3138 | 43.8% | 13,499 | 46.3% |
| U.S. Geographic Region | ||||||||
| Northeast | 5330 | 17.2% | 3405 | 16.0% | 1367 | 19.1% | 4944 | 17.0% |
| Midwest | 9934 | 32.1% | 4980 | 23.4% | 1701 | 23.7% | 7372 | 25.3% |
| South | 10,693 | 34.6% | 10,103 | 47.6% | 3017 | 42.1% | 12,705 | 43.6% |
| West | 4857 | 15.7% | 2676 | 12.6% | 1052 | 14.7% | 3988 | 13.7% |
| Other | 88 | 0.3% | 78 | 0.4% | 34 | 0.5% | 137 | 0.5% |
| Race (only for Humana and Medicare) | ||||||||
| White | 21,856 | 88.2% | 14,231 | 89.1% | 4376 | 88.0% | 18,059 | 88.5% |
| Black | 1917 | 7.7% | 1031 | 6.5% | 328 | 6.6% | 1277 | 6.3% |
| Other | 1004 | 4.1% | 711 | 4.5% | 270 | 5.4% | 1075 | 5.3% |
| Baseline Comorbidity | ||||||||
| Deyo–Charlson Comorbidity Index | 4.5 | 3.1 | 3.7 | 2.9 | 3.3 | 2.8 | 3.4 | 2.8 |
| CHADS2 Score | 2.8 | 1.3 | 2.5 | 1.3 | 2.4 | 1.3 | 2.4 | 1.3 |
| 0 | 567 | 1.8% | 594 | 2.8% | 262 | 3.7% | 1031 | 3.5% |
| 1 | 3942 | 12.8% | 4185 | 19.7% | 1572 | 21.9% | 6374 | 21.9% |
| 2 | 8708 | 28.2% | 6475 | 30.5% | 2354 | 32.8% | 9320 | 32.0% |
| 3+ | 17,685 | 57.2% | 9988 | 47.0% | 2983 | 41.6% | 12,421 | 42.6% |
| CHA2DS2-VASc Score | 4.3 | 1.6 | 3.9 | 1.7 | 3.7 | 1.7 | 3.7 | 1.7 |
| 0 | 254 | 0.8% | 349 | 1.6% | 169 | 2.4% | 646 | 2.2% |
| 1 | 796 | 2.6% | 1045 | 4.9% | 506 | 7.1% | 1936 | 6.6% |
| 2 | 2669 | 8.6% | 2842 | 13.4% | 1112 | 15.5% | 4466 | 15.3% |
| 3 | 5836 | 18.9% | 4464 | 21.0% | 1610 | 22.5% | 6305 | 21.6% |
| 4+ | 21,347 | 69.1% | 12,542 | 59.0% | 3774 | 52.6% | 15,793 | 54.2% |
| HAS-BLED Score | 3.5 | 1.4 | 3.2 | 1.4 | 3.0 | 1.4 | 3.1 | 1.4 |
| 0 | 246 | 0.8% | 281 | 1.3% | 133 | 1.9% | 553 | 1.9% |
| 1 | 1501 | 4.9% | 1728 | 8.1% | 787 | 11.0% | 2993 | 10.3% |
| 2 | 5661 | 18.3% | 4657 | 21.9% | 1793 | 25.0% | 6992 | 24.0% |
| 3+ | 23,494 | 76.0% | 14,576 | 68.6% | 4458 | 62.2% | 18,608 | 63.8% |
| Bleeding History | 8496 | 27.5% | 4425 | 20.8% | 1329 | 18.5% | 5822 | 20.0% |
| Congestive Heart Failure | 14,722 | 47.6% | 8068 | 38.0% | 2487 | 34.7% | 10,246 | 35.2% |
| Diabetes Mellitus | 18,984 | 61.4% | 11,390 | 53.6% | 3778 | 52.7% | 15,164 | 52.0% |
| Hypertension | 29,379 | 95.1% | 20,022 | 94.3% | 6670 | 93.0% | 27,161 | 93.2% |
| Renal Disease | 12,934 | 41.9% | 6445 | 30.3% | 1720 | 24.0% | 7489 | 25.7% |
| Liver Disease | 2382 | 7.7% | 1471 | 6.9% | 472 | 6.6% | 2051 | 7.0% |
| Myocardial Infarction | 4905 | 15.9% | 2528 | 11.9% | 722 | 10.1% | 3235 | 11.1% |
| Dyspepsia or Stomach Discomfort | 7974 | 25.8% | 5014 | 23.6% | 1555 | 21.7% | 6711 | 23.0% |
| Non-Stroke/SE Peripheral Vascular Disease | 19,062 | 61.7% | 11,847 | 55.8% | 3745 | 52.2% | 15,274 | 52.4% |
| Stroke/SE | 4669 | 15.1% | 2307 | 10.9% | 723 | 10.1% | 2937 | 10.1% |
| Transient Ischemic Attack | 2295 | 7.4% | 1397 | 6.6% | 445 | 6.2% | 1787 | 6.1% |
| Anemia and Coagulation Defects | 12,178 | 39.4% | 6478 | 30.5% | 1845 | 25.7% | 7949 | 27.3% |
| Alcoholism | 788 | 2.5% | 517 | 2.4% | 203 | 2.8% | 874 | 3.0% |
| Peripheral Artery Disease | 8357 | 27.0% | 4563 | 21.5% | 1339 | 18.7% | 6000 | 20.6% |
| Coronary Artery Disease | 16,865 | 54.6% | 10,616 | 50.0% | 3315 | 46.2% | 13,513 | 46.4% |
| Dyslipidemia | 25,528 | 82.6% | 17,510 | 82.4% | 5775 | 80.5% | 23,533 | 80.7% |
| Morbid Obesity | 12,779 | 41.4% | 7962 | 37.5% | 2752 | 38.4% | 11,447 | 39.3% |
| Baseline Medication Use | ||||||||
| ACEi/ARB | 21,240 | 68.7% | 14,912 | 70.2% | 4964 | 69.2% | 20,093 | 68.9% |
| Amiodarone | 4143 | 13.4% | 2839 | 13.4% | 859 | 12.0% | 3576 | 12.3% |
| Beta Blockers | 19,252 | 62.3% | 13,486 | 63.5% | 4347 | 60.6% | 18,192 | 62.4% |
| H2-Receptor Antagonist | 2663 | 8.6% | 1569 | 7.4% | 485 | 6.8% | 2081 | 7.1% |
| Proton Pump Inhibitor | 10,973 | 35.5% | 7530 | 35.4% | 2354 | 32.8% | 9922 | 34.0% |
| Statins | 20,288 | 65.7% | 13,579 | 63.9% | 4324 | 60.3% | 17,928 | 61.5% |
| Anti-Platelets | 6869 | 22.2% | 4597 | 21.6% | 1244 | 17.3% | 5488 | 18.8% |
| NSAIDS | 8019 | 25.9% | 6379 | 30.0% | 2194 | 30.6% | 9165 | 31.4% |
| Dose of the Index Prescription | ||||||||
| Standard Dose 1 | 18,290 | 86.1% | 6254 | 87.2% | 22,908 | 78.6% | ||
| Lower Dose 2 | 2952 | 13.9% | 917 | 12.8% | 6238 | 21.4% | ||
| Follow-up Time (in Days) | 232.4 | 211.1 | 175.6 | 159.1 | 220.5 | 217.9 | 217.9 | 206.4 |
| Median | 154 | 120 | 126 | 139 | ||||
| Warfarin Cohort | Apixaban Cohort | Dabigatran Cohort | Rivaroxaban Cohort | |||||
|---|---|---|---|---|---|---|---|---|
| n/Mean | %/SD | n/Mean | %/SD | n/Mean | %/SD | n/Mean | %/SD | |
| Sample Size | 30,902 | 21,242 | 7171 | 29,146 | ||||
| Discontinuation | 17,553 | 56.8% | 8035 | 37.8% | 4100 | 57.2% | 14,575 | 50.0% |
| Time-to-Discontinuation | 165.3 | 163.8 | 114.9 | 117.0 | 141.4 | 152.7 | 143.6 | 153.1 |
| Switch | 787 | 3.7% | 748 | 10.4% | 1972 | 6.8% | ||
| Time-to-Switch | 94.8 | 103.0 | 116.2 | 136.2 | 122.7 | 142.4 | ||
| Stroke/SE 1 | 406 | 1.3% | 132 | 0.6% | 67 | 0.9% | 226 | 0.8% |
| Hemorrhagic Stroke | 115 | 0.4% | 23 | 0.1% | 41 | 0.1% | ||
| Ischemic Stroke | 276 | 0.9% | 107 | 0.5% | 56 | 0.8% | 170 | 0.6% |
| Systemic Embolism | 20 | 0.1% | 17 | 0.1% | ||||
| Major Bleeding | 1491 | 4.8% | 399 | 1.9% | 174 | 2.4% | 1050 | 3.6% |
| Gastrointestinal Bleeding | 721 | 2.3% | 195 | 0.9% | 110 | 1.5% | 612 | 2.1% |
| Intracranial Hemorrhage | 190 | 0.6% | 38 | 0.2% | 17 | 0.2% | 67 | 0.2% |
| Other Sites | 676 | 2.2% | 187 | 0.9% | 55 | 0.8% | 447 | 1.5% |
| Stroke/SE Incidence Rate (per 100 person-years) | 2.0 | 1.3 | 1.5 | 1.3 | ||||
| Major Bleeding Incidence Rate (per 100 person-years) | 7.6 | 3.9 | 4.0 | 6.0 | ||||
| Warfarin Cohort | Apixaban Cohort | Warfarin Cohort | Dabigatran Cohort | Warfarin Cohort | Rivaroxaban Cohort | ||||||||||
|---|---|---|---|---|---|---|---|---|---|---|---|---|---|---|---|
| n/Mean | %/SD | n/Mean | %/SD | STD 1 | n/Mean | %/SD | n/Mean | %/SD | STD 1 | n/Mean | %/SD | n/Mean | %/SD | STD 1 | |
| Sample Size | 18,181 | 18,181 | 6646 | 6646 | 22,053 | 22,053 | |||||||||
| Age 2 | 72.7 | 8.8 | 72.8 | 9.0 | 1.52 | 70.9 | 9.3 | 70.7 | 9.1 | 1.51 | 72.3 | 8.9 | 72.3 | 8.8 | 0.21 |
| 18–54 | 655 | 3.6% | 659 | 3.6% | 0.12 | 370 | 5.6% | 391 | 5.9% | 1.36 | 865 | 3.9% | 828 | 3.8% | 0.87 |
| 55–64 | 1746 | 9.6% | 1709 | 9.4% | 0.69 | 901 | 13.6% | 879 | 13.2% | 0.97 | 2197 | 10.0% | 2210 | 10.0% | 0.20 |
| 65–74 | 8192 | 45.1% | 8184 | 45.0% | 0.09 | 3120 | 46.9% | 3147 | 47.4% | 0.81 | 10,347 | 46.9% | 10,360 | 47.0% | 0.12 |
| ≥75 | 7588 | 41.7% | 7629 | 42.0% | 0.46 | 2255 | 33.9% | 2229 | 33.5% | 0.83 | 8644 | 39.2% | 8655 | 39.2% | 0.10 |
| Gender 2 | |||||||||||||||
| Male | 9268 | 51.0% | 9260 | 50.9% | 0.09 | 3633 | 54.7% | 3632 | 54.6% | 0.03 | 11,372 | 51.6% | 11,313 | 51.3% | 0.54 |
| Female | 8913 | 49.0% | 8921 | 49.1% | 0.09 | 3013 | 45.3% | 3014 | 45.4% | 0.03 | 10,681 | 48.4% | 10,740 | 48.7% | 0.54 |
| U.S. Geographic Region 2 | |||||||||||||||
| Northeast | 3132 | 17.2% | 3137 | 17.3% | 0.07 | 1264 | 19.0% | 1244 | 18.7% | 0.77 | 3776 | 17.1% | 3828 | 17.4% | 0.62 |
| Midwest | 4588 | 25.2% | 4608 | 25.3% | 0.25 | 1640 | 24.7% | 1624 | 24.4% | 0.56 | 6275 | 28.5% | 6174 | 28.0% | 1.02 |
| South | 7908 | 43.5% | 7834 | 43.1% | 0.82 | 2643 | 39.8% | 2724 | 41.0% | 2.48 | 8560 | 38.8% | 8624 | 39.1% | 0.60 |
| West | 2501 | 13.8% | 2553 | 14.0% | 0.83 | 1073 | 16.1% | 1024 | 15.4% | 2.02 | 3377 | 15.3% | 3365 | 15.3% | 0.15 |
| Other | 52 | 0.3% | 49 | 0.3% | 0.31 | 26 | 0.4% | 30 | 0.5% | 0.93 | 65 | 0.3% | 62 | 0.3% | 0.25 |
| Race (Only for Humana and Medicare) 2 | |||||||||||||||
| White | 13,165 | 89.0% | 13,190 | 89.2% | 0.54 | 4367 | 88.8% | 4338 | 88.2% | 1.85 | 15,805 | 88.9% | 15,796 | 88.9% | 0.16 |
| Black | 1010 | 6.8% | 981 | 6.6% | 0.78 | 298 | 6.1% | 324 | 6.6% | 2.17 | 1158 | 6.5% | 1178 | 6.6% | 0.45 |
| Other | 619 | 4.2% | 623 | 4.2% | 0.13 | 251 | 5.1% | 254 | 5.2% | 0.28 | 812 | 4.6% | 801 | 4.5% | 0.30 |
| Baseline Comorbidity | |||||||||||||||
| Deyo–Charlson Comorbidity Index 2 | 4.0 | 2.9 | 3.9 | 2.9 | 0.92 | 3.5 | 2.9 | 3.5 | 2.8 | 3.05 | 3.9 | 2.9 | 3.9 | 2.9 | 0.27 |
| CHA2DS2-VASc Score | 4.2 | 1.6 | 4.1 | 1.6 | 0.61 | 3.9 | 1.6 | 3.8 | 1.7 | 1.99 | 4.1 | 1.6 | 4.1 | 1.6 | 0.12 |
| 0 | 198 | 1.1% | 165 | 0.9% | 1.83 | 96 | 1.4% | 107 | 1.6% | 1.35 | 229 | 1.0% | 222 | 1.0% | 0.32 |
| 1 | 544 | 3.0% | 565 | 3.1% | 0.67 | 313 | 4.7% | 324 | 4.9% | 0.77 | 731 | 3.3% | 751 | 3.4% | 0.50 |
| 2 | 1848 | 10.2% | 2029 | 11.2% | 3.23 | 880 | 13.2% | 951 | 14.3% | 3.10 | 2306 | 10.5% | 2540 | 11.5% | 3.39 |
| 3 | 3729 | 20.5% | 3718 | 20.4% | 0.15 | 1559 | 23.5% | 1534 | 23.1% | 0.89 | 4775 | 21.7% | 4596 | 20.8% | 1.98 |
| 4+ | 11,862 | 65.2% | 11,704 | 64.4% | 1.82 | 3798 | 57.1% | 3730 | 56.1% | 2.06 | 14,012 | 63.5% | 13,944 | 63.2% | 0.64 |
| HAS-BLED Score 3 | 3.4 | 1.3 | 3.4 | 1.3 | 0.54 | 3.1 | 1.3 | 3.1 | 1.3 | 1.47 | 3.3 | 1.3 | 3.3 | 1.3 | 0.39 |
| 0 | 184 | 1.0% | 144 | 0.8% | 2.33 | 96 | 1.4% | 93 | 1.4% | 0.38 | 224 | 1.0% | 198 | 0.9% | 1.21 |
| 1 | 991 | 5.5% | 1063 | 5.8% | 1.72 | 567 | 8.5% | 565 | 8.5% | 0.11 | 1289 | 5.8% | 1402 | 6.4% | 2.14 |
| 2 | 3799 | 20.9% | 3696 | 20.3% | 1.40 | 1585 | 23.8% | 1631 | 24.5% | 1.62 | 4851 | 22.0% | 4738 | 21.5% | 1.24 |
| 3+ | 13,207 | 72.6% | 13,278 | 73.0% | 0.88 | 4398 | 66.2% | 4357 | 65.6% | 1.30 | 15,689 | 71.1% | 15,715 | 71.3% | 0.26 |
| Bleeding History 2 | 4171 | 22.9% | 4127 | 22.7% | 0.58 | 1346 | 20.3% | 1294 | 19.5% | 1.96 | 5015 | 22.7% | 5046 | 22.9% | 0.33 |
| Congestive Heart Failure 2 | 7553 | 41.5% | 7485 | 41.2% | 0.76 | 2436 | 36.7% | 2424 | 36.5% | 0.37 | 8926 | 40.5% | 8877 | 40.3% | 0.45 |
| Diabetes Mellitus 2 | 10,265 | 56.5% | 10,297 | 56.6% | 0.36 | 3716 | 55.9% | 3611 | 54.3% | 3.18 | 12,438 | 56.4% | 12,435 | 56.4% | 0.03 |
| Hypertension 2 | 17,276 | 95.0% | 17,273 | 95.0% | 0.08 | 6235 | 93.8% | 6223 | 93.6% | 0.74 | 20,842 | 94.5% | 20,833 | 94.5% | 0.18 |
| Renal Disease 2 | 6173 | 34.0% | 6166 | 33.9% | 0.08 | 1758 | 26.5% | 1697 | 25.5% | 2.09 | 6893 | 31.3% | 6891 | 31.2% | 0.02 |
| Liver Disease 2 | 1280 | 7.0% | 1271 | 7.0% | 0.19 | 472 | 7.1% | 453 | 6.8% | 1.12 | 1601 | 7.3% | 1620 | 7.3% | 0.33 |
| Myocardial Infarction 2 | 2369 | 13.0% | 2343 | 12.9% | 0.43 | 700 | 10.5% | 711 | 10.7% | 0.54 | 2771 | 12.6% | 2794 | 12.7% | 0.31 |
| Dyspepsia or Stomach Discomfort 2 | 4502 | 24.8% | 4430 | 24.4% | 0.92 | 1486 | 22.4% | 1488 | 22.4% | 0.07 | 5375 | 24.4% | 5390 | 24.4% | 0.16 |
| Non-Stroke/SE Peripheral Vascular Disease 2 | 10,753 | 59.1% | 10,676 | 58.7% | 0.86 | 3639 | 54.8% | 3624 | 54.5% | 0.45 | 12,750 | 57.8% | 12,759 | 57.9% | 0.08 |
| Stroke/SE 2 | 2273 | 12.5% | 2183 | 12.0% | 1.51 | 739 | 11.1% | 710 | 10.7% | 1.40 | 2699 | 12.2% | 2639 | 12.0% | 0.83 |
| Transient Ischemic Attack 2 | 1278 | 7.0% | 1257 | 6.9% | 0.45 | 456 | 6.9% | 432 | 6.5% | 1.45 | 1511 | 6.9% | 1510 | 6.8% | 0.02 |
| Anemia and Coagulation Defects 2 | 6164 | 33.9% | 6082 | 33.5% | 0.95 | 1874 | 28.2% | 1814 | 27.3% | 2.02 | 7167 | 32.5% | 7105 | 32.2% | 0.60 |
| Alcoholism 2 | 428 | 2.4% | 429 | 2.4% | 0.04 | 192 | 2.9% | 182 | 2.7% | 0.91 | 621 | 2.8% | 620 | 2.8% | 0.03 |
| Peripheral Artery Disease | 4513 | 24.8% | 4228 | 23.3% | 3.67 | 1464 | 22.0% | 1319 | 19.8% | 5.36 | 5287 | 24.0% | 5282 | 24.0% | 0.05 |
| Coronary Artery Disease | 9491 | 52.2% | 9544 | 52.5% | 0.58 | 3168 | 47.7% | 3197 | 48.1% | 0.87 | 11,153 | 50.6% | 11,261 | 51.1% | 0.98 |
| Dyslipidemia 2 | 15,199 | 83.6% | 15,191 | 83.6% | 0.12 | 5419 | 81.5% | 5402 | 81.3% | 0.66 | 18,168 | 82.4% | 18,237 | 82.7% | 0.82 |
| Morbid Obesity | 7207 | 39.6% | 6777 | 37.3% | 4.86 | 2619 | 39.4% | 2523 | 38.0% | 2.97 | 8782 | 39.8% | 8660 | 39.3% | 1.13 |
| Baseline Medication Use 2 | |||||||||||||||
| ACEi/ARB | 12,771 | 70.2% | 12,788 | 70.3% | 0.20 | 4615 | 69.4% | 4651 | 70.0% | 1.18 | 15,371 | 69.7% | 15,345 | 69.6% | 0.26 |
| Amiodarone | 2429 | 13.4% | 2446 | 13.5% | 0.27 | 810 | 12.2% | 810 | 12.2% | 0.00 | 2793 | 12.7% | 2816 | 12.8% | 0.31 |
| Beta Blockers | 11,442 | 62.9% | 11,562 | 63.6% | 1.37 | 4051 | 61.0% | 4025 | 60.6% | 0.80 | 13,732 | 62.3% | 13,778 | 62.5% | 0.43 |
| H2-Receptor Antagonist | 1438 | 7.9% | 1419 | 7.8% | 0.39 | 500 | 7.5% | 464 | 7.0% | 2.09 | 1735 | 7.9% | 1760 | 8.0% | 0.42 |
| Proton Pump Inhibitor | 6477 | 35.6% | 6510 | 35.8% | 0.38 | 2259 | 34.0% | 2229 | 33.5% | 0.95 | 7725 | 35.0% | 7755 | 35.2% | 0.29 |
| Statins | 11,915 | 65.5% | 11,913 | 65.5% | 0.02 | 4213 | 63.4% | 4111 | 61.9% | 3.17 | 14,141 | 64.1% | 14,210 | 64.4% | 0.65 |
| Anti-Platelets | 4070 | 22.4% | 4066 | 22.4% | 0.05 | 1195 | 18.0% | 1215 | 18.3% | 0.78 | 4606 | 20.9% | 4585 | 20.8% | 0.23 |
| NSAIDS | 5211 | 28.7% | 5255 | 28.9% | 0.53 | 2025 | 30.5% | 2016 | 30.3% | 0.29 | 6384 | 28.9% | 6408 | 29.1% | 0.24 |
| Dose of the Index Prescription | |||||||||||||||
| Standard Dose 4 | 15,410 | 84.8% | 5747 | 86.5% | 16,599 | 75.3% | |||||||||
| Low Dose 5 | 2771 | 15.2% | 899 | 13.5% | 5454 | 24.7% | |||||||||
| Follow-Up Time (in Days) | 236.3 | 213.8 | 176.2 | 160.2 | 31.85 | 236.8 | 211.3 | 222.5 | 219.7 | 6.60 | 237.7 | 213.5 | 221.0 | 208.6 | 7.92 |
| Median | 157 | 120 | 159 | 128 | 159 | 142 | |||||||||
| Apixaban Cohort | Dabigatran Cohort | Apixaban Cohort | Rivaroxaban Cohort | Dabigatran Cohort | Rivaroxaban Cohort | ||||||||||
|---|---|---|---|---|---|---|---|---|---|---|---|---|---|---|---|
| n/Mean | %/SD | n/Mean | %/SD | STD 1 | n/Mean | %/SD | n/Mean | %/SD | STD 1 | n/Mean | %/SD | n/Mean | %/SD | STD 1 | |
| Sample Size | 6884 | 6884 | 20,431 | 20,431 | 7103 | 7103 | |||||||||
| Age 2 | 70.5 | 10.0 | 70.0 | 9.8 | 4.23 | 71.5 | 9.8 | 71.5 | 9.7 | 0.85 | 69.7 | 10.0 | 69.5 | 9.9 | 1.40 |
| 18–54 | 510 | 7.4% | 521 | 7.6% | 0.61 | 1200 | 5.9% | 1215 | 5.9% | 0.31 | 590 | 8.3% | 581 | 8.2% | 0.46 |
| 55–64 | 980 | 14.2% | 988 | 14.4% | 0.33 | 2586 | 12.7% | 2599 | 12.7% | 0.19 | 1102 | 15.5% | 1102 | 15.5% | 0.00 |
| 65–74 | 3069 | 44.6% | 3159 | 45.9% | 2.63 | 8828 | 43.2% | 8689 | 42.5% | 1.37 | 3193 | 45.0% | 3366 | 47.4% | 4.89 |
| ≥75 | 2325 | 33.8% | 2216 | 32.2% | 3.37 | 7817 | 38.3% | 7928 | 38.8% | 1.12 | 2218 | 31.2% | 2054 | 28.9% | 5.04 |
| Gender 2 | |||||||||||||||
| Male | 3776 | 54.9% | 3810 | 55.3% | 0.99 | 10,596 | 51.9% | 10,614 | 52.0% | 0.18 | 3982 | 56.1% | 4171 | 58.7% | 5.38 |
| Female | 3108 | 45.1% | 3074 | 44.7% | 0.99 | 9835 | 48.1% | 9817 | 48.0% | 0.18 | 3121 | 43.9% | 2932 | 41.3% | 5.38 |
| U.S. Geographic Region 2 | |||||||||||||||
| Northeast | 1256 | 18.2% | 1255 | 18.2% | 0.04 | 3339 | 16.3% | 3356 | 16.4% | 0.22 | 1345 | 18.9% | 1445 | 20.3% | 3.54 |
| Midwest | 1624 | 23.6% | 1640 | 23.8% | 0.55 | 4850 | 23.7% | 4861 | 23.8% | 0.13 | 1688 | 23.8% | 1613 | 22.7% | 2.50 |
| South | 2966 | 43.1% | 2962 | 43.0% | 0.12 | 9563 | 46.8% | 9580 | 46.9% | 0.17 | 2999 | 42.2% | 2920 | 41.1% | 2.26 |
| West | 1008 | 14.6% | 1000 | 14.5% | 0.33 | 2606 | 12.8% | 2561 | 12.5% | 0.66 | 1038 | 14.6% | 1098 | 15.5% | 2.36 |
| Other | 30 | 0.4% | 27 | 0.4% | 0.68 | 73 | 0.4% | 73 | 0.4% | 0.00 | 33 | 0.5% | 27 | 0.4% | 1.30 |
| Race (Only for Humana and Medicare) 2 | |||||||||||||||
| White | 4361 | 88.2% | 4358 | 88.1% | 0.19 | 13,910 | 89.2% | 13,926 | 89.3% | 0.33 | 4368 | 88.1% | 4374 | 88.2% | 0.37 |
| Black | 321 | 6.5% | 322 | 6.5% | 0.08 | 994 | 6.4% | 1001 | 6.4% | 0.18 | 325 | 6.6% | 318 | 6.4% | 0.57 |
| Other | 265 | 5.4% | 267 | 5.4% | 0.18 | 692 | 4.4% | 669 | 4.3% | 0.72 | 266 | 5.4% | 267 | 5.4% | 0.09 |
| Baseline Comorbidity | |||||||||||||||
| Deyo–Charlson Comorbidity Index 2 | 3.3 | 2.8 | 3.4 | 2.8 | 0.27 | 3.6 | 2.9 | 3.6 | 2.9 | 0.15 | 3.3 | 2.8 | 3.2 | 2.7 | 2.72 |
| CHA2DS2-VASc Score | 3.7 | 1.7 | 3.7 | 1.7 | 0.57 | 3.9 | 1.7 | 3.9 | 1.7 | 0.72 | 3.7 | 1.7 | 3.6 | 1.7 | 4.04 |
| 0 | 132 | 1.9% | 142 | 2.1% | 1.04 | 326 | 1.6% | 337 | 1.6% | 0.43 | 165 | 2.3% | 167 | 2.4% | 0.19 |
| 1 | 442 | 6.4% | 438 | 6.4% | 0.24 | 988 | 4.8% | 1025 | 5.0% | 0.84 | 498 | 7.0% | 516 | 7.3% | 0.98 |
| 2 | 1073 | 15.6% | 1032 | 15.0% | 1.65 | 2722 | 13.3% | 2642 | 12.9% | 1.16 | 1100 | 15.5% | 1173 | 16.5% | 2.80 |
| 3 | 1531 | 22.2% | 1547 | 22.5% | 0.56 | 4326 | 21.2% | 4221 | 20.7% | 1.26 | 1594 | 22.4% | 1612 | 22.7% | 0.61 |
| 4+ | 3706 | 53.8% | 3725 | 54.1% | 0.55 | 12,069 | 59.1% | 12,206 | 59.7% | 1.37 | 3746 | 52.7% | 3635 | 51.2% | 3.13 |
| HAS-BLED Score 3 | 3.1 | 1.4 | 3.1 | 1.3 | 2.06 | 3.2 | 1.4 | 3.2 | 1.4 | 0.10 | 3.0 | 1.4 | 3.0 | 1.3 | 4.61 |
| 0 | 96 | 1.4% | 112 | 1.6% | 1.91 | 266 | 1.3% | 288 | 1.4% | 0.93 | 130 | 1.8% | 145 | 2.0% | 1.53 |
| 1 | 695 | 10.1% | 680 | 9.9% | 0.73 | 1640 | 8.0% | 1662 | 8.1% | 0.40 | 773 | 10.9% | 821 | 11.6% | 2.14 |
| 2 | 1646 | 23.9% | 1708 | 24.8% | 2.10 | 4508 | 22.1% | 4555 | 22.3% | 0.55 | 1771 | 24.9% | 1807 | 25.4% | 1.17 |
| 3+ | 4447 | 64.6% | 4384 | 63.7% | 1.91 | 14,017 | 68.6% | 13,926 | 68.2% | 0.96 | 4429 | 62.4% | 4330 | 61.0% | 2.87 |
| Bleeding History 2 | 1290 | 18.7% | 1296 | 18.8% | 0.22 | 4268 | 20.9% | 4265 | 20.9% | 0.04 | 1317 | 18.5% | 1235 | 17.4% | 3.01 |
| Congestive Heart Failure 2 | 2459 | 35.7% | 2430 | 35.3% | 0.88 | 7737 | 37.9% | 7779 | 38.1% | 0.42 | 2471 | 34.8% | 2451 | 34.5% | 0.59 |
| Diabetes Mellitus 2 | 3553 | 51.6% | 3645 | 52.9% | 2.68 | 10,967 | 53.7% | 11,007 | 53.9% | 0.39 | 3740 | 52.7% | 3773 | 53.1% | 0.93 |
| Hypertension 2 | 6418 | 93.2% | 6435 | 93.5% | 0.99 | 19,262 | 94.3% | 19,266 | 94.3% | 0.08 | 6611 | 93.1% | 6569 | 92.5% | 2.28 |
| Renal Disease 2 | 1728 | 25.1% | 1690 | 24.5% | 1.28 | 6072 | 29.7% | 6109 | 29.9% | 0.40 | 1708 | 24.0% | 1580 | 22.2% | 4.27 |
| Liver Disease 2 | 448 | 6.5% | 466 | 6.8% | 1.05 | 1423 | 7.0% | 1379 | 6.7% | 0.85 | 471 | 6.6% | 474 | 6.7% | 0.17 |
| Myocardial Infarction 2 | 711 | 10.3% | 706 | 10.3% | 0.24 | 2400 | 11.7% | 2426 | 11.9% | 0.39 | 716 | 10.1% | 692 | 9.7% | 1.13 |
| Dyspepsia or Stomach Discomfort 2 | 1514 | 22.0% | 1505 | 21.9% | 0.32 | 4826 | 23.6% | 4768 | 23.3% | 0.67 | 1544 | 21.7% | 1478 | 20.8% | 2.27 |
| Non-Stroke/SE Peripheral Vascular Disease 2 | 3676 | 53.4% | 3648 | 53.0% | 0.82 | 11,365 | 55.6% | 11,484 | 56.2% | 1.17 | 3712 | 52.3% | 3710 | 52.2% | 0.06 |
| Stroke/SE 2 | 720 | 10.5% | 704 | 10.2% | 0.76 | 2194 | 10.7% | 2192 | 10.7% | 0.03 | 711 | 10.0% | 733 | 10.3% | 1.02 |
| Transient Ischemic Attack 2 | 414 | 6.0% | 427 | 6.2% | 0.79 | 1316 | 6.4% | 1339 | 6.6% | 0.46 | 442 | 6.2% | 444 | 6.3% | 0.12 |
| Anemia and Coagulation Defects 2 | 1873 | 27.2% | 1815 | 26.4% | 1.90 | 6197 | 30.3% | 6242 | 30.6% | 0.48 | 1838 | 25.9% | 1709 | 24.1% | 4.20 |
| Alcoholism 2 | 186 | 2.7% | 195 | 2.8% | 0.80 | 483 | 2.4% | 471 | 2.3% | 0.39 | 203 | 2.9% | 221 | 3.1% | 1.49 |
| Peripheral Artery Disease | 1350 | 19.6% | 1311 | 19.0% | 1.43 | 4364 | 21.4% | 4677 | 22.9% | 3.69 | 1327 | 18.7% | 1463 | 20.6% | 4.82 |
| Coronary Artery Disease | 3281 | 47.7% | 3230 | 46.9% | 1.48 | 10,183 | 49.8% | 10,138 | 49.6% | 0.44 | 3285 | 46.2% | 3222 | 45.4% | 1.78 |
| Dyslipidemia 2 | 5560 | 80.8% | 5568 | 80.9% | 0.30 | 16,857 | 82.5% | 16,842 | 82.4% | 0.19 | 5716 | 80.5% | 5688 | 80.1% | 0.99 |
| Morbid Obesity | 2601 | 37.8% | 2658 | 38.6% | 1.70 | 7660 | 37.5% | 7896 | 38.6% | 2.38 | 2726 | 38.4% | 2735 | 38.5% | 0.26 |
| Baseline Medication Use 2 | |||||||||||||||
| ACEi/ARB | 4805 | 69.8% | 4799 | 69.7% | 0.19 | 14,341 | 70.2% | 14,312 | 70.1% | 0.31 | 4922 | 69.3% | 4929 | 69.4% | 0.21 |
| Amiodarone | 827 | 12.0% | 836 | 12.1% | 0.40 | 2671 | 13.1% | 2658 | 13.0% | 0.19 | 849 | 12.0% | 874 | 12.3% | 1.08 |
| Beta Blockers | 4287 | 62.3% | 4198 | 61.0% | 2.66 | 12,981 | 63.5% | 12,917 | 63.2% | 0.65 | 4311 | 60.7% | 4260 | 60.0% | 1.47 |
| H2-Receptor Antagonist | 493 | 7.2% | 477 | 6.9% | 0.91 | 1496 | 7.3% | 1473 | 7.2% | 0.43 | 482 | 6.8% | 460 | 6.5% | 1.24 |
| Proton Pump Inhibitor | 2301 | 33.4% | 2275 | 33.0% | 0.80 | 7222 | 35.3% | 7151 | 35.0% | 0.73 | 2342 | 33.0% | 2259 | 31.8% | 2.50 |
| Statins | 4212 | 61.2% | 4193 | 60.9% | 0.57 | 13,057 | 63.9% | 13,149 | 64.4% | 0.94 | 4285 | 60.3% | 4189 | 59.0% | 2.75 |
| Anti-Platelets | 1312 | 19.1% | 1221 | 17.7% | 3.41 | 4328 | 21.2% | 4392 | 21.5% | 0.76 | 1235 | 17.4% | 1150 | 16.2% | 3.20 |
| NSAIDS | 2119 | 30.8% | 2122 | 30.8% | 0.09 | 6191 | 30.3% | 6230 | 30.5% | 0.41 | 2183 | 30.7% | 2104 | 29.6% | 2.42 |
| Dose of the Index Prescription | |||||||||||||||
| Standard Dose 4 | 6045 | 87.8% | 5979 | 86.9% | 2.88 | 17,634 | 86.3% | 15,514 | 75.9% | 26.75 | 6194 | 87.2% | 5698 | 80.2% | 18.99 |
| Low Dose 5 | 839 | 12.2% | 905 | 13.1% | 2.88 | 2797 | 13.7% | 4917 | 24.1% | 15.45 | 909 | 12.8% | 1405 | 19.8% | 7.53 |
| Follow-Up Time (in Days) | 176.2 | 158.3 | 221.5 | 218.3 | 23.72 | 176.1 | 159.6 | 220.4 | 208.6 | 23.89 | 220.7 | 218.1 | 217.4 | 206.4 | 1.54 |
| Median | 120 | 127 | 120 | 141 | 127 | 140 | |||||||||


References
- Zulkifly, H.; Lip, G.Y.; Lane, D.A. Epidemiology of atrial fibrillation. Int. J. Clin. Pract. 2018, 72, e13070. [Google Scholar] [CrossRef]
- Wang, T.J.; Larson, M.G.; Levy, D.; Vasan, R.S.; Leip, E.P.; Wolf, P.A.; D’Agostino, R.B.; Murabito, J.M.; Kannel, W.B.; Benjamin, E.J.; et al. Temporal relations of atrial fibrillation and congestive heart failure and their joint influence on mortality: The Framingham Heart Study. Circulation 2003, 107, 2920–2925. [Google Scholar] [CrossRef]
- Kelly, T.; Yang, W.; Chen, C.S.; Reynolds, K.; He, J. Global burden of obesity in 2005 and projections to 2030. Int. J. Obes. (Lond.) 2008, 32, 1431–1437. [Google Scholar] [CrossRef]
- Bowles, L.K.; Cooper, J.A.; Howarth, D.J.; Miller, G.J.; MacCallum, P.K. Associations of haemostatic variables with body mass index: A community-based study. Blood Coagul. Fibrinolysis 2003, 14, 569–573. [Google Scholar] [CrossRef]
- Darvall, K.A.; Sam, R.C.; Silverman, S.H.; Bradbury, A.W.; Adam, D.J. Obesity and thrombosis. Eur. J. Vasc. Endovasc. Surg. 2007, 33, 223. [Google Scholar] [CrossRef]
- Huxley, R.R.; Lopez, F.L.; Folsom, A.R.; Agarwal, S.K.; Loehr, L.R.; Soliman, E.Z.; Maclehose, R.; Konety, S.; Alonso, A. Absolute and attributable risks of atrial fibrillation in relation to optimal and borderline risk factors: The atherosclerosis risk in communities (ARIC) study. Circulation 2011, 123, 1501–1508. [Google Scholar] [CrossRef]
- Tedrow, U.B.; Conen, D.; Ridker, P.M.; Cook, N.R.; Koplan, B.A.; Manson, J.E.; Buring, J.E.; Albert, C.M. The long- and short-term impact of elevated body mass index on the risk of new atrial fibrillation the WHS (women’s health study). J. Am. Coll. Cardiol. 2010, 55, 2319–2327. [Google Scholar] [CrossRef]
- Graves, K.K.; Edholm, K.; Johnson, S.A. Use of oral anticoagulants in obese patients. JSM Atheroscler 2017, 2, 1035. [Google Scholar]
- McCaughan, G.J.B.; Favaloro, E.J.; Pasalic, L.; Curnow, J. Anticoagulation at the extremes of body weight: Choices and dosing. Expert Rev. Hemtol. 2018, 11, 817–828. [Google Scholar] [CrossRef]
- Martin, K.; Beyer-Westendorf, J.; Davidson, B.L.; Huisman, M.V.; Sandset, P.M.; Moll, S. Use of the direct oral anticoagulants in obese patients: Guidance from the SSC of the ISTH. J. Thromb. Haemost. 2016, 14, 1308–1313. [Google Scholar] [CrossRef]
- Connolly, S.J.; Ezekowitz, M.D.; Yusuf, S.; Eikelboom, J.; Oldgren, J.; Parekh, A.; Pogue, J.; Reilly, P.A.; Themeles, E.; Varrone, J.; et al. Dabigatran versus warfarin in patients with atrial fibrillation. New Engl. J. Med. 2009, 361, 1139–1151. [Google Scholar] [CrossRef]
- Patel, M.R.; Mahaffey, K.W.; Garg, J.; Pan, G.; Singer, D.E.; Hacke, W.; Breithardt, G.; Halperin, J.L.; Hankey, G.J.; Piccini, J.P.; et al. Rivaroxaban versus warfarin in nonvalvular atrial fibrillation. New Engl. J. Med. 2011, 365, 883–891. [Google Scholar] [CrossRef]
- Sandhu, R.K.; Ezekowitz, J.; Andersson, U.; Alexander, J.H.; Granger, C.B.; Halvorsen, S.; Hanna, M.; Hijazi, Z.; Jansky, P.; Lopes, R.D.; et al. The ‘obesity paradox’ in atrial fibrillation: Observations from the ARISTOTLE (Apixaban for Reduction in Stroke and Other Thromboembolic Events in Atrial Fibrillation) trial. Eur. Heart J. 2016, 37, 2869–2878. [Google Scholar] [CrossRef]
- Choi, Y.; Kushnir, M.; Billett, H.H. Apixaban is safe and effective in morbidly obese patients: A retrospective analysis of 390 patients with BMI ≥40. Blood 2017, 130, 1105. [Google Scholar]
- Peterson, E.D.; Ashton, V.; Chen, Y.W.; Wu, B.; Mangla, K.K.; Spyropoulos, A.C. Comparative effectiveness, safety, and costs of rivaroxaban and warfarin among morbidly obese patients with non-valvular atrial fibrillation. Am. Heart J. 2019, 212, 113–119. [Google Scholar] [CrossRef]
- Kido, K.; Ngorsuraches, S. Comparing the efficacy and safety of direct oral anticoagulants with warfarin in the morbidly obese population with atrial fibrillation. Ann. Pharmacother. 2019, 53, 165–170. [Google Scholar] [CrossRef]
- Kushnir, M.; Choi, Y.; Eisenberg, R.; Rao, D.; Tolu, S.; Gao, J.; Mowrey, W.; Billett, H.H. Efficacy and safety of direct oral factor Xa inhibitors compared with warfarin in patients with morbid obesity: A single-centre, retrospective analysis of chart data. Lancet Haematol. 2019, 6, e359–e365. [Google Scholar] [CrossRef]
- Li, X.; Deitelzweig, S.; Keshishian, A.; Hamilton, M.; Horblyuk, R.; Gupta, K.; Luo, X.; Mardekian, J.; Friend, K.; Nadkarni, A.; et al. Effectiveness and safety of apixaban versus warfarin in non-valvular atrial fibrillation patients in “real-world” clinical practice. A propensity-matched analysis of 76,940 patients. Thromb. Haemost. 2017, 117, 1072–1082. [Google Scholar]
- Lip, G.Y.H.; Keshishian, A.; Li, X.; Hamilton, M.; Masseria, C.; Gupta, K.; Luo, X.; Mardekian, J.; Friend, K.; Nadkarni, A.; et al. Effectiveness and safety of oral anticoagulants among non-valvular atrial fibrillation patients. Stroke 2018, 49, 2933–2944. [Google Scholar] [CrossRef]
- Vyas, V.; Lambiase, P. Obesity and atrial fibrillation: Epidemiology, pathophysiology and novel therapeutic opportunities. Arrhythm. Electrophysiol. Rev. 2019, 8, 28–36. [Google Scholar] [CrossRef]
- Thigpen, J.L.; Dillon, C.; Forster, K.B.; Henault, L.; Quinn, E.K.; Tripodis, Y.; Berger, P.B.; Hylek, E.M.; Limdi, N.A. Validity of international classification of disease codes to identify ischemic stroke and intracranial hemorrhage among individuals with associated diagnosis of atrial fibrillation. Circ. Cardiovasc. Qual. Outcomes 2015, 8, 8–14. [Google Scholar] [CrossRef] [PubMed]
- Cunningham, A.; Stein, C.M.; Chung, C.P.; Daugherty, J.R.; Smalley, W.E.; Ray, W. An automated database case definition for serious bleeding related to oral anticoagulant use. Pharmacoepidemiol. Drug Saf. 2011, 20, 560–566. [Google Scholar] [CrossRef]
- Charlson, M.E.; Pompei, P.; Ales, K.L.; MacKenzie, C.R. A new method of classifying prognostic comorbidity in longitudinal studies: Development and validation. J. Chronic. Dis. 1987, 40, 373–383. [Google Scholar] [CrossRef]
- Austin, P.C. Balance diagnostics for comparing the distribution of baseline covariates between treatment groups in propensity-score matched samples. Stat. Med. 2009, 28, 3083–3107. [Google Scholar] [CrossRef]
- Austin, P.C. The use of propensity score methods with survival or time-to-event outcomes: Reporting measures of effect similar to those used in randomized experiments. Stat. Med. 2014, 33, 1242–1258. [Google Scholar] [CrossRef]
- Proietti, M.; Guiducci, E.; Cheli, P.; Lip, G.Y. Is there an obesity paradox for outcomes in atrial fibrillation? A systematic review and meta-analysis of non-vitamin k antagonist oral anticoagulant trials. Stroke 2017, 48, 857–866. [Google Scholar] [CrossRef]
- Tittl, L.; Endig, S.; Marten, S.; Reitter, A.; Beyer-Westendorf, I.; Beyer-Westendorf, J. Impact of BMI on clinical outcomes of NOAC therapy in daily care—Results of the prospective Dresden NOAC Registry (NCT01588119). Int. J. Cardiol. 2018, 262, 85–91. [Google Scholar] [CrossRef]
- Güler, E.; Babur Güler, G.; Demir, G.G.; Hatipoğlu, S. A review of the fixed dose use of new oral anticoagulants in obese patients: Is it really enough? Anatol. J. Cardiol. 2015, 15, 1020–1029. [Google Scholar] [CrossRef]
- Jain, R.; Watzker, A.; Luo, X.; Kang, A.L.; Baker, C.L.; Rosenblatt, L.; Mardekian, J.; Menzin, J. Validation of obesity coding among newly treated nonvalvular atrial fibrillation patients using an integrated electronic medical record and claims database. Curr. Med. Res. Opin. 2020, 36, 189–197. [Google Scholar] [CrossRef] [PubMed]


| (A) Baseline Characteristics among NVAF Patients with Obesity after Propensity Score Matching—NOACs vs. Warfarin. | ||||||||||||
| Apixaban Cohort | Warfarin Cohort | Dabigatran Cohort | Warfarin Cohort | Rivaroxaban Cohort | Warfarin Cohort | |||||||
| n/Mean | %/SD | n/Mean | %/SD | n/Mean | %/SD | n/Mean | %/SD | n/Mean | %/SD | n/Mean | %/SD | |
| Sample Size | 18,181 | 18,181 | 6646 | 6646 | 22,053 | 22,053 | ||||||
| Age | 72.8 | 9.0 | 72.7 | 8.8 | 70.7 | 9.1 | 70.9 | 9.3 | 72.3 | 8.8 | 72.3 | 8.9 |
| Gender | ||||||||||||
| Male | 9260 | 50.9% | 9268 | 51.0% | 3632 | 54.6% | 3633 | 54.7% | 11,313 | 51.3% | 11,372 | 51.6% |
| Female | 8921 | 49.1% | 8913 | 49.0% | 3014 | 45.4% | 3013 | 45.3% | 10,740 | 48.7% | 10,681 | 48.4% |
| Baseline Comorbidity | ||||||||||||
| Deyo–Charlson Comorbidity Index | 3.9 | 2.9 | 4.0 | 2.9 | 3.5 | 2.8 | 3.5 | 2.9 | 3.9 | 2.9 | 3.9 | 2.9 |
| CHA2DS2-VASc Score | 4.1 | 1.6 | 4.2 | 1.6 | 3.8 | 1.7 | 3.9 | 1.6 | 4.1 | 1.6 | 4.1 | 1.6 |
| HAS-BLED Score 1 | 3.4 | 1.3 | 3.4 | 1.3 | 3.1 | 1.3 | 3.1 | 1.3 | 3.3 | 1.3 | 3.3 | 1.3 |
| Dose of the Index Prescription | ||||||||||||
| Standard Dose 2 | 15,410 | 84.8% | 5747 | 86.5% | 16,599 | 75.3% | ||||||
| Low Dose 3 | 2771 | 15.2% | 899 | 13.5% | 5454 | 24.7% | ||||||
| Follow-Up Time (in Days) | 176.2 | 160.2 | 236.3 | 213.8 | 222.5 | 219.7 | 236.8 | 211.3 | 221.0 | 208.6 | 237.7 | 213.5 |
| Median | 120 | 157 | 128 | 159 | 142 | 159 | ||||||
| (B) Baseline Characteristics among NVAF Patients with Obesity after Propensity Score Matching among NOACs vs. NOACs. | ||||||||||||
| Apixaban Cohort | Dabigatran Cohort | Apixaban Cohort | Rivaroxaban Cohort | Dabigatran Cohort | Rivaroxaban Cohort | |||||||
| n/Mean | %/SD | n/Mean | %/SD | n/Mean | %/SD | n/Mean | %/SD | n/Mean | %/SD | n/Mean | %/SD | |
| Sample Size | 6884 | 6884 | 20,431 | 20,431 | 7103 | 7103 | ||||||
| Age | 70.5 | 10.0 | 70.0 | 9.8 | 71.5 | 9.8 | 71.5 | 9.7 | 69.7 | 10.0 | 69.5 | 9.9 |
| Gender | ||||||||||||
| Male | 3776 | 54.9% | 3810 | 55.3% | 10,596 | 51.9% | 10,614 | 52.0% | 3982 | 56.1% | 4171 | 58.7% |
| Female | 3108 | 45.1% | 3074 | 44.7% | 9835 | 48.1% | 9817 | 48.0% | 3121 | 43.9% | 2932 | 41.3% |
| Baseline Comorbidity | ||||||||||||
| Deyo–Charlson Comorbidity Index | 3.3 | 2.8 | 3.4 | 2.8 | 3.6 | 2.9 | 3.6 | 2.9 | 3.3 | 2.8 | 3.2 | 2.7 |
| CHA2DS2-VASc Score | 3.7 | 1.7 | 3.7 | 1.7 | 3.9 | 1.7 | 3.9 | 1.7 | 3.7 | 1.7 | 3.6 | 1.7 |
| HAS-BLED Score 1 | 3.1 | 1.4 | 3.1 | 1.3 | 3.2 | 1.4 | 3.2 | 1.4 | 3.0 | 1.4 | 3.0 | 1.3 |
| Dose of the Index Prescription | ||||||||||||
| Standard Dose 2 | 6045 | 87.8% | 5979 | 86.9% | 17,634 | 86.3% | 15,514 | 75.9% | 6194 | 87.2% | 5698 | 80.2% |
| Low Dose 3 | 839 | 12.2% | 905 | 13.1% | 2797 | 13.7% | 4917 | 24.1% | 909 | 12.8% | 1405 | 19.8% |
| Follow-Up Time (in Days) | 176.2 | 158.3 | 221.5 | 218.3 | 176.1 | 159.6 | 220.4 | 208.6 | 220.7 | 218.1 | 217.4 | 206.4 |
| Median | 120 | 127 | 120 | 141 | 127 | 140 | ||||||
| NOACs vs. Warfarin | NOACs vs. NOACs | ||||||||
|---|---|---|---|---|---|---|---|---|---|
| Incidence per 100 person-years | Hazard Ratio | p-value | Incidence per 100 person-years | Hazard Ratio | p-value | ||||
| (95% CI) | (95% CI) | ||||||||
| 5 mg Apixaban n = 15,364 | Warfarin n = 15,364 | 5 mg Apixaban n = 5904 | 150 mg Dabigatran n = 5904 | ||||||
| Stroke/SE | 1.2 | 1.9 | 0.61 (0.46–0.81) | 0.001 | Stroke/SE | 1.3 | 1.3 | 0.92 (0.55–1.52) | 0.733 |
| MB | 4.0 | 6.3 | 0.57 (0.51–0.64) | <0.001 | MB | 3.0 | 3.7 | 0.77 (0.59–1.00) | 0.052 |
| 150 mg Dabigatran n = 5756 | Warfarin n = 5756 | 5 mg Apixaban n = 16,553 | 20 mg Rivaroxaban n = 16,553 | ||||||
| Stroke/SE | 1.3 | 1.2 | 1.04 (0.70–1.56) | 0.843 | Stroke/SE | 1.2 | 1.2 | 0.93 (0.74–1.17) | 0.524 |
| MB | 3.8 | 5.0 | 0.73 (0.56–0.96) | 0.024 | MB | 3.3 | 5.7 | 0.53 (0.47–0.60) | <0.001 |
| 20 mg Rivaroxaban n = 17,123 | Warfarin n = 17,123 | 150 mg Dabigatran n = 6169 | 20 mg Rivaroxaban n = 6169 | ||||||
| Stroke/SE | 1.2 | 1.6 | 0.75 (0.62–0.90) | 0.002 | Stroke/SE | 1.3 | 1.1 | 1.18 (0.85–1.65) | 0.322 |
| MB | 5.8 | 5.5 | 1.04 (0.92–1.17) | 0.550 | MB | 3.6 | 4.9 | 0.74 (0.61–0.89) | 0.002 |
| NOACs vs. Warfarin | NOACs vs. NOACs | ||||||||
|---|---|---|---|---|---|---|---|---|---|
| Incidence per 100 person-years | Hazard Ratio | p-value | Incidence per 100 person-years | Hazard Ratio | p-value | ||||
| (95% CI) | (95% CI) | ||||||||
| Apixaban | Warfarin | Apixaban | Dabigatran | ||||||
| n = 6310 | n = 6310 | n = 2373 | n = 2373 | ||||||
| Stroke/SE | 1.3 | 1.6 | 0.72 | 0.113 | Stroke/SE | 0.7 | 1.3 | 0.51 | 0.175 |
| (0.48–1.08) | (0.19–1.35) | ||||||||
| MB | 4.6 | 7.8 | 0.53 | <0.001 | MB | 3.9 | 5.6 | 0.63 | 0.011 |
| (0.44–0.64) | (0.44–0.90) | ||||||||
| Dabigatran | Warfarin | Apixaban | Rivaroxaban | ||||||
| n = 2342 | n = 2342 | n = 7180 | n = 7180 | ||||||
| Stroke/SE | 1.5 | 1.9 | 0.77 | 0.304 | Stroke/SE | 1.3 | 1.3 | 0.93 | 0.618 |
| (0.47–1.27) | (0.68–1.26) | ||||||||
| MB | 5.7 | 7.4 | 0.76 | 0.088 | MB | 4.0 | 7.9 | 0.47 | <0.001 |
| (0.56–1.04) | (0.39–0.56) | ||||||||
| Rivaroxaban | Warfarin | Dabigatran | Rivaroxaban | ||||||
| n = 8055 | n = 8055 | n = 2617 | n = 2617 | ||||||
| Stroke/SE | 1.3 | 1.8 | 0.72 | 0.079 | Stroke/SE | 1.4 | 1.3 | 1.13 | 0.629 |
| (0.50–1.04) | (0.68–1.89) | ||||||||
| MB | 8.3 | 7.6 | 1.09 | 0.317 | MB | 5.4 | 6.7 | 0.79 | 0.086 |
| (0.92–1.28) | (0.61–1.03) | ||||||||
© 2020 by the authors. Licensee MDPI, Basel, Switzerland. This article is an open access article distributed under the terms and conditions of the Creative Commons Attribution (CC BY) license (http://creativecommons.org/licenses/by/4.0/).
Share and Cite
Deitelzweig, S.; Keshishian, A.; Kang, A.; Dhamane, A.D.; Luo, X.; Li, X.; Balachander, N.; Rosenblatt, L.; Mardekian, J.; Pan, X.; et al. Effectiveness and Safety of Oral Anticoagulants among NVAF Patients with Obesity: Insights from the ARISTOPHANES Study. J. Clin. Med. 2020, 9, 1633. https://doi.org/10.3390/jcm9061633
Deitelzweig S, Keshishian A, Kang A, Dhamane AD, Luo X, Li X, Balachander N, Rosenblatt L, Mardekian J, Pan X, et al. Effectiveness and Safety of Oral Anticoagulants among NVAF Patients with Obesity: Insights from the ARISTOPHANES Study. Journal of Clinical Medicine. 2020; 9(6):1633. https://doi.org/10.3390/jcm9061633
Chicago/Turabian StyleDeitelzweig, Steve, Allison Keshishian, Amiee Kang, Amol D. Dhamane, Xuemei Luo, Xiaoyan Li, Neeraja Balachander, Lisa Rosenblatt, Jack Mardekian, Xianying Pan, and et al. 2020. "Effectiveness and Safety of Oral Anticoagulants among NVAF Patients with Obesity: Insights from the ARISTOPHANES Study" Journal of Clinical Medicine 9, no. 6: 1633. https://doi.org/10.3390/jcm9061633
APA StyleDeitelzweig, S., Keshishian, A., Kang, A., Dhamane, A. D., Luo, X., Li, X., Balachander, N., Rosenblatt, L., Mardekian, J., Pan, X., Di Fusco, M., Garcia Reeves, A. B., Yuce, H., & Lip, G. Y. H. (2020). Effectiveness and Safety of Oral Anticoagulants among NVAF Patients with Obesity: Insights from the ARISTOPHANES Study. Journal of Clinical Medicine, 9(6), 1633. https://doi.org/10.3390/jcm9061633