Physiopathological Bases of the Disease Caused by HACE1 Mutations: Alterations in Autophagy, Mitophagy and Oxidative Stress Response

 , , , and
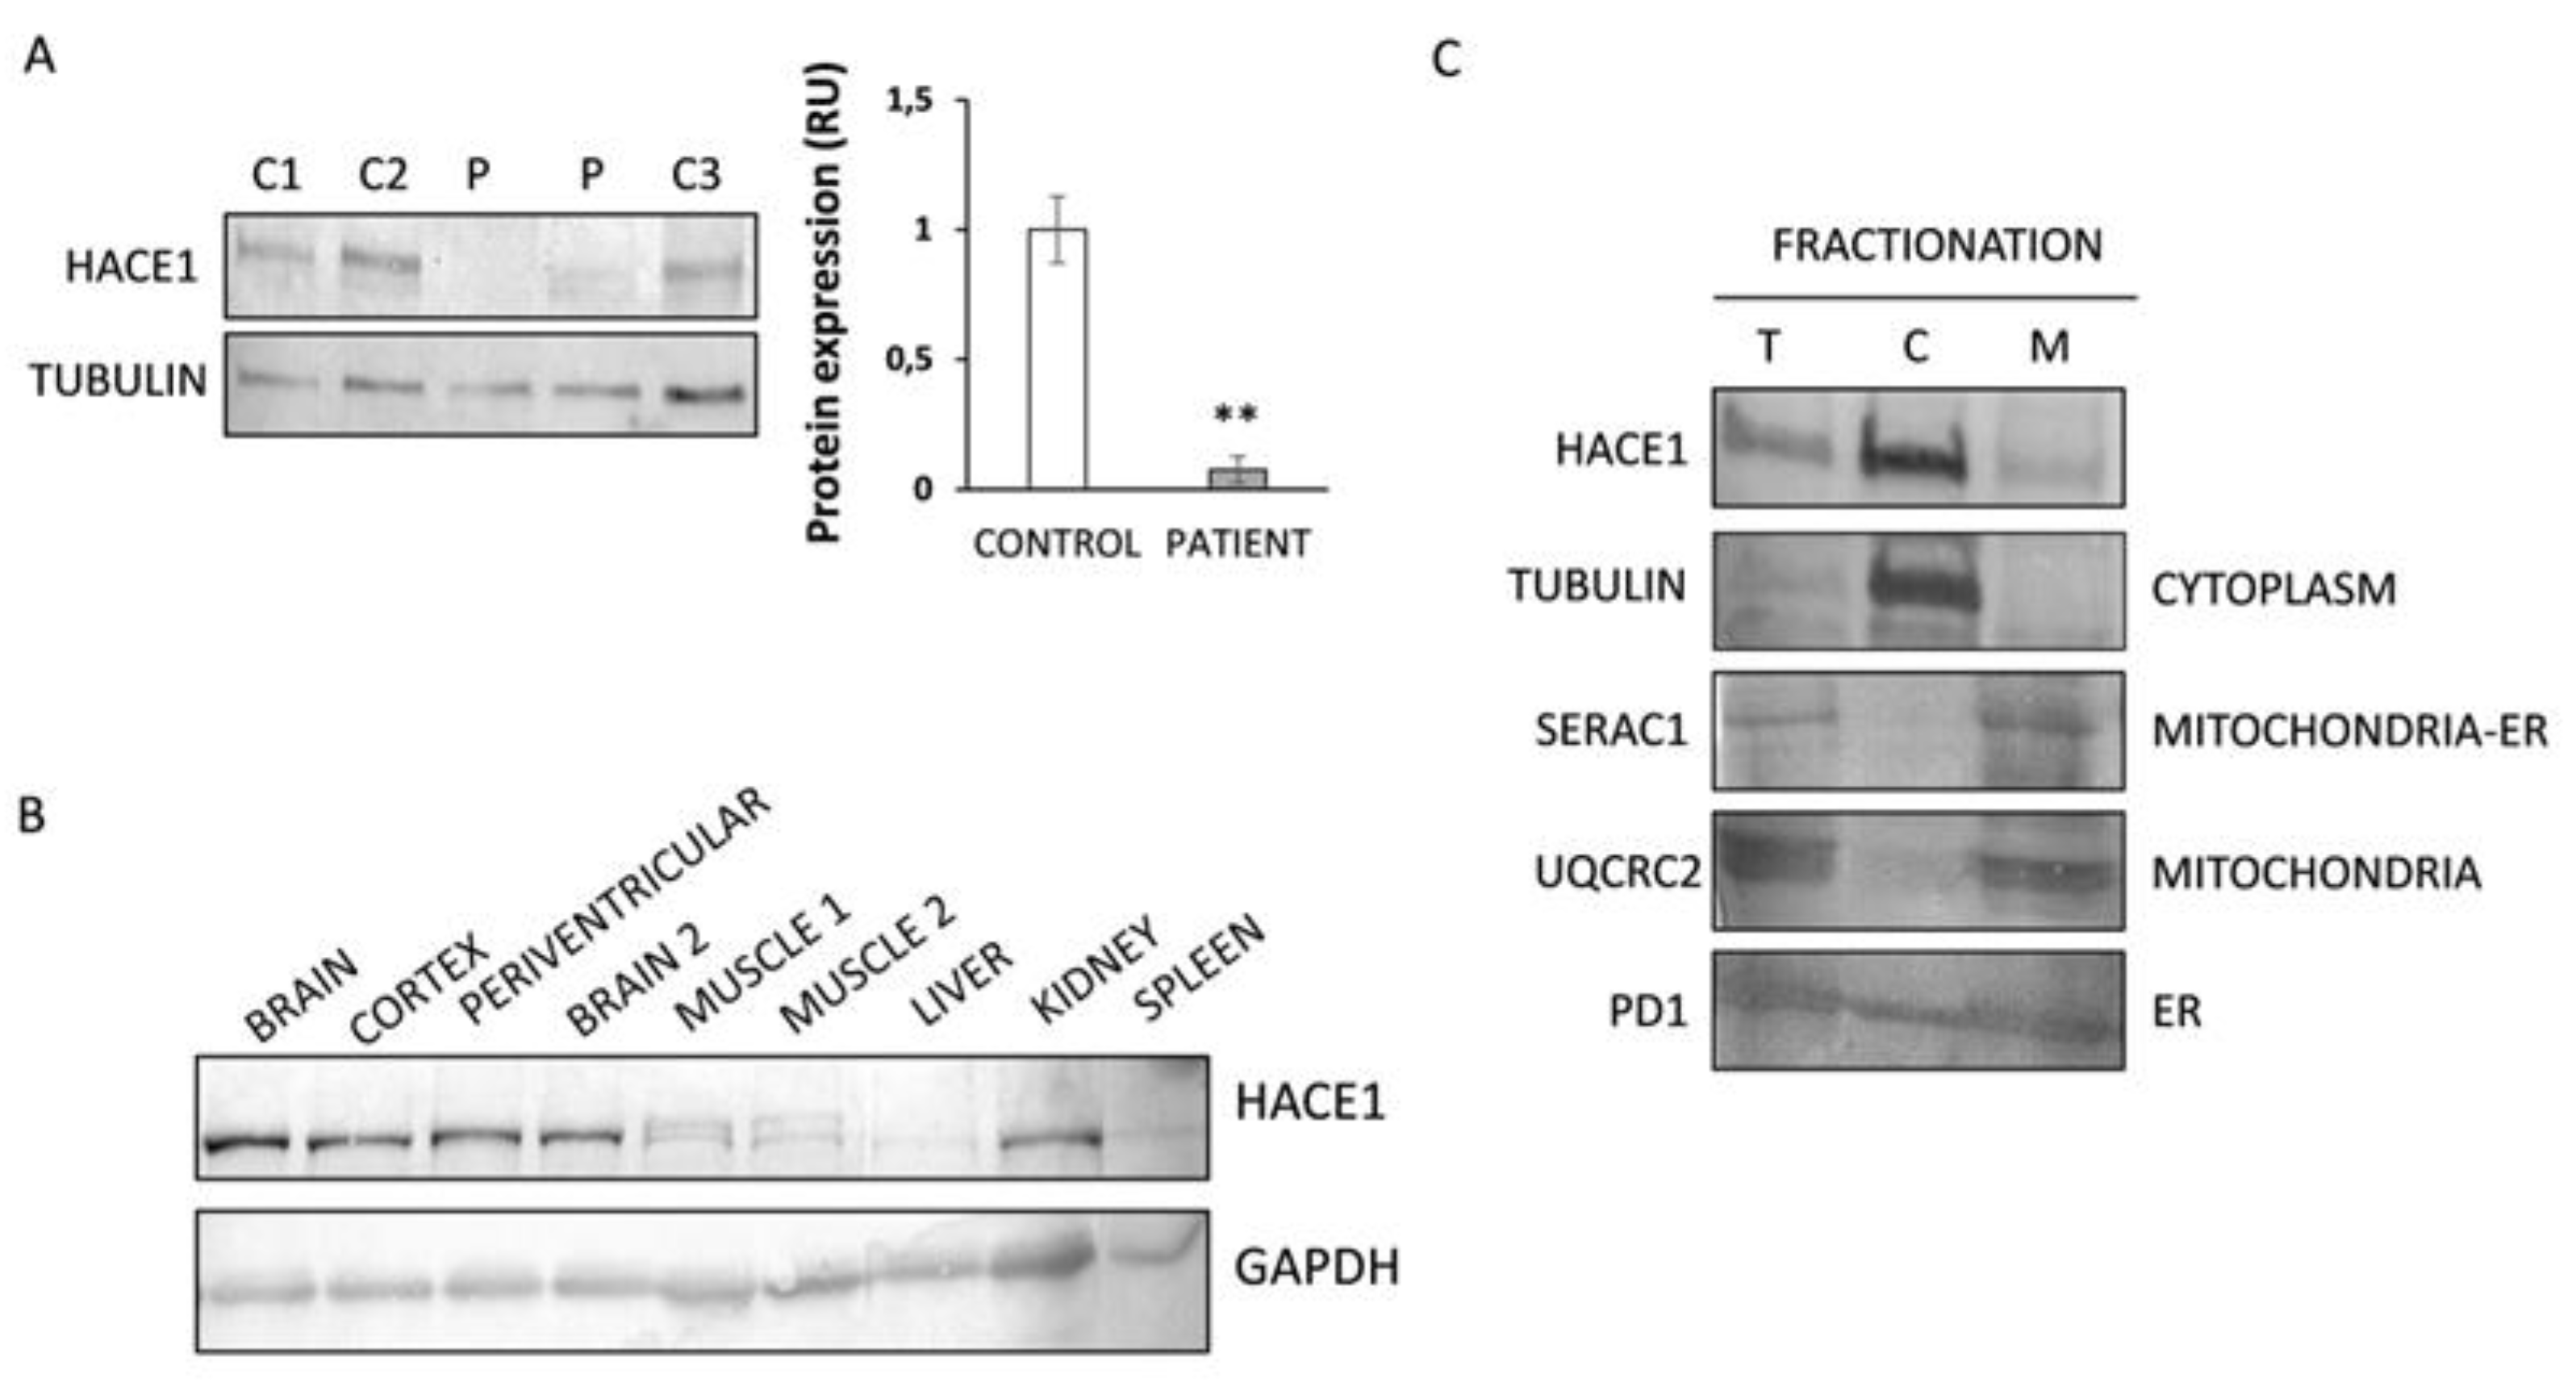
Abstract
1. Introduction
2. Experimental Section
2.1. Case Report
2.2. Whole Exome Sequencing
2.3. Cell Culture
2.4. Protein Expression Analysis
2.5. Blue Native-PAGE Analysis of Mitochondrial Complex and Supercomplex Assembly
2.6. High-Resolution Respirometry
2.7. Mitochondrial Network and Mitochondria Morphology Analysis
2.8. Analysis of Autophagy and Mitophagy in Fibroblasts
2.9. mRNA Expression Analysis
2.10. Analysis of Mitochondrial Superoxide Levels
2.11. Lipid Peroxidation Analysis
2.12. Statistics
3. Results
3.1. Identification of Mutations in HACE1
3.2. HACE1 Protein Expression Is Absent in Patient Fibroblasts
3.3. HACE1 Protein Is Mainly Expressed in Brain and Predominantly Localized in the Cytosolic Fraction
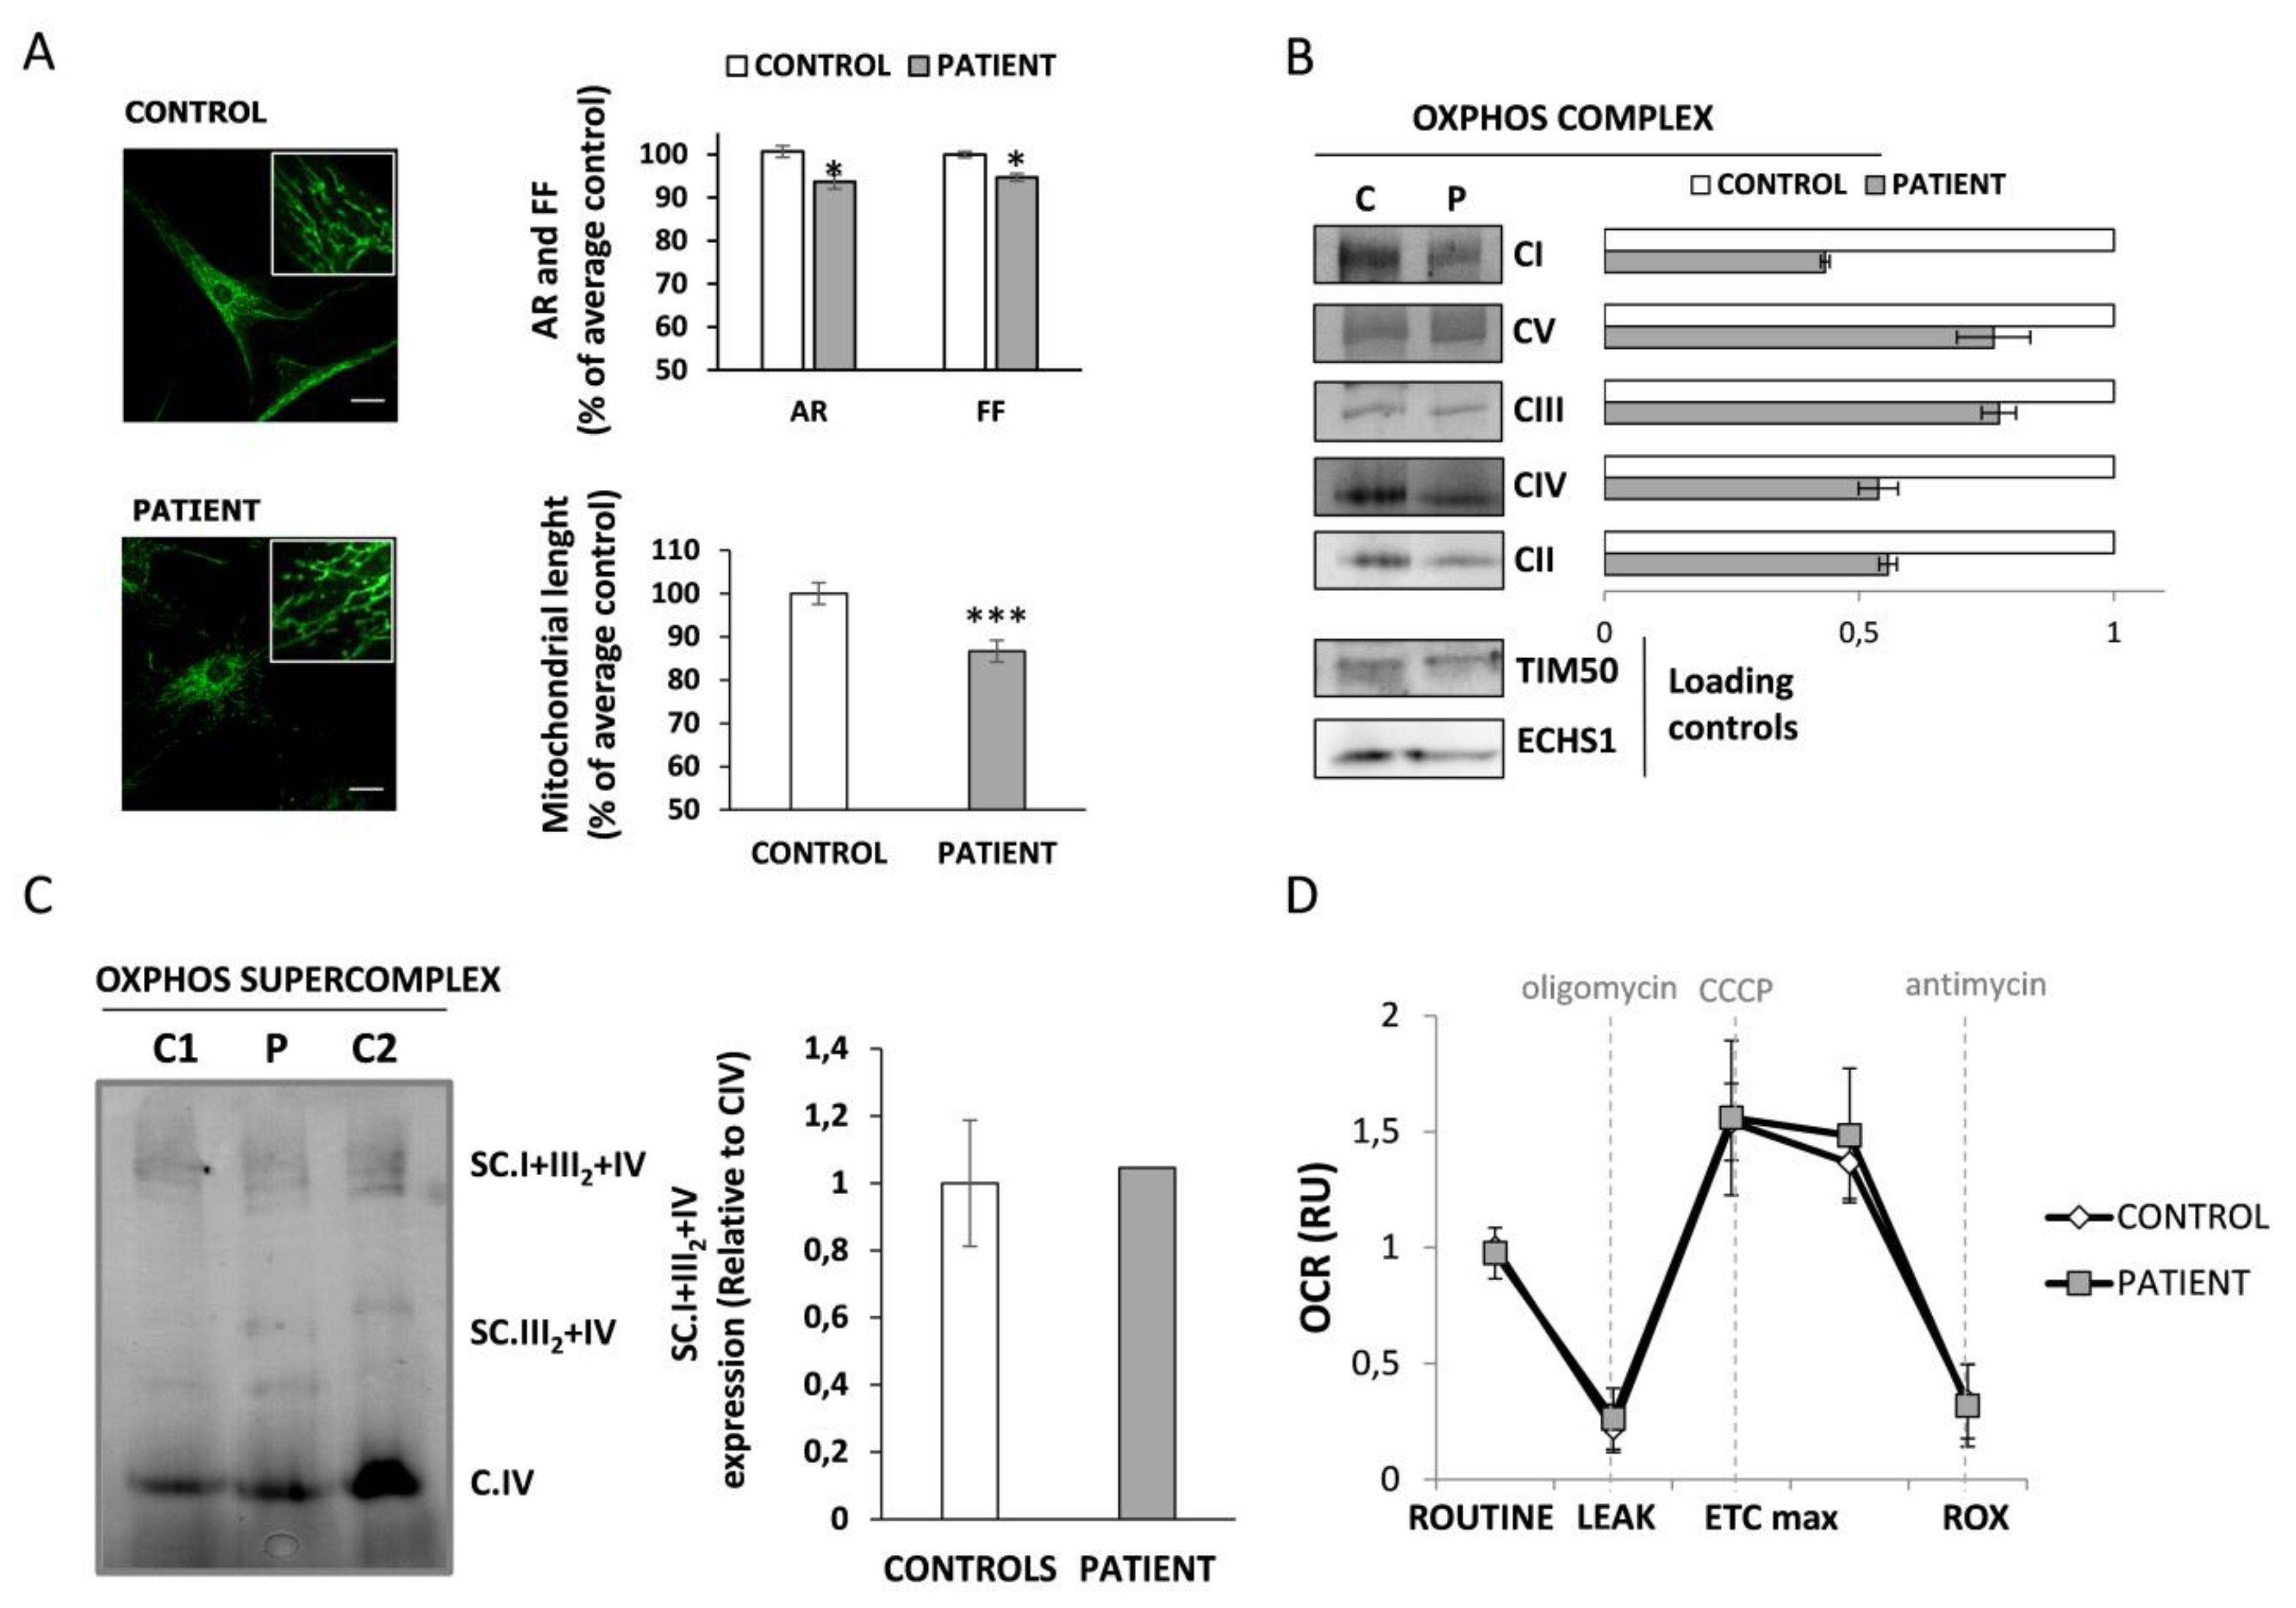
3.4. Mitochondrial Function Characterization in HACE1 Patient Fibroblasts
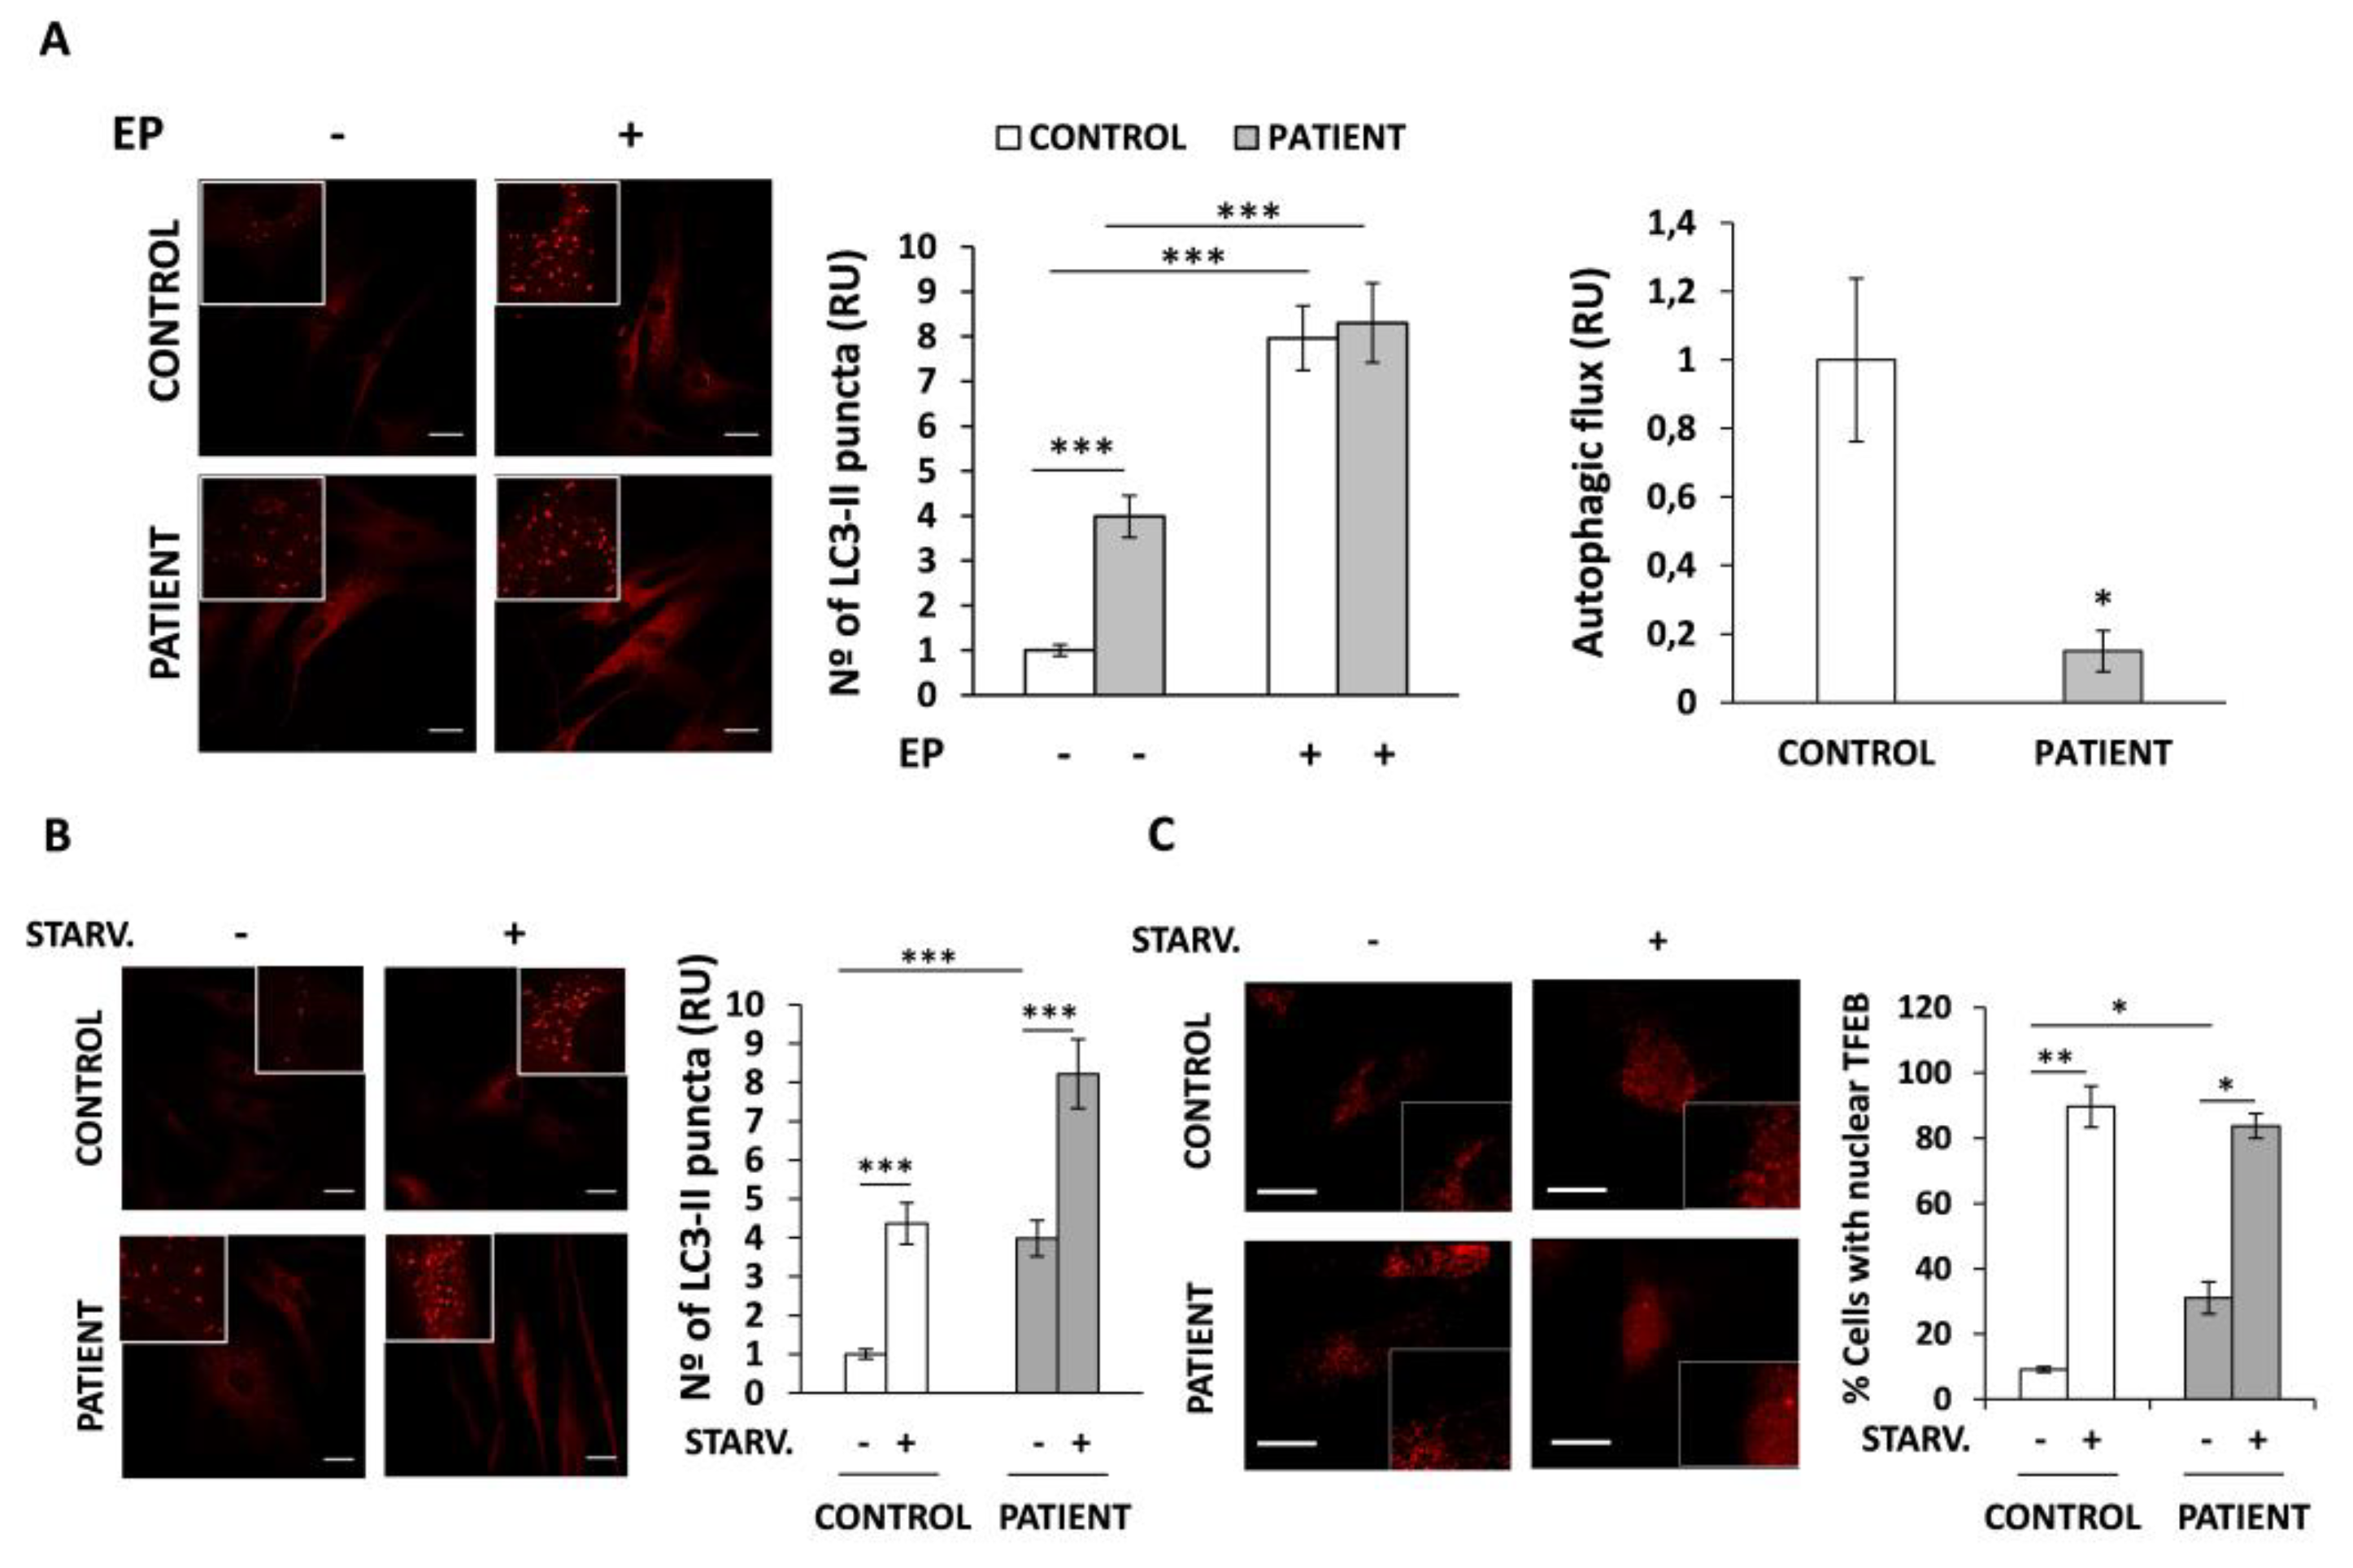
3.5. Autophagic Flux Is Altered in HACE1 Patient Fibroblasts
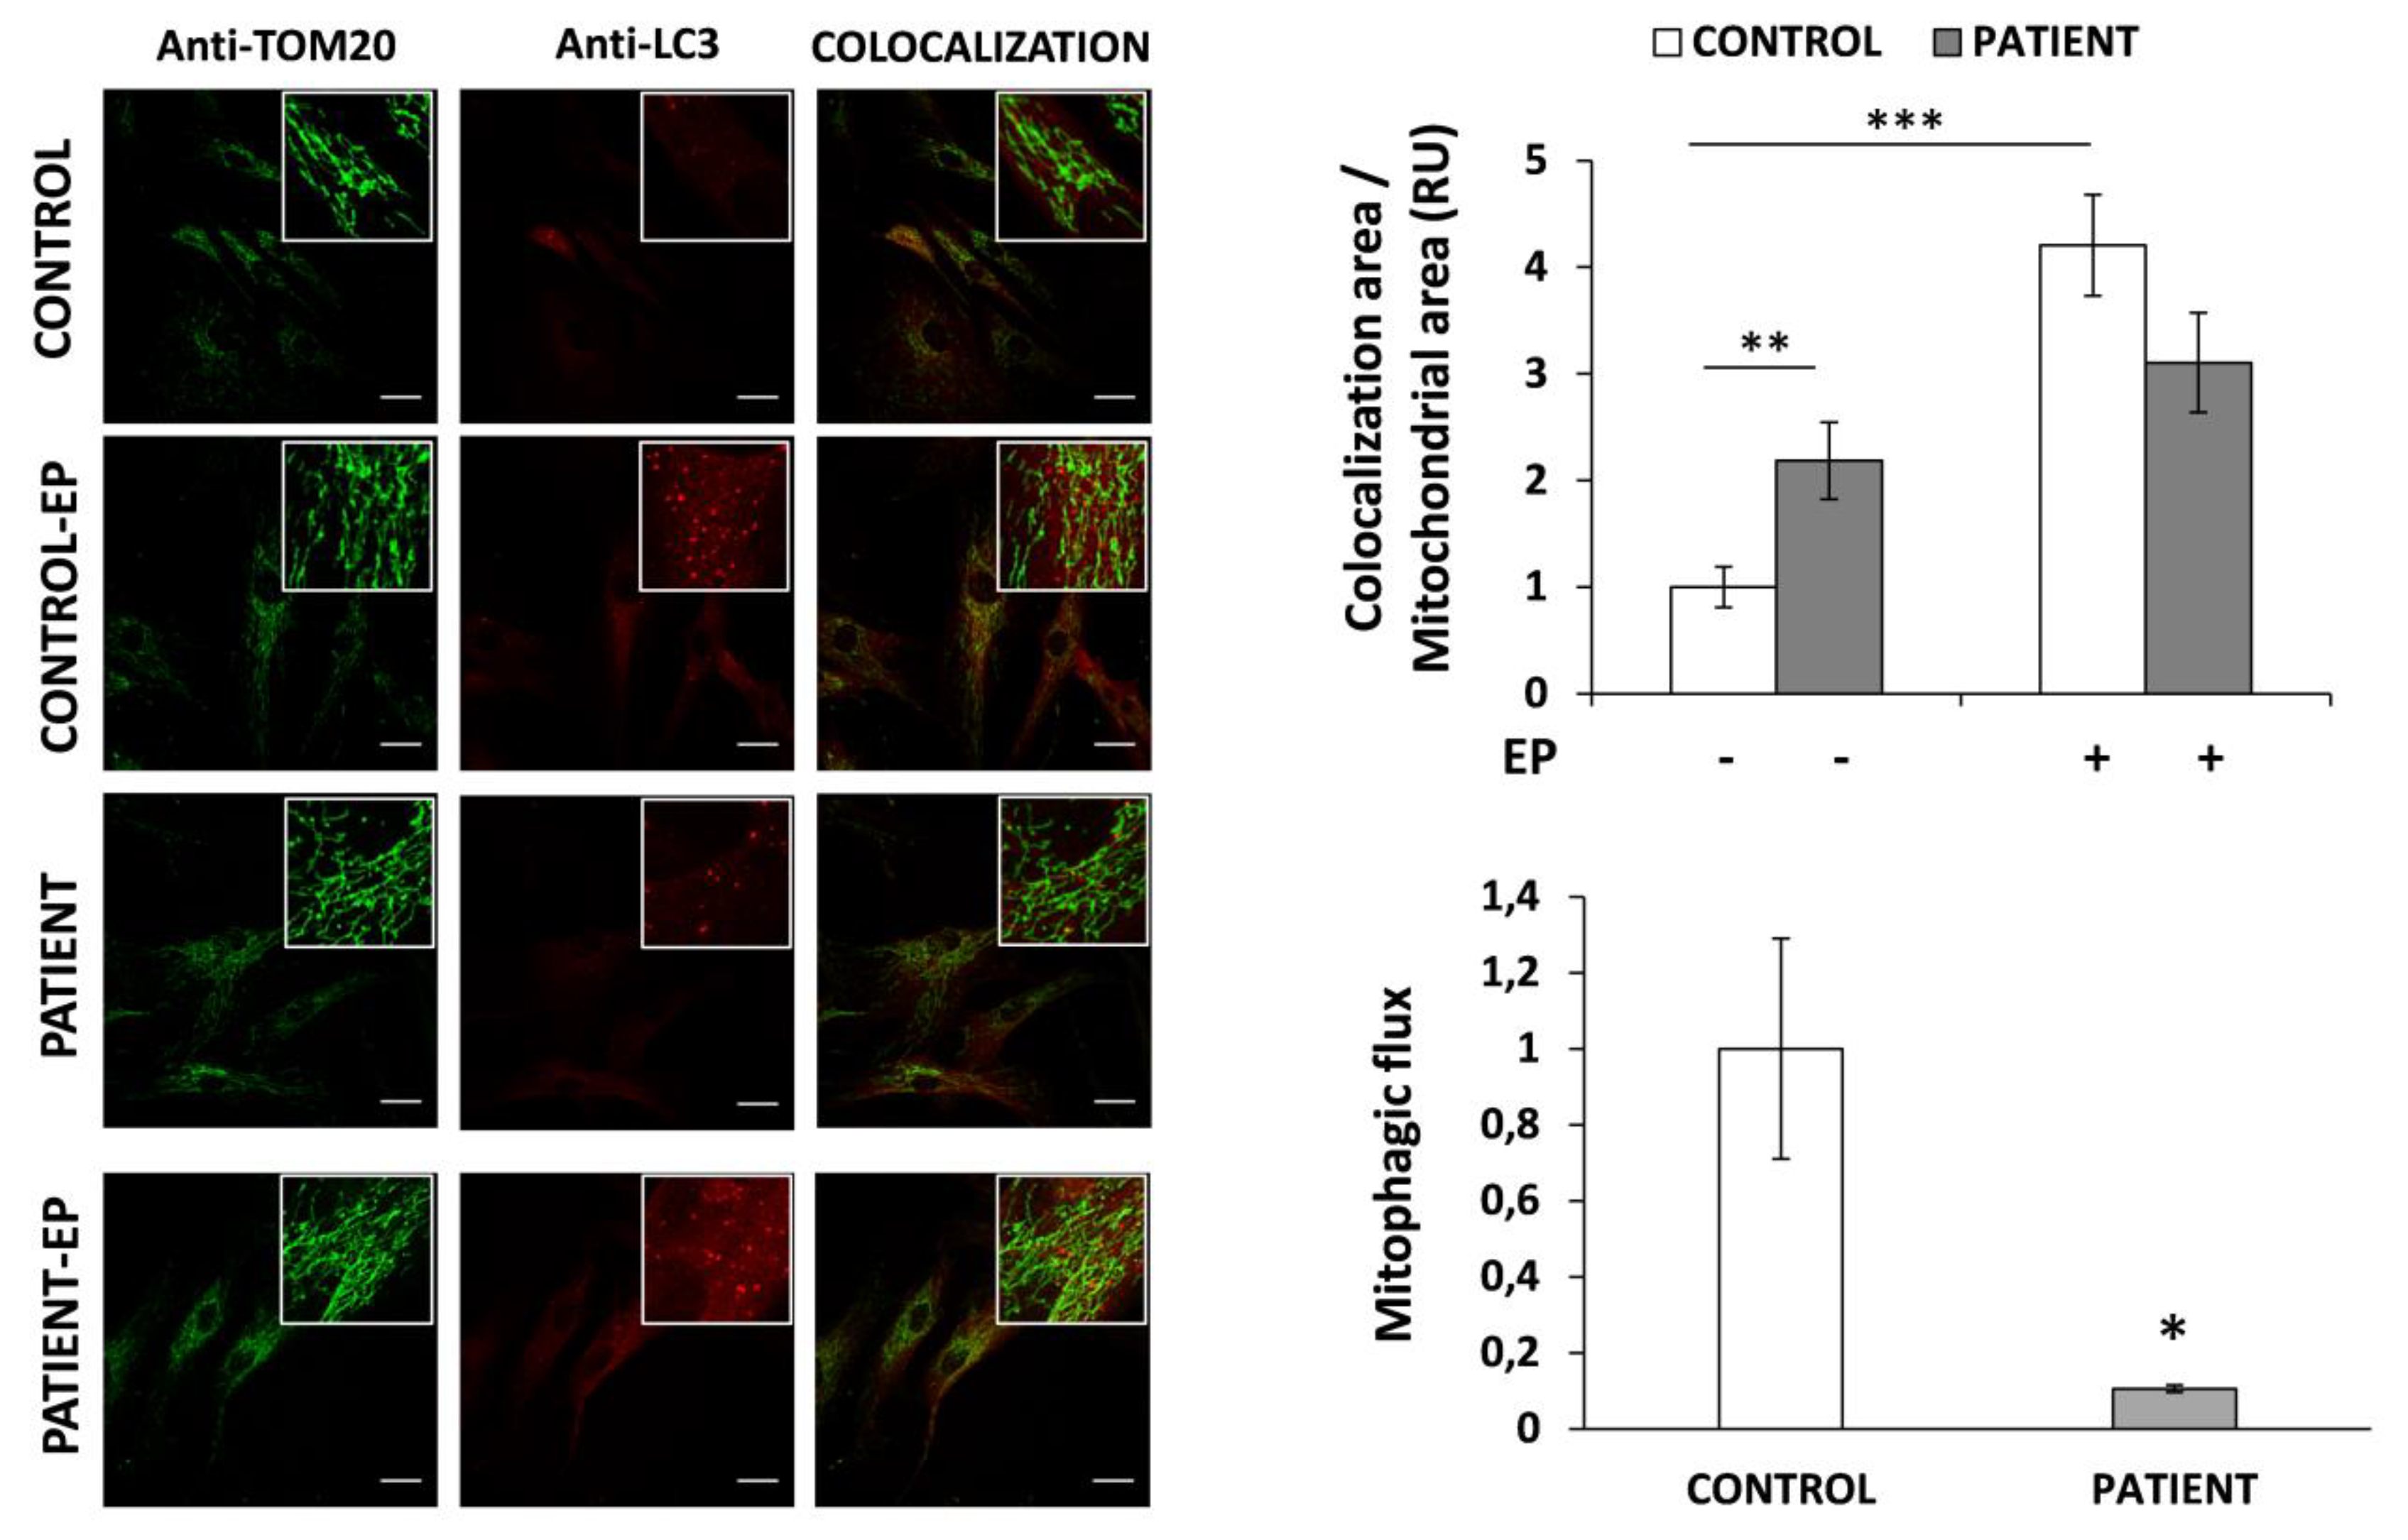
3.6. Mitophagy Is Altered in HACE1 Fibroblasts
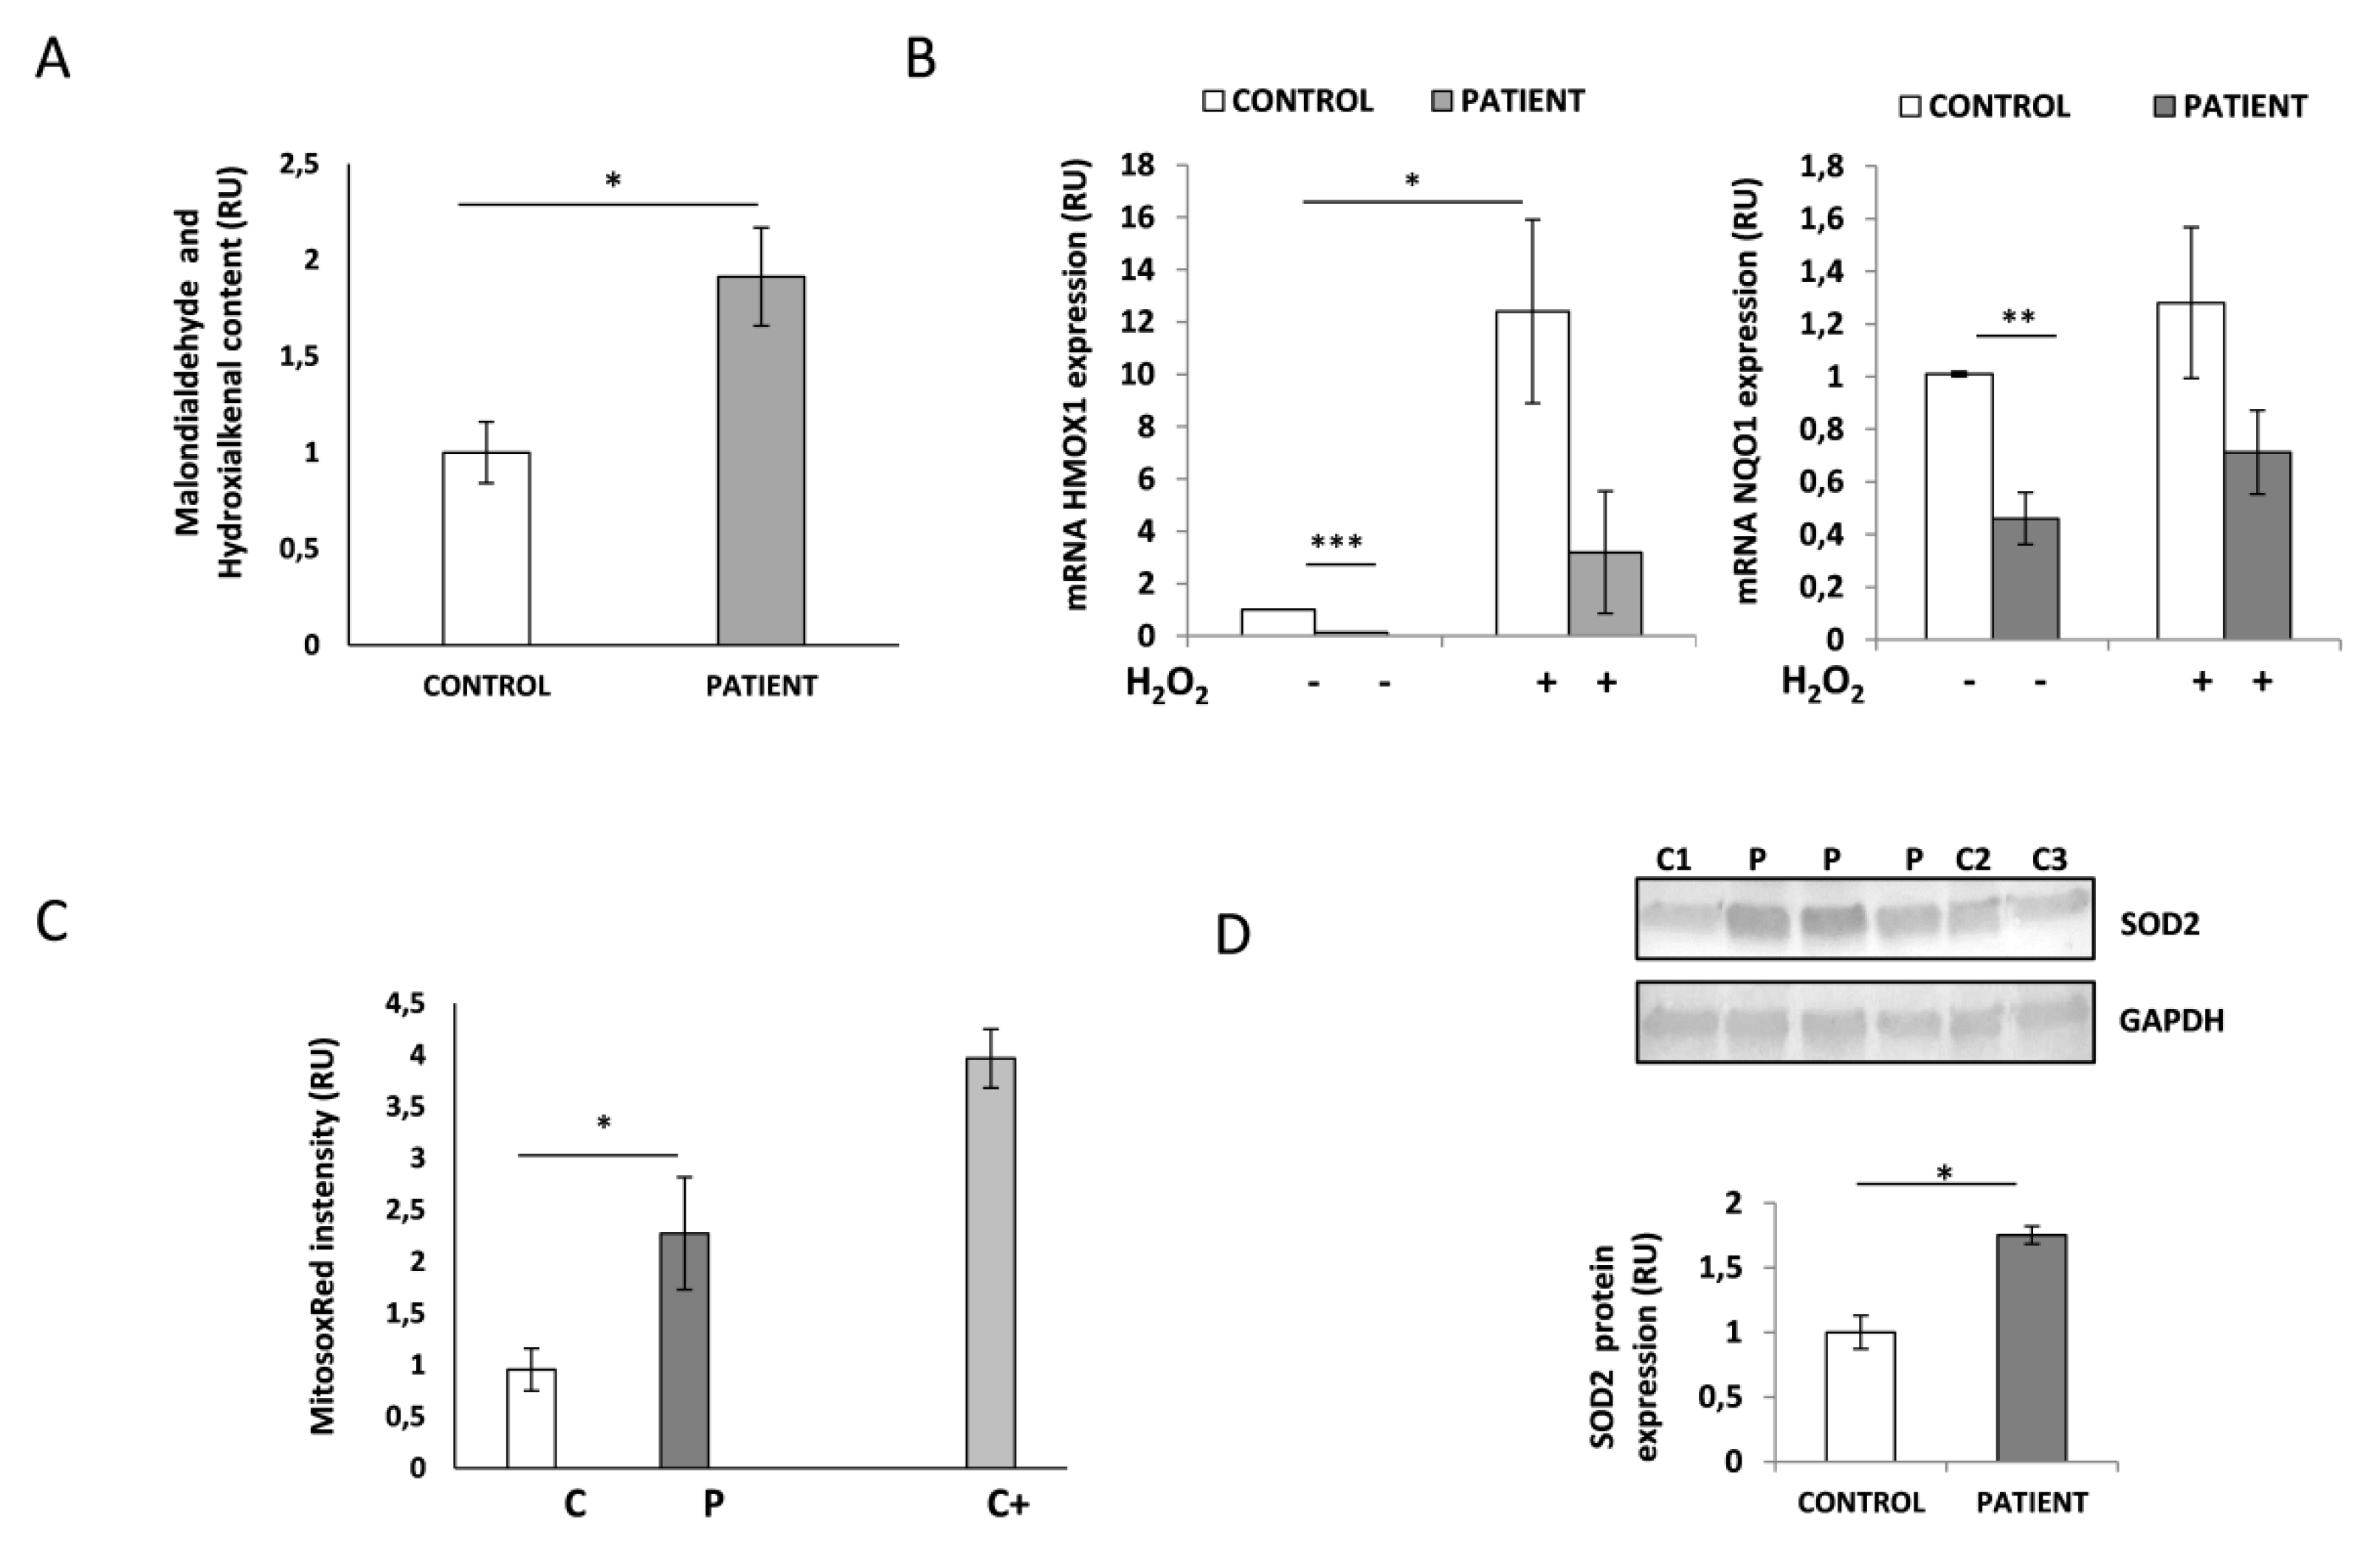
3.7. HACE1-Mutated Fibroblasts Accumulate Oxidative Damage and Have a Diminished Ability to Respond to Oxidative Stress
3.8. HACE1 Fibroblasts Had Increased Mitochondrial Oxidative Stress
4. Discussion
5. Conclusions
Supplementary Materials
Author Contributions
Funding
Acknowledgments
Conflicts of Interest
References
- Scheffner, M.; Kumar, S. Mammalian HECT ubiquitin-protein ligases: Biological and pathophysiological aspects. Biochim. Biophys. Acta-Mol. Cell Res. 2014, 1843, 61–74. [Google Scholar] [CrossRef] [PubMed]
- Fernandez, C.V.; Lestou, V.S.; Wildish, J.; Lee, C.L.Y.; Sorensen, P.H.B. Detection of a novel t (6;15) (q21;q21) in a pediatric Wilms tumor. Cancer Genet. Cytogenet. 2001, 129, 165–167. [Google Scholar] [CrossRef]
- Zhang, L.; Anglesio, M.S.; O’Sullivan, M.; Zhang, F.; Yang, G.; Sarao, R.; Nghiem, M.P.; Cronin, S.; Hara, H.; Melnyk, N.; et al. The E3 ligase HACE1 is a critical chromosome 6q21 tumor suppressor involved in multiple cancers. Nat. Med. 2007, 13, 1060–1069. [Google Scholar] [CrossRef] [PubMed]
- Rotblat, B.; Southwell, A.L.; Ehrnhoefer, D.E.; Skotte, N.H.; Metzler, M.; Franciosi, S.; Leprivier, G.; Somasekharan, S.P.; Barokas, A.; Deng, Y.; et al. HACE1 reduces oxidative stress and mutant Huntingtin toxicity by promoting the NRF2 response. Proc. Natl. Acad. Sci. USA 2014, 111, 3032–3037. [Google Scholar] [CrossRef] [PubMed]
- Ehrnhoefer, D.E.; Southwell, A.L.; Sivasubramanian, M.; Qiu, X.; Villanueva, E.B.; Xie, Y.; Waltl, S.; Anderson, L.; Fazeli, A.; Casal, L.; et al. HACE1 is essential for astrocyte mitochondrial function and influences Huntington disease phenotypes in vivo. Hum. Mol. Genet. 2018, 27, 239–253. [Google Scholar] [CrossRef] [PubMed]
- Daugaard, M.; Nitsch, R.; Razaghi, B.; McDonald, L.; Jarrar, A.; Torrino, S.; Castillo-Lluva, S.; Rotblat, B.; Li, L.; Malliri, A.; et al. Hace1 controls ROS generation of vertebrate Rac1-dependent NADPH oxidase complexes. Nat. Commun. 2013, 4, 1–13. [Google Scholar] [CrossRef]
- Zhang, L.; Chen, X.; Sharma, P.; Moon, M.; Sheftel, A.D.; Dawood, F.; Nghiem, M.P.; Wu, J.; Li, R.K.; Gramolini, A.O.; et al. HACE1-dependent protein degradation provides cardiac protection in response to haemodynamic stress. Nat. Commun. 2014, 5, 1–14. [Google Scholar] [CrossRef]
- Liu, Z.; Chen, P.; Gao, H.; Gu, Y.; Yang, J.; Peng, H.; Xu, X.; Wang, H.; Yang, M.; Liu, X.; et al. Ubiquitylation of Autophagy Receptor Optineurin by HACE1 Activates Selective Autophagy for Tumor Suppression. Cancer Cell 2014, 26, 106–120. [Google Scholar] [CrossRef]
- OMIM. Online Mendelian Inheritance in Man, OMIM®. McKusick-Nathans Institute of Genetic Medicine, Johns Hopkins University (Baltimore, MD). Available online: http://omim.org/ (accessed on 26 February 2020).
- Akawi, N.; McRae, J.; Ansari, M.; Balasubramanian, M.; Blyth, M.; Brady, A.F.; Clayton, S.; Cole, T.; Deshpande, C.; Fitzgerald, T.W.; et al. Discovery of four recessive developmental disorders using probabilistic genotype and phenotype matching among 4125 families. Nat. Genet. 2015, 47, 1363–1369. [Google Scholar] [CrossRef]
- Hollstein, R.; Parry, D.A.; Nalbach, L.; Logan, C.V.; Strom, T.M.; Hartill, V.L.; Carr, I.M.; Korenke, G.C.; Uppal, S.; Ahmed, M.; et al. HACE1 deficiency causes an autosomal recessive neurodevelopmental syndrome. J. Med. Genet. 2015, 52, 797–803. [Google Scholar] [CrossRef]
- Hariharan, N.; Ravi, S.; Pradeep, B.E.; Subramanyam, K.N.; Choudhary, B.; Srinivasan, S.; Khanchandani, P. A novel loss-of-function mutation in HACE1 is linked to a genetic disorder in a patient from India. Hum. Genome Var. 2018, 5, 1–4. [Google Scholar] [CrossRef] [PubMed]
- Nagy, V.; Hollstein, R.; Pai, T.P.; Herde, M.K.; Buphamalai, P.; Moeseneder, P.; Lenartowicz, E.; Kavirayani, A.; Korenke, G.C.; Kozieradzki, I.; et al. HACE1 deficiency leads to structural and functional neurodevelopmental defects. Neurol. Genet. 2019, 5, e330. [Google Scholar] [CrossRef] [PubMed]
- Torrino, S.; Visvikis, O.; Doye, A.; Boyer, L.; Stefani, C.; Munro, P.; Bertoglio, J.; Gacon, G.; Mettouchi, A.; Lemichez, E. The E3 ubiquitin-ligase HACE1 catalyzes the ubiquitylation of active Rac1. Dev. Cell 2011, 21, 959–965. [Google Scholar] [CrossRef]
- Luo, L.; Hensch, T.K.; Ackerman, L.; Barbel, S.; Jan, L.Y.; Jan, Y.N. Differential effects of the Rac GTPase on Purkinje cell axons and dendritic trunks and spines. Nature 1996, 379, 837–840. [Google Scholar] [CrossRef] [PubMed]
- Stankiewicz, T.R.; Linseman, D.A. Rho family GTPases: Key players in neuronal development, neuronal survival, and neurodegeneration. Front. Cell. Neurosci. 2014, 8, 314. [Google Scholar] [CrossRef] [PubMed]
- Mulherkar, S.; Uddin, M.D.; Couvillon, A.D.; Sillitoe, R.V.; Tolias, K.F. The small GTPases RhoA and Rac1 regulate cerebellar development by controlling cell morphogenesis, migration and foliation. Dev. Biol. 2014, 394, 39–53. [Google Scholar] [CrossRef]
- Deng, H.X. HACE1, RAC1, and what else in the pathogenesis of SPPRS? Neurol. Genet. 2019, 5, 4–5. [Google Scholar] [CrossRef]
- Wortmann, S.B.; Kluijtmans, L.A.; Engelke, U.F.H.; Wevers, R.A.; Morava, E. The 3-methylglutaconic acidurias: What’s new? J. Inherit. Metab. Dis. 2012, 35, 13–22. [Google Scholar] [CrossRef]
- Laurie, S.; Fernandez-Callejo, M.; Marco-Sola, S.; Trotta, J.R.; Camps, J.; Chacón, A.; Espinosa, A.; Gut, M.; Gut, I.; Heath, S.; et al. From Wet-Lab to Variations: Concordance and Speed of Bioinformatics Pipelines for Whole Genome and Whole Exome Sequencing. Hum. Mutat. 2016, 37, 1263–1271. [Google Scholar] [CrossRef]
- Wittig, I.; Braun, H.P.; Schägger, H. Blue native PAGE. Nat. Protoc. 2006, 1, 418–422. [Google Scholar] [CrossRef]
- Pesta, D.; Gnaiger, E. High-Resolution Respirometry: OXPHOS Protocols for Human Cells and Permeabilized Fibers from Small Biopsies of Human Muscle. Methods Mol. Biol. 2012, 810, 25–58. [Google Scholar]
- Schindelin, J.; Arganda-Carreras, I.; Frise, E.; Kayning, V.; Longair, M.; Pietzsch, T.; Preibisch, S.; Rueden, C.; Saalfeld, S.; Schmid, B.; et al. Fiji: An open-source platform for biological-image analysis. Nat. Methods 2012, 9, 676–682. [Google Scholar] [CrossRef] [PubMed]
- Diot, A.; Hinks-Roberts, A.; Lodge, T.; Liao, C.; Dombi, E.; Morten, K.; Brady, S.; Fratter, C.; Carver, J.; Muir, R.; et al. A novel quantitative assay of mitophagy: Combining high content fluorescence microscopy and mitochondrial DNA load to quantify mitophagy and identify novel pharmacological tools against pathogenic heteroplasmic mtDNA. Pharmacol. Res. 2015, 100, 24–35. [Google Scholar] [CrossRef] [PubMed]
- Medina, D.L.; Settembre, C.; Ballabio, A. Methods to Monitor and Manipulate TFEB Activity During Autophagy. In Methods in Enzymology. Molecular Characterization of Autophagic Responses Part, B; Galluzi, L., Bravo-San Pedro, J.M., Kroemer, G., Eds.; Elsevier Inc.: Amsterdam, The Netherlands, 2017; Volume 588, pp. 61–78. [Google Scholar]
- Kumar, S.; Flacke, J.P.; Kostin, S.; Appukuttan, A.; Reusch, H.P.; Ladilov, Y. SLC4A7 sodium bicarbonate co-transporter controls mitochondrial apoptosis in ischaemic coronary endothelial cells. Cardiovasc. Res. 2011, 89, 392–400. [Google Scholar] [CrossRef] [PubMed]
- Zehmer, J.K.; Bartz, R.; Liu, P.; Anderson, R.G.W. Identification of a novel N-terminal hydrophobic sequence that targets proteins to lipid droplets. J. Cell Sci. 2008, 121, 1852–1860. [Google Scholar] [CrossRef] [PubMed]
- Terada, K.; Manchikalapudi, P.; Noiva, R.; Jauregui, H.O.; Stockert, R.J.; Schilsky, M.L. Secretion, surface localization, turnover, and steady state expression of protein disulfide isomerase in rat hepatocytes. J. Biol. Chem. 1995, 270, 20410–20416. [Google Scholar] [CrossRef]
- Boycott, K.M.; Hartley, T.; Biesecker, L.G.; Gibbs, R.A.; Innes, A.M.; Riess, O.; Belmont, J.; Dunwoodie, S.L.; Jojic, N.; Lassmann, T.; et al. A Diagnosis for All Rare Genetic Diseases: The Horizon and the Next Frontiers. Cell 2019, 177, 32–37. [Google Scholar] [CrossRef]
- Anglesio, M.S.; Evdokimova, V.; Melnyk, N.; Zhang, L.; Fernandez, C.V.; Grundy, P.E.; Leach, S.; Marra, M.A.; Brooks-Wilson, A.R.; Penninger, J.; et al. Differential expression of a novel ankyrin containing E3 ubiquitin-protein ligase, Hace1, in sporadic Wilms’ tumor versus normal kidney. Hum. Mol. Genet. 2004, 13, 2061–2074. [Google Scholar] [CrossRef]
- Nagase, T.; Kikuno, R.; Ishikawa, K.I.; Hirosawa, M.; Ohara, O. Prediction of the coding sequences of unidentified human genes. XVI. The complete sequences of 150 new cDNA clones from brain which code for large proteins in vitro. DNA Res. 2000, 7, 65–73. [Google Scholar] [CrossRef]
- Jones, D.E.; Perez, L.; Ryan, R.O. 3-Methylglutaric acid in energy metabolism. Clin. Chim. Acta 2020, 502, 233–239. [Google Scholar] [CrossRef]
- Levine, B.; Kroemer, G. Autophagy in the Pathogenesis of Disease. Cell 2008, 132, 27–42. [Google Scholar] [CrossRef] [PubMed]
- Mizushima, N.; Yoshimori, T.; Levine, B. Methods in Mammalian Autophagy Research. Cell 2010, 140, 313–326. [Google Scholar] [CrossRef]
- Rubistein, D.C. The roles of intracellular protein-degradation pathways in neurodegeneration. Nature 2006, 443, 780–786. [Google Scholar] [CrossRef]
- Peker, N.; Gozuacik, D. Autophagy as a cellular stress response mechanism in the nervous system. J. Mol. Biol. 2020. [CrossRef] [PubMed]
- Kabeya, Y.; Mizushima, N.; Ueno, T.; Yamamoto, A.; Kirisako, T.; Noda, T.; Kominami, E.; Ohsumi, Y.; Yoshimori, T. LC3, a mammalian homologue of yeast Apg, is localized in autophagosomemembranes after processing. EMBO J. 2000, 19, 5720–5728. [Google Scholar] [CrossRef] [PubMed]
- Tanida, I.; Minematsu-Ikeguchi, N.; Ueno, T.; Kominami, E. Lysosomal turnover, but not a cellular level, of endogenous LC3 is a marker for autophagy. Autophagy 2005, 1, 84–91. [Google Scholar] [CrossRef] [PubMed]
- Zorov, D.B.; Juhaszova, M.; Sollott, S.J. Mitochondrial reactive oxygen species (ROS) and ROS-induced ROS release. Physiol. Rev. 2014, 94, 909–950. [Google Scholar] [CrossRef] [PubMed]
- Olsen, R.K.J.; Cornelius, N.; Gregersen, N. Redox signalling and mitochondrial stress responses; lessons from inborn errors of metabolism. J. Inherit. Metab. Dis. 2015, 38, 703–719. [Google Scholar] [CrossRef]
- Hamanaka, R.B.; Chandel, N.S. Mitochondrial reactive oxygen species regulate cellular signaling and dictate biological outcomes. Trends Biochem. Sci. 2010, 35, 505–513. [Google Scholar] [CrossRef]
- Malhotra, D.; Portales-Casamar, E.; Singh, A.; Srivastava, S.; Arenillas, D.; Happel, C.; Shyr, C.; Wakabayashi, N.; Kensler, T.W.; Wasserman, W.W.; et al. Global mapping of binding sites for Nrf2 identifies novel targets in cell survival response through chip-seq profiling and network analysis. Nucleic Acids Res. 2010, 38, 5718–5734. [Google Scholar] [CrossRef]
- Kensler, T.W.; Wakabayashi, N.; Biswal, S. Cell survival responses to environmental stresses via the Keap1-Nrf2-ARE pathway. Annu. Rev. Pharmacol. Toxicol. 2007, 47, 89–116. [Google Scholar] [CrossRef] [PubMed]
- Wild, A.C.; Moinova, H.R.; Mulcahy, R.T. Regulation of gamma-glutamylcysteine synthetase subunit gene expression by the transcription factor Nrf2. J. Biol. Chem. 1999, 274, 33627–33636. [Google Scholar] [CrossRef] [PubMed]
- Itoh, K.; Chiba, T.; Takahashi, S.; Ishii, T.; Igarashi, K.; Katoh, Y.; Oyake, T.; Hayashi, N.; Satoh, K.; Hatayama, I.; et al. An Nrf2/small Maf heterodimer mediates the induction of phase II detoxifying enzyme genes through antioxidant response elements. Biochem. Biophys. Res. Commun. 1997, 236, 313–322. [Google Scholar] [CrossRef] [PubMed]
- Youle, R.J.; Narenda, D.P. Mechanisms of mitophagy. Nat. Rev. Mol. Cell. Biol. 2011, 12, 9–14. [Google Scholar] [CrossRef]
- McWilliams, T.G.; Ganley, I.G. Life in lights: Tracking mitochondrial delivery to lysosomes in vivo. Autophagy 2016, 12, 2506–2507. [Google Scholar] [CrossRef][Green Version]
- McWilliams, T.G.; Prescott, A.R.; Allen, G.F.; Tamjar, J.; Munson, M.J.; Thomson, C.; Muqit, M.M.; Ganley, I.G. mito-QC illuminates mitophagy and mitochondrial architecture in vivo. J. Cell Biol. 2016, 214, 333–345. [Google Scholar] [CrossRef]


© 2020 by the authors. Licensee MDPI, Basel, Switzerland. This article is an open access article distributed under the terms and conditions of the Creative Commons Attribution (CC BY) license (http://creativecommons.org/licenses/by/4.0/).
Share and Cite
Ugarteburu, O.; Sánchez-Vilés, M.; Ramos, J.; Barcos-Rodríguez, T.; Garrabou, G.; García-Villoria, J.; Ribes, A.; Tort, F. Physiopathological Bases of the Disease Caused by HACE1 Mutations: Alterations in Autophagy, Mitophagy and Oxidative Stress Response. J. Clin. Med. 2020, 9, 913. https://doi.org/10.3390/jcm9040913
Ugarteburu O, Sánchez-Vilés M, Ramos J, Barcos-Rodríguez T, Garrabou G, García-Villoria J, Ribes A, Tort F. Physiopathological Bases of the Disease Caused by HACE1 Mutations: Alterations in Autophagy, Mitophagy and Oxidative Stress Response. Journal of Clinical Medicine. 2020; 9(4):913. https://doi.org/10.3390/jcm9040913
Chicago/Turabian StyleUgarteburu, Olatz, Marta Sánchez-Vilés, Julio Ramos, Tamara Barcos-Rodríguez, Gloria Garrabou, Judit García-Villoria, Antonia Ribes, and Frederic Tort. 2020. "Physiopathological Bases of the Disease Caused by HACE1 Mutations: Alterations in Autophagy, Mitophagy and Oxidative Stress Response" Journal of Clinical Medicine 9, no. 4: 913. https://doi.org/10.3390/jcm9040913
APA StyleUgarteburu, O., Sánchez-Vilés, M., Ramos, J., Barcos-Rodríguez, T., Garrabou, G., García-Villoria, J., Ribes, A., & Tort, F. (2020). Physiopathological Bases of the Disease Caused by HACE1 Mutations: Alterations in Autophagy, Mitophagy and Oxidative Stress Response. Journal of Clinical Medicine, 9(4), 913. https://doi.org/10.3390/jcm9040913