Predicting the Response of High Frequency Spinal Cord Stimulation in Patients with Failed Back Surgery Syndrome: A Retrospective Study with Machine Learning Techniques

 , ,
, ,
Abstract
1. Introduction
2. Experimental Section
2.1. Participants
2.2. Data Collection
2.3. Data Processing
2.4. Statistical Analysis
3. Results
3.1. Patient Characteristics
3.2. Feature Selection
3.3. Machine Learning
4. Discussion
5. Conclusions
Author Contributions
Funding
Conflicts of Interest
References
- Remacle, T.; Mauviel, S.; Renwart, H.J.; Ghassempour, K.; Belle, F.; Luckers, O.; Bex, V.; Remacle, J.M.; Bonhomme, V. Long-Term Multicolumn-Lead Spinal Cord Stimulation Efficacy in Patients with Failed Back Surgery Syndrome: A Six-Year Prospective Follow-up Study. World Neurosurg. 2020, 142, e245–e252. [Google Scholar] [PubMed]
- Deer, T.R.; Krames, E.; Mekhail, N.; Pope, J.; Leong, M.; Stanton-Hicks, M.; Golovac, S.; Kapural, L.; Alo, K.; Anderson, J.; et al. The appropriate use of neurostimulation: New and evolving neurostimulation therapies and applicable treatment for chronic pain and selected disease states. Neuromodul. Appropr. Consens. Comm. Neuromodul. 2014, 17, 599–615. [Google Scholar]
- Taylor, R.S. Spinal cord stimulation in complex regional pain syndrome and refractory neuropathic back and leg pain/failed back surgery syndrome: Results of a systematic review and meta-analysis. J. Pain Symptom Manag. 2006, 31, S13–S19. [Google Scholar]
- Niyomsri, S.; Duarte, R.V.; Eldabe, S.; Fiore, G.; Kopell, B.H.; McNicol, E.; Taylor, R.S. A Systematic Review of Economic Evaluations Reporting the Cost-Effectiveness of Spinal Cord Stimulation. Value Health 2020, 23, 656–665. [Google Scholar] [PubMed]
- Mekhail, N.; Mehanny, D.S.; Armanyous, S.; Costandi, S.; Saweris, Y.; Azer, G.; Bolash, R. Choice of spinal cord stimulation versus targeted drug delivery in the management of chronic pain: A predictive formula for outcomes. Reg. Anesth. Pain Med. 2020. [Google Scholar] [CrossRef]
- Prabhala, T.; Kumar, V.; Gruenthal, E.; Collison, C.; Prusik, J.; Owusu, S.; Hobson, E.; McCallum, S.E.; Pilitsis, J.G. Use of a Psychological Evaluation Tool as a Predictor of Spinal Cord Stimulation Outcomes. Neuromodulation 2019, 22, 194–199. [Google Scholar]
- Fama, C.A.; Chen, N.; Prusik, J.; Kumar, V.; Wilock, M.; Roth, S.; Pilitsis, J.G. The Use of Preoperative Psychological Evaluations to Predict Spinal Cord Stimulation Success: Our Experience and a Review of the Literature. Neuromodulation 2016, 19, 429–436. [Google Scholar]
- Bendinger, T.; Plunkett, N.; Poole, D.; Turnbull, D. Psychological Factors as Outcome Predictors for Spinal Cord Stimulation. Neuromodulation 2015, 18, 465–471. [Google Scholar]
- Rashidi, H.H.; Tran, N.K.; Betts, E.V.; Howell, L.P.; Green, R. Artificial Intelligence and Machine Learning in Pathology: The Present Landscape of Supervised Methods. Acad. Pathol. 2019, 6, 2374289519873088. [Google Scholar]
- Rajkomar, A.; Dean, J.; Kohane, I. Machine Learning in Medicine. N. Engl. J. Med. 2019, 380, 1347–1358. [Google Scholar]
- Hofer, I.S.; Burns, M.; Kendale, S.; Wanderer, J.P. Realistically Integrating Machine Learning Into Clinical Practice: A Road Map of Opportunities, Challenges, and a Potential Future. Anesth. Analg. 2020, 130, 1115–1118. [Google Scholar] [PubMed]
- Van Buyten, J.P.; Al-Kaisy, A.; Smet, I.; Palmisani, S.; Smith, T. High-frequency spinal cord stimulation for the treatment of chronic back pain patients: Results of a prospective multicenter European clinical study. Neuromodulation 2013, 16, 59–65. [Google Scholar] [PubMed]
- Kapural, L.; Yu, C.; Doust, M.W.; Gliner, B.E.; Vallejo, R.; Sitzman, B.T.; Amirdelfan, K.; Morgan, D.M.; Yearwood, T.L.; Bundschu, R.; et al. Comparison of 10-kHz High-Frequency and Traditional Low-Frequency Spinal Cord Stimulation for the Treatment of Chronic Back and Leg Pain: 24-Month Results from a Multicenter, Randomized, Controlled Pivotal Trial. Neurosurgery 2016, 79, 667–677. [Google Scholar] [PubMed]
- Linderoth, B.; Foreman, R.D. Conventional and Novel Spinal Stimulation Algorithms: Hypothetical Mechanisms of Action and Comments on Outcomes. Neuromodulation 2017, 20, 525–533. [Google Scholar]
- Follet, K.; Dirks, B. Etiology and evaluation of the failed back surgery syndrome. Neurosurg Q. 1993, 3, 40–59. [Google Scholar]
- Marola, O.; Cherala, R.; Prusik, J.; Kumar, V.; Fama, C.; Wilock, M.; Crimmins, J.; Pilitsis, J.G. BMI as a Predictor of Spinal Cord Stimulation Success in Chronic Pain Patients. Neuromodulation 2017, 20, 269–273. [Google Scholar]
- Strauss, I.; Taha, K.; Krishna, V.; Hodaie, M. Younger age predicts greater effectiveness of spinal cord stimulation for chronic pain. Acta Neurochir. 2016, 158, 999–1003. [Google Scholar]
- Treede, R.D.; Rief, W.; Barke, A.; Aziz, Q.; Bennett, M.I.; Benoliel, R.; Cohen, M.; Evers, S.; Finnerup, N.B.; First, M.B.; et al. Chronic pain as a symptom or a disease: The IASP Classification of Chronic Pain for the International Classification of Diseases (ICD-11). Pain 2019, 160, 19–27. [Google Scholar]
- Gallizzi, M.; Gagnon, C.; Harden, R.N.; Stanos, S.; Khan, A. Medication Quantification Scale Version III: Internal validation of detriment weights using a chronic pain population. Pain Pract. 2008, 8, 1–4. [Google Scholar]
- Masters Steedman, S.; Middaugh, S.J.; Kee, W.G.; Carson, D.S.; Harden, R.N.; Miller, M.C. Chronic-pain medications: Equivalence levels and method of quantifying usage. Clin. J. Pain 1992, 8, 204–214. [Google Scholar]
- Harden, R.N.; Weinland, S.R.; Remble, T.A.; Houle, T.T.; Colio, S.; Steedman, S.; Kee, W.G. American Pain Society P. Medication Quantification Scale Version III: Update in medication classes and revised detriment weights by survey of American Pain Society Physicians. J. Pain 2005, 6, 364–371. [Google Scholar] [CrossRef] [PubMed]
- Ostelo, R.W.; Deyo, R.A.; Stratford, P.; Waddell, G.; Croft, P.; Von Korff, M.; Bouter, L.M.; de Vet, H.C. Interpreting change scores for pain and functional status in low back pain: Towards international consensus regarding minimal important change. Spine 2008, 33, 90–94. [Google Scholar] [CrossRef] [PubMed]
- Goudman, L.; Smedt, A.; Forget, P.; Moens, M. Determining the Minimal Clinical Important Difference for Medication Quantification Scale III and Morphine Milligram Equivalents in Patients with Failed Back Surgery Syndrome. J. Clin. Med. 2020, 9, 3747. [Google Scholar] [CrossRef] [PubMed]
- Tanei, T.; Kajita, Y.; Maesawa, S.; Nakatsubo, D.; Aoki, K.; Noda, H.; Takebayashi, S.; Nakahara, N.; Wakabayashi, T. Long-term Effect and Predictive Factors of Motor Cortex and Spinal Cord Stimulation for Chronic Neuropathic Pain. Neurol. Med. Chir. 2018, 58, 422–434. [Google Scholar] [CrossRef]
- Hazard, R.G.; Spratt, K.F.; McDonough, C.M.; Olson, C.M.; Ossen, E.S.; Hartmann, E.M.; Carlson, R.J.; LaVoie, J. Patient-centered evaluation of outcomes from rehabilitation for chronic disabling spinal disorders: The impact of personal goal achievement on patient satisfaction. Spine J. 2012, 12, 1132–1137. [Google Scholar] [CrossRef][Green Version]
- Goudman, L.; De Smedt, A.; Eldabe, S.; Rigoard, P.; Linderoth, B.; De Jaeger, M.; Moens, M.; Discover, C. High-dose spinal cord stimulation for patients with failed back surgery syndrome: A multicenter effectiveness and prediction study. Pain 2020. [Google Scholar] [CrossRef]
- Pilitsis, J.G.; Fahey, M.; Custozzo, A.; Chakravarthy, K.; Capobianco, R. Composite Score Is a Better Reflection of Patient Response to Chronic Pain Therapy Compared with Pain Intensity Alone. Neuromodulation 2020. [Google Scholar] [CrossRef]
- Wang, L.; Wang, Y.; Chang, Q. Feature selection methods for big data bioinformatics: A survey from the search perspective. Methods 2016, 111, 21–31. [Google Scholar] [CrossRef]
- Haury, A.C.; Gestraud, P.; Vert, J.P. The influence of feature selection methods on accuracy, stability and interpretability of molecular signatures. PLoS ONE 2011, 6, e28210. [Google Scholar] [CrossRef]
- Camberlin, C.S.M.L.; Smit, Y.; Post, P.; Gerkens, S.; De Laet, C. Neuromodulation for the Management of Chronic Pain: Implanted Spinal Cord Stimulators and Intrathecal Analgesic Delivery Pumps; KCE Report 189C; Health Technology Assessment (HTA); Belgian Health Care Knowledge Centre (KCE): Brussels, Belgium, 2012.
- Weinand, M.E.; Madhusudan, H.; Davis, B.; Melgar, M. Acute vs. Prolonged Screening for Spinal Cord Stimulation in Chronic Pain. Neuromodulation 2003, 6, 15–19. [Google Scholar] [CrossRef]
- Eldabe, S.; Duarte, R.V.; Gulve, A.; Thomson, S.; Baranidharan, G.; Houten, R.; Jowett, S.; Sandhu, H.; Chadwick, R.; Brookes, M.; et al. Does a screening trial for spinal cord stimulation in patients with chronic pain of neuropathic origin have clinical utility and cost-effectiveness (TRIAL-STIM)? A randomised controlled trial. Pain 2020. [Google Scholar] [CrossRef] [PubMed]
- Goudman, L.; Smet, I.; Marien, P.; De Jaeger, M.; De Groote, S.; Huysmans, E.; Putman, K.; Van Buyten, J.P.; Buyl, R.; Moens, M. Is the Self-Reporting of Failed Back Surgery Syndrome Patients Treated with Spinal Cord Stimulation in Line with Objective Measurements? Neuromodulation 2018, 21, 93–100. [Google Scholar] [CrossRef] [PubMed]
- PFranssen, W.M.A.; Franssen, G.; Spaas, J.; Solmi, F.; Eijnde, B.O. Can consumer wearable activity tracker-based interventions improve physical activity and cardiometabolic health in patients with chronic diseases? A systematic review and meta-analysis of randomised controlled trials. Int. J. Behav. Nutr. Phys. Act. 2020, 17, 57. [Google Scholar] [CrossRef] [PubMed]


| Variable | Measurement at Baseline | Measurement at Last Visit |
|---|---|---|
| Age (years) | 51.5 (SD: 10.11) | |
| Sex (%) | Males: 41 (34.45%) Females: 78 (65.55%) | |
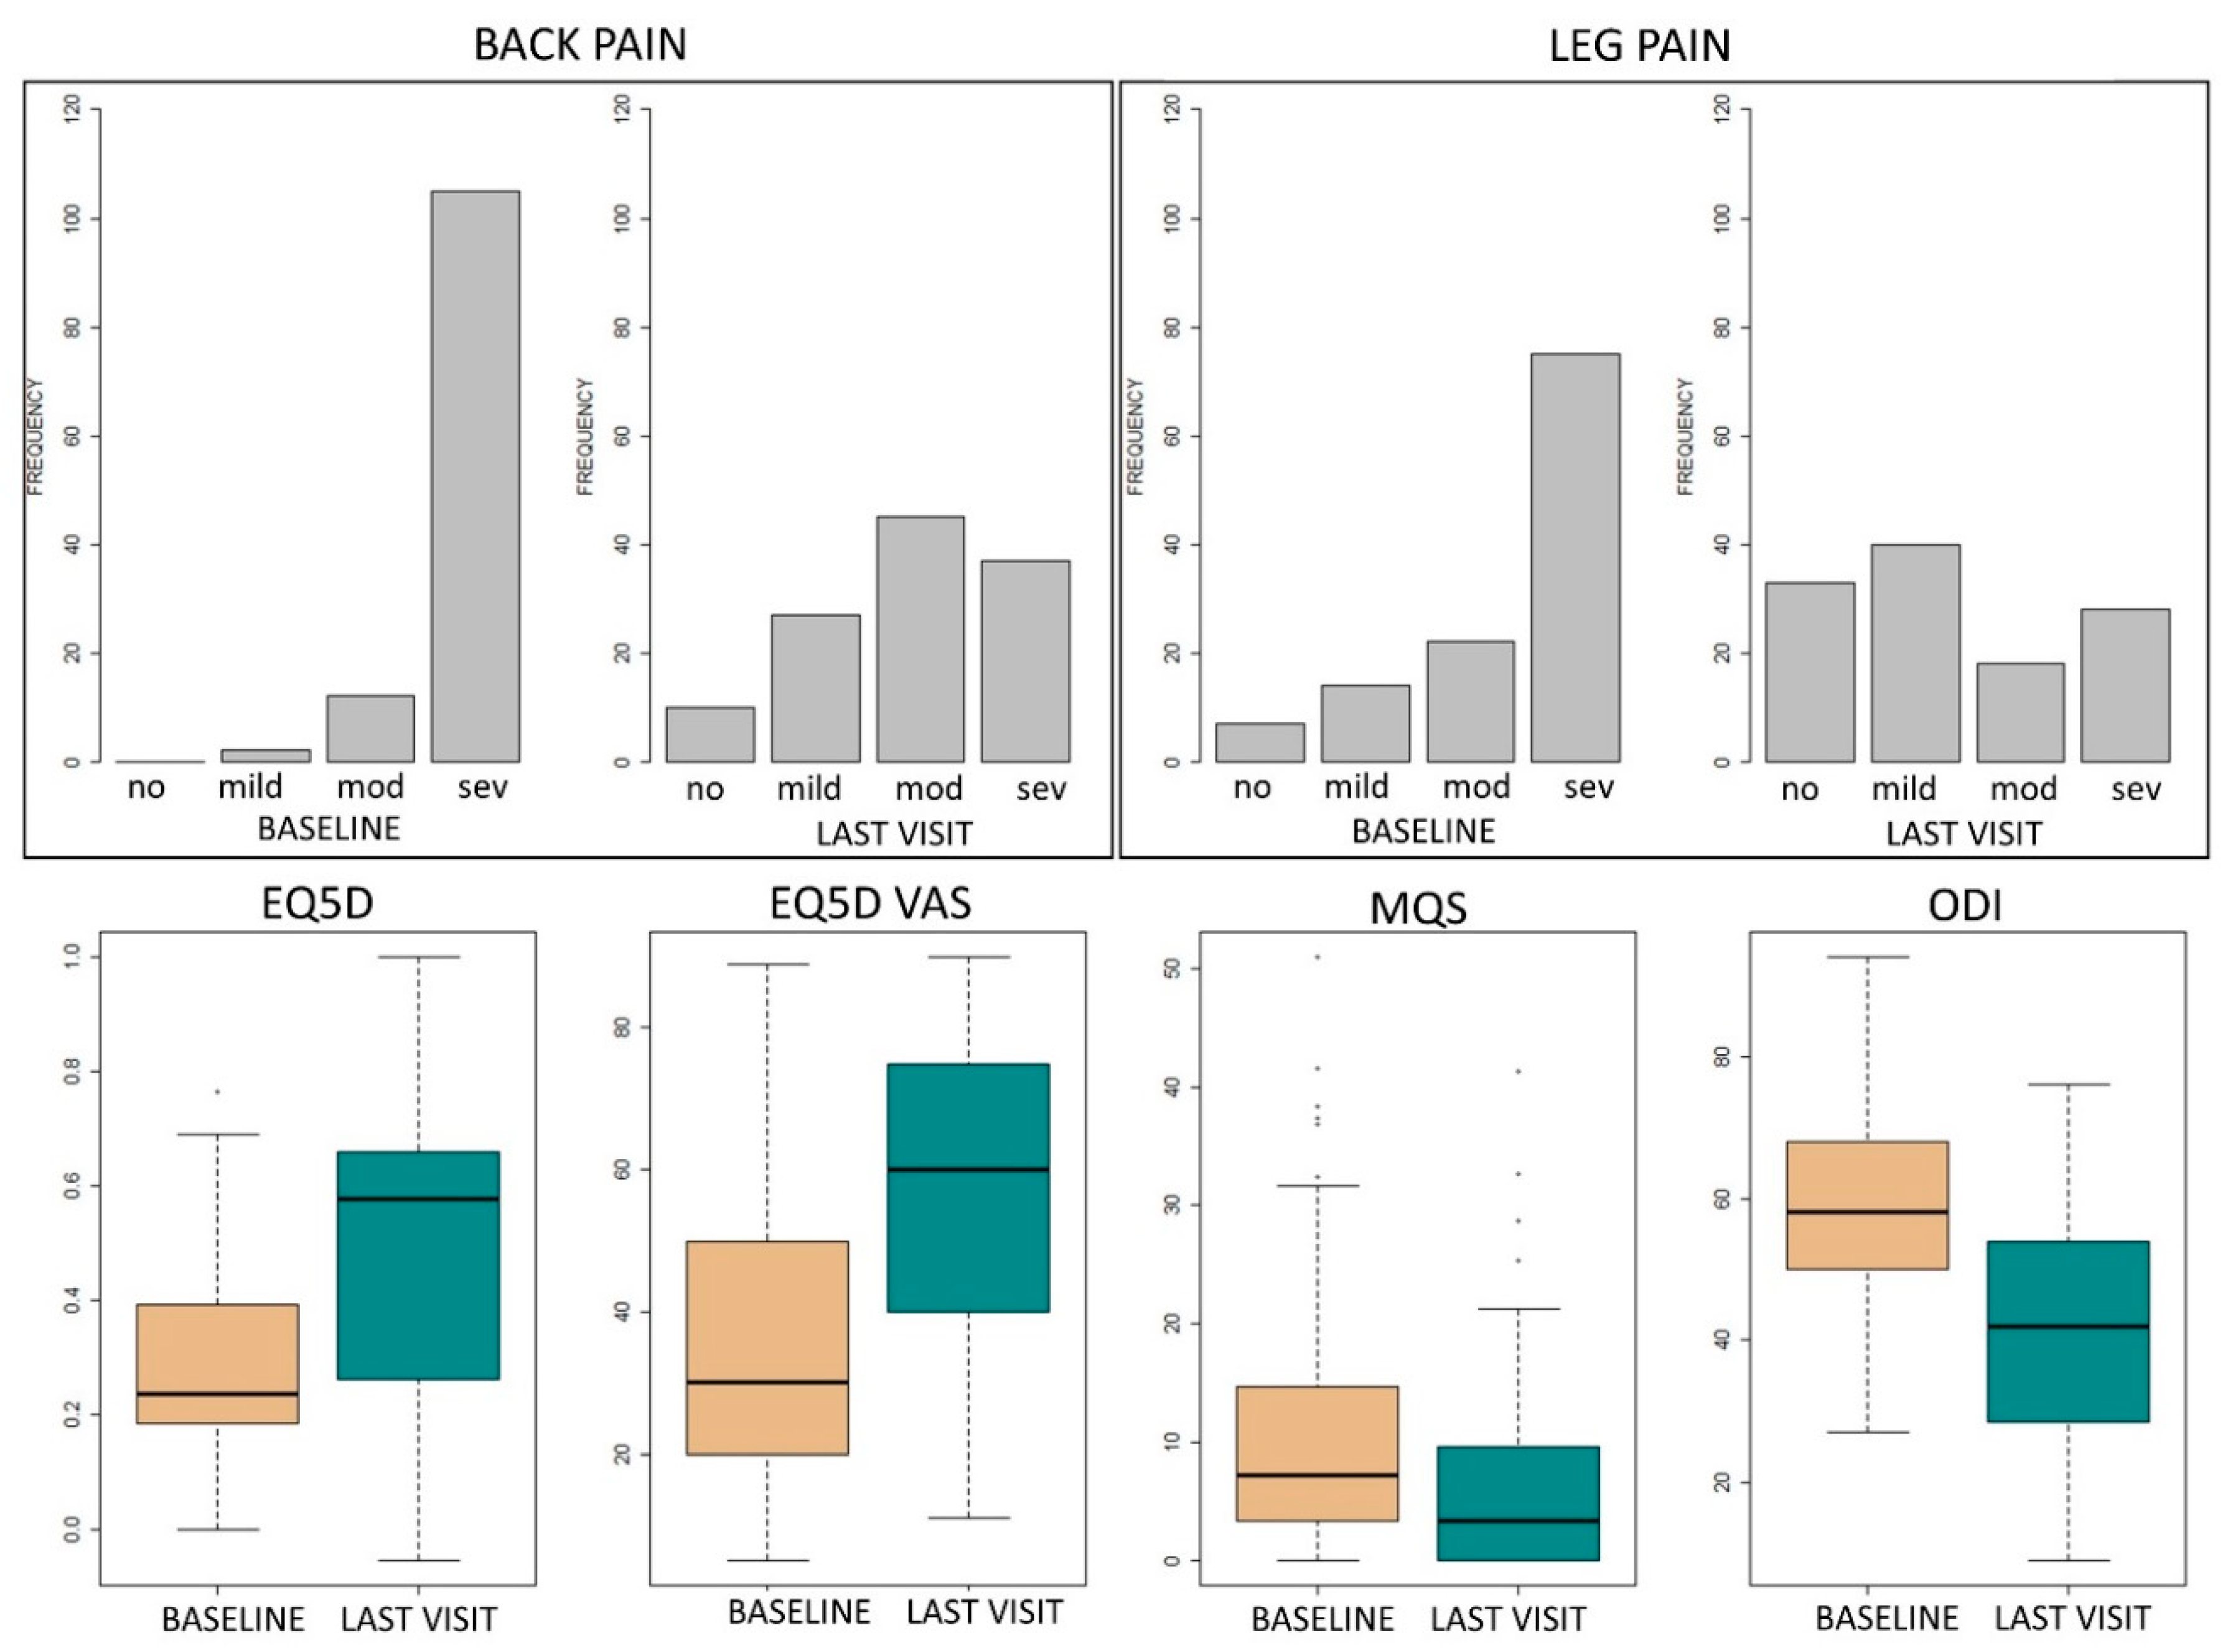
| Back pain intensity (N = 119) | No pain: 0 Mild pain: 2 (1.68%) Moderate pain: 12 (10.08%) Severe pain: 105 (88.24%) | No pain: 10 (8.40%) Mild pain: 27 (22.69%) Moderate pain: 45 (37.81%) Severe pain: 37 (31.10%) |
| Leg pain intensity (N = 118 for baseline) | No pain: 7 (5.93%) Mild pain: 14 (11.86%) Moderate pain: 22 18.64%) Severe pain: 75 (63.56%) | No pain: 33 (27.73%) Mild pain: 40 (33.61%) Moderate pain: 18 (15.13%) Severe pain: 28 (23.53%) |
| Pain location (N = 119) | Back: 75 (63.02%) Leg: 21 (17.65%) Back and leg: 23 (19.33%) | |
| EQ5D-3L (N = 69) | 0.24 (Q1–Q3: 0.19–0.39) | 0.58 (Q1–Q3: 0.29–0.66) |
| EQ5D VAS (/100) (N = 78) | 30 (Q1–Q3: 20–50) | 60 (Q1–Q3: 40–75) |
| MQS (N = 118) | 7.3 (Q1–Q3: 3.4–14.62) | 3.4 (Q1–Q3: 0–9.48) |
| ODI (/100) (N = 81) | 58.6 (SD: 13.94) | 42.25 (SD: 16.53) |
| BMI (N = 119) | 27.08 (Q1–Q3: 23.66–30.37) | |
| HR (bpm) (N = 119) | 75.49 (SD: 12.40) | |
| SBP (N = 119) | 133 (Q1–Q3: 117–142.5) | |
| DBP (N = 119) | 80 (Q1–Q3: 71–89) | |
| MAP (N = 119) | 97 (Q1–Q3: 88.83–105.83) | |
| Surgeries (N = 119) | 2 (Q1–Q3: 1–3) | |
| Pain onset (N = 119) | New: 16 (13.45%) Recurrent: 16 (13.45%) Remaining: 87 (73.11%) | |
| Pain duration (N = 119) | 6.5 (Q1–Q3: 4–12) years | |
| Smoking (N = 119) | No: 66 (55.46%) Yes: 53 (44.54%) | |
| Work (N = 119) | Yes: 23 (19.33%) Financial compensation: 20 (86.96%) No financial compensation: 3 (13.04%) No: 96 (80.67%) Worker’s compensation: 77 (80.21%) No worker’s compensation: 19 (19.79%) | |
| Marital status (N = 119) | Married: 71 (59.66%) Single: 23 (19.33%) Living together: 19 (15.97%) Living apart together (LAT relation): 6 (5.04%) | |
| Children (N = 119) | Yes: 59 (49.58%) No: 60 (50.42%) |
| Accuracy | Area under the Curve | Prediction/Actual Status | ||||
|---|---|---|---|---|---|---|
| 0 | 1 | |||||
| 0 | TN | FN | ||||
| 1 | FP | TP | ||||
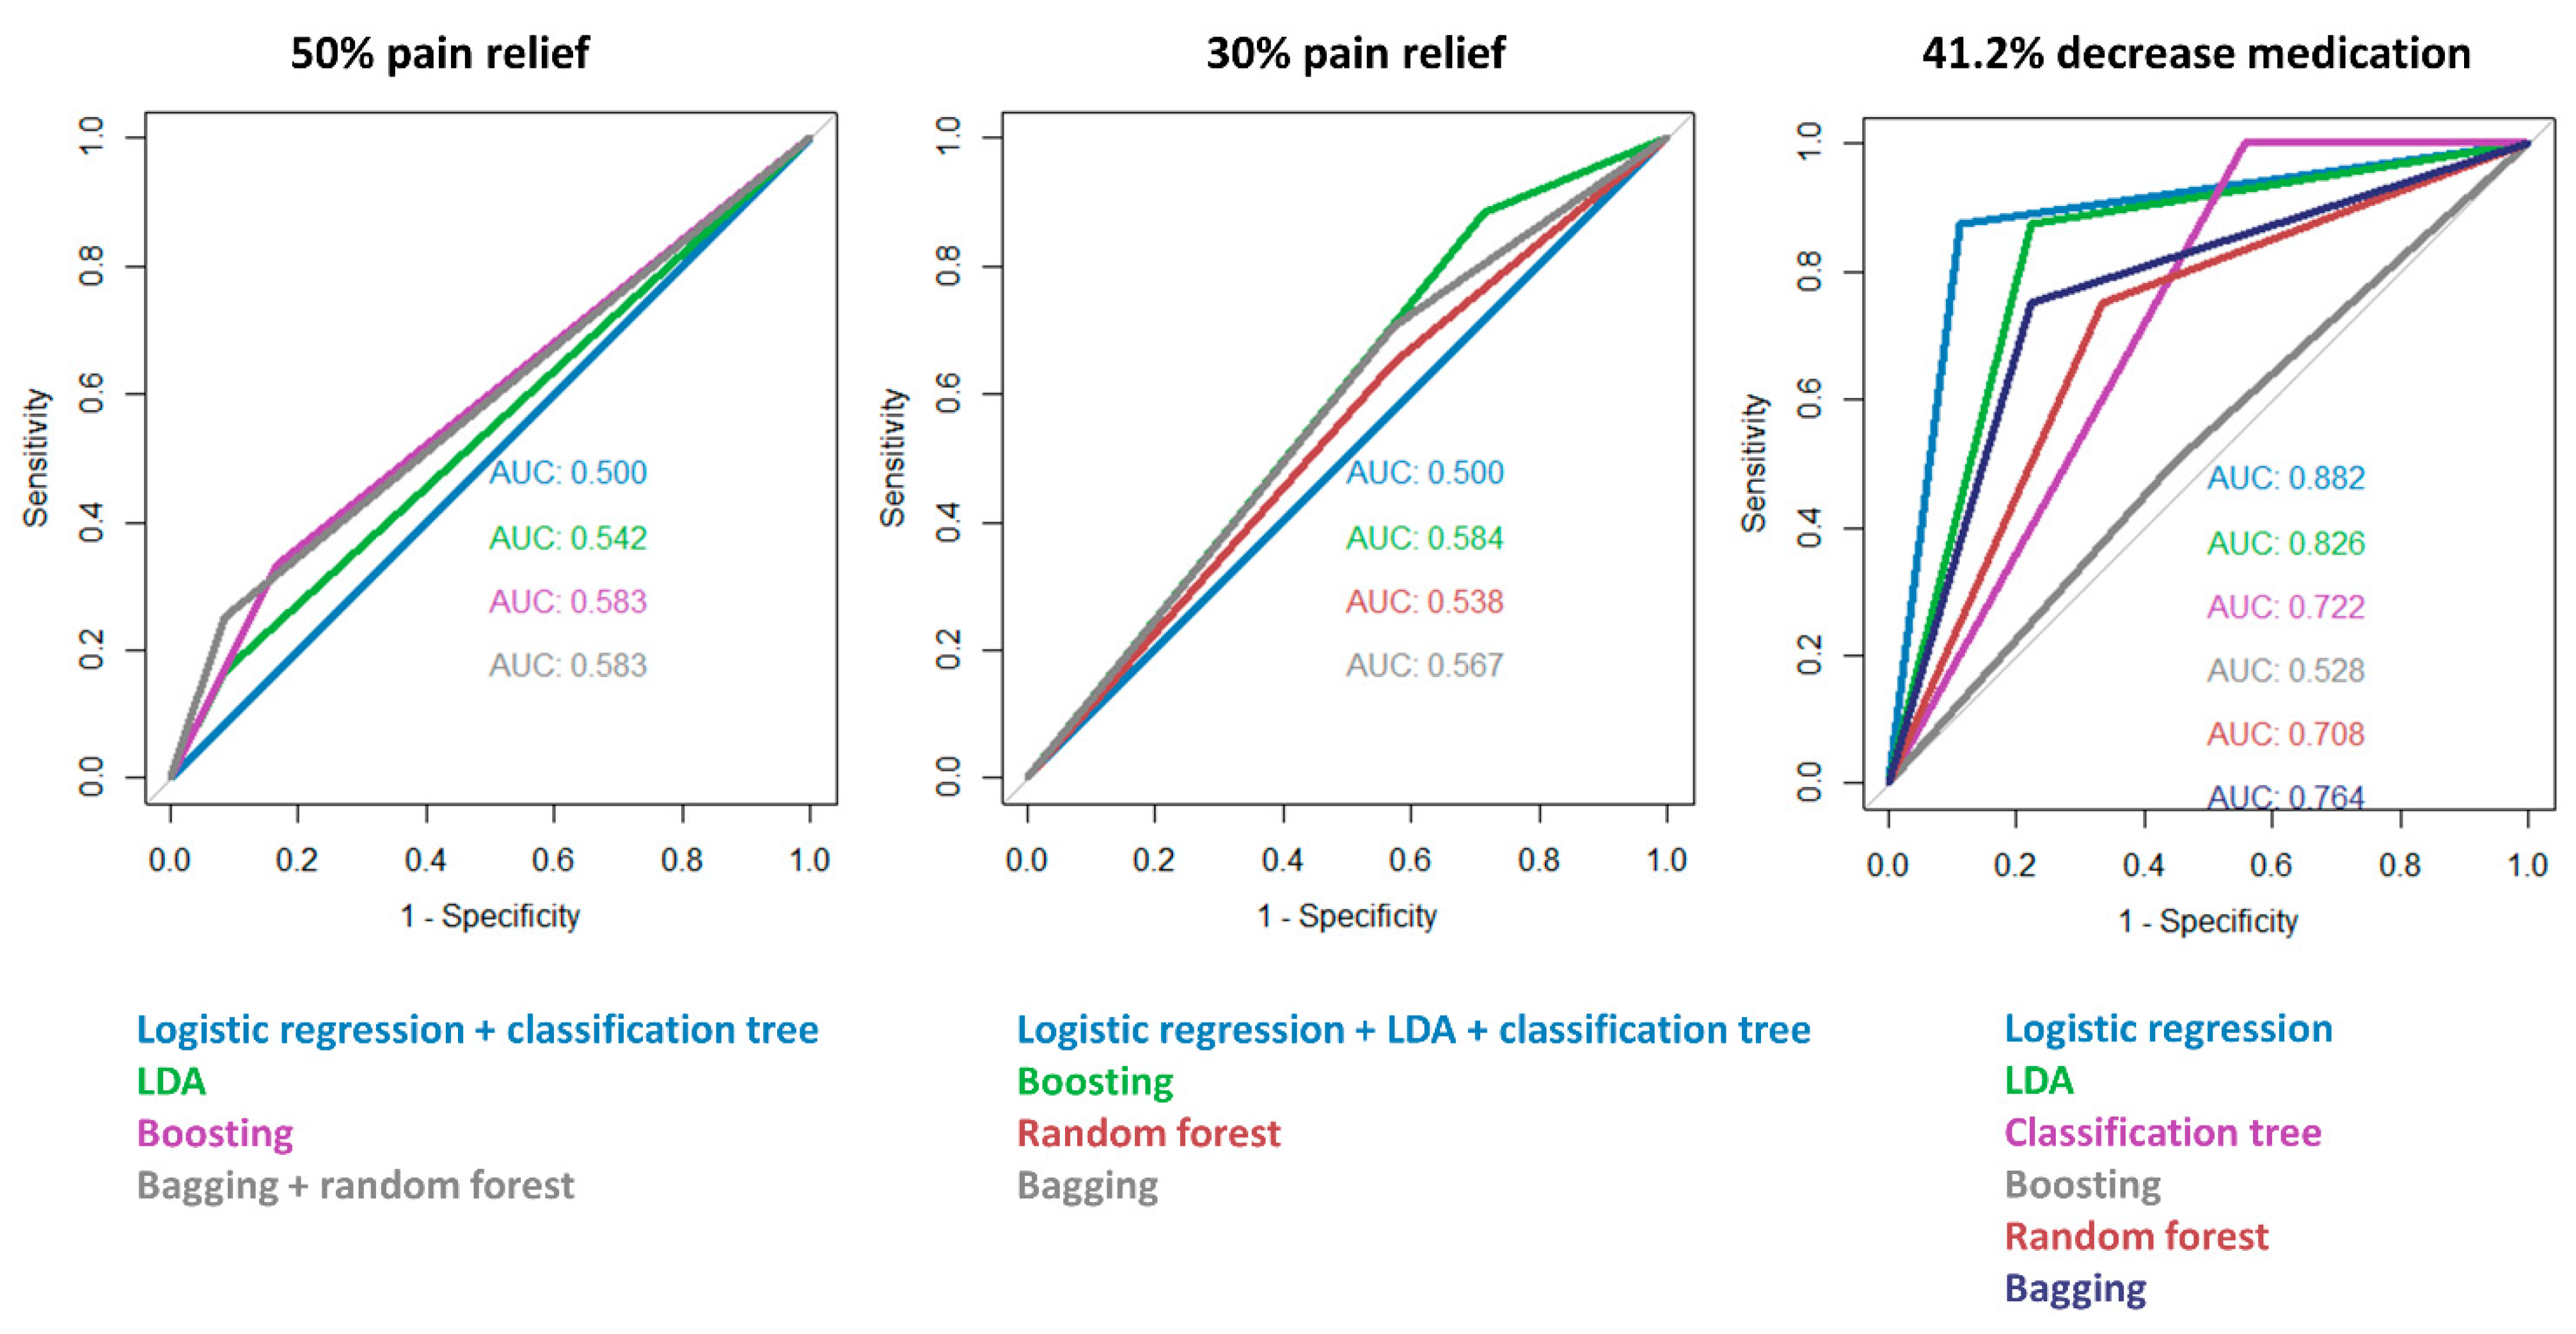
| Responder 50% pain relief | ||||||
| Logistic regression | 50.00% | 50.00% | 11 | 11 | ||
| 1 | 1 | |||||
| LDA | 54.17% | 54.17% | 11 | 10 | ||
| 1 | 2 | |||||
| Classification tree | 50.00% | 50.00% | 10 | 10 | ||
| 2 | 2 | |||||
| Boosting | 58.33% | 58.33% | 10 | 8 | ||
| 2 | 4 | |||||
| Random Forest | 58.33% | 58.33% | 11 | 9 | ||
| 1 | 3 | |||||
| Bagging | 58.33% | 58.33% | 11 | 9 | ||
| 1 | 3 | |||||
| Responder: 30% pain relief | ||||||
| Logistic regression | 70.83% | 50.00% | 0 | 0 | ||
| 7 | 17 | |||||
| LDA | 70.83% | 50.00% | 0 | 0 | ||
| 7 | 17 | |||||
| Classification tree | 70.83% | 50.00% | 0 | 0 | ||
| 7 | 17 | |||||
| Boosting | 70.83% | 58.40% | 2 | 2 | ||
| 5 | 15 | |||||
| Random Forest | 58.33% | 53.78% | 3 | 6 | ||
| 4 | 11 | |||||
| Bagging | 62.50% | 56.72% | 3 | 5 | ||
| 4 | 12 | |||||
| Responder: 41.2% decrease medication use | ||||||
| Logistic regression | 88.24% | 88.19% | 8 | 1 | ||
| 1 | 7 | |||||
| LDA | 82.35% | 82.64% | 7 | 1 | ||
| 2 | 7 | |||||
| Classification tree | 70.59% | 72.22% | 4 | 0 | ||
| 5 | 8 | |||||
| Boosting | 52.94% | 52.78% | 5 | 4 | ||
| 4 | 4 | |||||
| Random Forest | 70.59% | 70.83% | 6 | 2 | ||
| 3 | 6 | |||||
| Bagging | 76.47% | 76.39% | 7 | 2 | ||
| 2 | 6 | |||||
Publisher’s Note: MDPI stays neutral with regard to jurisdictional claims in published maps and institutional affiliations. |
© 2020 by the authors. Licensee MDPI, Basel, Switzerland. This article is an open access article distributed under the terms and conditions of the Creative Commons Attribution (CC BY) license (http://creativecommons.org/licenses/by/4.0/).
Share and Cite
Goudman, L.; Van Buyten, J.-P.; De Smedt, A.; Smet, I.; Devos, M.; Jerjir, A.; Moens, M. Predicting the Response of High Frequency Spinal Cord Stimulation in Patients with Failed Back Surgery Syndrome: A Retrospective Study with Machine Learning Techniques. J. Clin. Med. 2020, 9, 4131. https://doi.org/10.3390/jcm9124131
Goudman L, Van Buyten J-P, De Smedt A, Smet I, Devos M, Jerjir A, Moens M. Predicting the Response of High Frequency Spinal Cord Stimulation in Patients with Failed Back Surgery Syndrome: A Retrospective Study with Machine Learning Techniques. Journal of Clinical Medicine. 2020; 9(12):4131. https://doi.org/10.3390/jcm9124131
Chicago/Turabian StyleGoudman, Lisa, Jean-Pierre Van Buyten, Ann De Smedt, Iris Smet, Marieke Devos, Ali Jerjir, and Maarten Moens. 2020. "Predicting the Response of High Frequency Spinal Cord Stimulation in Patients with Failed Back Surgery Syndrome: A Retrospective Study with Machine Learning Techniques" Journal of Clinical Medicine 9, no. 12: 4131. https://doi.org/10.3390/jcm9124131
APA StyleGoudman, L., Van Buyten, J.-P., De Smedt, A., Smet, I., Devos, M., Jerjir, A., & Moens, M. (2020). Predicting the Response of High Frequency Spinal Cord Stimulation in Patients with Failed Back Surgery Syndrome: A Retrospective Study with Machine Learning Techniques. Journal of Clinical Medicine, 9(12), 4131. https://doi.org/10.3390/jcm9124131