The Predictive Value of Low Skeletal Muscle Mass Assessed on Cross-Sectional Imaging for Anti-Cancer Drug Toxicity: A Systematic Review and Meta-Analysis

 ,
, 
Abstract
1. Introduction
2. Methods
2.1. Search Strategy
2.2. Study Selection
2.3. Data Extraction
2.4. Assessment of Risk of Bias
2.5. Data Analysis
3. Results
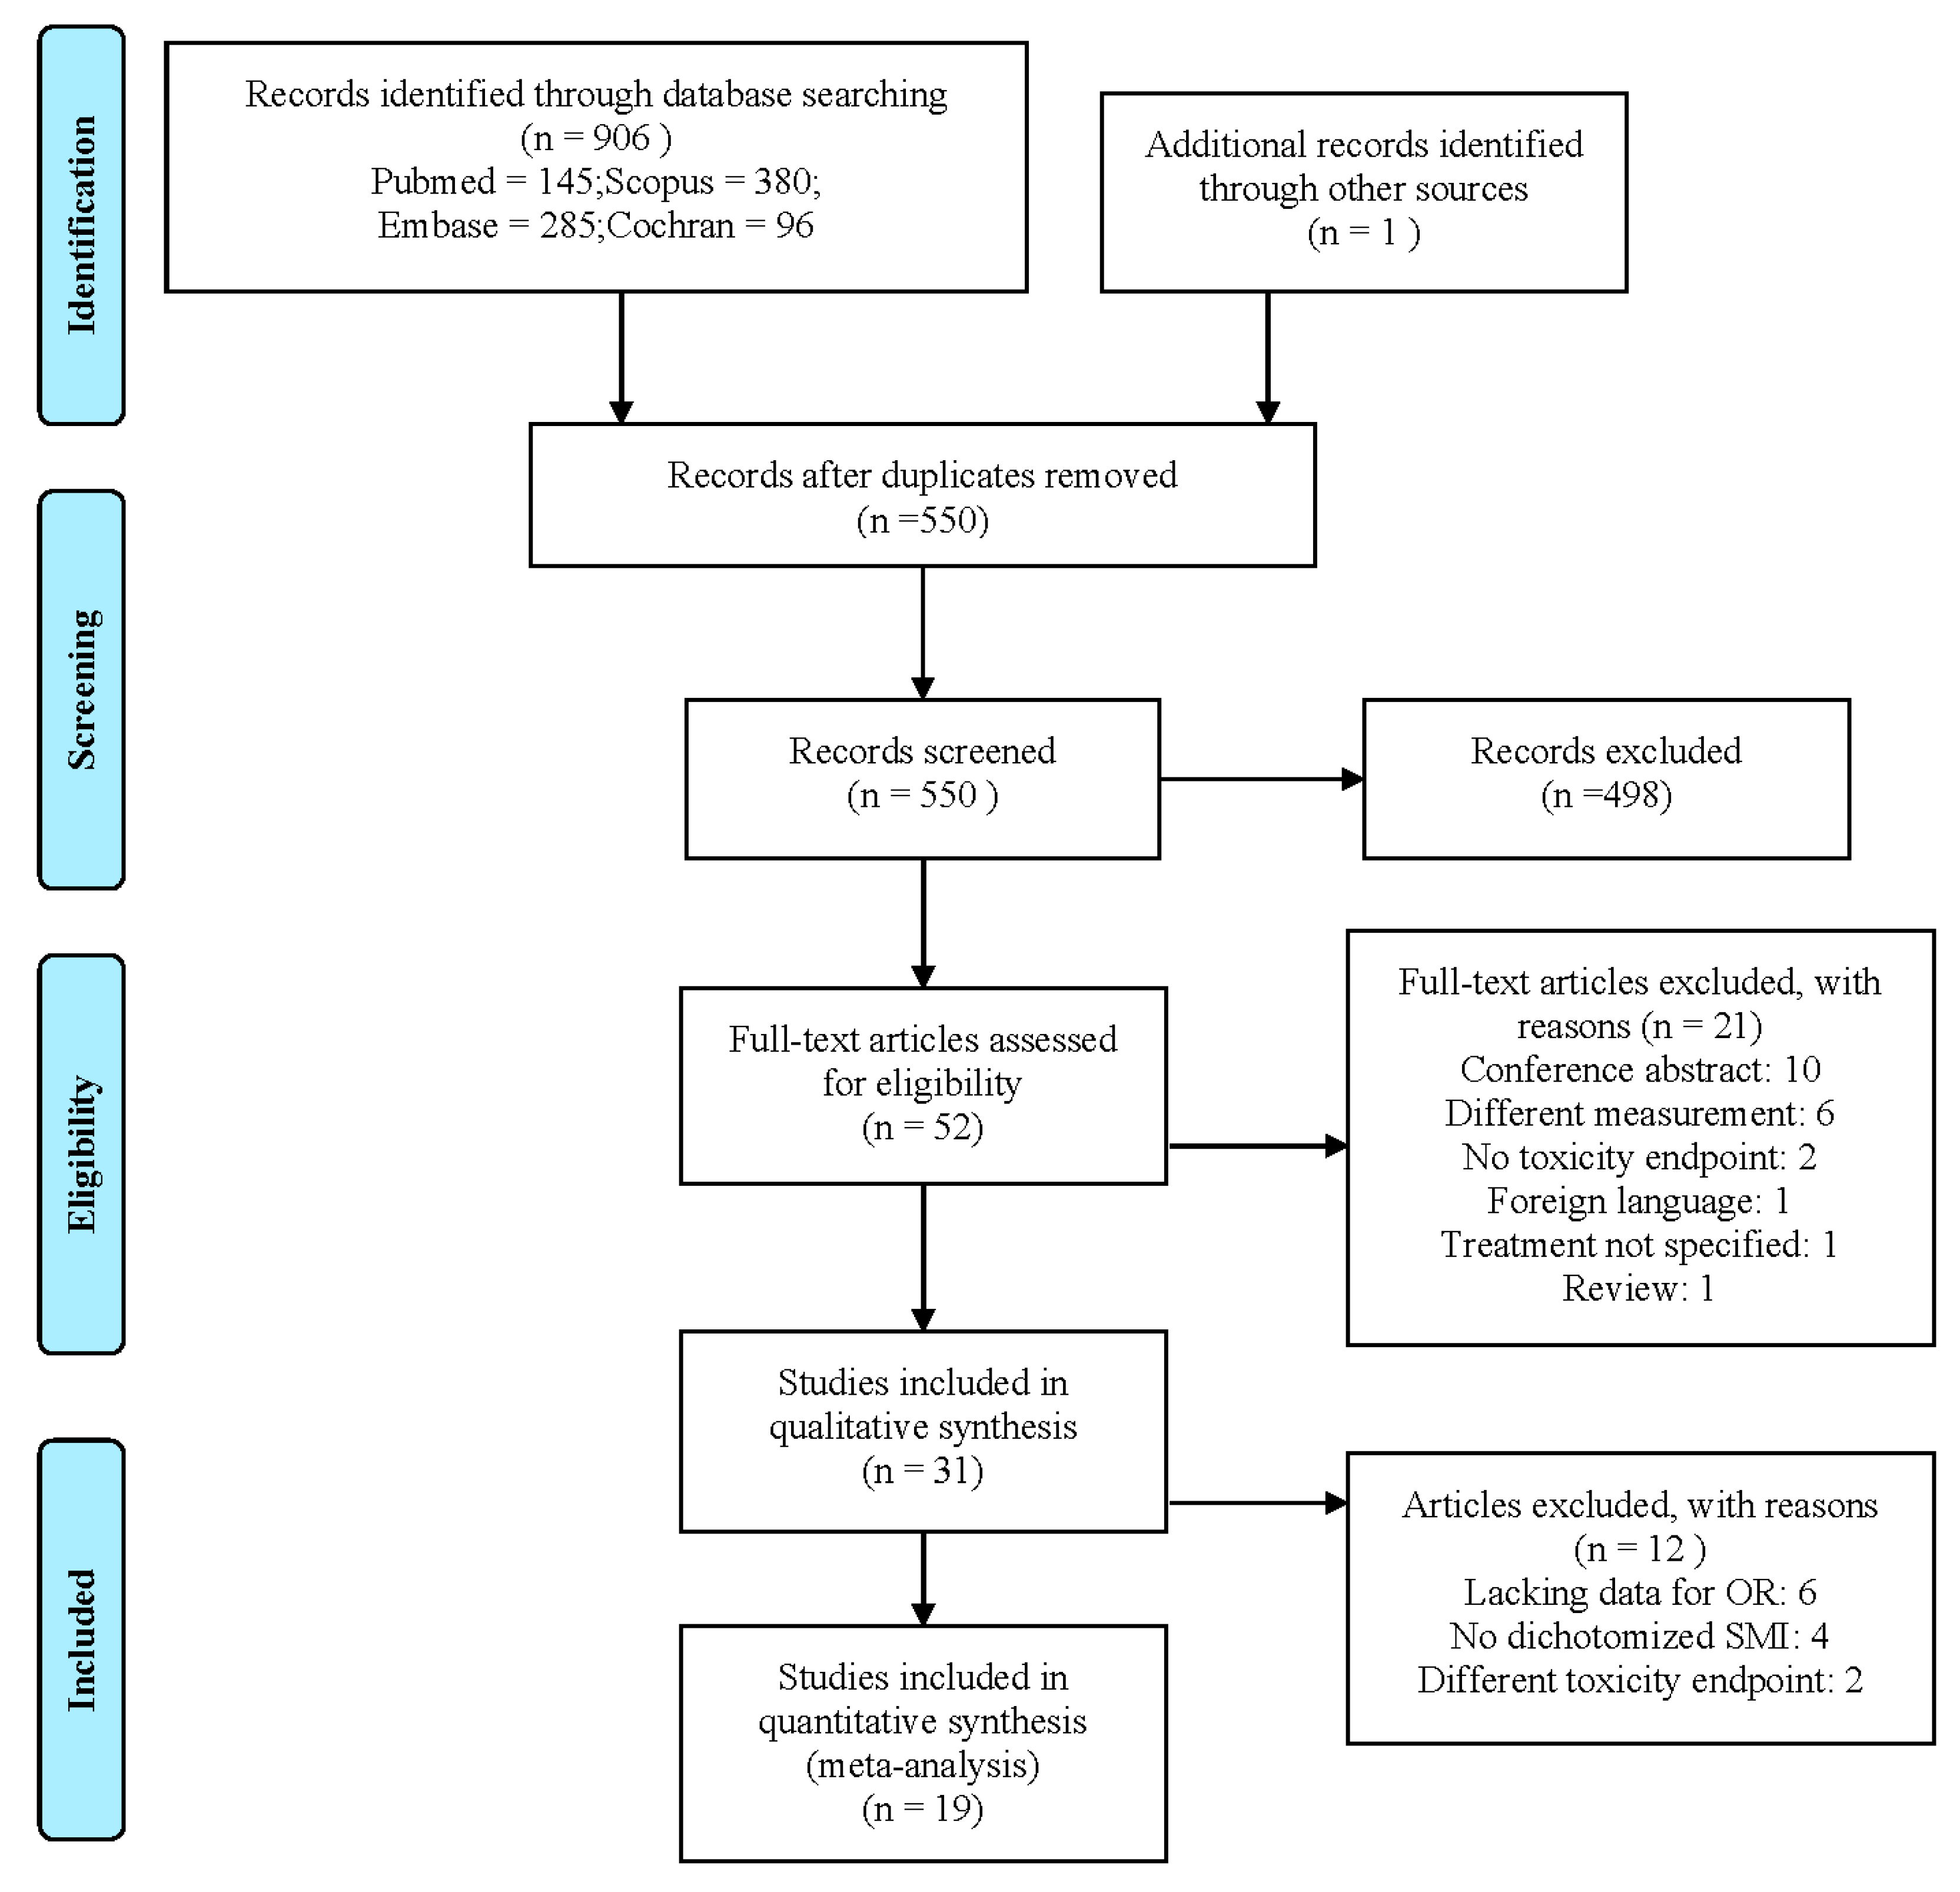
3.1. Search Results
3.2. Study Characteristics
3.3. Skeletal Muscle Mass Assessment
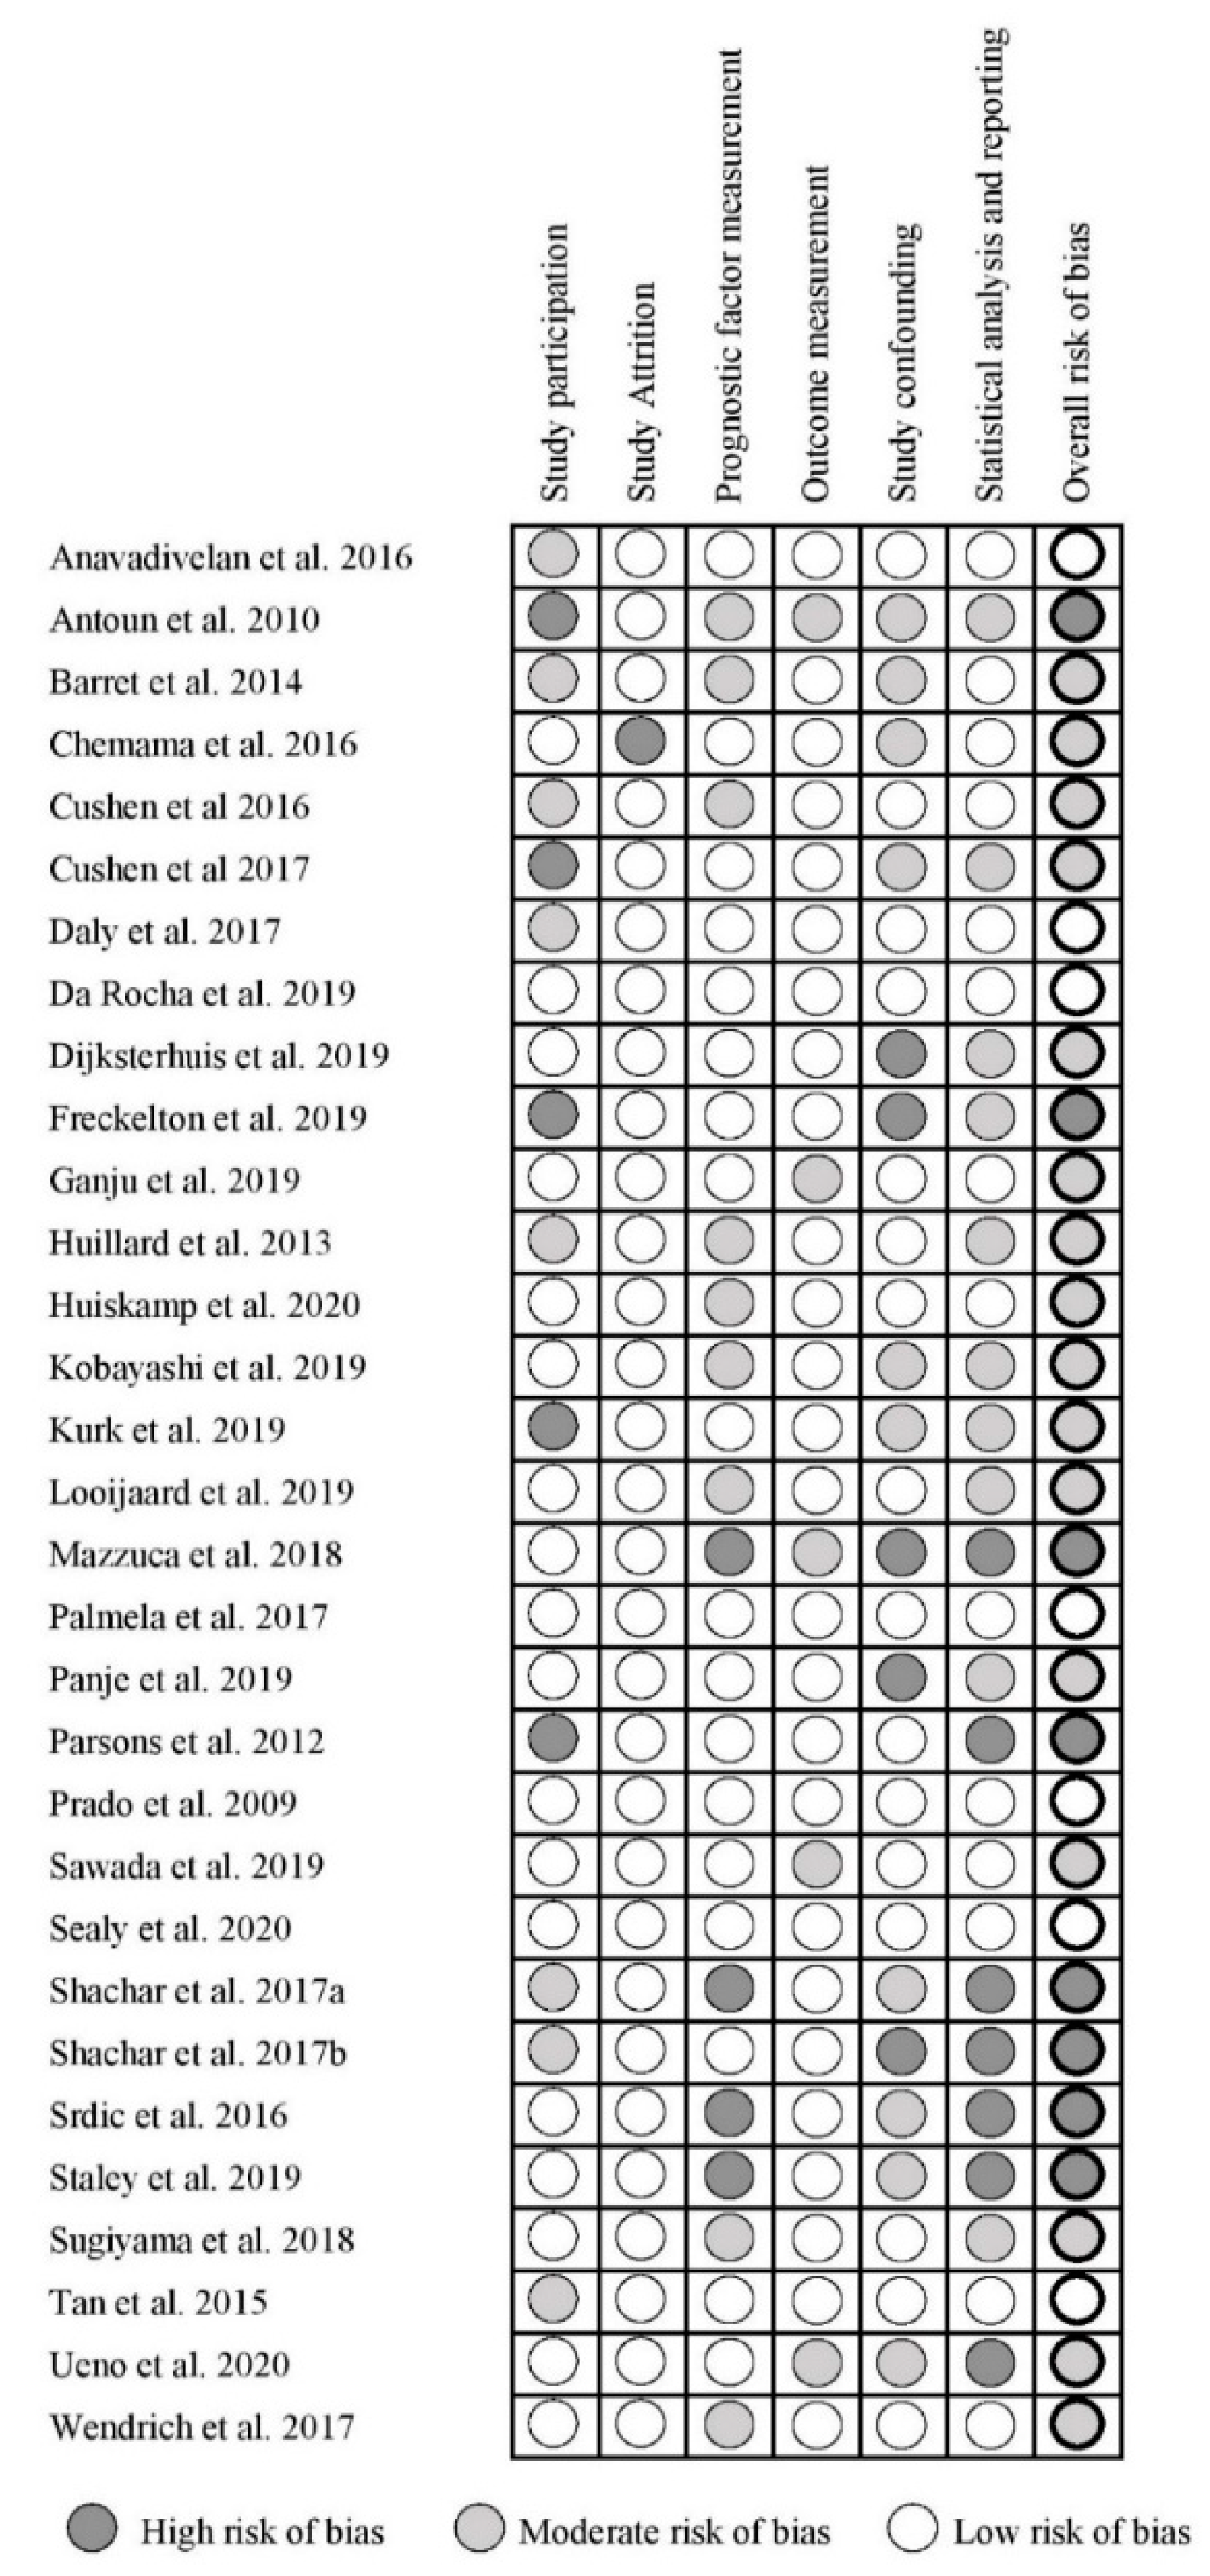
3.4. Study Quality Assessment
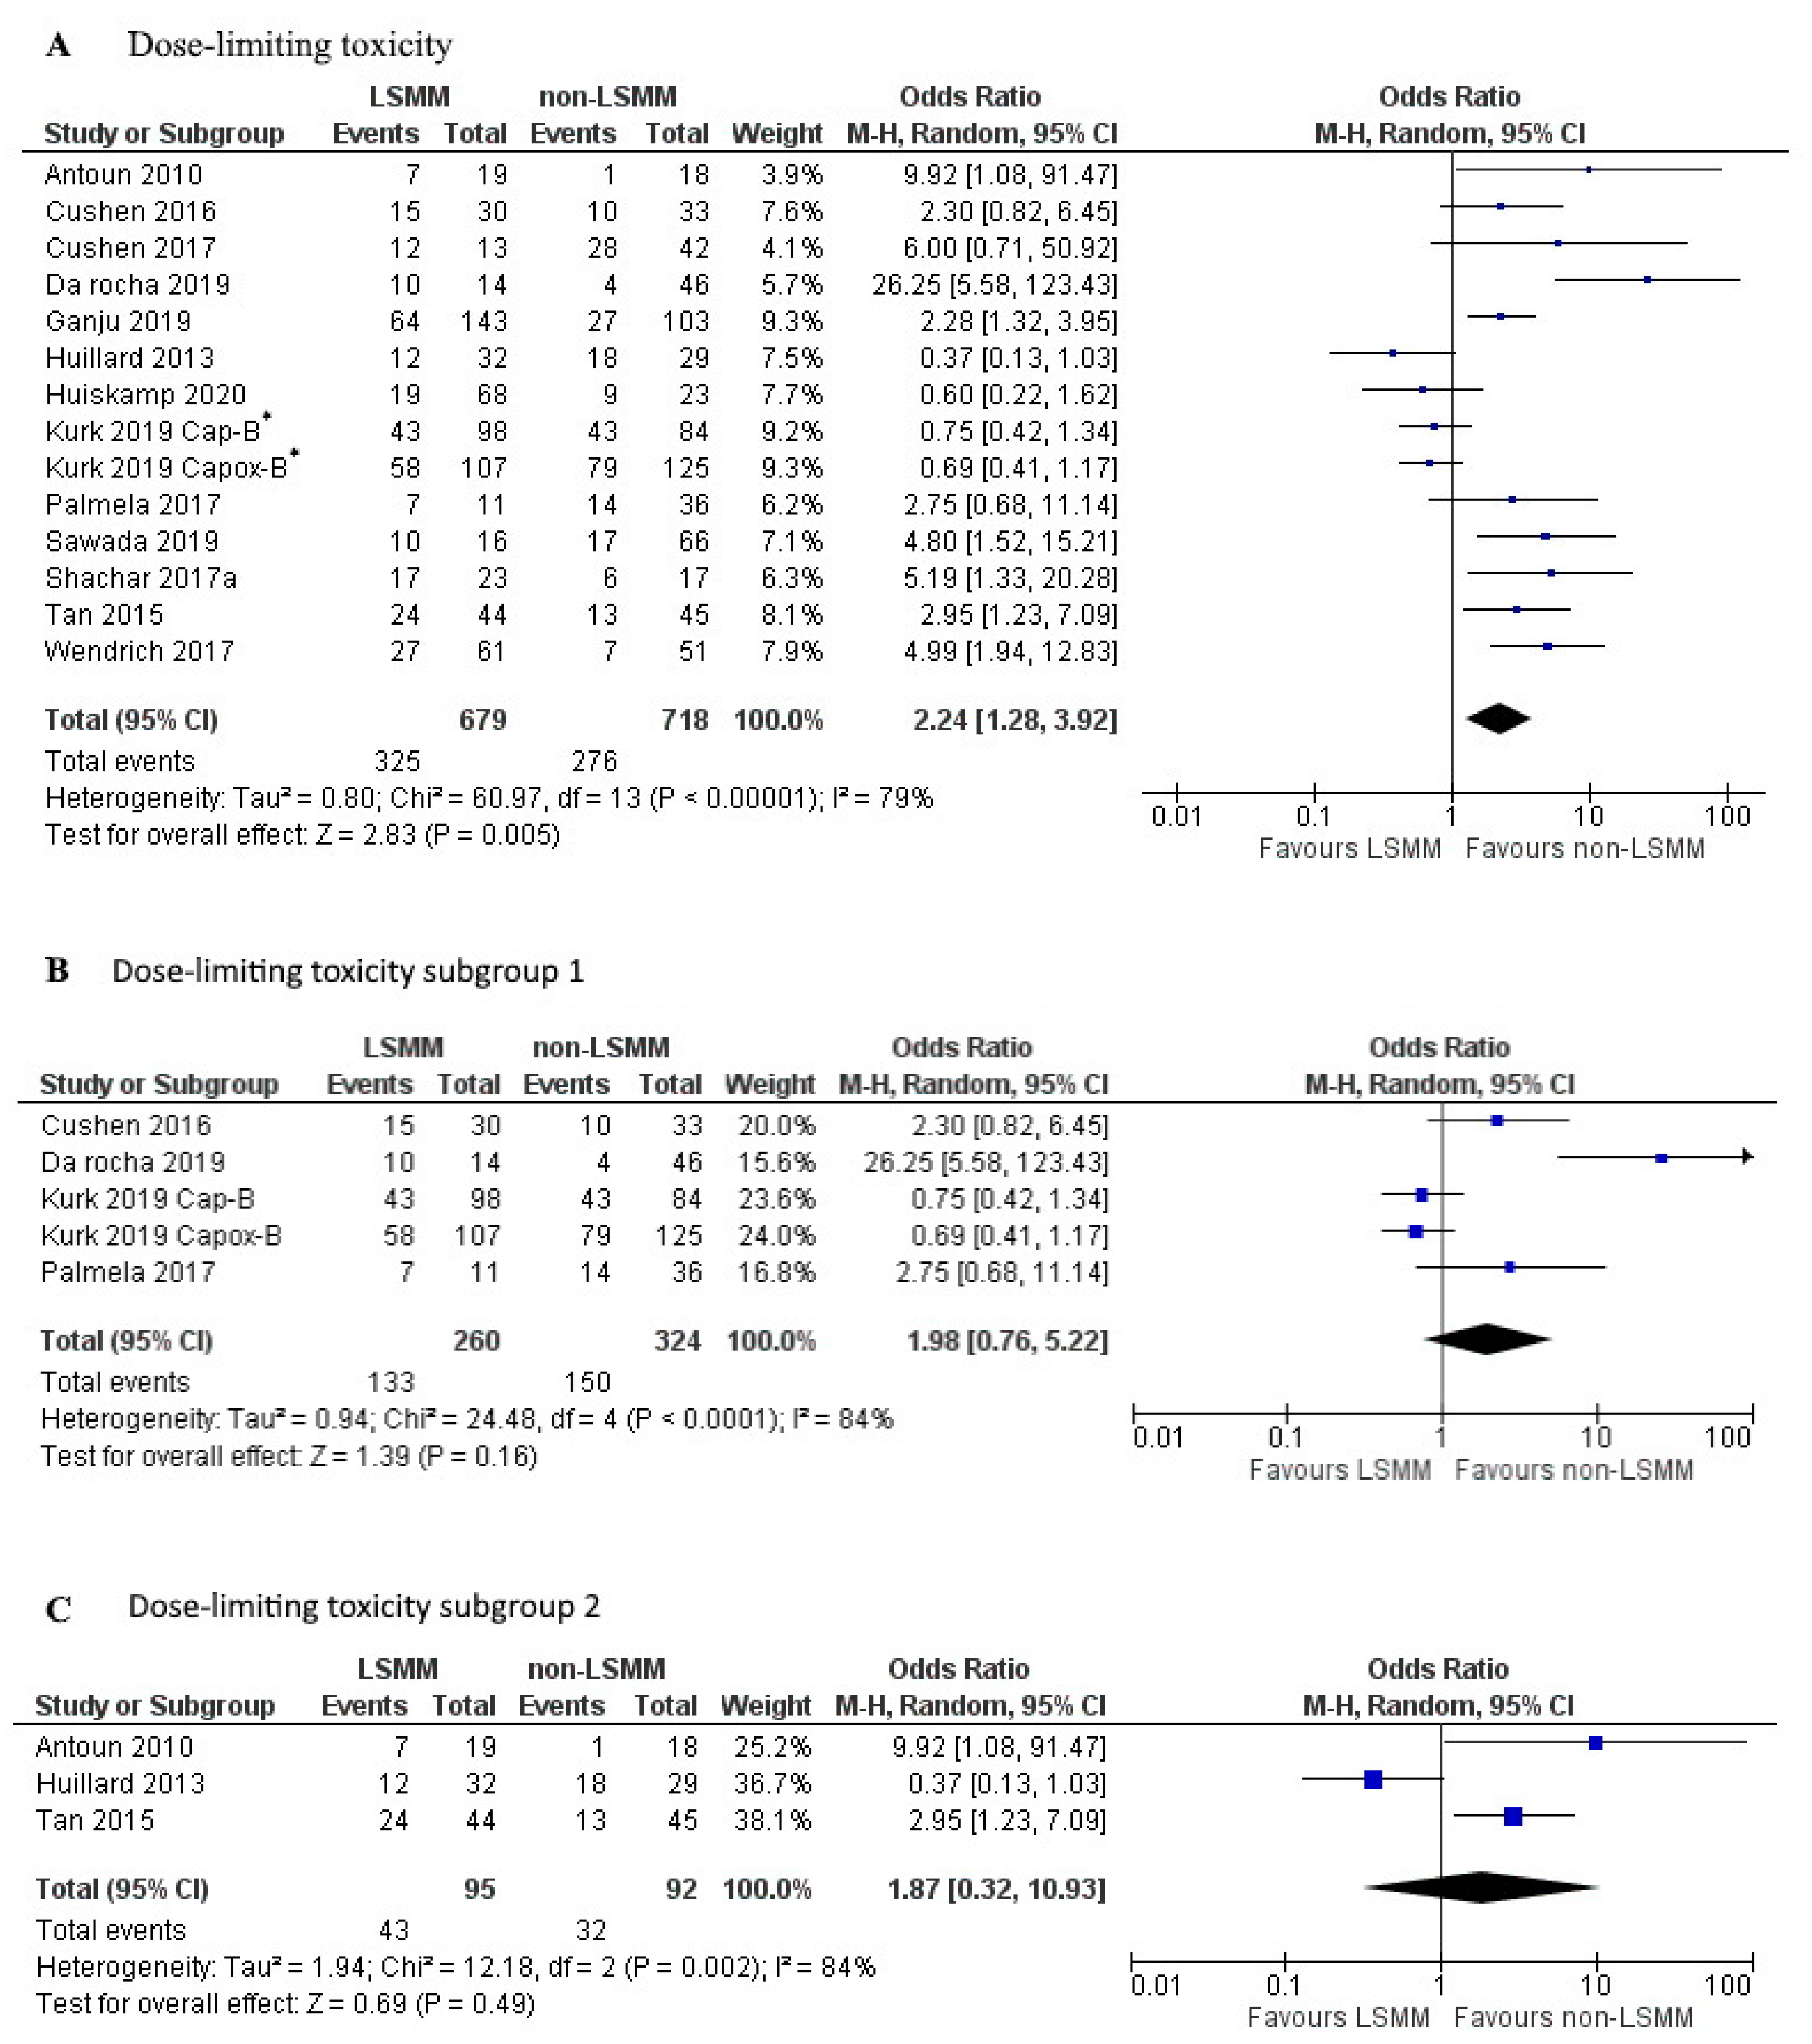
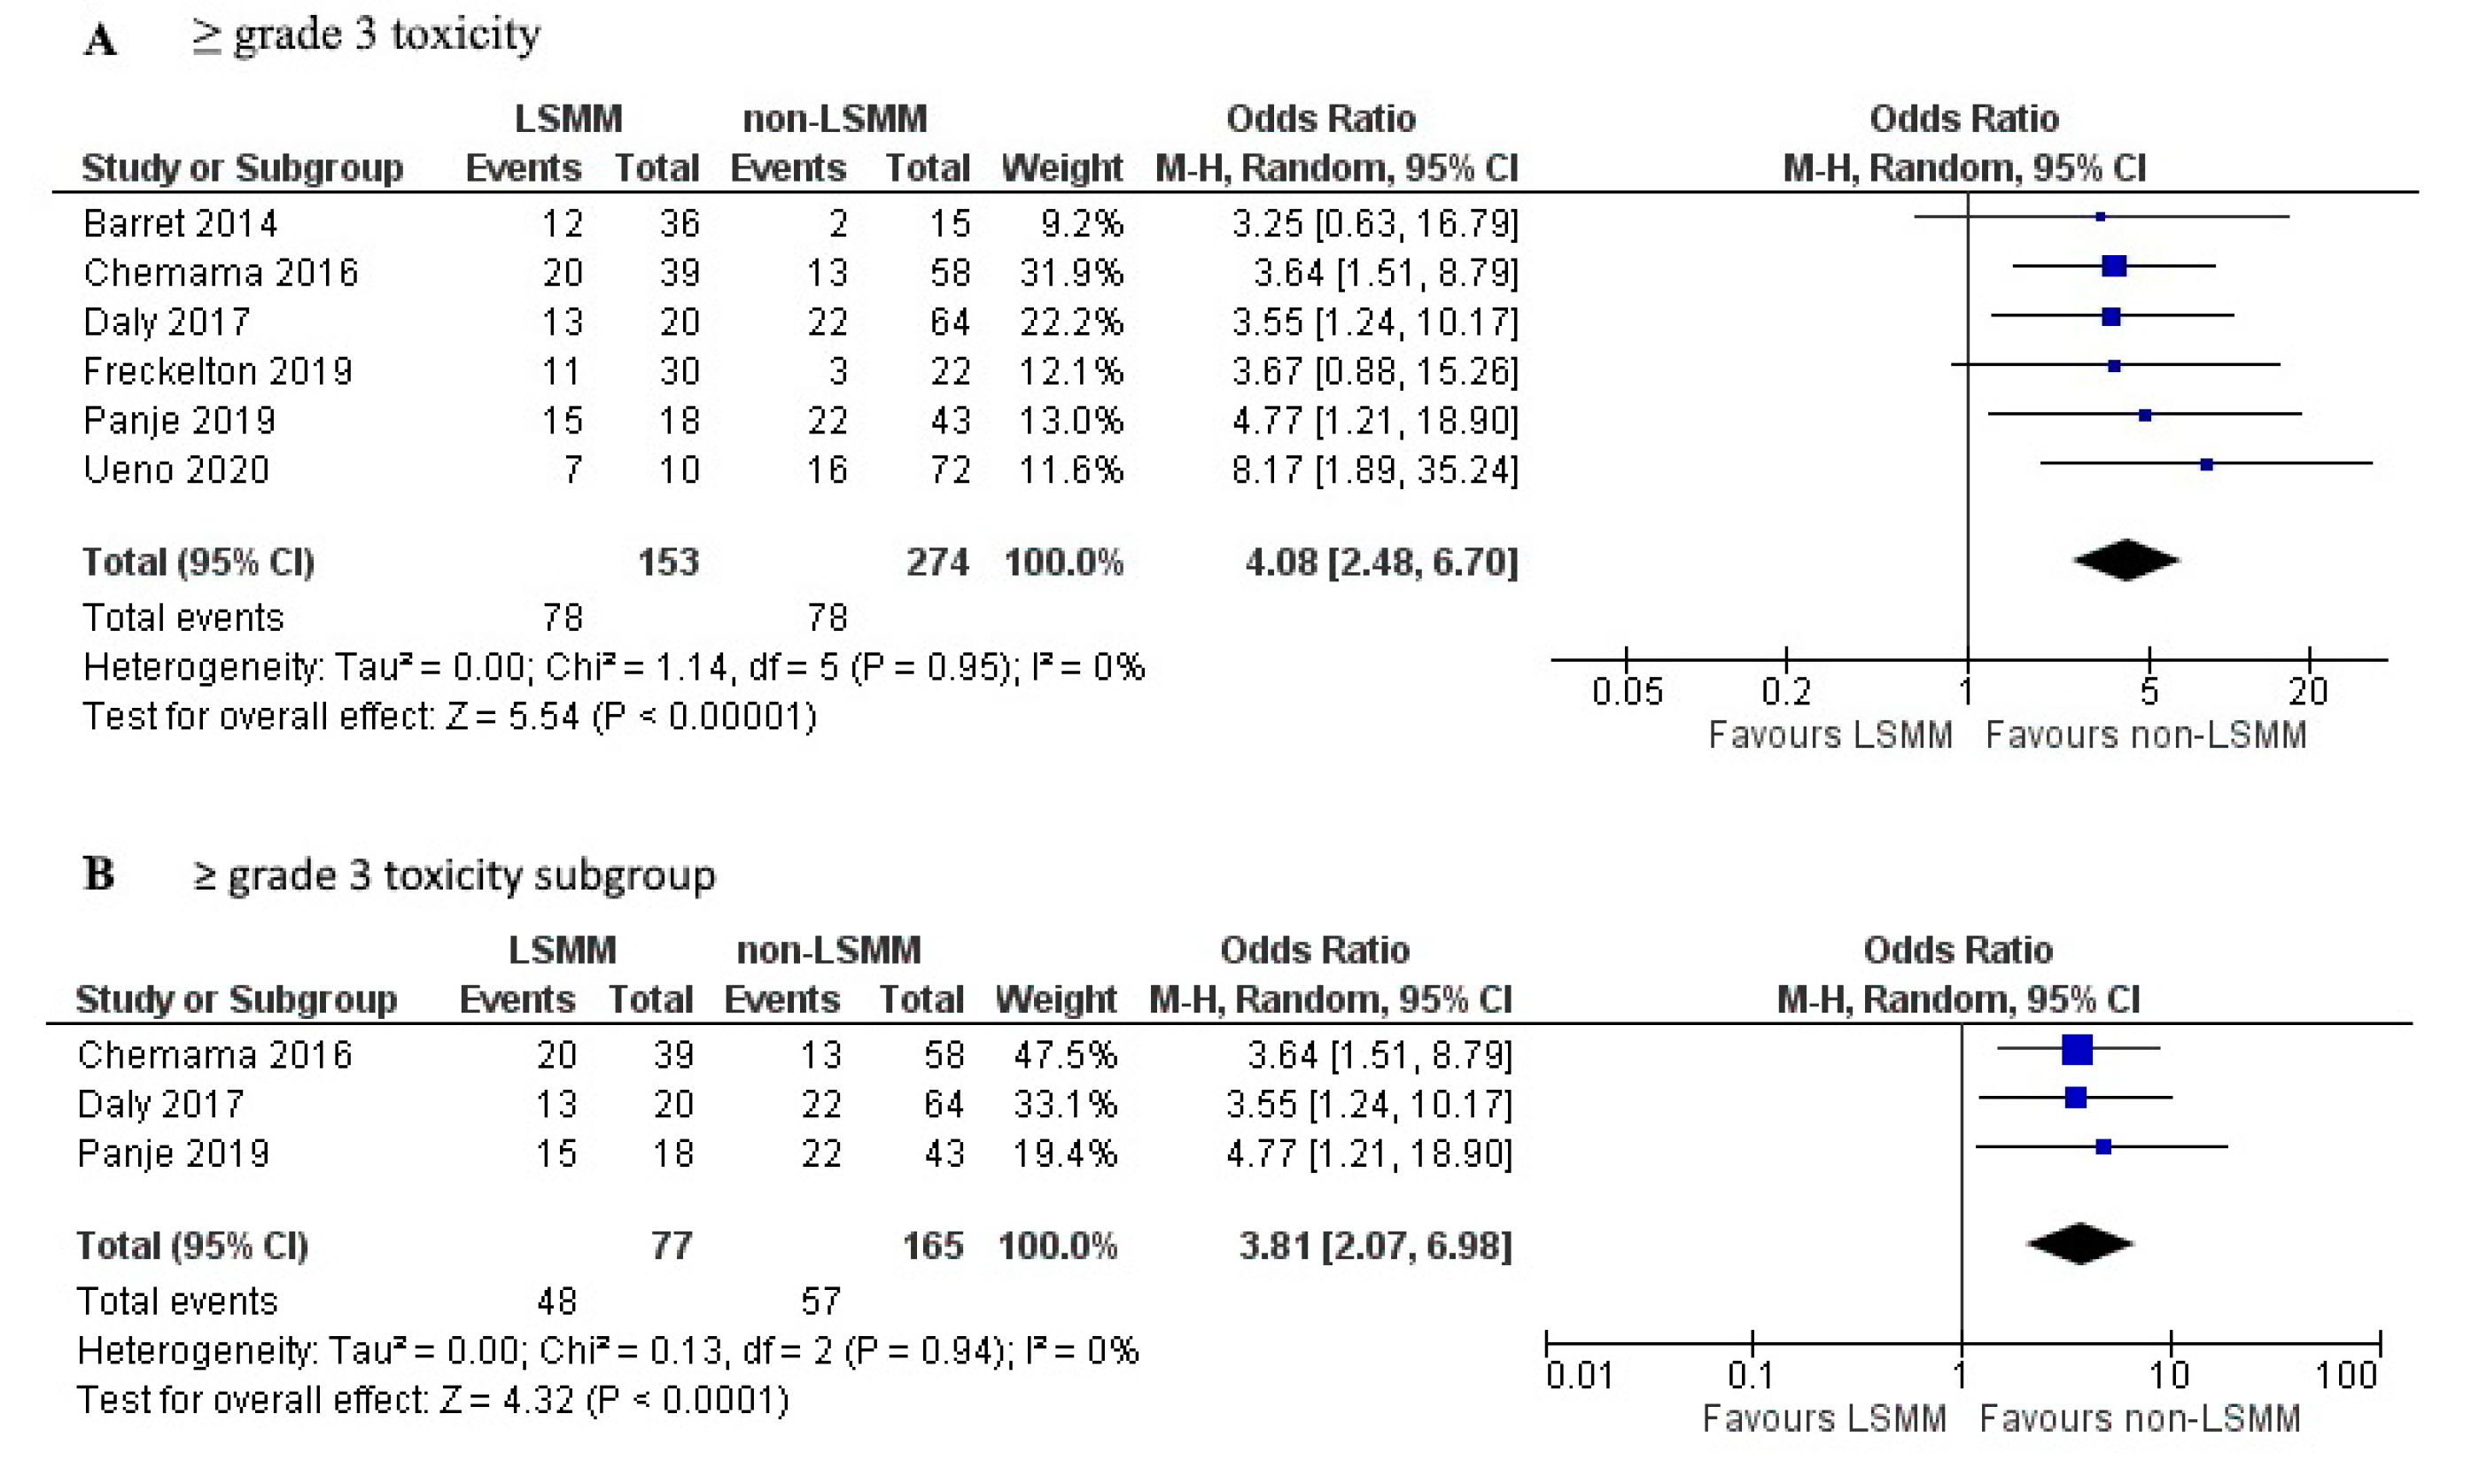
3.5. Association between LSMM and Toxicity
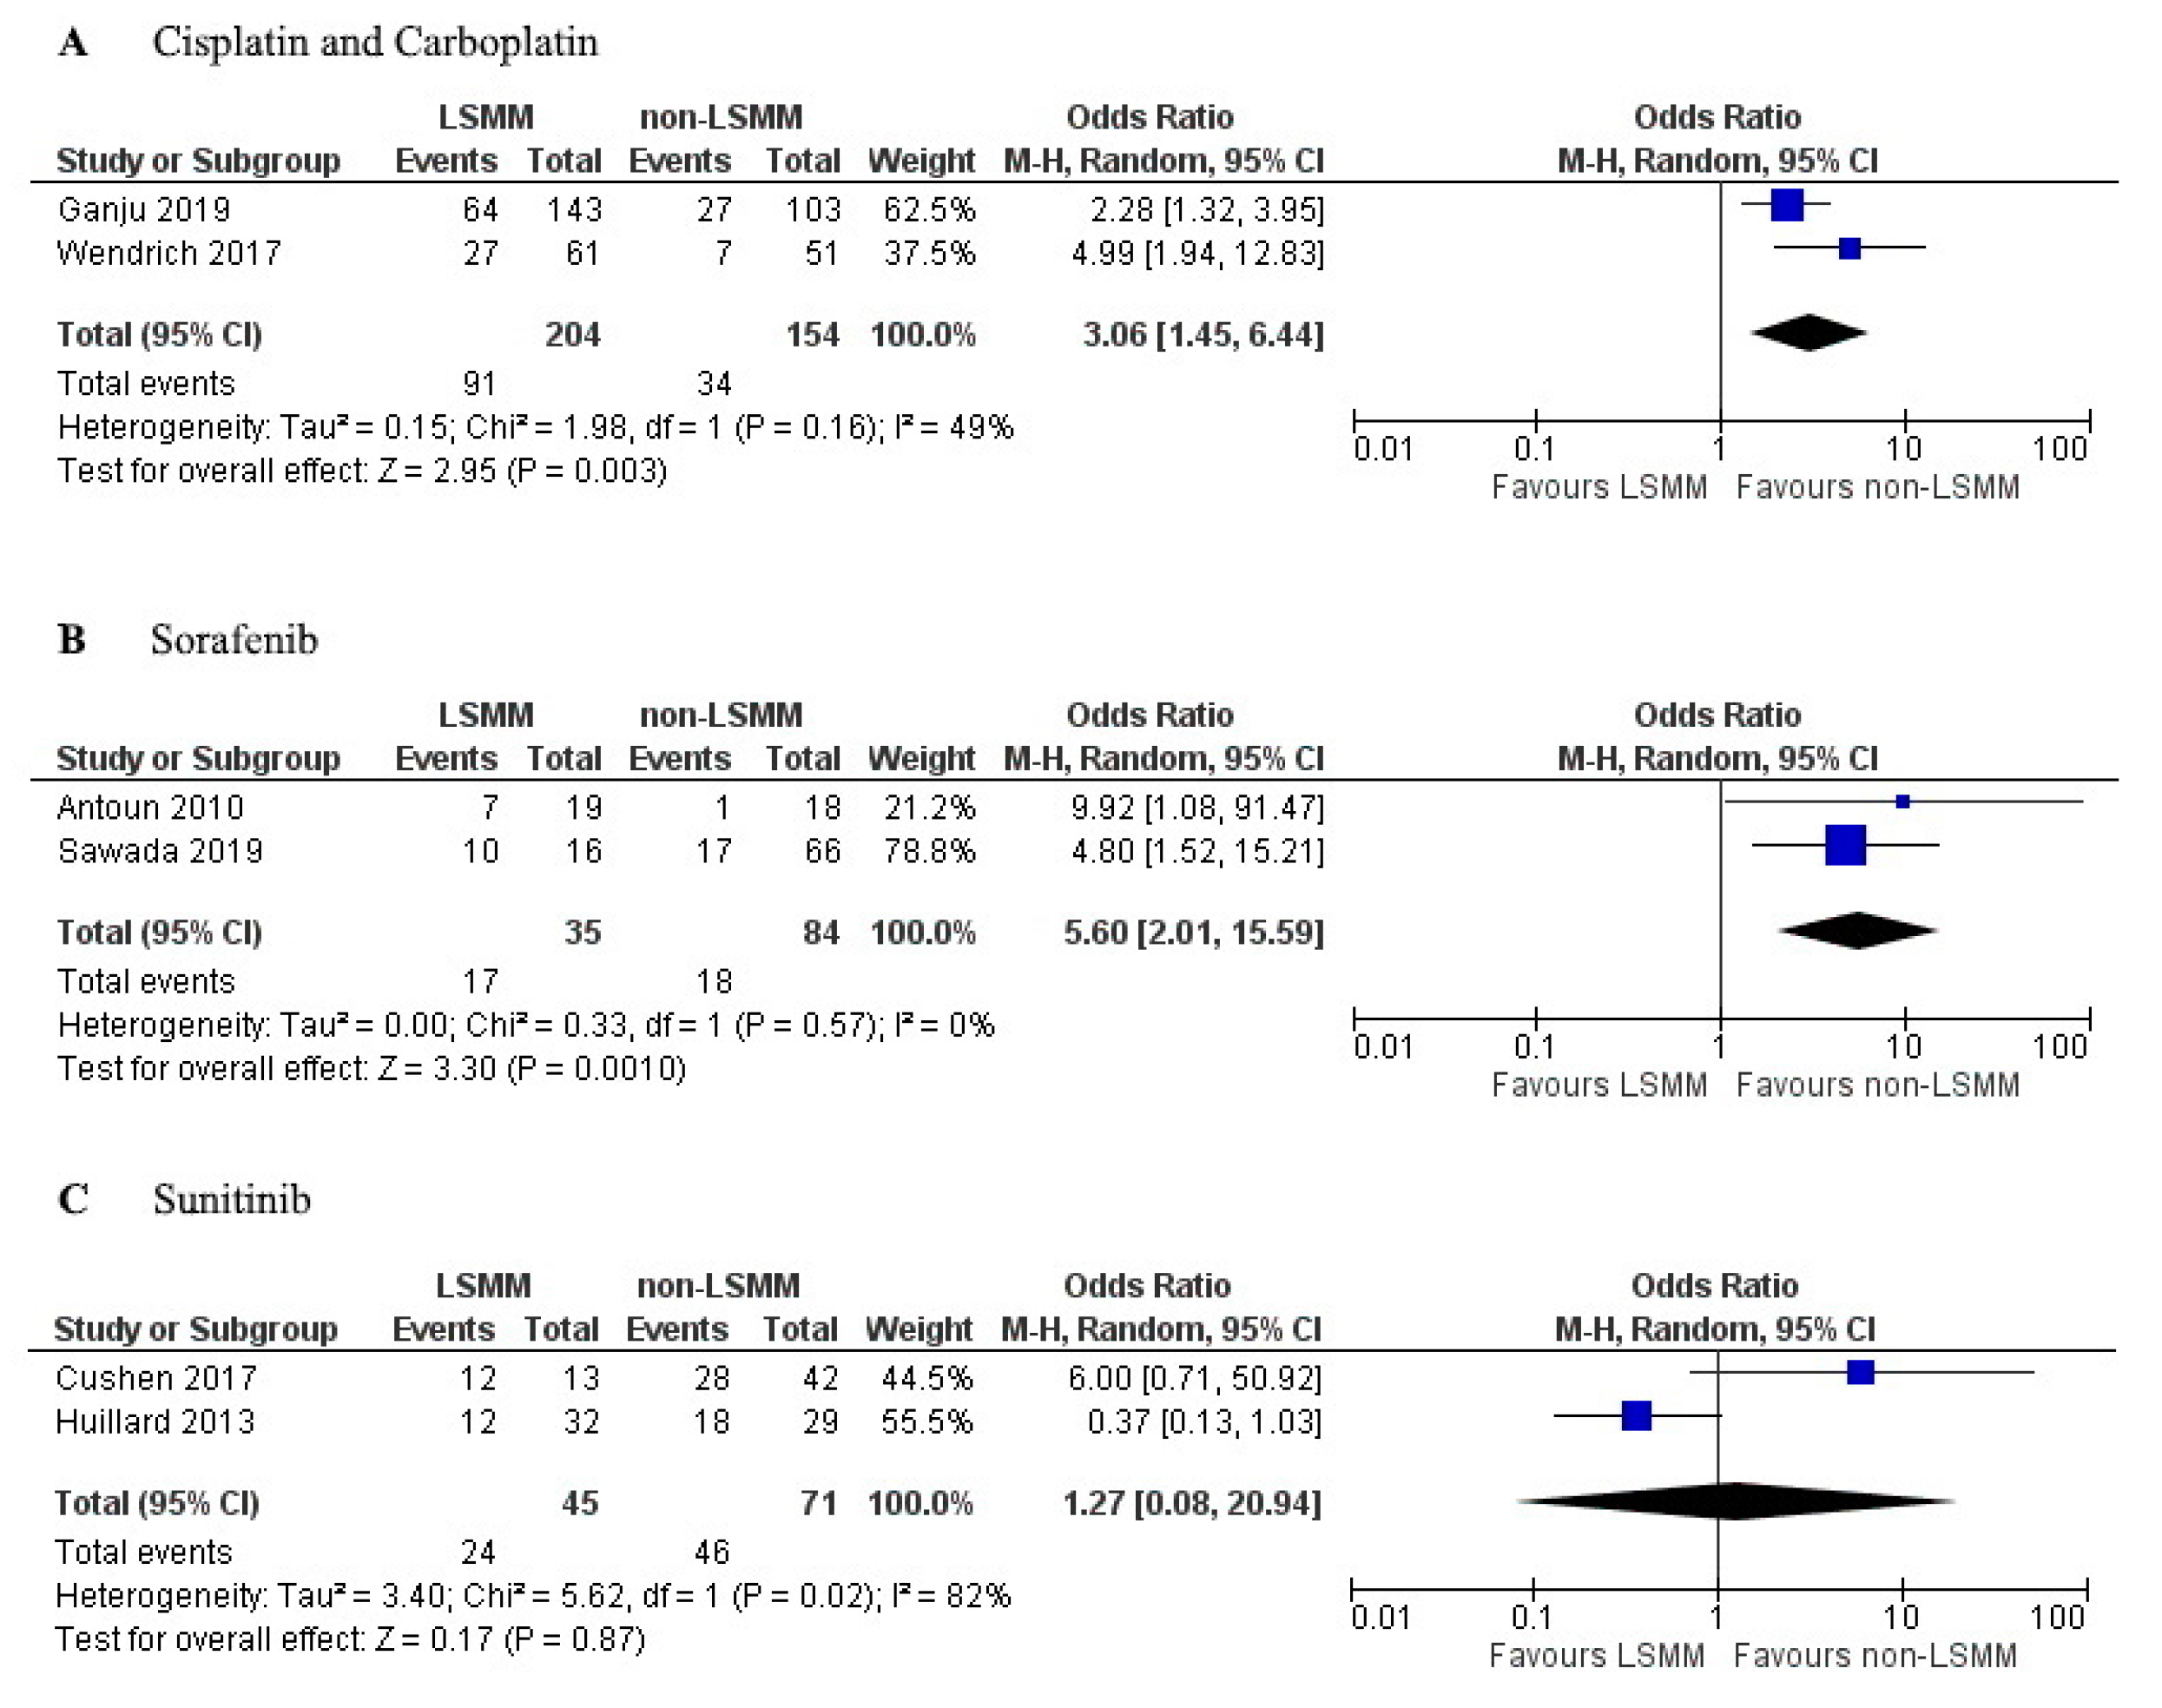
3.6. Subgroup Analysis
4. Discussion
5. Conclusions
Author Contributions
Funding
Acknowledgments
Conflicts of Interest
Appendix A

| Author and Date | Software for Image Analysis | Time between Scan and Treatment | Curative or Palliative Intent | Primary, Neoadjuvant or Adjuvant Chemotherapy | With Radiotherapy |
|---|---|---|---|---|---|
| Anavadivelan et al. 2016 | Image J | Mean: 22 days before start of treatment | Curative | Neoadjuvant | Yes |
| Antoun et al. 2010 | SliceOmatic | Mean: 16.8 days before start of treatment | N/A | N/A | N/A |
| Barret et al. 2014 | SliceOmatic | Within 15 days of inclusion | N/A | Primary | No |
| Chemama et al. 2016 | SliceOmatic | Mean: 34 days before surgery | N/A | Adjuvant to cytoreductive surgery | N/A |
| Cushen et al. 2016 | Osirix | Within 6 weeks of commencing chemotherapy | N/A | Primary or adjuvant | Yes and no |
| Cushen et al. 2017 | Osirix | Within 30 days of treatment start | N/A | Primary | N/A |
| Daly et al. 2017 | Osirix | Mean: 39 days before treatment start | N/A | Primary or adjuvant | N/A |
| Da Rocha et al. 2019 | SliceOmatic | Within 30 days before chemotherapy start | Curative and palliative | Primary, neoadjuvant, or adjuvant | Yes and no |
| Dijksterhuis et al. 2019 | SliceOmatic | Within 60 days before treatment | Palliative | Primary | N/A |
| Freckelton et al. 2019 | SliceOmatic | Within 3 months of treatment start | N/A | Primary | N/A |
| Ganju et al. 2019 | ImageJ | N/A | N/A | Primary or adjuvant | Yes |
| Huillard et al. 2013 | ImageJ | Within 30 days before treatment start | N/A | N/A | N/A |
| Huiskamp et al. 2020 | SliceOmatic | N/A | Curative | Primary or adjuvant | Yes |
| Kobayashi et al. 2019 | Osirix | N/A | N/A | Primary | N/A |
| Kurk et al. 2019 | SliceOmatic | N/A | Palliative | Primary or adjuvant | No |
| Looijaard et al. 2019 | SliceOmatic | Median: 36 days between CT and surgery | N/A | Adjuvant | N/A |
| Mazzuca et al. 2018 | SliceOmatic | N/A | N/A | Adjuvant | N/A |
| Palmela et al. 2017 | N/A | Taken at diagnosis | N/A | Neoadjuvant | N/A |
| Panje et al. 2019 | SliceOmatic | Within 6 weeks of treatment start | Curative | Neoadjuvant | Yes |
| Parsons et al. 2012 | SliceOmatic | Within 4 weeks of treatment start | N/A | N/A | N/A |
| Prado et al. 2009 | SliceOmatic | Within 30 days from treatment initiation | N/A | N/A | N/A |
| Sawada et al. 2019 | Synapse Vincent | N/A | N/A | Primary or adjuvant | Yes and no |
| Sealy et al. 2020 | SliceOmatic | Mean: 55 days before chemotherapy | Curative | Primary or adjuvant | Yes |
| Shachar et al. 2017a | N/A | Within 45 days before chemotherapy | N/A | N/A | N/A |
| Shachar et al. 2017b | AGFA-Impax | Within 12 weeks before chemotherapy | N/A | Neoadjuvant or adjuvant | N/A |
| Srdic et al. 2016 | N/A | Within 30 days of treatment initiation | N/A | N/A | N/A |
| Staley et al. 2019 | SliceOmatic | Within 3 months of diagnosis | N/A | Neoadjuvant or adjuvant | N/A |
| Sugiyama et al. 2018 | Synapse Vincent | Within 1 month before chemotherapy | N/A | Primary | N/A |
| Tan et al. 2015 | SliceOmatic | Before treatment start | Curative | Neoadjuvant | N/A |
| Ueno et al. 2020 | Synapse Vincent | Before treatment start | N/A | Neoadjuvant or adjuvant | N/A |
| Wendrich et al. 2017 | Volumetool | Mean: 21 days before treatment start | N/A | Primary | Yes |
References
- Siddiqui, J.A.; Pothuraju, R.; Jain, M.; Batra, S.K.; Nasser, M.W. Advances in cancer cachexia: Intersections between affected organs, mediators, and pharmacological interventions. Biochim. Biophys. Acta Rev. Cancer 2020, 1873, 188359. [Google Scholar] [CrossRef] [PubMed]
- Wiegert, E.V.; de Oliveira, L.C.; Lima, L.C.; Borges, N.A.; Rodrigues, J.; da Mota, E.; Lopes, M.S.S.; Peres, W.A.F. Association between Low Muscle Mass and Survival in Incurable Cancer Patients: A Systematic Review. Nutrition 2020, 72, 110695. [Google Scholar] [CrossRef] [PubMed]
- Go, S.I.; Park, M.J.; Song, H.N.; Kang, M.H.; Park, H.J.; Jeon, K.N.; Kim, S.H.; Kim, M.J.; Kang, J.H.; Lee, G.W. Sarcopenia and inflammation are independent predictors of survival in male patients newly diagnosed with small cell lung cancer. Support. Care Cancer 2016, 24, 2075–2084. [Google Scholar] [CrossRef] [PubMed]
- Jung, H.W.; Kim, J.W.; Kim, J.Y.; Kim, S.W.; Yang, H.K.; Lee, J.W.; Lee, K.W.; Kim, D.W.; Kang, S.B.; Kim, K.I.; et al. Effect of muscle mass on toxicity and survival in patients with colon cancer undergoing adjuvant chemotherapy. Support. Care Cancer 2015, 23, 687–694. [Google Scholar] [CrossRef]
- Barret, M.; Antoun, S.; Dalban, C.; Malka, D.; Mansourbakht, T.; Zaanan, A.; Latko, E.; Taieb, J. Sarcopenia is linked to treatment toxicity in patients with metastatic colorectal cancer. Nutr. Cancer 2014, 66, 583–589. [Google Scholar] [CrossRef]
- Prado, C.M.; Baracos, V.E.; McCargar, L.J.; Reiman, T.; Mourtzakis, M.; Tonkin, K.; Mackey, J.R.; Koski, S.; Pituskin, E.; Sawyer, M.B. Sarcopenia as a determinant of chemotherapy toxicity and time to tumor progression in metastatic breast cancer patients receiving capecitabine treatment. Clin. Cancer Res. 2009, 15, 2920–2926. [Google Scholar] [CrossRef]
- Huillard, O.; Mir, O.; Peyromaure, M.; Tlemsani, C.; Giroux, J.; Boudou-Rouquette, P.; Ropert, S.; Delongchamps, N.B.; Zerbib, M.; Goldwasser, F. Sarcopenia and body mass index predict sunitinib-induced early dose-limiting toxicities in renal cancer patients. Br. J. Cancer 2013, 108, 1034–1041. [Google Scholar] [CrossRef]
- Wendrich, A.W.; Swartz, J.E.; Bril, S.I.; Wegner, I.; de Graeff, A.; Smid, E.J.; de Bree, R.; Pothen, A.J. Low skeletal muscle mass is a predictive factor for chemotherapy dose-limiting toxicity in patients with locally advanced head and neck cancer. Oral. Oncol. 2017, 71, 26–33. [Google Scholar] [CrossRef]
- Ali, R.; Baracos, V.E.; Sawyer, M.B.; Bianchi, L.; Roberts, S.; Assenat, E.; Mollevi, C.; Senesse, P. Lean body mass as an independent determinant of dose-limiting toxicity and neuropathy in patients with colon cancer treated with FOLFOX regimens. Cancer Med. 2016, 5, 607–616. [Google Scholar] [CrossRef]
- Ansari, E.; Chargi, N.; van Gemert, J.T.M.; van Es, R.J.J.; Dieleman, F.J.; Rosenberg, A.J.W.P.; van Cann, E.M.; de Bree, R. Low skeletal muscle mass is a strong predictive factor for surgical complications and a prognostic factor in oral cancer patients undergoing mandibular reconstruction with a free fibula flap. Oral. Oncol. 2020, 101, 104530. [Google Scholar] [CrossRef]
- Hilmi, M.; Jouinot, A.; Burns, R.; Pigneur, F.; Mounier, R.; Gondin, J.; Neuzillet, C.; Goldwasser, F. Body composition and sarcopenia: The next-generation of personalized oncology and pharmacology? Pharmacol. Ther. 2019, 196, 135–159. [Google Scholar] [CrossRef]
- Prado, C.M.; Birdsell, L.A.; Baracos, V.E. The emerging role of computerized tomography in assessing cancer cachexia. Curr. Opin. Support. Palliat. Care 2009, 3, 269–275. [Google Scholar] [CrossRef]
- Shen, W.; Punyanitya, M.; Wang, Z.; Gallagher, D.; St-Onge, M.P.; Albu, J.; Heymsfield, S.B.; Heshka, S. Total body skeletal muscle and adipose tissue volumes: Estimation from a single abdominal cross-sectional image. J. Appl. Physiol. 2004, 97, 2333–2338. [Google Scholar] [CrossRef]
- Chargi, N.; Ansari, E.; Huiskamp, L.F.J.; Bol, G.; de Bree, R. Agreement between skeletal muscle mass measurements using computed tomography imaging and magnetic resonance imaging in head and neck cancer patients. Oral. Oncol. 2019, 99. [Google Scholar] [CrossRef]
- Marty, E.; Liu, Y.; Samuel, A.; Or, O.; Lane, J. A review of sarcopenia: Enhancing awareness of an increasingly prevalent disease. Bone 2017, 105, 276–286. [Google Scholar] [CrossRef] [PubMed]
- Tan, B.H.; Brammer, K.; Randhawa, N.; Welch, N.T.; Parsons, S.L.; James, E.J.; Catton, J.A. Sarcopenia is associated with toxicity in patients undergoing neo-adjuvant chemotherapy for oesophago-gastric cancer. Eur. J. Surg. Oncol. 2015, 41, 333–338. [Google Scholar] [CrossRef] [PubMed]
- Moher, D.; Liberati, A.; Tetzlaff, J.; Altman, D.G.; PRISMA Group. Preferred reporting items for systematic reviews and meta-analyses: The PRISMA statement. PLoS Med. 2009, 151, 264–269. [Google Scholar] [CrossRef]
- Hayden, J.A.; van der Windt, D.A.; Cartwright, J.L.; Côté, P.; Bombardier, C. Assessing bias in studies of prognostic factors. Ann. Intern. Med. 2013, 158, 280–286. [Google Scholar] [CrossRef]
- Anandavadivelan, P.; Brismar, T.B.; Nilsson, M.; Johar, A.M.; Martin, L. Sarcopenic obesity: A probable risk factor for dose limiting toxicity during neo-adjuvant chemotherapy in oesophageal cancer patients. Clin. Nutr. 2016, 35, 724–730. [Google Scholar] [CrossRef]
- Antoun, S.; Baracos, V.E.; Birdsell, L.; Escudier, B.; Sawyer, M.B. Low body mass index and sarcopenia associated with dose-limiting toxicity of sorafenib in patients with renal cell carcinoma. Ann. Oncol. 2010, 21, 1594–1598. [Google Scholar] [CrossRef]
- Chemama, S.; Bayar, M.A.; Lanoy, E.; Ammari, S.; Stoclin, A.; Goéré, D.; Elias, D.; Raynard, B. Sarcopenia is associated with chemotherapy toxicity in patients undergoing cytoreductive surgery with hyperthermic intraperitoneal chemotherapy for peritoneal carcinomatosis from colorectal cancer. Ann. Surg. Oncol. 2016, 23, 3891–3898. [Google Scholar] [CrossRef] [PubMed]
- Cushen, S.J.; Power, D.G.; Murphy, K.P.; McDermott, R.; Griffin, B.T.; Lim, M.; Daly, L.; MacEneaney, P.; O’Sullivan, K.; Prado, C.M.; et al. Impact of body composition parameters on clinical outcomes in patients with metastatic castrate-resistant prostate cancer treated with docetaxel. Clin. Nutr. Espen. 2016, 13, e39–e45. [Google Scholar] [CrossRef] [PubMed]
- Cushen, S.J.; Power, D.G.; Teo, M.Y.; MacEneaney, P.; Maher, M.M.; McDermott, R.; O’Sullivan, K.; Ryan, A.M. Body composition by computed tomography as a predictor of toxicity in patients with renal cell carcinoma treated with sunitinib. Am. J. Clin. Oncol. 2017, 40, 47–52. [Google Scholar] [CrossRef]
- Da Rocha, I.M.; Marcadenti, A.; de Medeiros, G.O.; Bezerra, R.A.; Rego, J.F.; Gonzalez, M.C.; Fayh, A.P.T. Is cachexia associated with chemotherapy toxicities in gastrointestinal cancer patients? A prospective study. J. Cachexia Sarcopenia Muscle 2019, 10, 445–454. [Google Scholar] [CrossRef]
- Daly, L.E.; Power, D.G.; O’Reilly, Á.; Donnellan, P.; Cushen, S.J.; O’Sullivan, K.; Twomey, M.; Woodlock, D.P.; Redmond, H.P.; Ryan, A.M. The impact of body composition parameters on ipilimumab toxicity and survival in patients with metastatic melanoma. Br. J. Cancer 2017, 116, 310–317. [Google Scholar] [CrossRef]
- Dijksterhuis, W.P.M.; Pruijt, M.J.; van der Woude, S.O.; Klaassen, R.; Kurk, S.A.; van Oijen, M.G.H.; van Laarhoven, H.W.M. Association between body composition, survival, and toxicity in advanced esophagogastric cancer patients receiving palliative chemotherapy. J. Cachexia Sarcopenia Muscle 2019, 10, 199–206. [Google Scholar] [CrossRef]
- Freckelton, J.; Croagh, D.; Holt, D.Q.; Fox, A.; Wong, R.; Lee, M.; Moore, G.T. Body composition adjusted dosing of Gemcitabine-Nab-Paclitaxel in pancreatic cancer does not predict toxicity compared to body surface area dosing. Nutr. Cancer 2019, 71, 624–628. [Google Scholar] [CrossRef]
- Ganju, R.G.; Morse, R.; Hoover, A.; TenNapel, M.; Lominska, C.E. The impact of sarcopenia on tolerance of radiation and outcome in patients with head and neck cancer receiving chemoradiation. Radiother. Oncol. 2019, 137, 117–124. [Google Scholar] [CrossRef]
- Huiskamp, L.F.J.; Chargi, N.; Devriese, L.A.; de Jong, P.A.; de Bree, R. The predictive and prognostic value of low skeletal muscle mass for dose‑limiting toxicity and survival in head and neck cancer patients receiving concomitant cetuximab and radiotherapy. Eur. Arch. Otorhinolaryngol. 2020, 277, 2847–2858. [Google Scholar] [CrossRef]
- Kobayashi, H.; Okuma, T.; Oka, H.; Okajima, K.; Ishibashi, Y.; Zhang, L.; Hirai, T.; Ohki, T.; Tsuda, Y.; Ikegami, M.; et al. Body composition as a predictor of toxicity after treatment with eribulin for advanced soft tissue sarcoma. Int. J. Clin. Oncol. 2019, 24, 437–444. [Google Scholar] [CrossRef]
- Kurk, S.; Peeters, P.; Stellato, R.; Dorresteijn, B.; de Jong, P.; Jourdan, M.; Creemers, G.J.; Erdkamp, F.; de Jongh, F.; Kint, P.; et al. Skeletal muscle mass loss and dose-limiting toxicities in metastatic colorectal cancer patients. J. Cachexia Sarcopenia Muscle 2019, 10, 803–813. [Google Scholar] [CrossRef] [PubMed]
- Looijaard, S.M.; Meskers, C.G.; Slee-Valentijn, M.S.; Bouman, D.E.; Wymenga, A.M.; Klaase, J.M.; Maier, A.B. Computed Tomography-Based Body Composition Is Not Consistently Associated with Outcome in Older Patients with Colorectal Cancer. Oncologist 2020, 25, e492–e501. [Google Scholar] [CrossRef] [PubMed]
- Mazzuca, F.; Onesti, C.E.; Roberto, M.; Di Girolamo, M.; Botticelli, A.; Begini, P.; Strigari, L.; Marchetti, P.; Muscaritoli, M. Lean body mass wasting and toxicity in early breast cancer patients receiving anthracyclines. Oncotarget 2018, 9, 25714–25722. [Google Scholar] [CrossRef] [PubMed]
- Palmela, C.; Velho, S.; Agostinho, L.; Branco, F.; Santos, M.; Santos, M.P.; Oliveira, M.H.; Strecht, J.; Maio, R.; Cravo, M.; et al. Body composition as a prognostic factor of neoadjuvant chemotherapy toxicity and outcome in patients with locally advanced gastric cancer. J. Gastric Cancer 2017, 17, 74–87. [Google Scholar] [CrossRef]
- Panje, C.M.; Höng, L.; Hayoz, S.; Baracos, V.E.; Herrmann, E.; Schüler, H.G.; Meier, U.R.; Henke, G.; Schacher, S.; Hawle, H.; et al. Skeletal muscle mass correlates with increased toxicity during neoadjuvant radiochemotherapy in locally advanced esophageal cancer: A SAKK 75/08 substudy. Radiat. Oncol. 2019, 14, 1–7. [Google Scholar] [CrossRef]
- Parsons, H.A.; Tsimberidou, A.M.; Pontikos, M.; Fu, S.; Hong, D.; Wen, S.; Baracos, V.E.; Kurzrock, R. Evaluation of the clinical relevance of body composition parameters in patients with cancer metastatic to the liver treated with hepatic arterial infusion chemotherapy. Nutr. Cancer 2012, 64, 206–217. [Google Scholar] [CrossRef]
- Sawada, K.; Saitho, Y.; Hayashi, H.; Hasebe, T.; Nakajima, S.; Ikuta, K.; Fujiya, M.; Okumura, T. Skeletal muscle mass is associated with toxicity, treatment tolerability, and additional or subsequent therapies in patients with hepatocellular carcinoma receiving sorafenib treatment. JGH Open 2019, 3, 329–337. [Google Scholar] [CrossRef]
- Sealy, M.J.; Dechaphunkul, T.; van der Schans, C.P.; Krijnen, W.P.; Roodenburg, J.L.; Walker, J.; Jager-Wittenaar, H.; Baracos, V.E. Low muscle mass is associated with early termination of chemotherapy related to toxicity in patients with head and neck cancer. Clin. Nutr. 2020, 39, 501–509. [Google Scholar] [CrossRef]
- Shachar, S.S.; Deal, A.M.; Weinberg, M.; Nyrop, K.A.; Williams, G.R.; Nishijima, T.F.; Benbow, J.M.; Muss, H.B. Skeletal muscle measures as predictors of toxicity, hospitalization, and survival in patients with metastatic breast cancer receiving taxane-based chemotherapy. Clin. Cancer Res. 2017, 23, 658–665. [Google Scholar] [CrossRef]
- Shachar, S.S.; Deal, A.M.; Weinberg, M.; Williams, G.R.; Nyrop, K.A.; Popuri, K.; Choi, S.K.; Muss, H.B. Body composition as a predictor of toxicity in patients receiving anthracycline and taxane–based chemotherapy for early-stage breast cancer. Clin. Cancer Res. 2017, 23, 3537–3543. [Google Scholar] [CrossRef]
- Srdic, D.; Plestina, S.; Sverko-Peternac, A.; Nikolac, N.; Simundic, A.M.; Samarzija, M. Cancer cachexia, sarcopenia and biochemical markers in patients with advanced non-small cell lung cancer—Chemotherapy toxicity and prognostic value. Support. Care Cancer 2016, 24, 4495–4502. [Google Scholar] [CrossRef] [PubMed]
- Staley, S.A.; Tucker, K.; Newton, M.; Ertel, M.; Oldan, J.; Doherty, I.; West, L.; Zhang, Y.; Gehrig, P.A. Sarcopenia as a predictor of survival and chemotoxicity in patients with epithelial ovarian cancer receiving platinum and taxane-based chemotherapy. Gynecol. Oncol. 2020, 156, 695–700. [Google Scholar] [CrossRef] [PubMed]
- Sugiyama, K.; Narita, Y.; Mitani, S.; Honda, K.; Masuishi, T.; Taniguchi, H.; Kadowaki, S.; Ura, T.; Ando, M.; Tajika, M.; et al. Baseline sarcopenia and skeletal muscle loss during chemotherapy affect survival outcomes in metastatic gastric Cancer. Anticancer Res. 2018, 38, 5859–5866. [Google Scholar] [CrossRef] [PubMed]
- Ueno, A.; Yamaguchi, K.; Sudo, M.; Imai, S. Sarcopenia as a risk factor of severe laboratory adverse events in breast cancer patients receiving perioperative epirubicin plus cyclophosphamide therapy. Support. Care Cancer 2020, 28, 4249–4254. [Google Scholar] [CrossRef]
- Prado, C.M.; Lieffers, J.R.; McCargar, L.J.; Reiman, T.; Sawyer, M.B.; Martin, L.; Baracos, V.E. Prevalence and clinical implications of sarcopenic obesity in patients with solid tumours of the respiratory and gastrointestinal tracts: A population-based study. Lancet Oncol. 2008, 9, 629–635. [Google Scholar] [CrossRef]
- Martin, L.; Birdsell, L.; MacDonald, N.; Reiman, T.; Clandinin, M.T.; McCargar, L.J.; Murphy, R.; Ghosh, S.; Sawyer, M.B.; Baracos, V.E. Cancer cachexia in the age of obesity: Skeletal muscle depletion is a powerful prognostic factor, independent of body mass index. J. Clin. Oncol. 2013, 31, 1539–1547. [Google Scholar] [CrossRef]
- Fujiwara, N.; Nakagawa, H.; Kudo, Y.; Tateishi, R.; Taguri, M.; Watadani, T.; Nakagomi, R.; Kondo, M.; Nakatsuka, T.; Minami, T.; et al. Sarcopenia, intramuscular fat deposition, and visceral adiposity independently predict the outcomes of hepatocellular carcinoma. J. Hepatol. 2015, 63, 131–140. [Google Scholar] [CrossRef]
- Caan, B.J.; Feliciano, E.M.; Prado, C.M.; Alexeeff, S.; Kroenke, C.H.; Bradshaw, P.; Quesenberry, C.P.; Weltzien, E.K.; Castillo, A.L.; Olobatuyi, T.A.; et al. Association of muscle and adiposity measured by computed tomography with survival in patients with nonmetastatic breast cancer. JAMA Oncol. 2018, 4, 798–804. [Google Scholar] [CrossRef]
- De Jongh, F.E.; Gallo, J.M.; Shen, M.; Verweij, J.; Sparreboom, A. Population pharmacokinetics of cisplatin in adult cancer patients. Cancer Chemother. Pharm. 2004, 54, 105–112. [Google Scholar] [CrossRef]
- Obasaju, C.K.; Johnson, S.W.; Rogatko, A.; Kilpatrick, D.; Brennan, J.M.; Hamilton, T.C.; Ozols, R.F.; O’Dwyer, P.J.; Gallo, J.M. Evaluation of carboplatin pharmacokinetics in the absence and presence of paclitaxel. Clin. Cancer Res. 1996, 2, 549–552. [Google Scholar]
- Abdelgalil, A.A.; Alkahtani, H.M.; Al-Jenoobi, F.I. Sorafenib. In Profiles of Drug Substances, Excipients and Related Methodology; Academic Press: Cambridge, MA, USA, 2019; Volume 44, pp. 239–266. [Google Scholar] [CrossRef]
- Pfizer Inc. SUTENT, Summary of Product Characteristics. 2008. Available online: https://www.ema.europa.eu/en/documents/product-information/sutent-epar-product-information_en.pdf (accessed on 19 May 2020).


| Author and Date | (n) | Type of Cancer | Measure LSMM | Occurrence LSMM n (%) or Mean (SD) | Location Analysed | Anti-Cancer Drug | Measure of Toxicity | Occurrence Toxicity n (%) |
|---|---|---|---|---|---|---|---|---|
| Anavadivelan et al. 2016 [19] | 72 | Oesophageal | 1 | 31 (43.0%) | CT-L3 | Cisplatin + 5-FU | DLT a | Not given |
| Antoun et al. 2010 [20] | 55 | Renal cell | 1 | 30 (54.5%) | CT-L3 | Sorafenib | DLT a | 12 (21.8%) |
| Barret et al. 2014 [5] | 51 | Metastatic colorectal | 1 | 36 (70.6%) | CT-L3 | FP with/without oxaliplatin oririnotecan with/without cetuximab | ≥grade 3 toxicity | 14 (27.5%) |
| Chemama et al. 2016 [21] | 97 | Peritoneal carcinomatosis and colorectal | 2 | 39 (40.0%) | CT-L3 | HIPEC oxaliplatin + irinotecan | ≥grade 3 toxicity | 33 (39.0%) |
| Cushen et al. 2016 [22] | 63 | Metastatic castrate resistant prostate | 2 | 30 (47.6%) | CT-L3 | Docetaxel-based | DLT a | 22 (34.9%) |
| Cushen et al. 2017 [23] | 55 | Clear cell renal cell | 3 | 13 (23.6%) | CT-L3 | Sunitinib | DLT a | 40 (73.0%) |
| Daly et al. 2017 [25] | 84 | Metastatic melanoma | 2 | 20 (23.8%) | CT-L3 | Ipilimumab | ≥grade 3 toxicity | 35 (41.7%) |
| Da Rocha et al. 2019 [24] | 60 | Gastrointestinal | 2 | 14 (23.3%) | CT-L3 | 5-FU+ leucovorin, FOLFOX, or paclitaxel + carboplatin | DLT a during first cycle | 14 (23.3%) |
| Dijksterhuis et al. 2019 [26] | 88 | Esophagogastric | 2 | 43 (48.9%) | CT-L3 | CAPOX | ≥grade 3 toxicity during first cycle | 32 (36.4%) |
| Freckelton et al. 2019 [27] | 52 | Metastatic pancreatic ductal adenocarcinoma | 1 | 30 (57.7%) | CT-L3 | Gemcitabine + nab-paclitaxel | ≥grade 3 toxicity during first cycle | 14 (27.0%) |
| Ganju et al. 2019 [28] | 246 | Head and neck cancer | 2 | 143 (58.0%) | CT-C3 | Cisplatin, cetuximab, orcarboplatin | DLT a | 91 (37.0%) |
| Huillard et al. 2013 [7] | 61 | Metastatic renal cell | 1 | 32 (52.5%) | CT-L3 | Sunitinib | DLT a during first cycle | 18 (29.5%) |
| Huiskamp et al. 2020 [29] | 91 | Head and neck | ≤45.2 cm2/m2 | 68 (74.7%) | CT-C3 MRI-C3 | Cetuximab | DLT a | 28 (30.8%) |
| Kobayashi et al. 2019 [30] | 23 | Inoperable soft tissue sarcoma | <39 cm2/m2 | 11 (47.8%) | CT-L3 | Eribulin | ≥grade 3 toxicity | 16 (69.6%) |
| Kurk et al. 2019 [31] | 414 | Metastatic colorectal | 2 | 198 (47.8%) | CT-L3 | CAPOX-B or CAP-B | DLT a | 130 (56.0%) 111 (61.0%) b |
| Looijaard et al. 2019 [32] | 53 | Colon | Continuous SMI | 46.3 (8.9) | CT-L3 | Capecitabine, CAPOX, 5-FU+leucovorin, or FOLFOX | DLT a | 41 (77.4%) |
| Mazzuca et al. 2018 [33] | 21 | Stage 1–3 breast | ≤38.5 cm2/m2 | 8 (38.1%) | CT-L3 | A combination of 2–3: adriamycin, paclitaxel, docetaxel, epirubicin, trastuzumab, 5-FU, or cyclophosphamide | ≥grade 3 toxicity | Not given |
| Palmela et al. 2017 [34] | 47 | Stomach or gastroesophageal junction | 2 | 11 (23%) | CT-L3 | A combination of 2–3: epirubicin, cisplatin, 5-FU, oxaliplatin, docetaxel, leucovorin, or capecitabine | DLT a | 21 (44.7%) |
| Panje et al. 2019 [35] | 61 | Locally advanced oesophageal | 2 | 18 (29.5%) | CT-L3 | Docetaxel + cisplatin with/without cetuximab | ≥grade 3 toxicity | 37 (60.7%) |
| Parsons et al. 2012 [36] | 48 | Liver metastasis | 1 | 20 (42.0%) | CT-L3 | HAI oxaliplatin + leucovorin + 5-FU + bevacizumab | ≥grade 3 toxicity | Not given |
| Prado et al. 2009 [6] | 55 | Metastatic breast | 1 | 14 (25.5%) | CT-L3 | Capecitabine | ≥grade 2 toxicity | 15 (27.3%) |
| Sawada et al. 2019 [37] | 82 | Hepatocellular | 4 | 16 (19.5%) | CT-L3 | Sorafenib | DLT a | 27 (32.9%) |
| Sealy et al. 2020 [38] | 213 | Head and neck cancer | Continuous SMI | L3: 51.62 (10.16) T4: 65.53 (12.60) | CT-L3 or CT-T4 | Cisplatin or carboplatin | DLT a | 61 (29.0%) |
| Shachar et al. 2017a [39] | 40 | Metastatic breast | ≤41 cm2/m2 | 23 (58%) | CT-L3 | Paclitaxel, docetaxel, or nab-paclitaxel combined with trastuzumab, pertuzumab, or bevacizumab | DLT a | 23 (58.0%) |
| Shachar et al. 2017b [40] | 151 | Early breast | Continuous SMI | 44.72 (6.86) | CT-L3 | Adraimycin + cyclophosphamide | ≥grade 3 toxicity | 50 (33.1%) |
| Srdic et al. 2016 [41] | 100 | Non-small cell lung | 1 | 47 (47%) | CT-L3 | Platinum based chemotherapy with gemcitabine, paclitaxel or etoposide | ≥grade 2 toxicity during first cycle | 57 (57.0%) |
| Staley et al. 2019 [42] | 134 | Epithelial ovarian | ≤41 cm2/m2 | 73 (54.5%) | CT-L3 | Platinum and taxane-based chemotherapy | Dose delay or reduction | 51 (38.1%) 50 (37.3%)c |
| Sugiyama et al. 2018 [43] | 118 | Metastatic gastric | 1 | 105 (89.0%) | CT-L3 | FP with cisplatin or oxaliplatin | ≥grade 3 toxicity | Not given |
| Tan et al. 2015 [16] | 89 | Oesophago-gastric | 1 | 44 (49.4%) | CT-L3 | Cisplatin + 5-FU or epirubicin + cisplatin + capecitabine | DLT a | 37 (41.6%) |
| Ueno et al. 2020 [44] | 82 | Breast | 5 | 10 (12.2%) | CT-L3 | Epirubicin + cyclophosphamide | ≥grade 3 laboratory toxicity | 23 (28.0%) |
| Wendrich et al. 2017 [8] | 112 | Squamous cell head and neck | ≤43.2 cm2/m2 | 61 (54.5%) | CT- C3 | Cisplatin or carboplatin | DLT a | 34 (30.4%) |
Publisher’s Note: MDPI stays neutral with regard to jurisdictional claims in published maps and institutional affiliations. |
© 2020 by the authors. Licensee MDPI, Basel, Switzerland. This article is an open access article distributed under the terms and conditions of the Creative Commons Attribution (CC BY) license (http://creativecommons.org/licenses/by/4.0/).
Share and Cite
Huiskamp, L.F.J.; Chargi, N.; Devriese, L.A.; May, A.M.; Huitema, A.D.R.; de Bree, R. The Predictive Value of Low Skeletal Muscle Mass Assessed on Cross-Sectional Imaging for Anti-Cancer Drug Toxicity: A Systematic Review and Meta-Analysis. J. Clin. Med. 2020, 9, 3780. https://doi.org/10.3390/jcm9113780
Huiskamp LFJ, Chargi N, Devriese LA, May AM, Huitema ADR, de Bree R. The Predictive Value of Low Skeletal Muscle Mass Assessed on Cross-Sectional Imaging for Anti-Cancer Drug Toxicity: A Systematic Review and Meta-Analysis. Journal of Clinical Medicine. 2020; 9(11):3780. https://doi.org/10.3390/jcm9113780
Chicago/Turabian StyleHuiskamp, Laura F. J., Najiba Chargi, Lot A. Devriese, Anne M. May, Alwin D. R. Huitema, and Remco de Bree. 2020. "The Predictive Value of Low Skeletal Muscle Mass Assessed on Cross-Sectional Imaging for Anti-Cancer Drug Toxicity: A Systematic Review and Meta-Analysis" Journal of Clinical Medicine 9, no. 11: 3780. https://doi.org/10.3390/jcm9113780
APA StyleHuiskamp, L. F. J., Chargi, N., Devriese, L. A., May, A. M., Huitema, A. D. R., & de Bree, R. (2020). The Predictive Value of Low Skeletal Muscle Mass Assessed on Cross-Sectional Imaging for Anti-Cancer Drug Toxicity: A Systematic Review and Meta-Analysis. Journal of Clinical Medicine, 9(11), 3780. https://doi.org/10.3390/jcm9113780