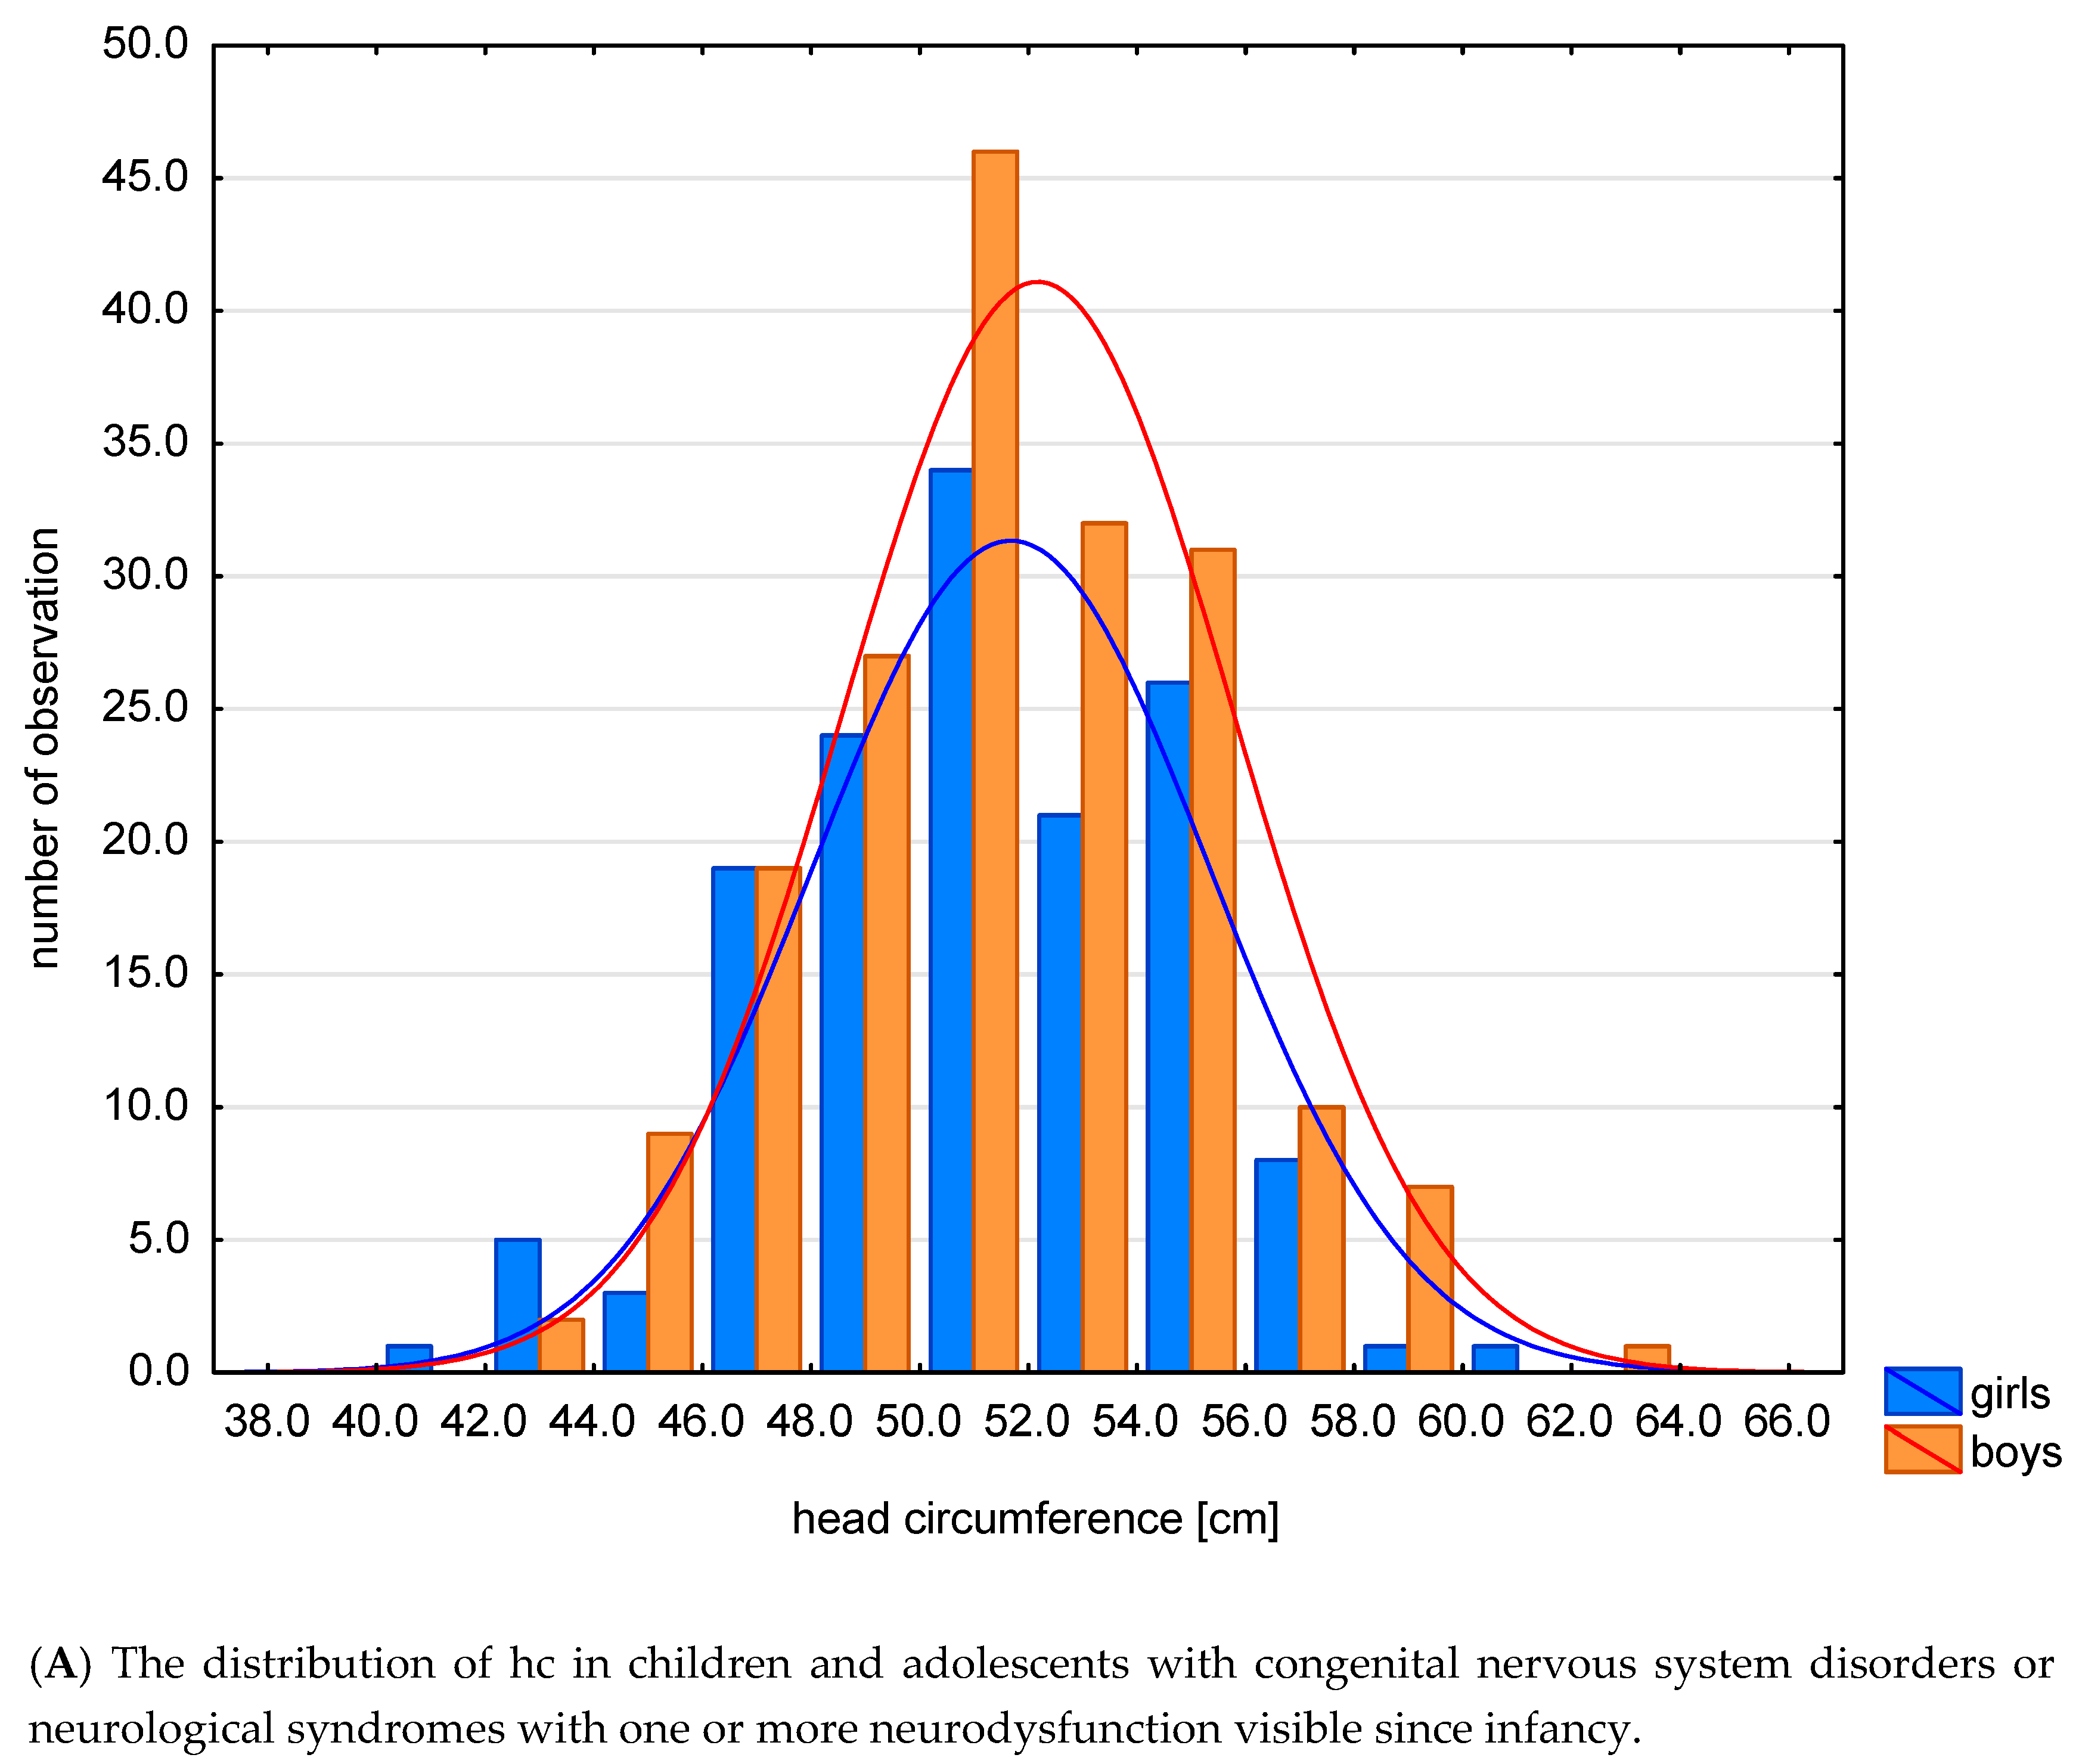
Abnormal Head Size in Children and Adolescents with Congenital Nervous System Disorders or Neurological Syndromes with One or More Neurodysfunction Visible since Infancy


Abstract
1. Introduction
2. Materials and Methods
2.1. Participants
2.2. Procedures and Data Analyses
3. Results
- AHS—dysmorphological classification (hc and HCI) and units and syndromes running with neurodysfunction (p < 0.001, Cp = 0.736). Relative microcephaly often coexisted with CP (N% = 75.6%, ASR = 2.5), and rarely with sasMMC and HCP (N% = 0.0%, ASR = −2.0). Relative macrocephaly coexisted frequently with ACM (N% = 100.0%, ASR = 3.2), with PMS (N% = 100.0%, ASR = 3.2), and rarely with CP (N% = 4.9%, ASR = −2.0). Absolute macrocephaly often coexisted with sasMMC and HCP (N% = 100.0%, ASR = 3.5), with HCP (N% = 100.0%, ASR = 2.4), HMSN (N% = 100%, ASR = 2.4) with BMD (N% = 100.0%, ASR = 2.4), and rarely with CP (N% = 7.3%, ASR = −2.8) (Table 3A).
- 2.
- AHS—traditional classification (hc and HCI) and units and syndromes running with neurodysfunction (p = 0.002, Cp = 0.679). Relative microcephaly coexisted frequently with DS (N% = 100.0%, ASR = 2.1), and rarely with sasMMC and HCP (N% = 0.0%, ASR = −2.1), in children with LGMD (N% = 0.0%, ASR = −2.7). Absolute microcephaly often coexisted with CP (N% = 16.7%, ASR = 2.4). Relative macrocephaly coexisted frequently with LGMD (N% = 80.0%, ASR = 4.4), and with PMS (N% = 100.0%, ASR = 2.5). Absolute macrocephaly coexisted often in children with sasMMC and HCP (N% = 100.0%, ASR = 4.0), z HCP (N% = 100.0%, ASR = 2.3), sasMMC (N% = 100.0%, ASR = 3.2), z HMSN, BMD, DMD (N% = 100.0%, ASR = 2.3), and rarely with CP (N% = 9.7%, ASR = −2.8) (Table 3B). Cp was higher for dysmorphological classification (0.736) than the traditional method (0.679) (Table 3A,B). In this case, the dysmorphological classification better differentiated the relationship between abnormal head size and individual diseases/syndromes.
- 3.
- AHS—dysmorphological classification (hc and HCI) and subgroups based on the classification with regard to etiopathogenesis, presence and character of encephalopathy (p = 0.001, Cp = 0.590). Relative macrocephaly coexisted often with CP (N% = 75.6%, ASR = 2.5). Absolute microcephaly coexisted rarely with NTDs (N% = 0.0%, ASR = −2.9). It also rarely coexisted in the subgroup NMD (N% = 0.0%, ASR = −2.5). Relative macrocephaly coexisted less frequently with CP (N% = 4.9%, ASR = −2.0). Absolute macrocephaly frequently coexisted in subgroup with NTDs (N% = 75.0%, ASR = 3.5) and NMD (N% = 66.7%, ASR = 2.6), less frequently in subgroup with CP (N% = 7.3%, ASR = −2.8) (Table 3C).
- 4.
- AHS—traditional classification (hc and HCI) and subgroups based on classification with regard to etiopathogenesis, presence and character of encephalopathy (p = 0.001, Cp = 0.525). Relative microcephaly more frequently coexisted in subgroup with GD (N% = 90.0%, ASR = 2.1), coexisted rarely in subgroup with NTDs (N% = 22.2%, ASR = −2.3) and in subgroup with NMD (N% = 20.0%, ASR = −2.6). Absolute microcephaly frequently coexisted in group with CP, (N% = 16.7%, ASR = 2.4). Relative macrocephaly coexisted frequently in children with NTDs (N% = 66.7%, ASR = 4.2) and with NMD (N% = 40.0%, ASR = 2.1), it was rare in group with CP (N% = 9.7%, ASR = −2.8) (Table 4A). Cp was higher for the newer dysmorphological classification (0.590) than the traditional method (0.525) (Table 3C and Table 4A). In this case, the dysmorphological classification better differentiates the relationship between abnormal head size and seven subgroups based on the classification taking into account the etiopathogenesis, presence and nature of encephalopathy.
- 5.
- AHS—dysmorphological classification (hc and HCI) and subgroups based on classification with regard to presence and character of encephalopathy (p = 0.017, Cp = 0.398). Relative microcephaly was common in the NPE subgroup (N% = 70.6%, ASR = 2.5), and rare in the NMD subgroup (N% = 0.0%, ASR = −2.5). The relationship is statistically significant. Absolute macrocephaly was frequent in the NMD subgroup (N% = 66.7%, ASR = 2.6), and rare in the NPE subgroup (N% = 11.8%, ASR = −2.6) (Table 4B).
- 6.
- AHS—traditional classification (hc and HCI) and subgroups based on classification with regard to presence and character of encephalopathy (p = 0.029, Cp=0.347). Relative microcephaly coexisted rarely in the subgroup with NMD (N% = 20.0%, ASR = −2.6). Relative macrocephaly coexisted frequently in the subgroup with NMD (N% = 40.0%, ASR = 2.6), and rarely in subgroup with NPE (N% = 10.9%, ASR = −2.3). Absolute macrocephaly frequently occurs in the subgroup with NMD (N% = 40.0%, ASR = 2.1) (Table 4C). Cp value is higher for dysmorphological classification (0.398) than for traditional one (0.347) (Table 4B,C). In this case, the criterion of +/− 3s better differentiated the relationship between abnormal head size and three subgroups distinguished based on the classification taking into account the presence and character of encephalopathy.
- 7.
- AHS—dysmorphological classification (hc and HCI) and types of CP (p = 0.029, Cp = 0.425. Absolute microcephaly often coexisted with a mixed form of CP (N% = 66.7, ASR = 3.0), and rarely with its spastic type (N% = 5.3%, ASR = −3.0). Absolute macrocephaly often occurred with the spastic form of CP (N% = 7.9, ASR = 3.5), and rarely with a mixed form (N% = 0.0%, ASR = −3.5) (Table 4D).
- 8.
- AHS—traditional classification (hc and HCI) and types of CP (p = 0.016, Cp = 0.311). Absolute microcephaly often occurred with a mixed form of CP (N% = 60.0%, ASR = 2.7), and rarely with the spastic form (N% = 13.6%, ASR = −2.3). Relative macrocephaly frequently occurred with the atactic form of CP (N% = 100.0%, ASR = 2.8) (Table 4E). Pearson’s contingency coefficient was higher for the definition based on the three standard deviation criteria and amounts to 0.425, than for the definition based on the two standard deviation criteria (Cp = 0.311). The definition based on the criteria of three standard deviations better differentiated abnormal head size among the different forms of CP (Table 4D,E). The +/− 3s criterion in this case differentiates better the relationship between head size and cerebral palsy types.
- 9.
- AHS—traditional classification (hc and HCI) and epilepsy (p = 0.043, Cp = 0.271). Absolute microcephaly rarely coexisted with the absence of epilepsy (N% = 6.5%, ASR = −2.0), and frequently with epilepsy (N% = 19.5%, ASR = 2.0). Absolute macrocephaly frequently coexisted with the absence of epilepsy (N% = 22.6%, ASR = 2.0), and rarely with epilepsy itself (N% = 7.5%, ASR = −2.0) (Table 5A).
- AHS—traditional classification (hc and HCI) and kind of spastic type (p = 0.312). Relative microcephaly frequently occurred with tetraplegia (N% = 78.6%, ASR = 2.0)—Table 5B.
- AHS—traditional classification (hc and HCI) and hypothyroidism (p = 0.207). Relative microcephaly and hyperthyreosis frequently coexisted (N% = 88.9%, ASR = 2.0). Relative microcephaly and the lack of hyperthyreosis coexisted rarely (N% = 55.3%, ASR = −2.0)—Table 5C.
4. Discussion
4.1. Clinical Implications
- relative microcephaly (regardless of the adopted criteria) often coexisted with NPE, and rarely with NMD in the entire study group,
- absolute microcephaly (regardless of the adopted criteria) often coexisted with the mixed form, and less frequently with spastic in the CP subgroup,
- relative macrocephaly (regardless of the adopted criteria) often occurred in PMS in the entire study group,
- absolute macrocephaly (regardless of the adopted criteria) commonly coexisted with NTDs, sasMMC and HCP, HCP, NMD, HMSN, and BMD, rarely with CP in the whole study group,
- absolute microcephaly (traditional criteria) commonly coexisted with epilepsy in the whole study group—relative microcephaly is the most common, but it is in patients with absolute microcephaly that there is a risk of epilepsy, while relative microcephaly (traditional criteria) is associated with a prognosis for a more severe level of disability,
- the application of both types of criteria, dysmorphological and traditional, has an important but different substantive meaning—both criteria should be used when assessing head size disturbances in children and adolescents.
4.2. Limitations
5. Conclusions
Author Contributions
Funding
Conflicts of Interest
References
- Szczałuba, K.; Obersztyn, E.; Mazurczak, T. Microcephaly as a frequent symptom in clinical practice—Differential diagnosis taking into account its etiopathogenesis. Child Neurol. 2006, 30, 41–50. [Google Scholar]
- Perenc, L. Selected Problems of Auxology and Developmental Anthropometry; University of Rzeszów Press: Rzeszów, Poland, 2019; pp. 159–190. [Google Scholar]
- Perenc, L.; Radochońska, A.; Błajda, J. Changeableness of selected characteristics of the head in the Rzeszów children and adolescents aged 4 to 18 in during a 35-year period. Eur. J. Clin. Exp. Med. 2017, 3, 217–232. [Google Scholar] [CrossRef]
- Stolarczyk, H. Body structure of the inhabitants of Cyrenaica. Acta Anthropol. Lodz. 1965, 10, 5–26. [Google Scholar]
- Nowak, M. The somatic development of rural boys and girls aged 6–19 from the Podkarpackie voivodeship against the urban series. Przeg. Med. Uniw. Rzeszow 2012, 3, 288–310. [Google Scholar]
- Davies, E.; Connolly, D.J.; Mordekar, S.R. Encephalopathy in children: An approach to assessment and management. Arch. Dis. Child. 2012, 97, 452–458. [Google Scholar] [CrossRef]
- Abeyakoon, O.; Batty, R.; Mordekar, S. The encephalopathic child. Neuroradiol. J. NRJ. Digit. 2011, 1, 577–596. [Google Scholar] [CrossRef]
- Kaciński, M. Diseases of the Nervous System in Pediatrics 2; Kawalec, W., Grenda, R., Ziółkowska, H., Eds.; PZWL: Warsaw, Poland, 2012; pp. 741–787. [Google Scholar]
- Szmidt-Sałkowska, E.; Dorobek, M. New views on the pathogenesis of progressive muscular dystrophy (dmp): Dystrophinopathy, nucleopathy, hoop-limb dystrophy, and facial-scapulo-brachial dystrophy. Pol. Prz. Neurol. 2006, 2, 117–124. [Google Scholar]
- Bosanquet, M.; Copeland, L.; Ware, R.; Boyd, R. A systematic review of tests to predict cerebral palsy in young children. Dev. Med. Child Neurol. 2013, 5, 418–426. [Google Scholar] [CrossRef]
- Gulat, S.; Sondhi, V. Cerebral Palsy: An overview. Indian J. Pediatr. 2018, 85, 1006–1016. [Google Scholar] [CrossRef]
- Prasad, S.; Price, R.S.; Kranick, S.M.; Woo, J.H.; Hurst, R.W.; Galetta, S. Clinical Reasoning: A 59-year-old woman with acute paraplegia. Neurology 2007, 69, E41–E47. [Google Scholar] [CrossRef]
- Perenc, L.; Guzik, A.; Podgórska-Bednarz, J.; Drużbicki, M. Growth disorders in children and adolescent affected by syndromes or diseases associated with neurodysfunction. Sci. Rep. 2019, 9, 16436. [Google Scholar] [CrossRef] [PubMed]
- Perenc, L.; Radochońska, A.; Błajda, J. Somatic growth in children and adolescents from Rzeszów, aged 4–18, and its variability over the thirty-five year period from 1978/79 to 2013/14. Med. Rev. 2016, 3, 244–265. [Google Scholar] [CrossRef]
- Perenc, L.; Kwolek, A. Studies on the co-occurrence of meningomyelocele and other developmental anomalies of cerebrum and skull. Med. Rev. 2005, 1, 23–25. [Google Scholar]
- Copp, A.J.; Adzick, N.S.; Chitty, L.S.; Fletcher, J.M.; Holmbeck, G.N.; Shaw, G.M. Spina bifida. Nat. Rev. Dis. Primers 2015, 1, 15007. [Google Scholar] [CrossRef]
- Kahle, K.T.; Kulkarni, V.A.; Limbrick, D.D., Jr.; Warf, B.C. Hydrocephalus in children. Lancet 2016, 387, 788–799. [Google Scholar] [CrossRef]
- Perenc, L. Evaluation of somatic development of children operated because of meningomyelocele in virtue of the frequency analysis of occurrence of anthropometric measures in intervals of the mean and pathological values. Przeg. Med. Uniw. Rzeszow 2005, 2, 125–139. [Google Scholar]
- Pasternak-Pietrzak, K.; Kądziela, K.; Pyrżak, B. Diagnostic difficulties in a girl with short stature. Pediatr. Dypl. 2017, 21, 27–33. [Google Scholar]
- Perliczko, E.; Horodnicka-Józwa, A.; Walczak, M. Preliminary tests before diagnosing growth hormone deficiency (exclusion criteria). Endokrynol. Pediatr. 2009, 9, 14–22. [Google Scholar]
- Gajewska, E. The new definitions and functional scales used in children with cerebral palsy. Child Neurol. 2009, 18, 69–72. [Google Scholar]
- Taczała, J.; Wolińska, O.; Becher, J.; Majcher, P. An interdisciplinary model of treatment of children with cerebral palsy in Poland recommendations of the paediatric rehabilitation section of the Polish Rehabilitation Society. Ortop. Traumatol. Rehabil. 2020, 22, 51–59. [Google Scholar] [CrossRef]
- Perenc, L.; Przysada, G.; Trzeciak, J. Cerebral palsy in children as a risk factor for malnutrition. Ann. Nutr. Metab. 2015, 4, 224–232. [Google Scholar] [CrossRef] [PubMed]
- National Health Fund. Detailed Message from the National Health Fund: Outpatient and Inpatient Services (Phase I); Annex to the Decree No. 14/2013/DSOZ of the President of the National Health Fund of March 21; National Health Fund: Warsaw, Poland, 2013; p. 28. [Google Scholar]
- National Health Fund. Detailed Message from the National Health Fund: Outpatient and Inpatient Services (Phase I); Annex to the Decree No. 63/2018/DI of the President of the National Health Fund of June 29; National Health Fund: Warsaw, Poland, 2018; p. 32. [Google Scholar]
- Perenc, L.; Zajkiewicz, K.; Drzał-Grabiec, J.; Majewska, J.; Cyran-Grzebyk, B.; Walicka-Cupryś, K. Assessment of body adiposity in preterm children at the beginning of school age. Sci. Rep. 2019, 9, 6207. [Google Scholar] [CrossRef] [PubMed]
- Persutte, W.H. Microcephaly—No small deal. Ultrasound Obstet. Gynecol. 1998, 11, 317–318. [Google Scholar] [CrossRef] [PubMed]
- Nawathe, A.; Doherty, J.; Pandya, P. Fetal microcephaly. BMJ 2018, 361, k2232. [Google Scholar] [CrossRef]
- von der Hagen, M.; Pivarcsi, M.; Liebe, J. Diagnostic approach to microcephaly in childhood: A two-center study and review of the literature. Dev. Med. Child Neurol. 2014, 56, 732–741. [Google Scholar] [CrossRef]
- Pirozzi, F.; Nelson, B.; Mirza, G. From microcephaly to megalencephaly: Determinants of brain size. Dialogues Clin. Neurosci. 2018, 20, 267–282. [Google Scholar] [CrossRef]
- Leshinsky-Silver, E.; Ling, J.; Wu, J.; Vinkler, C.; Yosovich, K.; Bahar, S.; Yanoov-Sharav, M.; Lerman-Sagie, T.; Lev, D. Severe growth deficiency, microcephaly, intellectual disability, and characteristic facial features are due to a homozygous QARS mutation. Neurogenetics 2017, 18, 141–146. [Google Scholar] [CrossRef]
- Peippo, M.; Ignatius, J. Pitt-Hopkins Syndrome. Mol. Syndromol. 2012, 2, 171–180.
- Kline, A.D.; Moss, J.F.; Selicorni, A.; Bisgaard, A.-M.; Deardorff, M.A.; Gillett, P.M.; Ishman, S.L.; Kerr, L.M.; Levin, A.V.; Mulder, P.A.; et al. Diagnosis and management of Cornelia de Lange syndrome: First international consensus statement. Nat. Rev. Genet. 2018, 19, 649–666. [Google Scholar] [CrossRef]
- Dowsett, L.; Porras, A.R.; Kruszka, P.; Davis, B.; Hu, T.; Honey, E.; Badoe, E.; Thong, M.-K.; Leon, E.; Girisha, K.M.; et al. Cornelia de Lange syndrome in diverse populations. Am. J. Med. Genet. A 2019, 179, 150–158. [Google Scholar] [CrossRef]
- Yigit, G.; Brown, K.E.; Kayserili, H.; Pohl, E.; Caliebe, A.; Zahnleiter, D.; Rosser, E.; Bögershausen, N.; Uyguner, Z.O.; Altunoglu, U.; et al. Mutations in CDK5RAP2 cause Sickle syndrome. Mol. Genet. Genom. Med. 2015, 3, 467–480. [Google Scholar] [CrossRef] [PubMed]
- López, M.; García-Oguiza, A.; Armstrong, J.; García-Cobaleda, I.; García-Miñaur, S.; Santos-Simarro, F.; Seidel, V.; Domínguez-Garrido, E. Rubinstein-Taybi 2 associated to novel EP300 mutations: Deepening the clinical and genetic spectrum. BMC Med. Genet. 2018, 19, 36. [Google Scholar] [CrossRef] [PubMed]
- Kim, O.-H.; Cho, H.-J.; Han, E.; Hong, T.I.; Ariyasiri, K.; Choi, J.-H.; Hwang, K.-S.; Jeong, Y.-M.; Yang, S.-Y.; Yu, K.; et al. Zebrafish knockout of Down syndrome gene, DYRK1A, shows social impairments relevant to autism. Mol. Autism 2017, 8, 50. [Google Scholar] [CrossRef] [PubMed]
- Mazurek, D.; Wyka, J. Down syndrome-genetic and nutritional aspects of accompanying disorders. Rocz. Panstw. Zakl. Hig. 2015, 66, 189–194. [Google Scholar]
- Cereda, A.; Carey, J.C. The trisomy 18 syndrome. Orphanet J. Rare Dis. 2012, 7, 81. [Google Scholar] [CrossRef]
- Cerruti Mainardi, P. Cri du Chat syndrome. Orphanet J. Rare Dis. 2006, 1, 33. [Google Scholar] [CrossRef]
- Emanuel, B.S.; Zackai, E.H.; Medne, L. Emanuel Syndrome. In Gene Reviews®; Adam, M.P., Ardinger, H.H., Pagon, R.A., Wallace, S.E., Bean, L.J.H., Stephens, K., Amemiya, A., Eds.; University of Washington: Seattle, DC, USA, 2007. [Google Scholar]
- Shimojima, K.; Narai, S.; Togawa, M.; Doumoto, T.; Sangu, N.; Vanakker, O.M.; de Paepe, A.; Edwards, M.; Whitehall, J.; Brescianini, S.; et al. 7p22.1 microdeletions involving ACTB associated with developmental delay, short stature, and microcephaly. Eur. J. Med. Genet. 2016, 59, 502–506. [Google Scholar] [CrossRef]
- Goldsmith, S.; McIntyre, S.; Hansen, M.; Badawi, N. Congenital anomalies in children with cerebral palsy: A systematic review. J. Child Neurol. 2019, 34, 720–727. [Google Scholar] [CrossRef]
- Uday, S.; Shaw, N.; Krone, R.; Kirk, J. Hypopituitarism in children with cerebral palsy. Arch. Dis. Child. 2017, 102, 559–561. [Google Scholar] [CrossRef]
- Braga, L.W.; Borigato, E.V.M.; Speck-Martins, C.E.; Imamura, E.U.; Gorges, A.M.P.; Izumi, A.P.; Dantas, R.C.; Nunes, L.G.N. Apolipoprotein E genotype and cerebral palsy. Dev. Med. Child Neurol. 2010, 52, 666–671. [Google Scholar] [CrossRef]
- O’Shea, T.M. Diagnosis, treatment, and prevention of cerebral palsy. Clin. Obstet. Gynecol. 2008, 51, 816–828. [Google Scholar] [CrossRef] [PubMed]
- Protzenko, T.; Bellas, A.; Pousa, M.S.; Protzenko, M.; Fontes, J.M.; de Lima Silveira, A.M.; Sá, C.A.; Pereira, J.P.; Salomão, R.M.; Salomão, J.F.M.; et al. Reviewing the prognostic factors in myelomeningocele. Neurosurg. Focus 2019, 47, E2. [Google Scholar] [CrossRef] [PubMed]
- Uysal, F.; Uysal, A. Meckel-Gruber Syndrome with unilateral renal agenesis. J. Coll. Physicians Surg. Pak. 2015, 25 (Suppl. 1), S56–S57. [Google Scholar] [PubMed]
- Chen, C.P. Chromosomal abnormalities associated with neural tube defects (I): Full aneuploidy. Taiwan J. Obstet. Gynecol. 2007, 46, 325–335. [Google Scholar] [CrossRef]
- Ruggieri, V.; Lubieniecki, F.; Meli, F.; Diaz, D.; Ferragut, E.; Saito, K.; Brockington, M.; Muntoni, F.; Fukuyama, Y.; Taratuto, A.L. Merosin-positive congenital muscular dystrophy with mental retardation, microcephaly and central nervous system abnormalities unlinked to the Fukuyama muscular dystrophy and muscular-eye-brain loci: Report of three siblings. Neuromuscul. Disord. 2001, 11, 570–578. [Google Scholar] [CrossRef]
- Phelan, K.; Rogers, R.C.; Boccuto, L. Phelan-McDermid Syndrome. In Gene Reviews®; Adam, M.P., Ardinger, H.H., Pagon, R.A., Wallace, S.E., Bean, L.J.H., Stephens, K., Amemiya, A.., Eds.; University of Washington: Seattle, DC, USA, 2005. [Google Scholar]
- Sarasua, S.M.; Boccuto, L.; Sharp, J.L.; Dwivedi, A.; Chen, C.-F.; Rollins, J.D.; Rogers, R.C.; Phelan, K.; DuPont, B.R. Clinical and genomic evaluation of 201 patients with Phelan-McDermid syndrome. Hum. Genet. 2014, 133, 847–859. [Google Scholar] [CrossRef]
- Sarasua, S.M.; Dwivedi, A.; Boccuto, L.; Rollins, J.D.; Chen, C.-F.; Rogers, R.C.; Phelan, K.; DuPont, B.R.; Collins, J.S. Association between deletion size and important phenotypes expands the genomic region of interest in Phelan-McDermid syndrome (22q13 deletion syndrome). J. Med. Genet. 2011, 48, 761–766. [Google Scholar] [CrossRef]
- Foster, A.; Zachariou, A.; Loveday, C.; Ashraf, T.; Blair, E.; Clayton-Smith, J.; Dorkins, H.; Fryer, A.; Gener, B.; Goudie, D.; et al. The phenotype of Sotos syndrome in adulthood: A review of 44 individuals. Am. J. Med. Genet. C Semin. Med. Genet. 2019, 181, 502–508. [Google Scholar] [CrossRef]
- Daish, P.; Hardman, M.J.; Lamont, M.A. Hydrocephalus, tall stature, joint laxity, and kyphoscoliosis: A new inherited disorder of connective tissue? J. Med. Genet. 1989, 26, 51–54. [Google Scholar] [CrossRef]
- Bardsley, M.Z.; Kowal, K.; Levy, C.; Gosek, A.; Ayari, N.; Tartaglia, N.; Lahlou, N.; Winder, B.; Grimes, S.; Ross, J.L. 47,XYY syndrome: Clinical phenotype and timing of ascertainment. J. Pediatr. 2013, 163, 1085–1094. [Google Scholar] [CrossRef]
- Douzgou, S.; Liang, H.W.; Metcalfe, K.; Somarathi, S.; Tischkowitz, M.; Mohamed, W.; Kini, U.; McKee, S.; Yates, L.; Bertoli, M.; et al. The clinical presentation caused by truncating CHD8 variants. Clin. Genet. 2019, 96, 72–84. [Google Scholar] [CrossRef] [PubMed]
- Kamien, B.; Digilio, M.C.; Novelli, A.; O’Donnell, S.; Bain, N.; Meldrum, C.; Dudding-Byth, T.; Scott, R.J.; Goel, H. Narrowing the critical region for overgrowth within 13q14.2-q14.3 microdeletions. Eur. J. Med. Genet. 2015, 58, 629–633. [Google Scholar] [CrossRef] [PubMed]
- Stellacci, E.; Steindl, K.; Joset, P.; Mercurio, L.; Anselmi, M.; Cecchetti, S.; Gogoll, L.; Zweier, M.; Hackenberg, A.; Bocchinfuso, G.; et al. Clinical and functional characterization of two novel ZBTB20 mutations causing Primrose syndrome. Hum. Mutat. 2018, 39, 959–964. [Google Scholar] [CrossRef] [PubMed]
- Priolo, M.; Schanze, D.; Tatton-Brown, K.; Mulder, P.A.; Tenorio, J.; Kooblall, K.; Acero, I.H.; Alkuraya, F.S.; Arias, P.; Bernardini, L.; et al. Further delineation of Malan syndrome. Hum. Mutat. 2018, 39, 1226–1237. [Google Scholar] [CrossRef]
- Tully, H.M.; Dobyns, W.B. Infantile hydrocephalus: A review of epidemiology, classification and causes. Eur. J. Med. Genet. 2014, 57, 359–368. [Google Scholar] [CrossRef]
- Rotenstein, D.; Reigel, D.H.; Flom, L.L. Growth hormone treatment accelerates growth of short children with neural tube defects. J. Pediatr. 1989, 115, 417–420. [Google Scholar] [CrossRef]
- Verma, S.; Goyal, P.; Guglani, L.; Peinhardt, C.; Pelzek, D.; Barkhaus, P.E. COL6A and LAMA2 mutation congenital muscular dystrophy: A clinical and electrophysiological study. J. Clin. Neuromuscul. Dis. 2018, 19, 108–116. [Google Scholar] [CrossRef]
- Bansagi, B.; Phan, V.; Baker, M.R.; O’Sullivan, J.; Jennings, M.J.; Whittaker, R.G.; Müller, J.S.; Duff, J.; Griffin, H.; Miller, J.A.L.; et al. Multifocal demyelinating motor neuropathy and hamartoma syndrome associated with a de novo PTEN mutation. Neurology 2018, 90, 1842–1848. [Google Scholar] [CrossRef]
- Gilard, V.; Chadie, A.; Ferracci, F.-X.; Brasseur-Daudruy, M.; Proust, F.; Marret, S.; Curey, S. Post hemorrhagic hydrocephalus and neurodevelopmental outcomes in a context of neonatal intraventricular hemorrhage: An institutional experience in 122 preterm children. BMC Pediatr. 2018, 18, 288. [Google Scholar] [CrossRef]
- Dorner, R.A.; Allen, M.C.; Robinson, S.; Soares, B.P.; Perin, J.; Ramos, E.; Gerner, G.; Burton, V.J. Early neurodevelopmental outcome in preterm posthemorrhagic ventricular dilatation and hydrocephalus: Neonatal ICU Network Neurobehavioral Scale and imaging predict 3–6-month motor quotients and Capute Scales. J. Neurosurg. Pediatr. 2019, 1–11. [Google Scholar] [CrossRef]
- Karatoprak, E.; Sözen, G.; Saltık, S. Risk factors associated with epilepsy development in children with cerebral palsy. Childs Nerv. Syst. 2019, 35, 1181–1187. [Google Scholar] [CrossRef] [PubMed]
- Karwowska, R. Hypothyroidism in children. Pediatr. Med. Rodz. 2017, 13, 479–490. [Google Scholar] [CrossRef]
- O’Shea, T.M. Cerebral palsy in very preterm infants: New epidemiological insights. Ment. Retard. Dev. Disabil. Res. Rev. 2002, 8, 135–145. [Google Scholar] [CrossRef] [PubMed]
- Harris, S.R. Measuring head circumference: Update on infant microcephaly. Can. Fam. Physician. 2015, 61, 680–684. [Google Scholar] [PubMed]
- Arroyo, H.A. Microcefalia [Microcephaly]. Medicina 2018, 78, 94–100. [Google Scholar] [PubMed]


| A. Study Group—Recognition, Division into Subgroups, Abbreviation | |||||||||||
|---|---|---|---|---|---|---|---|---|---|---|---|
| Units and Syndromes Running with Neurodysfunction (Main Recognition) | Classification with Regard to Etiopathogenesis, Presence and Character Encephalopathy | Classification with Regard to Presence and Character Encephalopathy | |||||||||
| N | N% | N | N% | N | N% | ||||||
| NBIA-MPAN, Neurodegeneration with Brain Iron Accumulation—Mitochondrial Protein Associated Neurodegeneration | 2 | 0.6 | MD, encephalopathy in metabolic disorder | 7 | 2.1 | PE, progressive encephalopathy | 8 | 2.4 | |||
| GSD II, Pompe’s disease | 1 | 0.3 | |||||||||
| LCHAD, long-chain 3-hydroxyacyl-coenzyme A dehydrogenase deficiency | 1 | 0.3 | |||||||||
| SLO, Smith-Lemli-Opitz syndrome | 1 | 0.3 | |||||||||
| GLUT1d, glucose transporter 1 deficiency | 1 | 0.3 | |||||||||
| NKH, nonketotic hyperglycinemia | 1 | 0.3 | |||||||||
| SMEI, Dravet’s syndrome | 1 | 0.3 | EE, epileptic encephalopathy | 1 | 0.3 | ||||||
| sasMMC and HCP, state after surgery lumbar myelomeningocele and hydrocephalus | 17 | 5.2 | NTDs, encephalopathy in neural tube defects | 24 | 7.3 | NPE, non progressive encephalopathy | 287 | 88.1 | |||
| sasMMC, state after surgery lumbar myelomeningocele | 3 | 0.9 | |||||||||
| sasMM, state after surgery parietooocipital menigocele | 1 | 0.3 | |||||||||
| ACM, Arnold-Chiari malformation | 2 | 0.6 | |||||||||
| HCP, isolated hydrocephalus | 1 | 0.3 | |||||||||
| DS, Down syndrome | 11 | 3.4 | GD, encephalopathy in genetic disorders | 23 | 7.0 | ||||||
| ES, Edwards syndrome | 1 | 0.3 | |||||||||
| PMS, Phelan-McDermid syndrome | 2 | 0.6 | |||||||||
| MWS, Mowat-Wilson syndrome | 1 | 0.3 | |||||||||
| AS, Angelman syndrome | 1 | 0.3 | |||||||||
| DGS, Di George syndrome | 1 | 0.3 | |||||||||
| 46,XY,del(X)(q24) | 1 | 0.3 | |||||||||
| CdLS, Cornelia de Lange syndrome | 1 | 0.3 | |||||||||
| SDS, Schwachman-Diamond syndrome | 1 | 0.3 | |||||||||
| PWS, Prader-Willi syndrome | 1 | 0.3 | |||||||||
| 46 XX, add(2)(q25) | 1 | 0.3 | |||||||||
| 46XX, del (12) (q24.21q24.23) | 1 | 0.3 | |||||||||
| FAS, fetal alcohol syndrome | 1 | 0.3 | TE, toxic encephalopathy | 1 | 0.3 | ||||||
| CP, cerebral palsy | 239 | 73.1 | CP encephalopathy in cerebral palsy | 239 | 73.1 | ||||||
| HMSN, hereditary motor and sensory polyneuropathy | 8 | 2.4 | NMD, neuromuscular disorders | 32 | 9.8 | NMD, neuromuscular disorders | 32 | 9.8 | |||
| LGMD, muscular dystrophy limb-girdle | 7 | 2.1 | |||||||||
| BMD, Becker’s muscular dystrophy | 3 | 0.9 | |||||||||
| DMD, Duchenne muscular dystrophy | 7 | 2.1 | |||||||||
| TD, Thomsen disease | 1 | 0.3 | |||||||||
| AMC&N arthrogryposis multiplet congenita with neuropathy | 3 | 0.9 | |||||||||
| CM, congenital myopathy | 1 | 0.3 | |||||||||
| SMA, spinal muscular atrophy | 2 | 0.6 | |||||||||
| In total | 327 | 100 | In total | 327 | 100 | In total | 327 | 100 | |||
| B. The Level of GMFC—The Greater the Number of Points, The Greater the Level of Motor Disability | |||||||||||
| GMFCS I-V | I | II | III | IV | V | ||||||
| Number of points assigned | 1 | 2 | 3 | 4 | 5 | ||||||
| GMFCS A-C | A | B | C | ||||||||
| Number of points assigned | 1 | 2 | 3 | ||||||||
| C. The Statistical Characteristics of the GMFCS Score in the Entire Study Group | |||||||||||
| Parameters | N | Me | s | c25 | c75 | Min | Max | ||||
| GMFCS I-V | 327 | 2.47 | 2 | 1.29 | 2 | 3 | 1 | 5 | |||
| GMFCS A-C | 1.60 | 1 | 0.86 | 1 | 2 | 1 | 3 | ||||
| D. The Statistical Characteristics of the GMFCS Score in the Subgroup with CP | |||||||||||
| Parameters | N | Me | s | c25 | c75 | Min | Max | ||||
| GMFCS I-V | 239 | 2.48 | 2 | 1.33 | 1 | 3.5 | 1 | 5 | |||
| GMFCS A-C | 1.62 | 1 | 0.86 | 1 | 2.5 | 1 | 3 | ||||
| A. Statistical Characteristics of Indicators: z-Score hc, z-Score h, z-Score HCI | |||||||||
|---|---|---|---|---|---|---|---|---|---|
| Parameters | N | Me | s | c25 | c75 | Min | Max | ||
| hc | 327 | 51.89 | 52 | 3.60 | 50 | 54.75 | 42.1 | 63.3 | |
| h | 130.78 | 126 | 24.32 | 110 | 150.50 | 83.9 | 191.2 | ||
| hc/h | 0.41 | 0.40 | 0.06 | 0.36 | 0.46 | 0.29 | 0.61 | ||
| z-score hc | −0.53 | −0.54 | 2.14 | −1.71 | 0.86 | −7.36 | 8.29 | ||
| z-score h | −1.23 | −1.16 | 1.98 | −2.33 | −0.05 | −8.93 | 4.20 | ||
| z-score hc/h | 0.90 | 0.85 | 2.04 | −0.44 | 2.20 | −4.38 | 11.29 | ||
| arithmetic mean (), median (Me), standard deviation (s), smallest (Min) and largest value (Max), 25th centile (c25) and 75th (c75) | |||||||||
| B. The Size of the Head: Dysmorphology and Traditional Classification (hc) | |||||||||
| The Size of the Head | Dysmorphology Classification (hc) | Traditional Classification (hc) | |||||||
| Normal | −3 ≥ z-score hc ≤ 3 | −2 ≥ z-score hc ≤ 2 | |||||||
| Microcephaly | z-score hc < −3 | z-score hc < −2 | |||||||
| Macrocephaly | z-score hc > 3 | z-score hc > 2 | |||||||
| C. The Abnormal Size of the Head: Dysmorphology and Traditional Classification (hc and HCI) | |||||||||
| The Abnormal Size of the Head | Dysmorphology Classification (hc and HCI) | Traditional Classification (hc and HCI) | |||||||
| hc | HCI | hc | HCI | ||||||
| Relative microcephaly | z-score hc<−3 | z-score HCI ≠ (<−3) | z-score hc <−2 | z-score HCI ≠ (<−2) | |||||
| Absolute microcephaly | z-score HCI < −3 | z-score HCI<−2 | |||||||
| Relative macrocephaly | z-score hc>3 | z-score HCI ≠ (> 3) | z-score hc > 2 | z-score HCI ≠ (>2) | |||||
| Absolute macrocephaly | z-score HCI > 3 | z-score HCI > 2 | |||||||
| D. The Incidence of Abnormal Head Size Defined Based on Dysmorphology Classification (hc and HCI) | |||||||||
| The Size of the Head—Dysmorphology Classification (hc) | The Abnormal Size of the Head—Dysmorphology Classification (hc and HCI) | ||||||||
| Normal | 273 | 83.5 | Normal | 273 | 83.5 | 83.5 | |||
| Abnormal | 54 | 16.5 | Microcephaly | 41 | 12.5 | 11.0 | Relative microcephaly | 36 | 66.7 |
| 1.5 | Absolute microcephaly | 5 | 9.3 | ||||||
| Macrocephaly | 13 | 4 | 1.5 | Relative macrocephaly | 5 | 9.3 | |||
| 2.5 | Absolute macrocephaly | 8 | 14.8 | ||||||
| In total | 327 | 100.0 | In total | 327 | 100.0 | 100.0 | In total | 54 | 100.0 |
| N | N% | N | N% | N% | N | N% | |||
| E. The Incidence of Abnormal Head Size Defined based on Traditional Classification (hc and HCI) | |||||||||
| The Size of the Head—Traditional Classification (hc) | The Abnormal Size of the Head—Traditional Classification (hc and HCI) | ||||||||
| Normal | 224 | 68.5 | Normal | 224 | 68.5 | 68.5 | |||
| Abnormal | 103 | 31.5 | Microcephaly | 72 | 22.0 | 18.3 | Relative microcephaly | 60 | 58.3 |
| 3.7 | Absolute microcephaly | 12 | 11.7 | ||||||
| Macrocephaly | 31 | 9.5 | 4.3 | Relative macrocephaly | 14 | 13.6 | |||
| 5.2 | Absolute macrocephaly | 17 | 16.5 | ||||||
| In total | 327 | 100.0 | In total | 327 | 100.0 | 100.0 | In total | 103 | 100.0 |
| N | N% | N | N% | N% | N | N% | |||
| F. Normal Head Size, Microcephaly, Macrocephaly and z-score HCI | |||||||||
| Nominal Regression | Quantitative dependent variable z-score HCI | Quantitative dependent variable z-score HCI | Nominal Regression | ||||||
| Qualitative dependent variable The size of the head, dysmorphology classification (hc) | Normal 273(83.5%) | Normal 224 (68.5%) | Qualitative dependent variable The size of the head, traditional classification (hc) | ||||||
| Microcephaly 41(12.5%) | 0.001 | p | 0.028 | Microcephaly 72 (22.0%) | |||||
| 0.743 (0.620–0.890) | OR | 0.854 (0.742–0.983) | |||||||
| Macrocephaly 13(4.0%) | 0.004 | p | 0.006 | Macrocephaly 31 (9.5%) | |||||
| 1.446 (1.124–1.860) | OR | 1.291 (1.076–1.548) | |||||||
| Units and Syndromes Running with Neurodysfunction | A. The Abnormal Size of the Head—Dysmorphology Classification (hc and HCI) by z-Score hc and HCI (p < 0.001; Cp = 0.736) | ||||||||
|---|---|---|---|---|---|---|---|---|---|
| Relative Microcephaly | Absolute Microcephaly | Relative Macrocephaly | Absolute Macrocephaly | In Total | |||||
| N (N%) | ASR | N (N%) | ASR | N (N%) | ASR | N (N%) | ASR | ||
| sasMMC and HCP | 0 (0.0%) | −2.0 | 0 (0.0%) | −0.5 | 0 (0.0%) | −0.5 | 2 (100.0%) | 3.5 | 2 (100.0%) |
| ACM | 0 (0.0%) | −1.4 | 0 (0.0%) | −0.3 | 1 (100.0%) | 3.2 | 0 (0.0%) | −0.4 | 1 (100.0%) |
| HCP | 0 (0.0%) | −1.4 | 0 (0.0%) | −0.3 | 0 (0.0%) | −0.3 | 1 (100.0%) | 2.4 | 1 (100.0%) |
| DS | 3 (100.0%) | 1.3 | 0 (0.0%) | −0.6 | 0 (0.0%) | −0.6 | 0 (0.0%) | −0.7 | 3 (100.0%) |
| ES | 1 (100.0%) | 0.7 | 0 (0.0%) | −0.3 | 0 (0.0%) | −0.3 | 0 (0.0%) | −0.4 | 1 (100.0%) |
| PMS | 0 (0.0%) | −1.4 | 0 (0.0%) | −0.5 | 1 (100.0%) | 3.2 | 0 (0.0%) | −0.4 | 1 (100.0%) |
| DGS | 1 (100.0%) | 0.7 | 0 (0.0%) | −0.3 | 0 (0.0%) | −0.3 | 0 (0.0%) | −0.4 | 1 (100.0%) |
| CP | 31 (75.6%) | 2.5 | 5 (12.2%) | 1.3 | 2 (4.9%) | −2.0 | 3 (7.3%) | −2.8 | 41 (100.0%) |
| HMSN | 0 (0.0%) | −1.4 | 0 (0.0%) | −0.3 | 0 (0.0%) | −0.3 | 1 (100.0%) | 2.4 | 1 (100.0%) |
| BMD | 0 (0.0%) | −1.4 | 0 (0.0%) | −0.3 | 0 (0.0%) | −0.3 | 1 (100.0%) | 2.4 | 1 (100.0%) |
| DMD | 0 (0.0%) | −1.4 | 0 (0.0%) | −0.3 | 1 (100.0%) | 3.2 | 0 (0.0%) | −0.4 | 1 (100.0%) |
| In total | 36 (66.7%) | 5 (9.3%) | 5 (9.3%) | 8 (14.3%) | 54 (100.0%) | ||||
| Units and Syndromes Running with Neurodysfunction | B. The Abnormal Size of the Head—Traditional Classification (hc and HCI) by z-score hc and HCI (p = 0.002; Cp = 0.679) | ||||||||
| Relative Microcephaly | Absolute Microcephaly | Relative Macrocephaly | Absolute Macrocephaly | In Total | |||||
| N(N%) | ASR | N(N%) | ASR | N(N%) | ASR | N(N%) | ASR | ||
| SLO | 1 (100.0%) | 0.9 | 0 (0.0%) | −0.4 | 0 (0.0%) | −0.4 | 0 (0.0%) | −0.4 | 1 (100.0%) |
| sasMMC and HCP | 0 (0.0%) | −2.1 | 0 (0.0%) | −0.6 | 0 (0.0%) | −0.7 | 3 (100.0%) | 4.0 | 3 (100.0%) |
| sasMMC | 0 (0.0%) | −1.7 | 0 (0.0%) | −0.5 | 0 (0.0%) | −0.6 | 2 (100.0%) | 3.2 | 2 (100.0%) |
| MM | 1 (100.0%) | 0.9 | 0 (0.0%) | −0.4 | 0 (0.0%) | −0.4 | 0 (0.0%) | −0.4 | 1 (100.0%) |
| ACM | 1 (50.0%) | −0.2 | 0 (0.0%) | −0.5 | 1 (50.0%) | 1.5 | 0 (0.0%) | −0.6 | 2 (100.0%) |
| HCP | 0 (0.0%) | −1.2 | 0 (0.0%) | −0.4 | 0 (0.0%) | −0.4 | 1 (100.0%) | 2.3 | 1 (100.0%) |
| DS | 6 (100.0%) | 2.1 | 0 (0.0%) | −0.9 | 0 (0.0%) | −1.0 | 0 (0.0%) | −1.1 | 6 (100.0%) |
| ES | 1 (100.0%) | 0.9 | 0 (0.0%) | −0.4 | 0 (0.0%) | −0.4 | 0 (0.0%) | −0.4 | 1 (100.0%) |
| PMS | 0 (0.0%) | −1.2 | 0 (0.0%) | −0.4 | 1 (100.0%) | 2.5 | 0 (0.0%) | −0.4 | 1 (100.0%) |
| AS | 1 (100.0%) | 0.9 | 0 (0.0%) | −0.4 | 0 (0.0%) | −0.4 | 0 (0.0%) | −0.4 | 1 (100.0%) |
| DGS | 1 (100.0%) | 0.9 | 0 (0.0%) | −0.4 | 0 (0.0%) | −0.4 | 0 (0.0%) | −0.4 | 1 (100.0%) |
| FAS | 1 (100.0%) | 0.9 | 0 (0.0%) | −0.4 | 0 (0.0%) | −0.4 | 0 (0.0%) | −0.4 | 1 (100.0%) |
| CP | 45 (62.5%) | 1.3 | 12 (16.7%) | 2.4 | 8 (11.1%) | −1.1 | 7 (9.7%) | −2.8 | 72 (100.0%) |
| HMSN | 0(0.0%) | −1.2 | 0 (0.0%) | −0.4 | 0 (0.0%) | −0.4 | 1 (100.0%) | 2.3 | 1 (100.0%) |
| LGMD | 0 (0.0%) | −2.7 | 0 (0.0%) | −0.8 | 4 (80.0%) | 4.4 | 1 (20.0%) | 0.2 | 5 (100.0%) |
| BMD | 0 (0.0%) | −1.2 | 0 (0.0%) | −0.4 | 0 (0.0%) | −0.4 | 1 (100.0%) | 2.3 | 1 (100.0%) |
| DMD | 0 (0.0%) | −1.2 | 0 (0.0%) | −0.4 | 0 (0.0%) | −0.4 | 1 (100.0%) | 2.3 | 1 (100.0%) |
| AMC and N | 1 (100.0%) | 0.9 | 0 (0.0%) | −0.4 | 0 (0.0%) | −0.4 | 0 (0.0%) | −0.4 | 1 (100.0%) |
| SMA | 1 (100.0%) | 0.9 | 0 (0.0%) | −0.4 | 0 (0.0%) | −0.4 | 0 (0.0%) | −0.4 | 1 (100.0%) |
| In total | 60 (58.3%) | 12 (11.7%) | 14 (13.6%) | 17 (16.5%) | 103 (100.0%) | ||||
| Classification with Regard to Etiopathogenesis, Presence and Character Encephalopathy | C. The Abnormal Size of the Head—Dysmorphology Classification (hc and HCI by z-score hc and HCI (p = 0.001; Cp = 0.590) | ||||||||
| Relative Microcephaly | Absolute Microcephaly | Relative Macrocephaly | Absolute Macrocephaly | In Total | |||||
| N(N%) | ASR | N(N%) | ASR | N(N%) | ASR | N(N%) | ASR | ||
| NTDs | 0 (0.0%) | −2.9 | 0 (0.0%) | −0.7 | 1 (25.0%) | 1.1 | 3 (75.0%) | 3.5 | 4 (100.0%) |
| GD | 5 (83.3%) | 0.9 | 0 (0.0%) | −0.8 | 1 (16.7%) | 0.7 | 0 (0.0%) | -1.1 | 6 (100.0%) |
| CP | 31 (75.6%) | 2.5 | 5 (12.2%) | 1.3 | 2 (4.9%) | −2.0 | 3 (7.3%) | −2.8 | 41 (100.0%) |
| NMD | 0 (0.0%) | −2.5 | 0 (0.0%) | −0.6 | 1 (33.3%) | 1.5 | 2 (66.7%) | 2.6 | 3 (100.0%) |
| In total | 36 (66.7%) | 5 (9.3%) | 5 (9.3%) | 8 (14.3%) | 54 (100.0%) | ||||
| Classification with Regard to Etiopathogenesis, Presence and Character Encephalopathy | A. The Abnormal Size of the Head—Traditional Classification (hc and HCI) by z-Score hc and HCI (p = 0.001; Cp = 0.525) | ||||||||
|---|---|---|---|---|---|---|---|---|---|
| Relative Microcephaly | Absolute Microcephaly | Relative Macrocephaly | Absolute Macrocephaly | In Total | |||||
| N (N%) | ASR | N (N%) | ASR | N (N%) | ASR | N (N%) | ASR | ||
| MD | 1 (100.0%) | 0.9 | 0 (0.0%) | −0.4 | 0 (0.0%) | −0.4 | 0 (0.0%) | −0.4 | 1 (100.0%) |
| NTDs | 2 (22.2%) | −2.3 | 0 (0.0%) | −1.1 | 1 (11.1%) | −0.2 | 6 (66.7%) | 4.2 | 9 (100.0%) |
| GD | 9 (90.0%) | 2.1 | 0 (0.0%) | −1.2 | 1 (10.0%) | −0.3 | 0 (0.0%) | −1.5 | 10 (100.0%) |
| TE | 1 (100.0%) | 0.9 | 0 (0.0%) | −0.4 | 0 (0.0%) | −0.4 | 0 (0.0%) | −0.4 | 1 (100.0%) |
| CP | 45 (62.5%) | 1.3 | 12 (16.7%) | 2.4 | 8 (11.1%) | −1.1 | 7 (9.7%) | −2.8 | 72 (100.0%) |
| NMD | 2 (20.0%) | −2.6 | 0 (0.0%) | −1.2 | 4 (40.0%) | 2.6 | 4 (40.0%) | 2.1 | 10 (100.0%) |
| In total | 60 (58.3%) | 12 (11.7%) | 14 (13.6%) | 17 (16.5%) | 103 (100.0%) | ||||
| Classification with Regard to Presence and Character Encephalopathy | B. The Abnormal Size of the Head—Dysmorphology Classification (hc and HCI) by z−Score hc and HCI (p = 0.001; Cp = 0.590) | ||||||||
| Relative Microcephaly | Absolute Microcephaly | Relative Macrocephaly | Absolute Macrocephaly | In Total | |||||
| N (N%) | ASR | N (N%) | ASR | N (N%) | ASR | N (N%) | ASR | ||
| NPE | 36 (70.6%) | 2.5 | 5 (9.8%) | 0.6 | 4 (7.8%) | −1.5 | 6 (11.8%) | −2.6 | 51 (100.0%) |
| NMD | 0 (0.0%) | −2.5 | 0 (0.0%) | −0.6 | 1 (33.3%) | 1.5 | 2 (66.7%) | 2.6 | 3 (100.0%) |
| In total | 36 (66.7%) | 5 (9.3%) | 5 (9.3%) | 8 (14.3%) | 54 (100.0%) | ||||
| Classification with Regard to Presence and Character Encephalopathy | C. The Abnormal Size of the head—Traditional Classification (hc and HCI) by z-Score hc and HCI (p = 0.029; Cp = 0.347) | ||||||||
| Relative Microcephaly | Absolute Microcephaly | Relative Macrocephaly | Absolute Macrocephaly | In Total | |||||
| N (N%) | ASR | N (N%) | ASR | N (N%) | ASR | N (N%) | ASR | ||
| PE | 1 (100.0%) | 0.9 | 0 (0.0%) | −0.4 | 0 (0.0%) | −0.4 | 0 (0.0%) | −0.4 | 1 (100.0%) |
| NPE | 57 (62.0%) | 2.2 | 12 (13.0%) | 1.3 | 10 (10.9%) | −2.3 | 13 (14.1%) | −1.9 | 92 (100.0%) |
| NMD | 0 (20.0%) | −2.6 | 0 (0.0%) | −1.2 | 4 (40.0%) | 2.6 | 4 (40.0%) | 2.1 | 10 (100.0%) |
| In total | 60 (58.3%) | 12 (11.7%) | 14 (13.6%) | 17 (16.5%) | 103 (100.0%) | ||||
| Types of CP | D. The Abnormal Size of the Head—Dysmorphology Classification (hc and HCI) by z-Score hc and HCI (p = 0.029; Cp = 0.425) | ||||||||
| Relative Microcephaly | Absolute Microcephaly | Relative Macrocephaly | Absolute Macrocephaly | In Total | |||||
| N (N%) | ASR | N (N%) | ASR | N (N%) | ASR | N (N%) | ASR | ||
| Spastic type | 30 (78.9%) | 1.8 | 3 (7.9%) | −3.0 | 2 (5.3%) | 0.4 | 3 (7.9%) | 3.5 | 38 (100.0%) |
| Mixed type | 1 (33.3%) | −1.8 | 2 (66.7%) | 3.0 | 0 (0.0%) | −0,4 | 0 (0.0%) | −2.8 | 3 (100.0%) |
| In total | 31 (75.6%) | 5 (12.2%) | 2 (4.9%) | 3 (7.3%) | 41 (100.0%) | ||||
| Types of CP | E. The Abnormal Size of the Head—Traditional Classification (hc and HCI) by z−Score hc and HCI (p = 0.016; Cp = 0.422) | ||||||||
| Relative Microcephaly | Absolute Microcephaly | Relative Macrocephaly | Absolute Macrocephaly | In Total | |||||
| N (N%) | ASR | N (N%) | ASR | N (N%) | ASR | N (N%) | ASR | ||
| Spastic type | 43 (65.2%) | 1.5 | 9 (13.6%) | −2.3 | 7 (10.6%) | −0.5 | 7 (10.6%) | 0.8 | 66 (100.0%) |
| Atactic type | 0 (0.0%) | −1.3 | 0 (0.0%) | −0.5 | 1 (100.0%) | 2.8 | 0 (0.0%) | −0.3 | 1 (100.0%) |
| Mixed type | 2 (40.0%) | −1.1 | 3 (60.0%) | 2.7 | 0 (0.0%) | −0.8 | 0 (0.0%) | −0.8 | 5 (100.0%) |
| In total | 45 (62.5%) | 12 (16.7%) | 8 (11.1%) | 7 (9.7%) | 72 (100.0%) | ||||
| Accompanying Recognition Epilepsy | A. The Abnormal Size of the Head—Traditional Classification (hc and HCI) by z-Score hc and HCI (p = 0.043; Cp = 0.271) | ||||||||
|---|---|---|---|---|---|---|---|---|---|
| Relative Microcephaly | Absolute Microcephaly | Relative Macrocephaly | Absolute Macrocephaly | In Total | |||||
| N (N%) | ASR | N (N%) | ASR | N (N%) | ASR | N (N%) | ASR | ||
| Present | 26 (63.4%) | 0.9 | 8 (19.5%) | 2.0 | 4 (9.8%) | −0.9 | 3 (7.3%) | −2.0 | 41 (100.0%) |
| Lack | 34 (54.8%) | −0.9 | 4 (6.5%) | −2.0 | 10 (16.1%) | 0.9 | 14 (22.6%) | 2.0 | 62 (100.0%) |
| In total | 60 (58.3%) | 12 (11.7%) | 14 (13.6%) | 17 (16.5%) | 103 (100.0%) | ||||
| Kind of Spastic Type | B. The Abnormal Size of the Head—Traditional Classification (hc and HCI) by z-Score hc and HCI (p = 0.312; Cp = 0.311) | ||||||||
| Relative Microcephaly | Absolute Microcephaly | Relative Macrocephaly | Absolute Macrocephaly | In Total | |||||
| N (N%) | ASR | N (N%) | ASR | N (N%) | ASR | N (N%) | ASR | ||
| Diplegia | 16 (57.1%) | −1.2 | 3 (10.7%) | -0.6 | 4 (14.3%) | 0.8 | 5 (17.9%) | 1.6 | 28 (100.0%) |
| Hemiplegia | 5 (50.0%) | −1.1 | 3(30.0%) | 1.6 | 1 (10.0%) | −0.1 | 1 (10.0%) | −0.1 | 10 (100.0%) |
| Tertaplegia | 22 (78.6%) | 2.0 | 3 (10.7%) | −0.6 | 2 (7.1%) | −0.8 | 1 (3.6%) | −1.6 | 28 (100.0%) |
| In total | 43 (65.2%) | 9 (13.6%) | 7 (10.6%) | 7 (10.5%) | 103 (100.0%) | ||||
| Accompanying Recognition Hypothyroidism | C. The Abnormal Size of The Head—Traditional Classification (Hc and Hci) By Z-Score Hc and Hci (p = 0.207; Cp = 0.206) | ||||||||
| Relative Microcephaly | Absolute Microcephaly | Relative Macrocephaly | Absolute Macrocephaly | In Total | |||||
| N (N%) | ASR | N (N%) | ASR | N (N%) | ASR | N (N%) | ASR | ||
| Present | 8 (88.9%) | 2.0 | 1 (11.1%) | −0.1 | 0 (0.0%) | −1.2 | 0 (0.0%) | −1.4 | 9 (100.0%) |
| Lack | 52 (55.3%) | -2.0 | 11 (11.7%) | 0.1 | 14 (14.9%) | 1.2 | 17 (18.1%) | 1.4 | 94 (100.0%) |
| In total | 60 (58.3%) | 12 (11.7%) | 14 (13.6%) | 17 (16.5%) | 103 (100.0%) | ||||
| Kind of Spastic Type | D. The Abnormal Size of the Head—Dysmorphological Classification (hc and HCI) by z-Score hc and HCI (p = 0.498; Cp = 0.352) | ||||||||
| Relative Microcephaly | Absolute Microcephaly | Relative Macrocephaly | Absolute Macrocephaly | In Total | |||||
| N (N%) | ASR | N (N%) | ASR | N (N%) | ASR | N (N%) | ASR | ||
| Diplegia | 9 (75.0%) | −0.4 | 0 (0.0%) | −1.2 | 1 (8.3%) | 0.6 | 2 (16.7%) | 1.4 | 12 (100.0%) |
| Hemiplegia | 6 (75.0%) | −0.3 | 1 (12.5%) | 0.5 | 1 (12.5%) | 1.0 | 0 (0.0%) | −0.9 | 8 (100.0%) |
| Tertaplegia | 15 (83.3%) | 0.6 | 2 (11.1%) | 0.7 | 0 (0.0%) | −1.4 | 1 (5.6%) | −0.5 | 18 (100.0%) |
| In total | 30 (78.9%) | 3 (7.9%) | 2 (5.3%) | 3 (7.9%) | 38 (100.0%) | ||||
| Accompanying Recognition Epilepsy | E. The Abnormal Size of the Head—Dysmorphological Classification (hc and HCI) by z-Score hc and HCI (p = 0.416; Cp = 0.224) | ||||||||
| Relative Microcephaly | Absolute Microcephaly | Relative Macrocephaly | Absolute Macrocephaly | In Total | |||||
| N (N%) | ASR | N (N%) | ASR | N (N%) | ASR | N (N%) | ASR | ||
| Present | 20 (74.1%) | 1.2 | 3 (11.1%) | 0.5 | 2 (7.4%) | −0.5 | 2 (7.4%) | −1.5 | 27 (100.0%) |
| Lack | 16 (59.3%) | −1.2 | 2 (7.4%) | −0.5 | 3 (11.1%) | 0.5 | 6 (22.2%) | 1.5 | 27 (100.0%) |
| In total | 36 (66.7%) | 5 (9.3%) | 5 (9.3%) | 8 (14.3%) | 54 (100.0%) | ||||
| Accompanying recognition Hypothyroidism | F. The Abnormal Size of the Head—Dysmorphological Classification (hc and HCI) by z-Score hc and HCI (p = 0.431; Cp = 0.220) | ||||||||
| Relative microcephaly | Absolute Microcephaly | Relative macrocephaly | Absolute macrocephaly | In total | |||||
| N (N%) | ASR | N (N%) | ASR | N (N%) | ASR | N (N%) | ASR | ||
| Present | 5 (100.0%) | 1.7 | 0 (0.0%) | −0.7 | 0 (0.0%) | −0.7 | 0 (0.0%) | −1.0 | 5 (100.0%) |
| Lack | 31 (63.3%) | −1.7 | 5 (10.2%) | 0.7 | 5 (10.2%) | 0.7 | 8 (16.3%) | 1.0 | 49 (100.0%) |
| In total | 36 (66.7%) | 5 (9.3%) | 5 (9.3%) | 8 (14.3%) | 54(100.0%) | ||||
| A. Dependence Between Absolute Value of Anthropometric Characteristics and Level of GMFCS in the Entire Study Group | |||||||||
|---|---|---|---|---|---|---|---|---|---|
| Variable Pairs | R | p | Variable pairs | R | p | ||||
| hc [cm] vs. GMFCS I–V | −0.28 | 0.000 | HCI [cm/cm] vs. GMFCS I-V | −0.22 | 0.000 | ||||
| hc [cm] vs. GMFCS A–C | −0.17 | 0.002 | HCI [cm/cm] vs. GMFCS A−C | −0.11 | 0.039 | ||||
| Spearman’s rank correlation, p—probability value, R—Spearman’s rank correlation coefficient | |||||||||
| B. The Abnormal Size of the Head—Dysmorphological Classification (hc and HCI) and Level of GMFCS I–V in the Entire Study Group | |||||||||
| p = 0.057 Cp = 0.53 | Relative Microcephaly N (N%) ASR | Absolute Microcephaly N (N%) ASR | Relative macrocephaly N (N%) ASR | Absolute macrocephaly N (N%) ASR | In Total | ||||
| GMFCS I | 3 (42.9%) | −1.4 | 0 (0.0%) | −0.9 | 1 (14.3%) | 0.5 | 3 (42.9%) | 2.2 | 7 (100.0%) |
| GMFCS II | 11 (61.1%) | −0.6 | 2 (11.1%) | 0.3 | 3 (16.7%) | 1.3 | 2 (11.1%) | −0.5 | 18 (100.0%) |
| GMFCS III | 6 (100.0%) | 1.8 | 0 (0.0%) | −0.8 | 0 (0.0%) | −0.8 | 0 (0.0%) | −1.1 | 6 (100.0%) |
| GMFCS IV | 3 (42.9%) | −1.4 | 0 (0.0%) | −0.9 | 1 (14.3%) | 0.5 | 3 (42.9%) | 2.2 | 7 (100.0%) |
| GMFCS V | 13 (81.2%) | 1.5 | 3 (18.8%) | 1.6 | 0 (0.0%) | −1.5 | 0 (0.0%) | −2 | 16 (100.0%) |
| In total | 36 (66.7%) | 5 (9.3%) | 5 (9.3%) | 8 (14.8%) | 54 (100.0%) | ||||
| C. The Abnormal Size of the Head—Traditional Classification (hc and HCI) and Level of GMFCS I–V in the Entire Study Group | |||||||||
| p = 0.055 Cp = 0.41 | Relative Microcephaly N (N%) ASR | Absolute Microcephaly N (N%) ASR | Relative Macrocephaly N (N%) ASR | Absolute Macrocephaly N (N%) ASR | In Total | ||||
| GMFCS I | 10 (45.5%) | −1.4 | 1 (4.5%) | −1.2 | 5 (22.7%) | 1.4 | 6 (27.3%) | 1.5 | 22 (100.0%) |
| GMFCS II | 18 (50.0%) | −1.2 | 4 (11.1%) | −0.1 | 8 (22.2%) | 1.9 | 6 (16.7%) | 0 | 36 (100.0) |
| GMFCS III | 6 (85.7%) | 1.5 | 1 (14.3%) | 0.2 | 0 (0.0%) | −1.1 | 0 (0.0%) | −1.2 | 7 (100.0%) |
| GMFCS IV | 7 (53.8%) | −0.3 | 1 (7.7%) | −0.5 | 1 (7.7%) | −0.7 | 4 (30.8%) | 1.5 | 13 (100.0%) |
| GMFCS V | 19 (76.0%) | 2.1 | 5 (20.0%) | 1.5 | 0 (0.0%) | −2.3 | 1 (4.0%) | −1.9 | 25 (100.0%) |
| In total | 60 (58.3%) | 12 (11.7%) | 14 (13.6%) | 17 (16.5%) | 103 (100.0%) | ||||
| D. The Abnormal Size of the Head—Dysmorphological Classification (hc and HCI) and Level of GMFCS A–C in the Entire Study Group | |||||||||
| p = 0.403 Cp = 0.32 | Relative Microcephaly N (N%) ASR | Absolute Microcephaly N (N%) ASR | Relative Macrocephaly N (N%) ASR | Absolute macrocephaly N (N%) ASR | In Total | ||||
| GMFCS A | 14 (56.0%) | −1.5 | 2 (8.0%) | −0.3 | 4 (16.0%) | 1.6 | 5 (20.0%) | 1 | 25 (100.0%) |
| GMFCS B | 6 (100.0%) | 1.8 | 0 (0.0%) | −0.8 | 0 (0.0%) | −0.8 | 0 (0.0%) | −1.1 | 6 (100.0%) |
| GMFCS C | 16 (69.6%) | 0.4 | 3 (13.0%) | 0.8 | 1 (4.3%) | −1.1 | 3 (13.0%) | −0.3 | 23 (100.0%) |
| In total | 36 (66.7%) | 5 (9.3%) | 5 (9.3%) | 8 (14.8%) | 54 (100.0%) | ||||
| E. The Abnormal Size of the Head—Traditional Classification (hc and HCI) and Level of GMFCS A–C in the Entire Study Group | |||||||||
| p = 0.039 Cp = 0.34 | Relative Microcephaly N (N%) ASR | Absolute Microcephaly N (N%) ASR | Relative Macrocephaly N (N%) ASR | Absolute Macrocephaly N (N%) ASR | In Total | ||||
| GMFCS A | 28 (48.3%) | –2.3 | 5 (8.6%) | −1.1 | 13 (22.4%) | 3 | 12 (20.7%) | 1.3 | 58 (100.0%) |
| GMFCS B | 6 (85.7%) | 1.5 | 1 (14.3%) | 0.2 | 0 (0.0%) | −1.1 | 0 (0.0%) | −1.2 | 7 (100.0%) |
| GMFCS C | 26 (68.4%) | 1.6 | 6 (15.8%) | 1 | 1 (2.6%) | −2.5 | 5 (13.2%) | −0.7 | 38 (100.0%) |
| In total | 60 (58.3%) | 12 (11.7%) | 14 (13.6%) | 17 (16.5%) | 103 (100.0%) | ||||
| F. The Abnormal Size of the Head—Dysmorphological Classification (hc and HCI) and Level of GMFCS I–V in Subgroup with CP | |||||||||
| p = 0.162 Cp = 0.54 | Relative Microcephaly N (N%) ASR | Absolute Microcephaly N (N%) ASR | Relative Macrocephaly N (N%) ASR | Absolute Macrocephaly N (N%) ASR | In Total | ||||
| GMFCS I | 3 (50.0%) | −1.6 | 0 (0.0%) | −1 | 1 (16.7%) | 1.5 | 2 (33.3%) | 2.6 | 6 (100.0%) |
| GMFCS II | 8 (72.7%) | −0.3 | 2 (18.2%) | 0.7 | 1 (9.1%) | 0.8 | 0 (0.0%) | −1.1 | 11 (100.0%) |
| GMFCS III | 5 (100.0%) | 1.4 | 0 (0.0%) | −0.9 | 0 (0.0%) | −0.5 | 0 (0.0%) | −0.7 | 5 (100.0%) |
| GMFCS IV | 3 (75.0%) | 0 | 0 (0.0%) | −0.8 | 0 (0.0%) | −0.5 | 1 (25.0%) | 1.4 | 4 (100.0%) |
| GMFCS V | 12 (80.0%) | 0.5 | 3 (20.0%) | 1.2 | 0 (0.0%) | −1.1 | 0 (0.0%) | −1.4 | 15 (100.0%) |
| In total | 31 (75.6%) | 5 (12.2%) | 2 (4.9%) | 3 (7.3%) | 41 (100.0%) | ||||
| G. The Abnormal Size of the Head—Traditional Classification (hc and HCI) and Level of GMFCS I–V in Subgroup with CP | |||||||||
| p = 0.124 Cp = 0.44 | Relative Microcephaly N (N%) ASR | Absolute Microcephaly N (N%) ASR | Relative Macrocephaly N (N%) ASR | Absolute Macrocephaly N (N%) ASR | In Total | ||||
| GMFCS I | 6 (46.2%) | −1.3 | 1 (7.7%) | −1 | 2 (15.4%) | 0.5 | 4 (30.8%) | 2.8 | 13 (100.0%) |
| GMFCS II | 12 (52.2%) | −1.2 | 4 (17.4%) | 0.1 | 5 (21.7%) | 2 | 2 (8.7%) | −0.2 | 23 (100.0%) |
| GMFCS III | 5 (83.3%) | 1.1 | 1 (16.7%) | 0 | 0 (0.0%) | −0.9 | 0 (0.0%) | −0.8 | 6 (100.0%) |
| GMFCS IV | 5 (62.5%) | 0 | 1 (12.5%) | −0.3 | 1 (12.5%) | 0.1 | 1 (12.5%) | 0.3 | 8 (100.0%) |
| GMFCS V | 17 (77.3%) | 1.7 | 5 (22.7%) | 0.9 | 0 (0.0%) | −2 | 0 (0.0%) | −1.8 | 22 (100.0%) |
| In total | 45 (62.5%) | 12 (16.7%) | 8 (11.1%) | 7 (9.7%) | 72 (100.0%) | ||||
| H. The Abnormal Size of the Head—Dysmorphological Classification (hc and HCI) and Level of GMFCS A–C in Subgroup with CP | |||||||||
| p = 0.511 Cp = 0.34 | Relative Microcephaly N (N%) ASR | Absolute Microcephaly N (N%) ASR | Relative Macrocephaly N (N%) ASR | Absolute Macrocephaly N (N%) ASR | In Total | ||||
| GMFCS A | 11 (64.7%) | −1.4 | 2 (11.8%) | −0.1 | 2 (11.8%) | 1.7 | 2 (11.8%) | 0.9 | 17 (100.0%) |
| GMFCS B | 5 (100.0%) | 1.4 | 0 (0.0%) | −0.9 | 0 (0.0%) | −0.5 | 0 (0.0%) | −0.7 | 5 (100.0%) |
| GMFCS C | 15 (78.9%) | 0.5 | 3 (15.8%) | 0.7 | 0 (0.0%) | −1.3 | 1 (5.3%) | −0.5 | 19 (100.0%) |
| In total | 31 (75.6%) | 5 (12.2%) | 2 (4.9%) | 3 (7.3%) | 41 (100.0%) | ||||
| I. The abnormal size of the Head—Traditional Classification (hc and HCI) and Level of GMFCS A-C in Subgroup with CP | |||||||||
| p = 0.108 Cp = 0.36 | Relative Microcephaly N (N%) ASR | Absolute Microcephaly N (N%) ASR | Relative Macrocephaly N (N%) ASR | Absolute Macrocephaly N (N%) ASR | In Total | ||||
| GMFCS A | 18 (50.0%) | −2.2 | 5 (13.9%) | −0.6 | 7 (19.4%) | 2.2 | 6 (16.7%) | 2 | 36 (100.0%) |
| GMFCS B | 5 (83.3%) | 1.1 | 1 (16.7%) | 0 | 0 (0.0%) | −0.9 | 0 (0.0%) | −0.8 | 6 (100.0%) |
| GMFCS C | 22 (73.3%) | 1.6 | 6 (20.0%) | 0.6 | 1 (3.3%) | −1.8 | 1 (3.3%) | −1.5 | 30 (100.0%) |
| In total | 45 (62.5%) | 12 (16.7%) | 8 (11.1%) | 7 (9.7%) | 72 (100.0%) | ||||
Publisher’s Note: MDPI stays neutral with regard to jurisdictional claims in published maps and institutional affiliations. |
© 2020 by the authors. Licensee MDPI, Basel, Switzerland. This article is an open access article distributed under the terms and conditions of the Creative Commons Attribution (CC BY) license (http://creativecommons.org/licenses/by/4.0/).
Share and Cite
Perenc, L.; Guzik, A.; Podgórska-Bednarz, J.; Drużbicki, M. Abnormal Head Size in Children and Adolescents with Congenital Nervous System Disorders or Neurological Syndromes with One or More Neurodysfunction Visible since Infancy. J. Clin. Med. 2020, 9, 3739. https://doi.org/10.3390/jcm9113739
Perenc L, Guzik A, Podgórska-Bednarz J, Drużbicki M. Abnormal Head Size in Children and Adolescents with Congenital Nervous System Disorders or Neurological Syndromes with One or More Neurodysfunction Visible since Infancy. Journal of Clinical Medicine. 2020; 9(11):3739. https://doi.org/10.3390/jcm9113739
Chicago/Turabian StylePerenc, Lidia, Agnieszka Guzik, Justyna Podgórska-Bednarz, and Mariusz Drużbicki. 2020. "Abnormal Head Size in Children and Adolescents with Congenital Nervous System Disorders or Neurological Syndromes with One or More Neurodysfunction Visible since Infancy" Journal of Clinical Medicine 9, no. 11: 3739. https://doi.org/10.3390/jcm9113739
APA StylePerenc, L., Guzik, A., Podgórska-Bednarz, J., & Drużbicki, M. (2020). Abnormal Head Size in Children and Adolescents with Congenital Nervous System Disorders or Neurological Syndromes with One or More Neurodysfunction Visible since Infancy. Journal of Clinical Medicine, 9(11), 3739. https://doi.org/10.3390/jcm9113739