Early Retinal Changes by OCT Angiography and Multifocal Electroretinography in Diabetes

 ,
,  , , and
Abstract
1. Introduction
2. Experimental Section
2.1. Optical Coherence Tomography
2.1.1. Single Retinal Layer Thickness Measurements
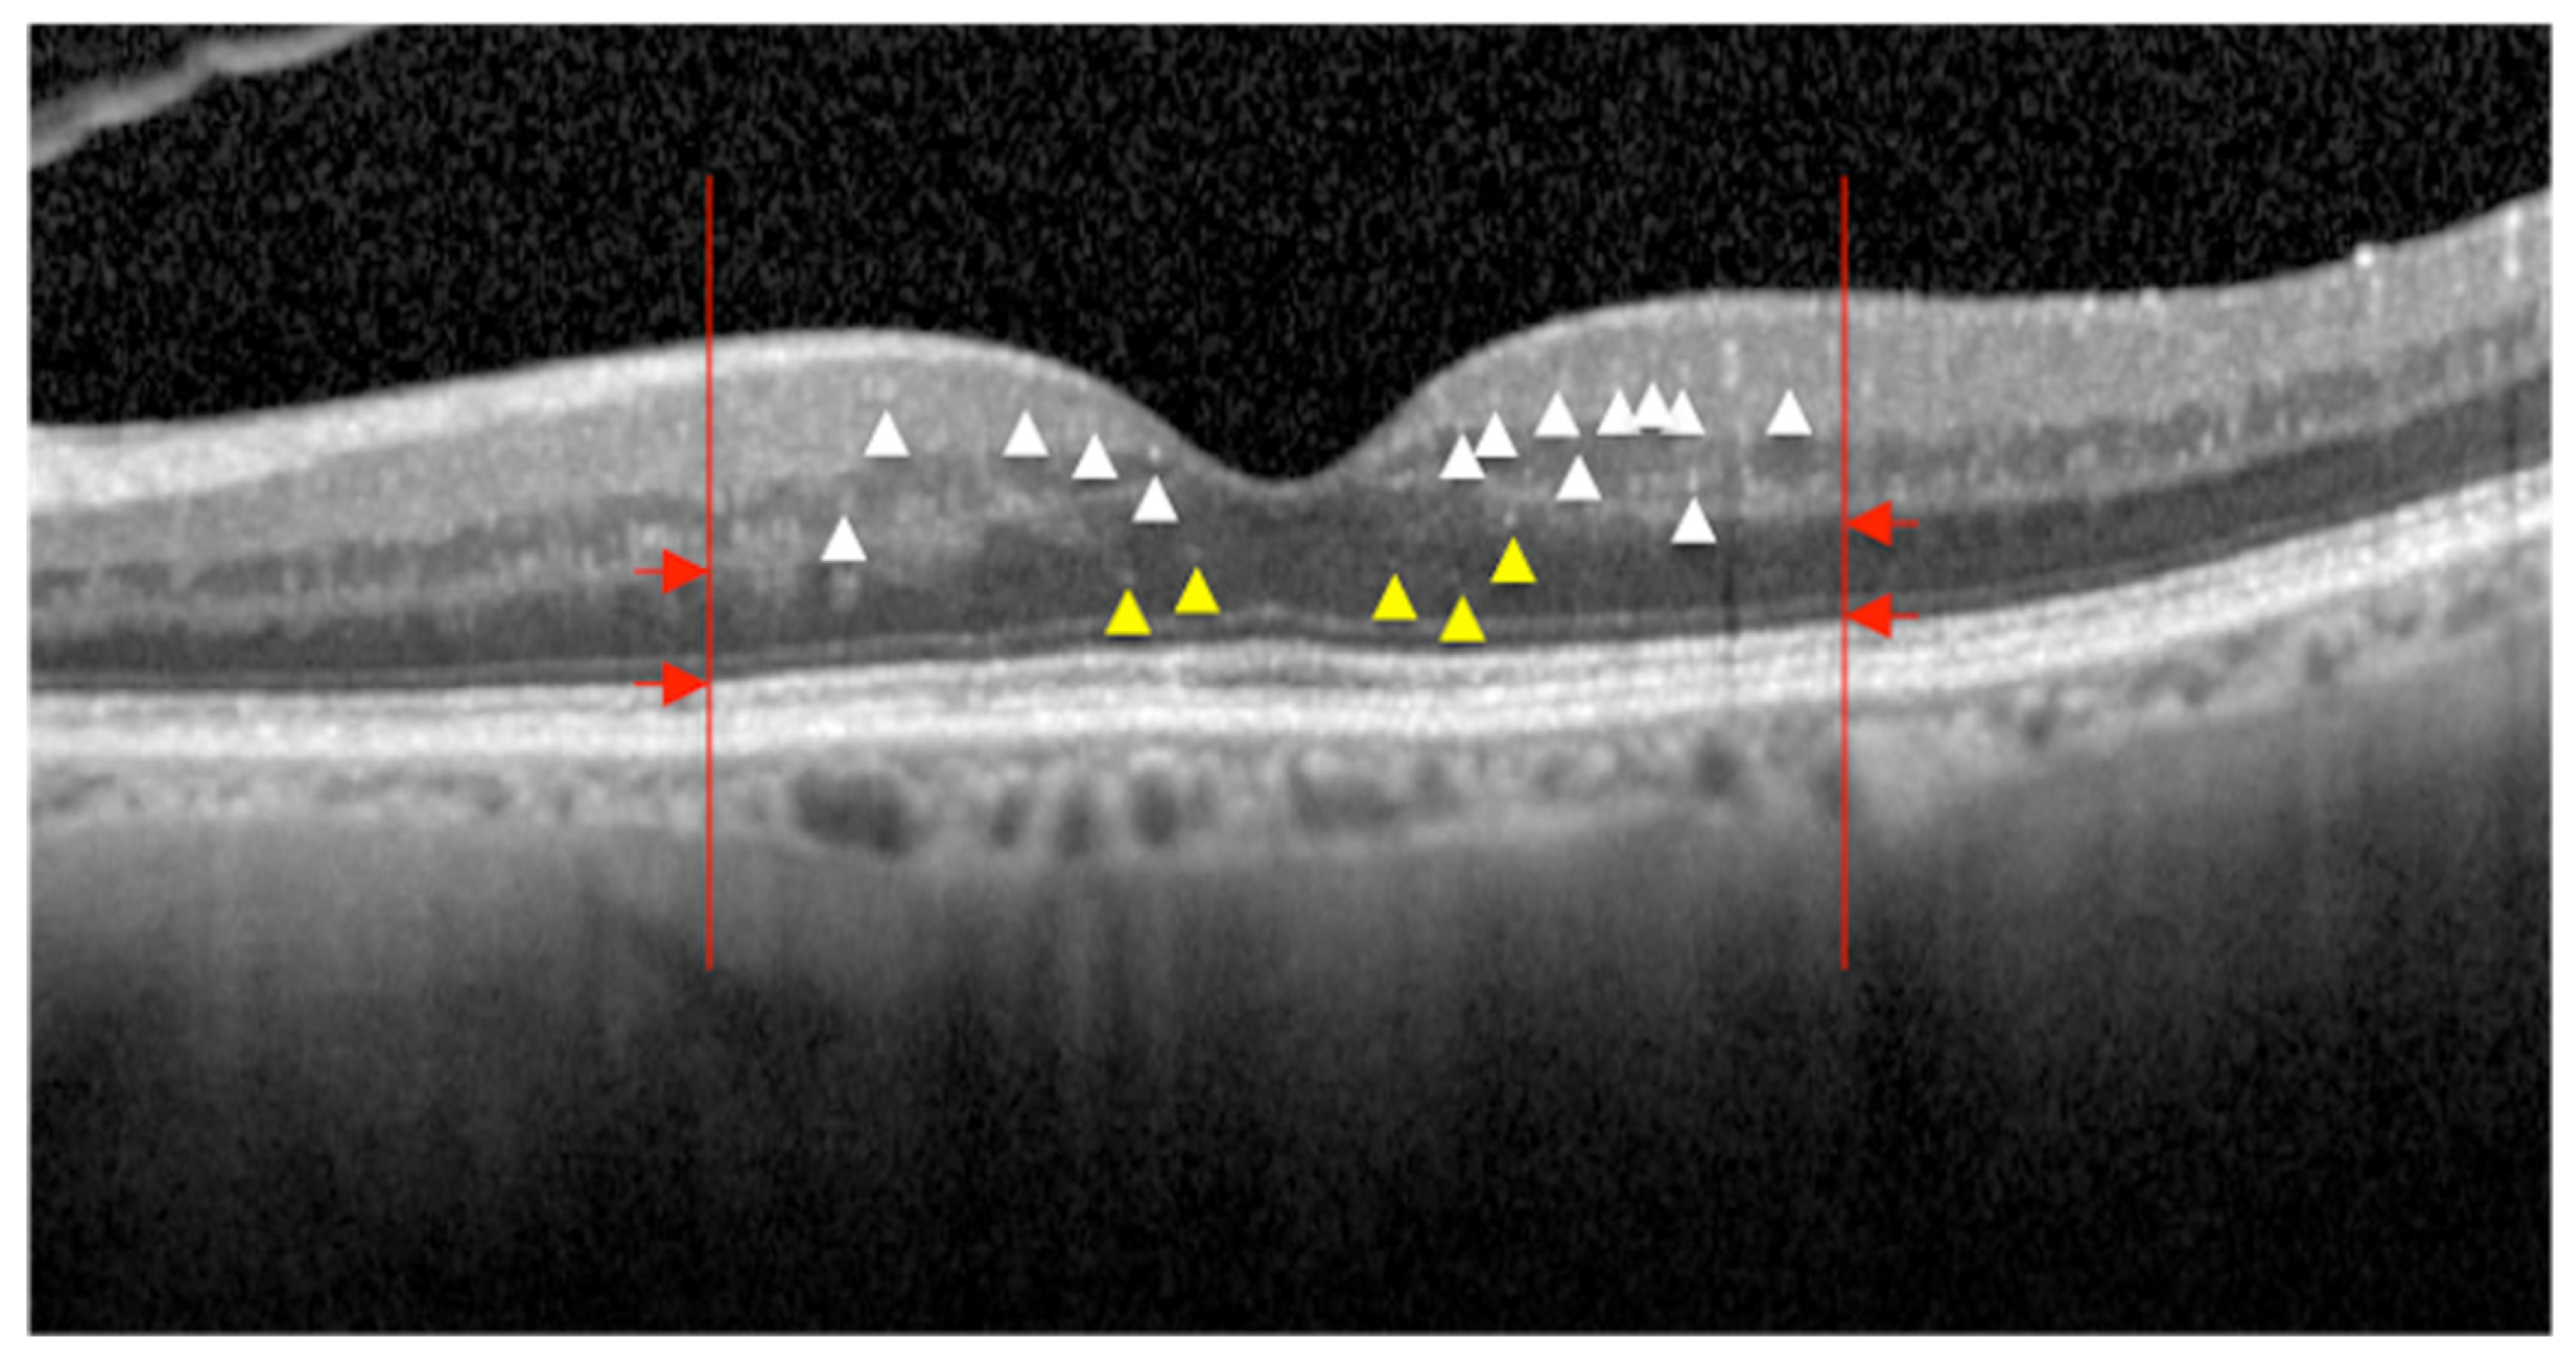
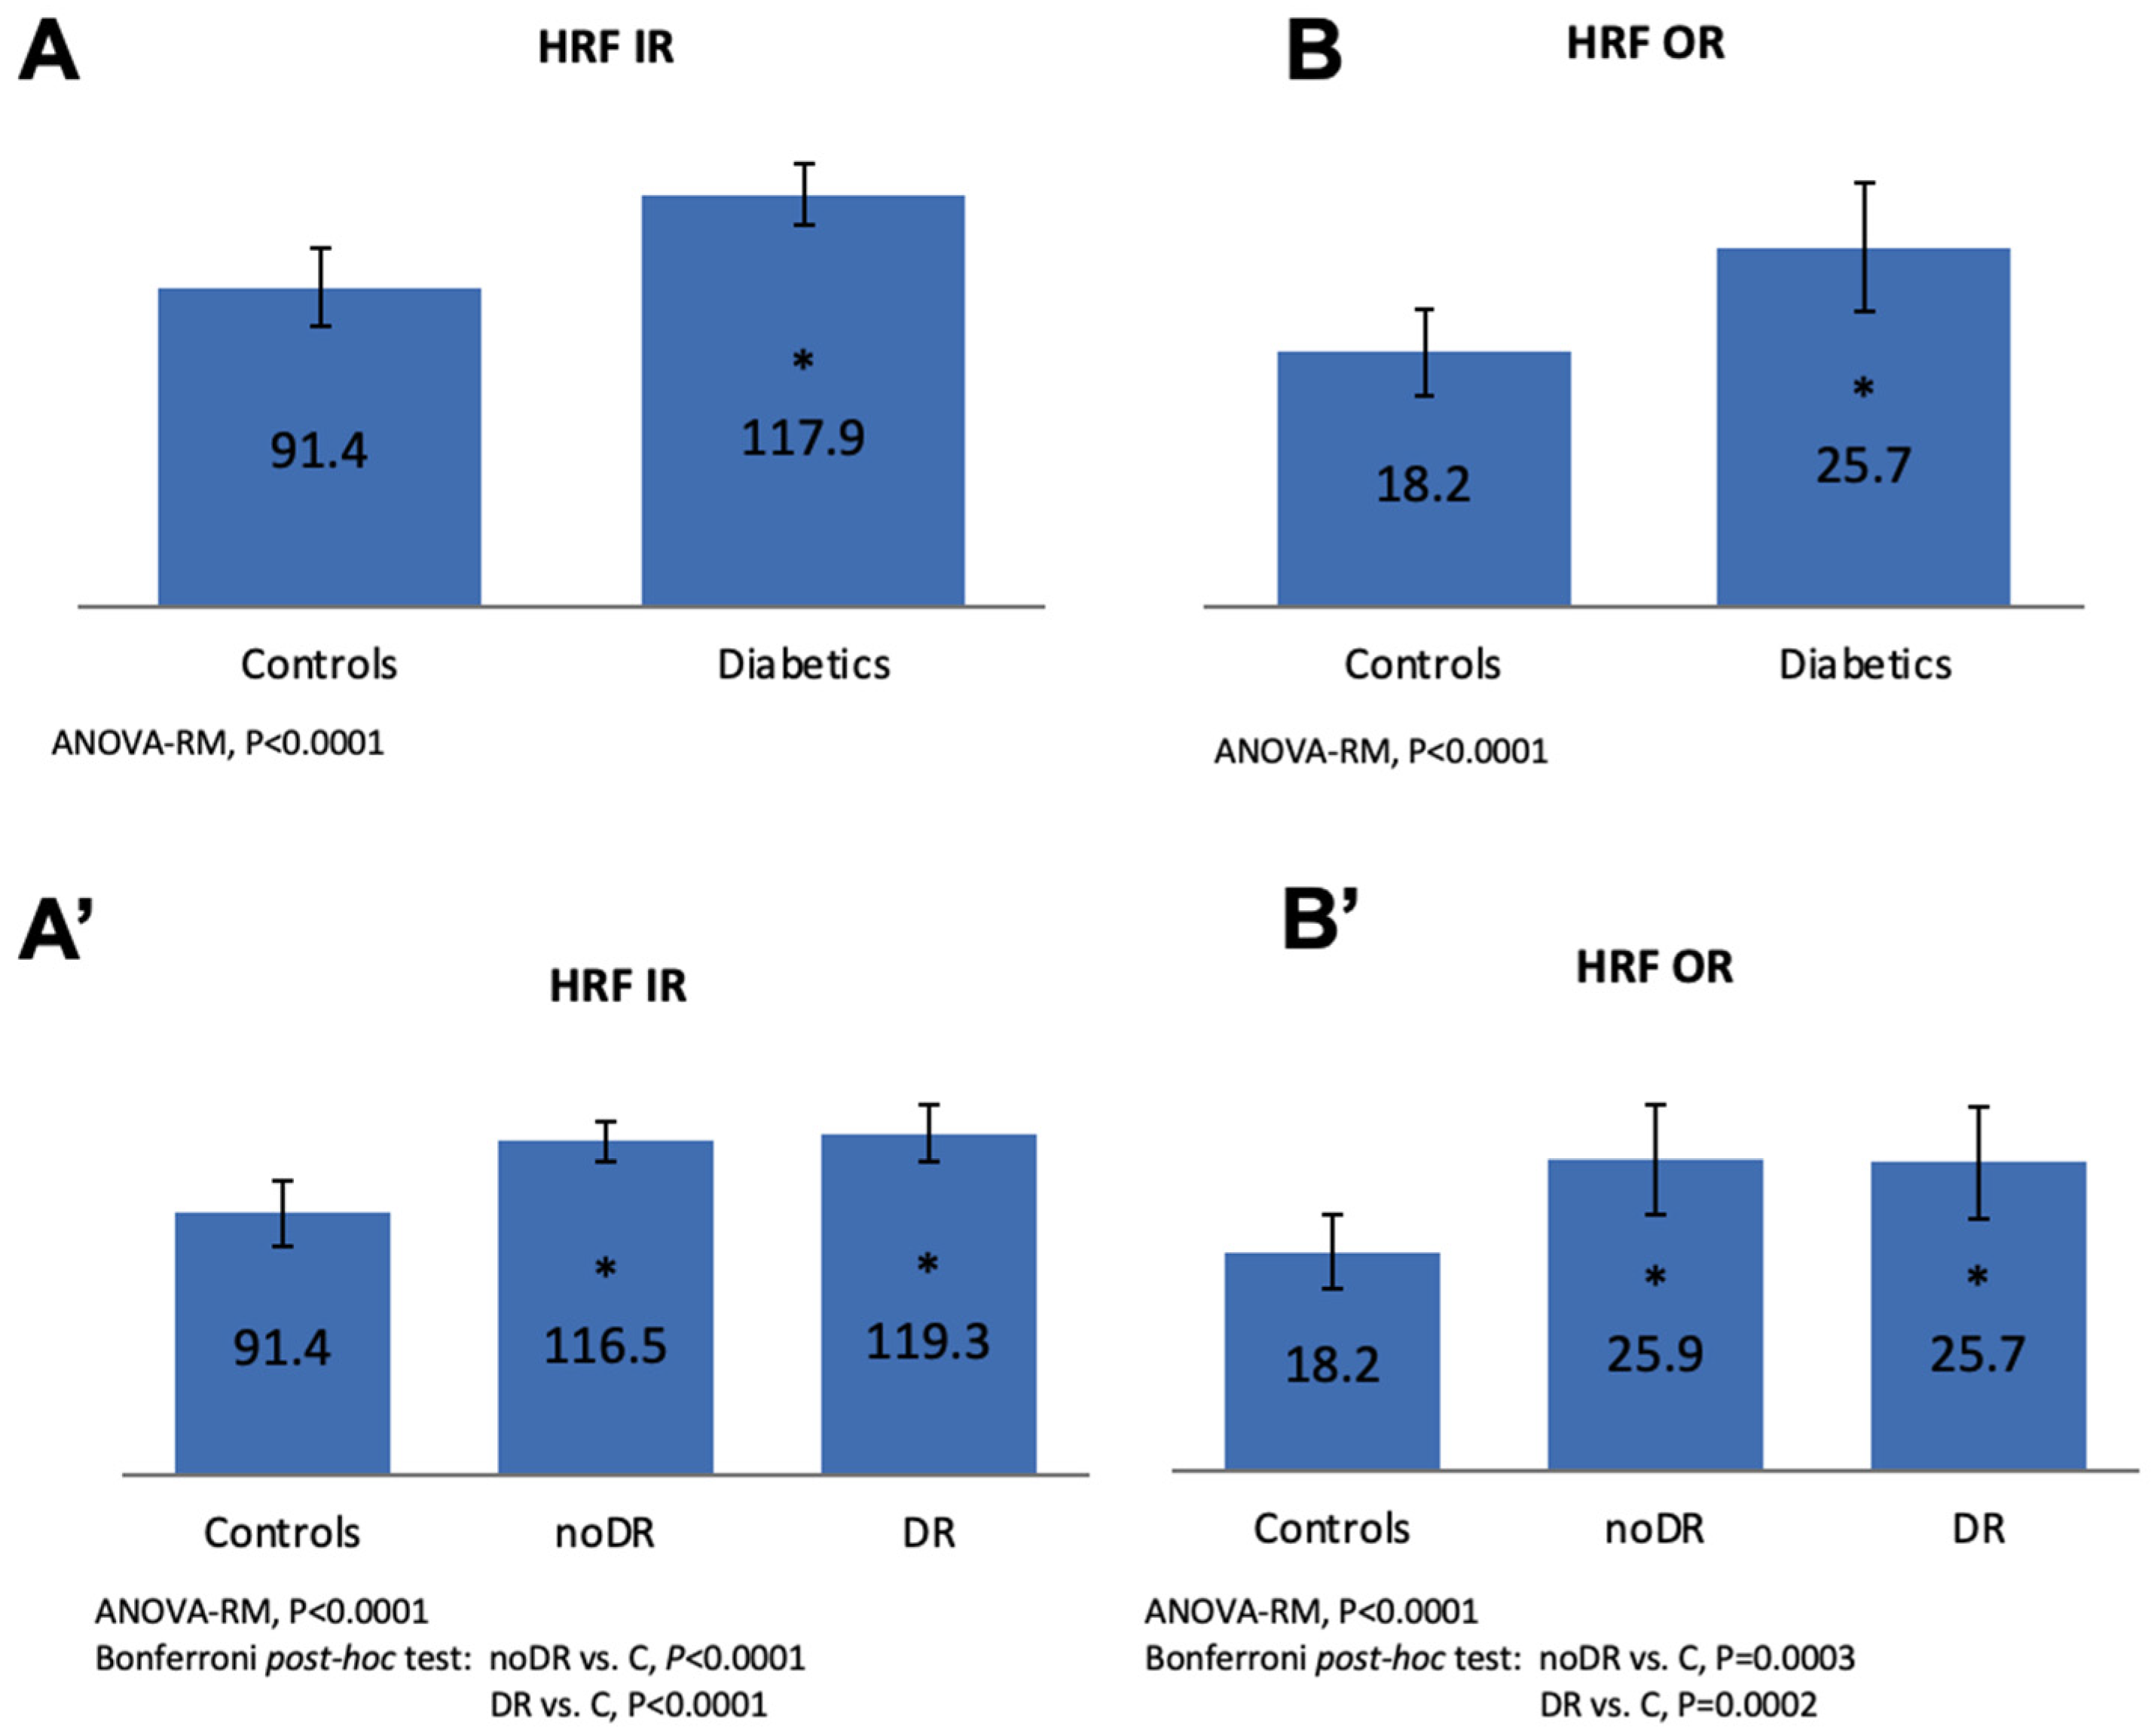
2.1.2. Hyperreflective Intraretinal Foci
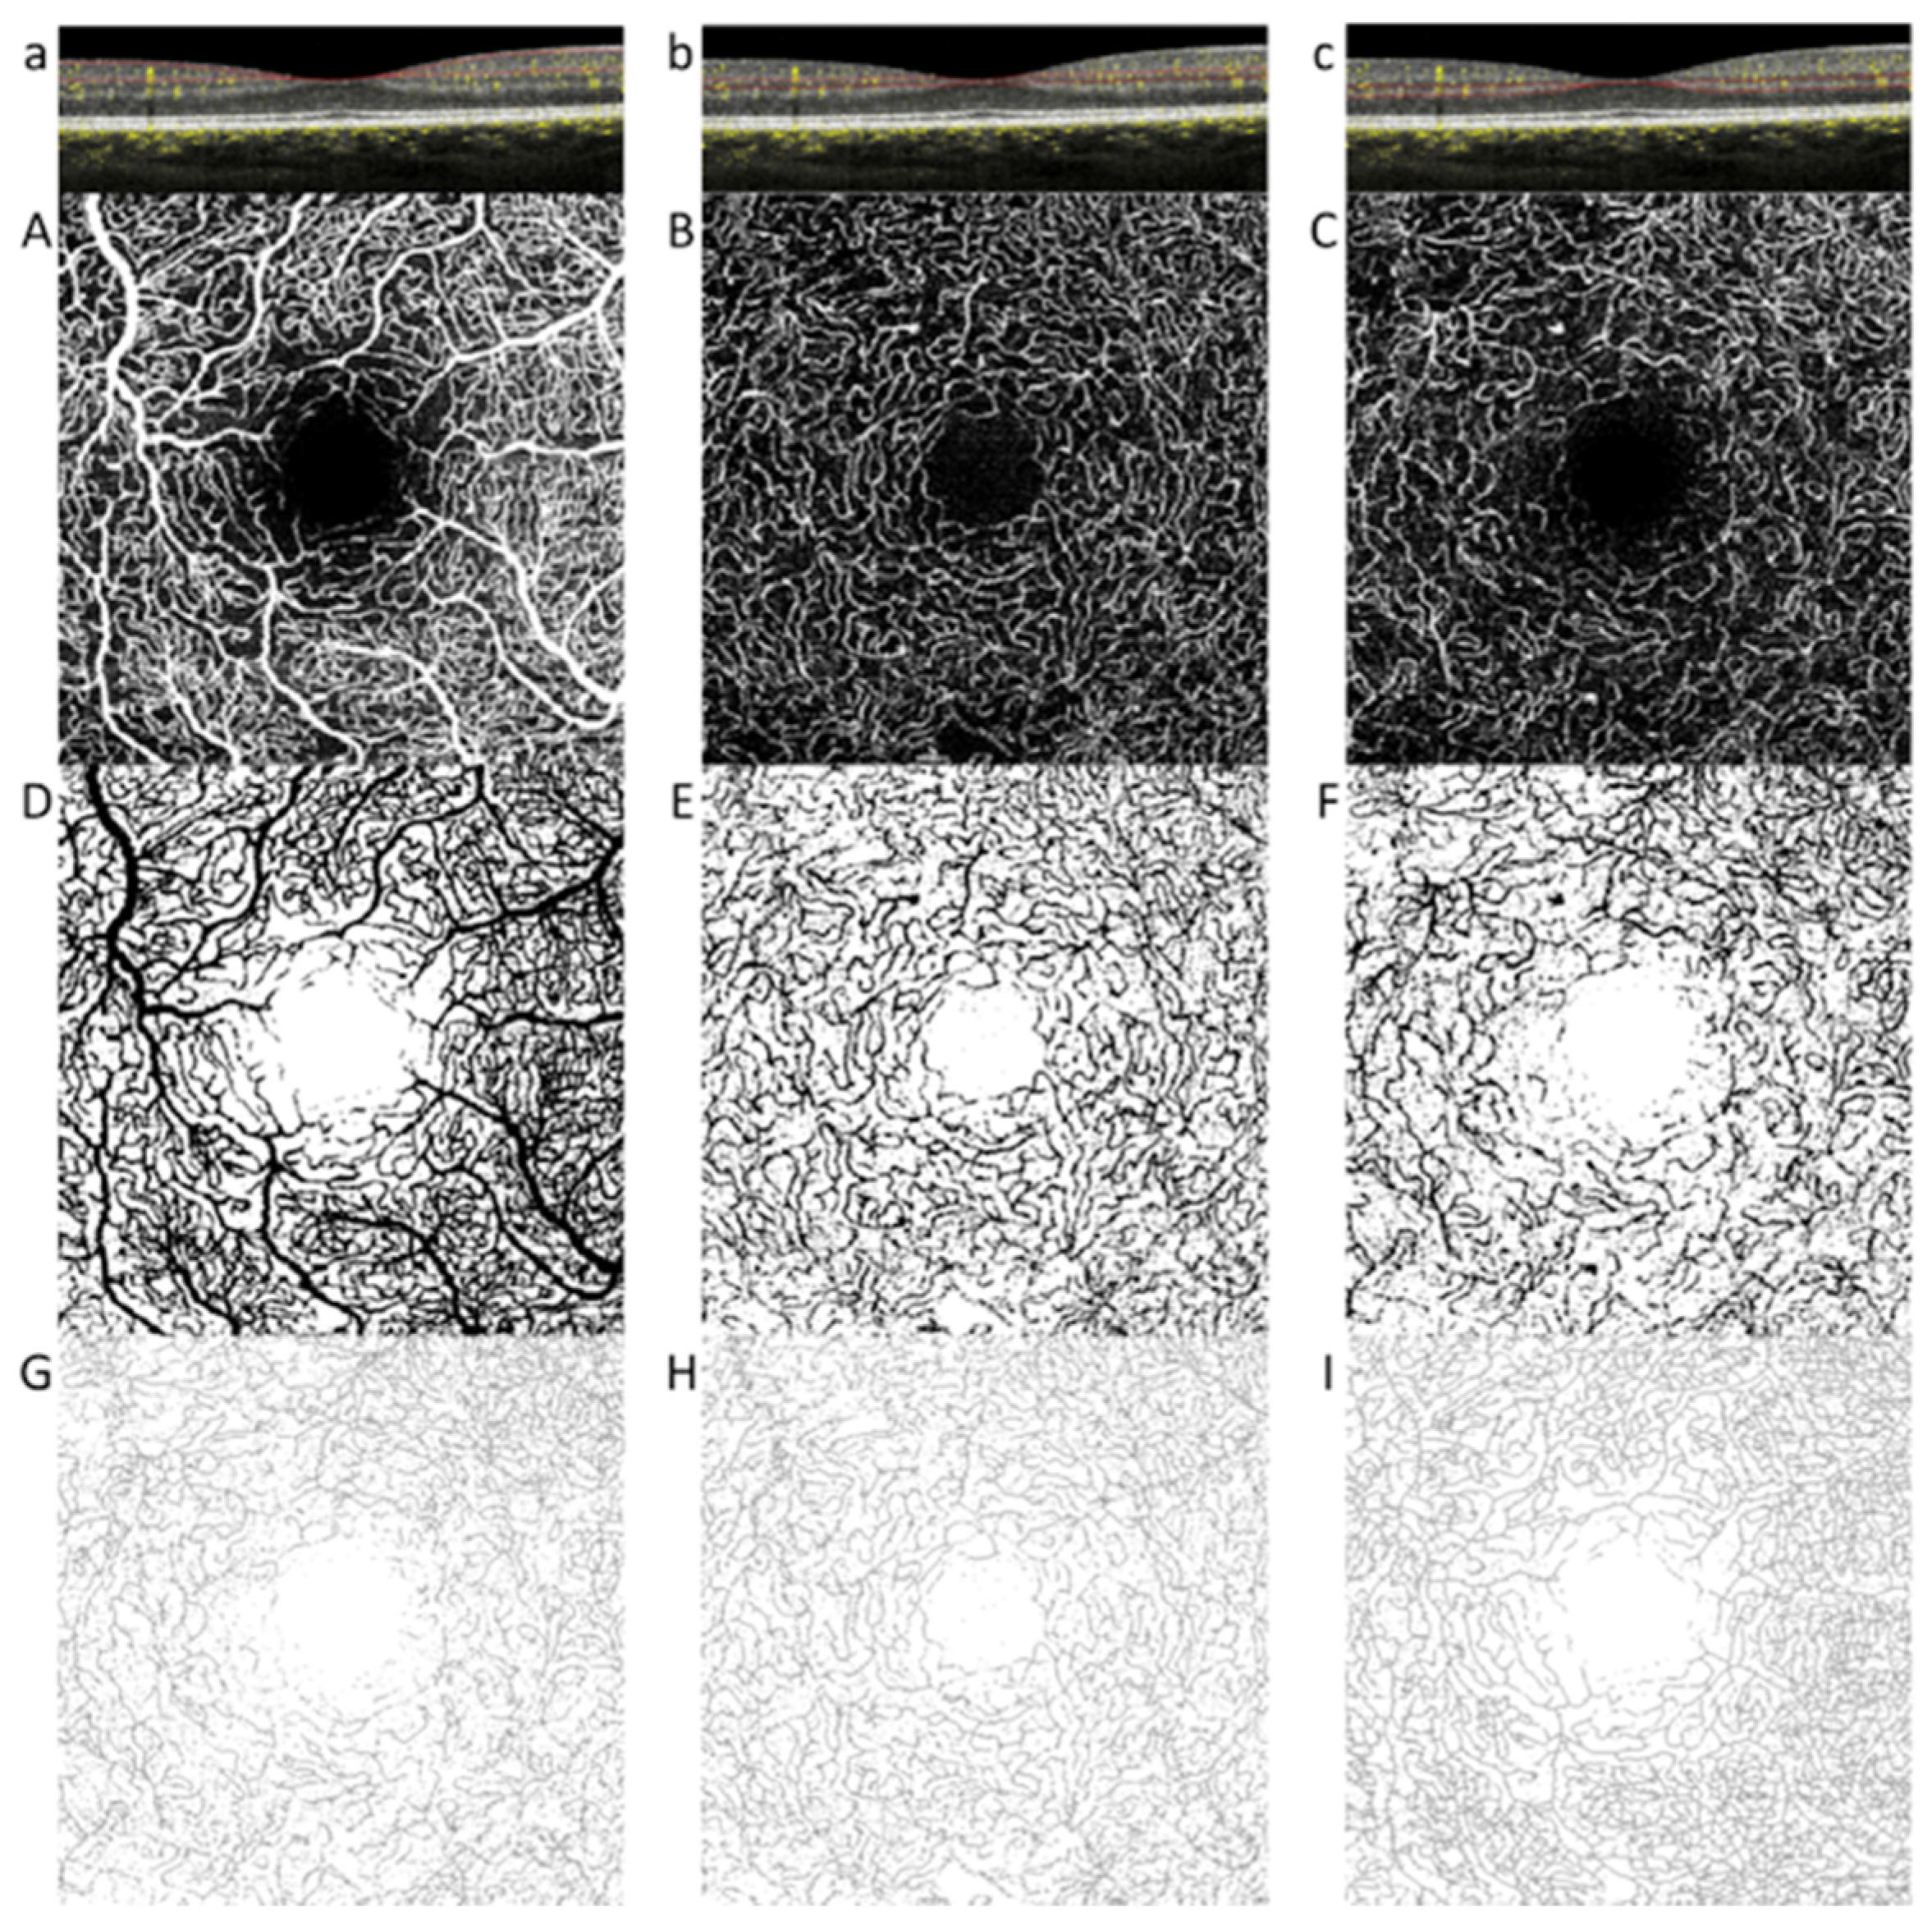
2.2. Optical Coherence Tomography Angiography
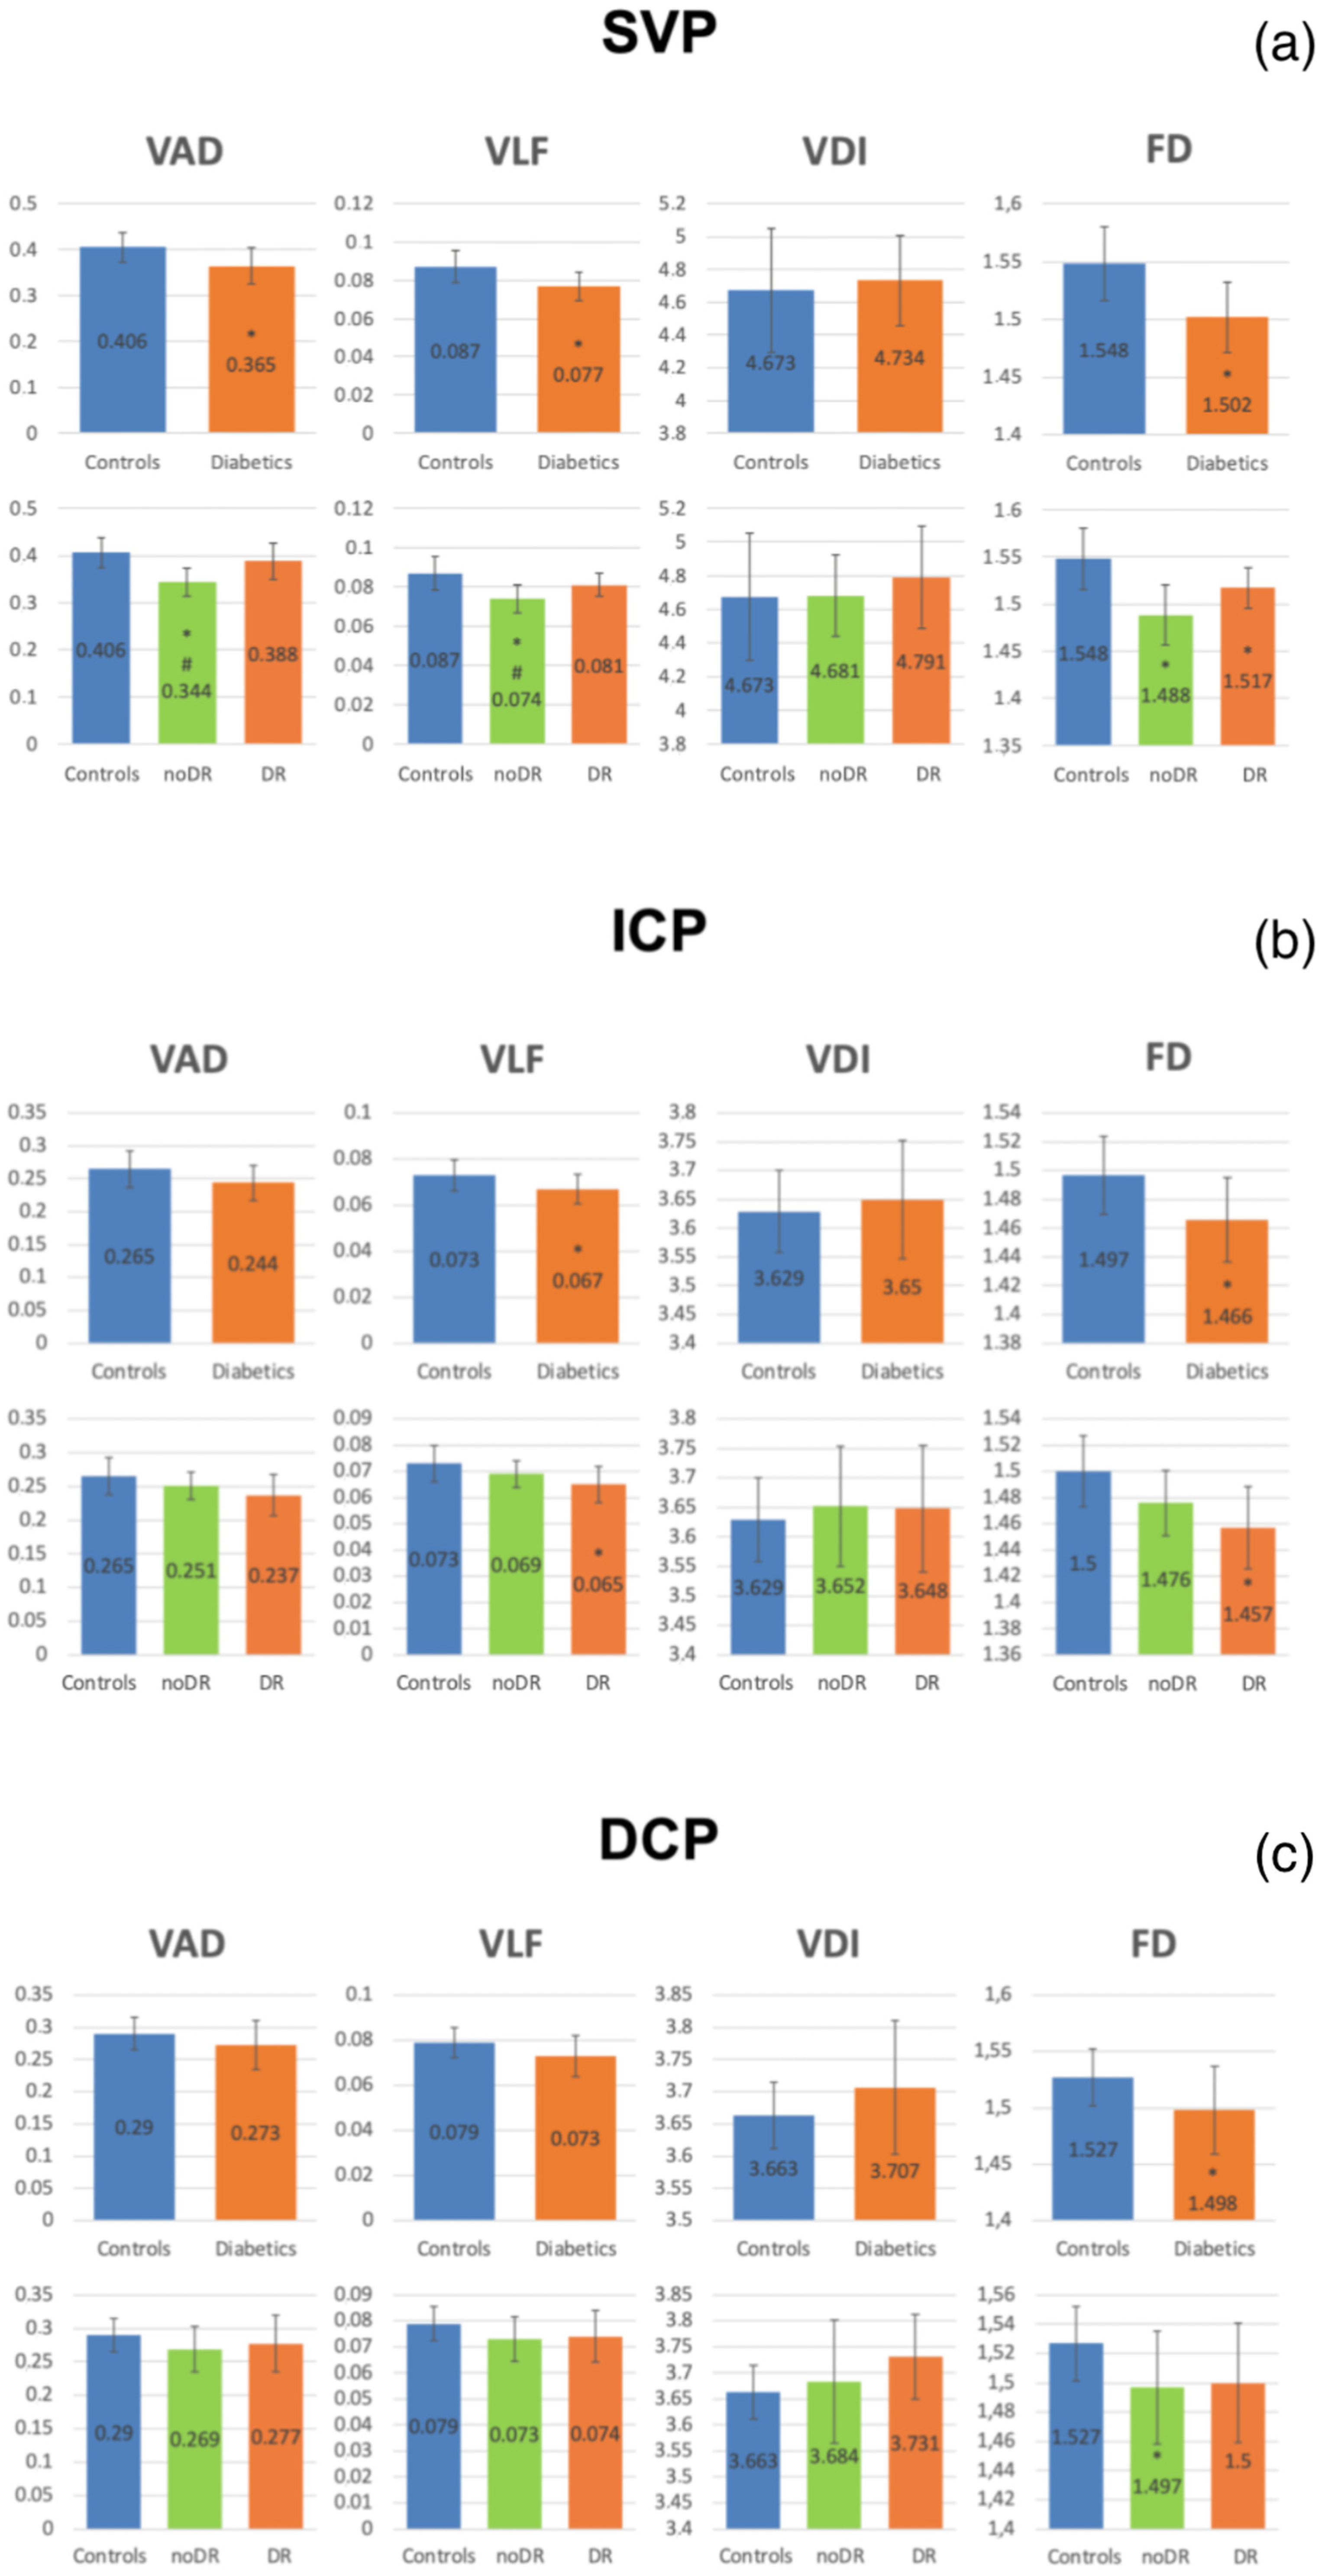
OCTA Quantitative Parameters
2.3. Multifocal ERG
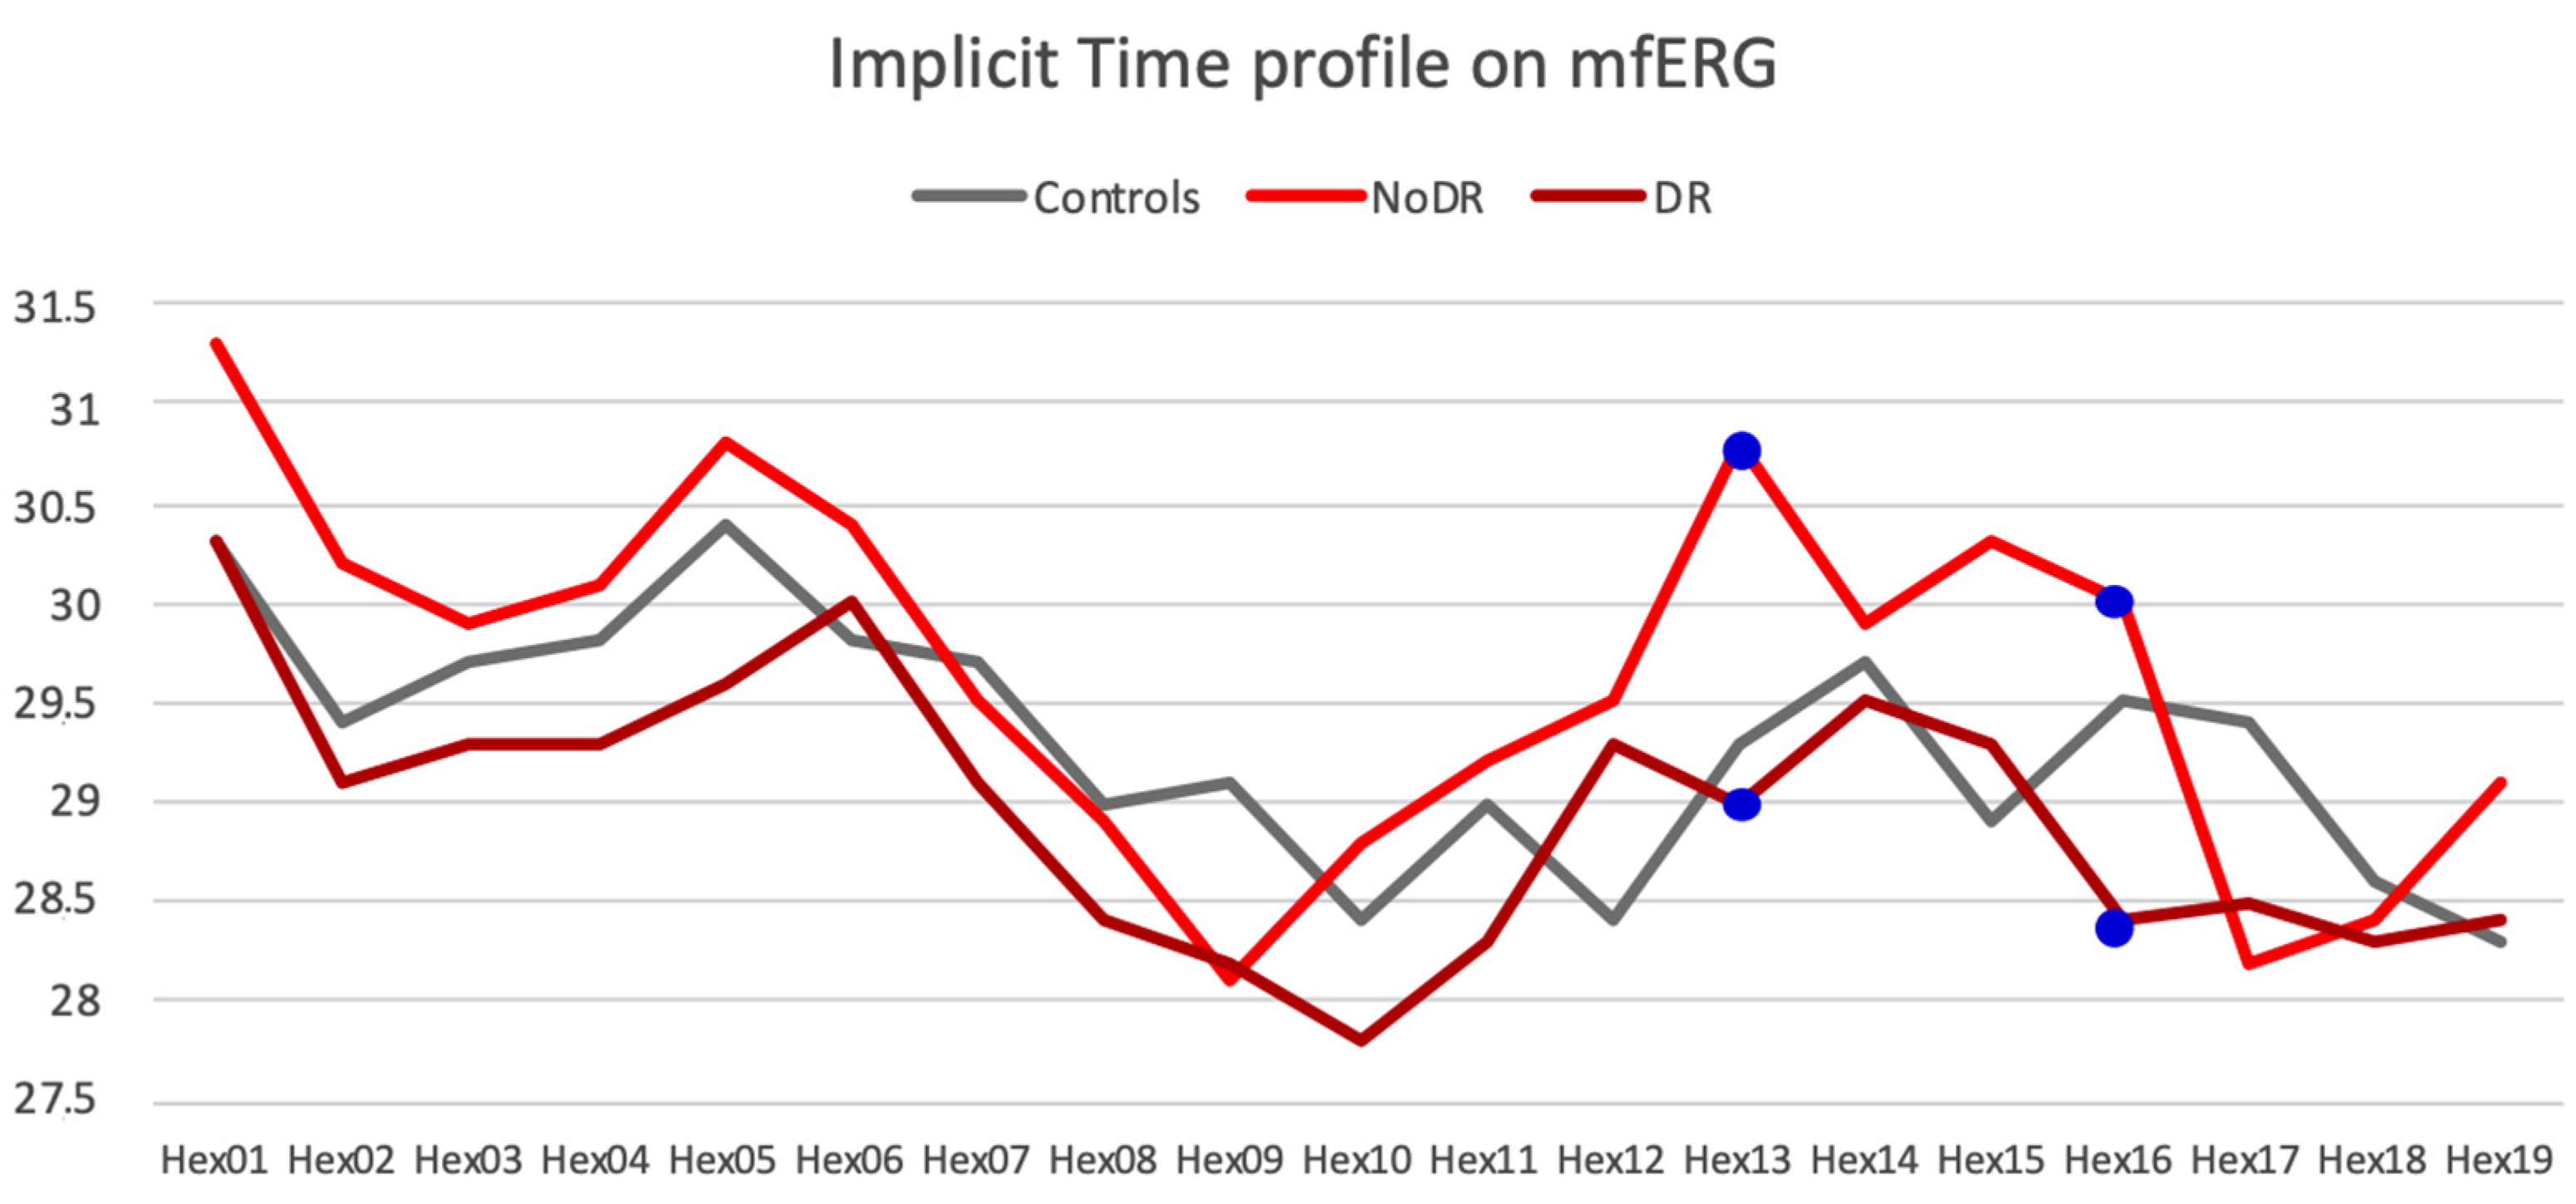
mfERG Parameters
2.4. Statistical Analysis
3. Results
3.1. OCT Parameters
3.2. OCTA Parameters
3.3. Multifocal ERG Parameters
3.4. Correlations between Morphologic and Electrophysiologic Parameters
4. Discussion
Author Contributions
Funding
Acknowledgments
Conflicts of Interest
References
- Antonetti, D.A.; Barber, A.J.; Khin, S.; Lieth, E.; Tarbell, J.M.; Gardner, T.W. Vascular permeability in experimental diabetes is associated with reduced endothelial occludin content: Vascular endothelial growth factor decreases occludin in retinal endothelial cells. Penn State Retina Research Group. Diabetes 1998, 47, 1953–1959. [Google Scholar] [CrossRef] [PubMed]
- Campbell, J.P.; Zhang, M.; Hwang, T.S.; Bailey, S.T.; Wilson, D.J.; Jia, Y.; Huang, D. Detailed Vascular Anatomy of the Human Retina by Projection-Resolved Optical Coherence Tomography Angiography. Sci. Rep. 2017, 7, 42201. [Google Scholar] [CrossRef] [PubMed]
- Chan, G.; Balaratnasingam, C.; Xu, J.; Mammo, Z.; Han, S.; MacKenzie, P.; Merkur, A.; Kirker, A.; Albiani, D.; Sarunic, M.V.; et al. In vivo optical imaging of human retinal capillary networks using speckle variance optical coherence tomography with quantitative clinico-histological correlation. Microvasc. Res. 2015, 100, 32–39. [Google Scholar] [CrossRef] [PubMed]
- De Carlo, T.E.; Chin, A.T.; Bonini Filho, M.A.; Adhi, M.; Branchini, L.; Salz, D.A.; Baumal, C.R.; Crawford, C.; Reichel, E.; Witkin, A.J.; et al. Detection of microvascular changes in eyes of patients with diabetes but not clinical diabetic retinopathy using optical coherence tomography angiography. Retina 2015, 35, 2364–2370. [Google Scholar] [CrossRef] [PubMed]
- Hwang, T.S.; Jia, Y.; Gao, S.S.; Bailey, S.T.; Lauer, A.K.; Flaxel, C.J.; Wilson, D.J.; Huang, D. Optical coherence tomography angiography features of diabetic retinopathy. Retina 2015, 35, 2371–2376. [Google Scholar] [CrossRef]
- Ishibazawa, A.; Nagaoka, T.; Takahashi, A.; Omae, T.; Tani, T.; Sogawa, K.; Yokota, H.; Yoshida, A. Optical Coherence Tomography Angiography in Diabetic Retinopathy: A Prospective Pilot Study. Am. J. Ophthalmol. 2015, 160, 35–44.e1. [Google Scholar] [CrossRef]
- Villarroel, M.; Ciudin, A.; Hernández, C.; Simó, R. Neurodegeneration: An early event of diabetic retinopathy. World J. Diabetes 2010, 1, 57–64. [Google Scholar] [CrossRef]
- Joussen, A.M.; Poulaki, V.; Le, M.L.; Koizumi, K.; Esser, C.; Janicki, H.; Schraermeyer, U.; Kociok, N.; Fauser, S.; Kirchhof, B.; et al. A central role for inflammation in the pathogenesis of diabetic retinopathy. FASEB J. 2004, 18, 1450–1452. [Google Scholar] [CrossRef]
- Spaide, R.F. Measurable Aspects of the Retinal Neurovascular Unit in Diabetes, Glaucoma, and Controls. Am. J. Ophthalmol. 2019, 207, 395–409. [Google Scholar] [CrossRef]
- Altmann, C.; Schmidt, M.H.H. The Role of Microglia in Diabetic Retinopathy: Inflammation, Microvasculature Defects and Neurodegeneration. Int. J. Mol. Sci. 2018, 19, 110. [Google Scholar] [CrossRef]
- Vujosevic, S.; Bini, S.; Midena, G.; Berton, M.; Pilotto, E.; Midena, E. Hyperreflective Intraretinal Spots in Diabetics without and with Nonproliferative Diabetic Retinopathy: AnIn VivoStudy Using Spectral Domain OCT. J. Diabetes Res. 2013, 2013, 1–5. [Google Scholar] [CrossRef] [PubMed]
- Coscas, G.; De Benedetto, U.; Coscas, F.; Calzi, C.I.L.; Vismara, S.; Roudot-Thoraval, F.; Bandello, F.; Souied, E. Hyperreflective Dots: A New Spectral-Domain Optical Coherence Tomography Entity for Follow-Up and Prognosis in Exudative Age-Related Macular Degeneration. Ophthalmology 2013, 229, 32–37. [Google Scholar] [CrossRef] [PubMed]
- Zeng, H.-Y.; Green, W.R.; Tso, M.O.M. Microglial Activation in Human Diabetic Retinopathy. Arch. Ophthalmol. 2008, 126, 227–232. [Google Scholar] [CrossRef]
- Rodrigues, E.B.; Urias, M.G.; Penha, F.M.; Badaró, E.; Novais, E.A.; Meirelles, R.; Farah, M.E. Diabetes induces changes in neuroretina before retinal vessels: A spectral-domain optical coherence tomography study. Int. J. Retin. Vitr. 2015, 1, 4. [Google Scholar] [CrossRef]
- Midena, E.; Pilotto, E.; Bandello, F.; Zarbin, M.; Lattanzio, R.; Zucchiatti, I. Emerging Insights into Pathogenesis. Dev. Ophthalmol. 2017, 60, 16–27. [Google Scholar] [CrossRef]
- Nesper, P.L.; Soetikno, B.T.; Zhang, H.F.; Fawzi, A.A. OCT angiography and visible-light OCT in diabetic retinopathy. Vis. Res. 2017, 139, 191–203. [Google Scholar] [CrossRef] [PubMed]
- Schmetterer, L.; Sim, R.; Tan, B.; Wong, D.; Yao, X.; Liu, X.; Ting, D.S.W.; Schmidl, D.; Ang, M.; Garhöfer, G.; et al. Optical Coherence Tomography Angiography in Diabetes and Diabetic Retinopathy. J. Clin. Med. 2020, 9, 1723. [Google Scholar] [CrossRef]
- Vujosevic, S.; Midena, E.; Pilotto, E.; Radin, P.P.; Chiesa, L.; Cavarzeran, F. Diabetic Macular Edema: Correlation between Microperimetry and Optical Coherence Tomography Findings. Investig. Opthalmology Vis. Sci. 2006, 47, 3044–3051. [Google Scholar] [CrossRef]
- Han, Y.; Adams, A.J.; Bearse, M.A.; Schneck, M.E. Multifocal Electroretinogram and Short-Wavelength Automated PerimetryMeasures in Diabetic Eyes with Little or No Retinopathy. Arch. Ophthalmol. 2004, 122, 1809–1815. [Google Scholar] [CrossRef]
- Falsini, B.; Porciatti, V.; Scalia, G.; Caputo, S.; Minnella, A.; Di Leo, M.A.S.; Ghirlanda, G. Steady-state pattern electroretinogram in insulin-dependent diabetics with no or minimal retinopathy. Doc. Ophthalmol. 1989, 73, 193–200. [Google Scholar] [CrossRef]
- Sokol, S.; Moskowitz, A.; Skarf, B.; Evans, R.; Molitch, M.; Senior, B. Contrast Sensitivity in Diabetics With and Without Background Retinopathy. Arch. Ophthalmol. 1985, 103, 51–54. [Google Scholar] [CrossRef]
- Montesano, G.; Gervasoni, A.; Ferri, P.; Allegrini, D.; Migliavacca, L.; De Cillà, S.; Rossetti, L. Structure–function relationship in early diabetic retinopathy: A spatial correlation analysis with OCT and microperimetry. Eye 2017, 31, 931–939. [Google Scholar] [CrossRef] [PubMed]
- Ratra, D.; Nagarajan, R.; Dalan, D.; Prakash, N.; Kuppan, K.; Thanikachalam, S.; Das, U.; Narayansamy, A. Early structural and functional neurovascular changes in the retina in the prediabetic stage. Eye 2020, 1–10. [Google Scholar] [CrossRef] [PubMed]
- Early Treatment Diabetic Retinopathy Study Research Group. Grading Diabetic Retinopathy from Stereoscopic Color Fundus Photographs—An Extension of the Modified Airlie House Classification: ETDRS report number 10. Ophthalmology 1991, 98, 786–806. [Google Scholar] [CrossRef]
- Pilotto, E.; Leonardi, F.; Stefanon, G.; Longhin, E.; Torresin, T.; Deganello, D.; Cavarzeran, F.; Miglionico, G.; Parrozzani, R.; Midena, E. Early retinal and choroidal OCT and OCT angiography signs of inflammation after uncomplicated cataract surgery. Br. J. Ophthalmol. 2018, 103, 1001–1007. [Google Scholar] [CrossRef]
- Hood, D.C.; Bach, M.; Brigell, M.; Keating, D.; Kondo, M.; Lyons, J.S.; Marmor, M.F.; McCulloch, D.L.; Palmowski-Wolfe, A.M.; International Society for Clinical Electrophysiology of Vision. ISCEV standard for clinical multifocal electroretinography (mfERG) (2011 edition). Doc. Ophthalmol. 2012, 124, 1–13. [Google Scholar] [CrossRef]
- Frydkjaer-Olsen, U.; Hansen, R.S.; Simo, R.; Cunha-Vaz, J.; Peto, T.; Grauslund, J.; Eurocondor, O.B.O.T. Correlation between Retinal Vessel Calibre and Neurodegeneration in Patients with Type 2 Diabetes Mellitus in the European Consortium for the Early Treatment of Diabetic Retinopathy (EUROCONDOR). Ophthalmic Res. 2016, 56, 10–16. [Google Scholar] [CrossRef] [PubMed]
- Frizziero, L.; Parrozzani, R.; Midena, G.; Miglionico, G.; Vujosevic, S.; Pilotto, E.; Midena, E. Hyperreflective intraretinal spots in radiation macular edema on spectral domain optical coherence tomography. Retina 2016, 36, 1664–1669. [Google Scholar] [CrossRef]
- Vujosevic, S.; Midena, E. Retinal Layers Changes in Human Preclinical and Early Clinical Diabetic Retinopathy Support Early Retinal Neuronal and Müller Cells Alterations. J. Diabetes Res. 2013, 2013, 1–8. [Google Scholar] [CrossRef]
- Gerendas, B.S.; Hatz, K.; Kaider, A.; Zulewski, H.; Lehmann, R.; Montuoro, A.; Schmidt-Erfurth, U.; Pruente, C. Ganglion cell layer thickening in well-controlled patients with type 1 diabetes: An early sign for diabetic retinopathy? Acta Ophthalmol. 2019, 98, e292–e300. [Google Scholar] [CrossRef]
- Leung, C.K.-S.; Weinreb, R.N.; Li, Z.W.; Liu, S.; Lindsey, J.D.; Choi, N.; Liu, L.; Cheung, C.Y.-L.; Ye, C.; Qiu, K.; et al. Long-Term In Vivo Imaging and Measurement of Dendritic Shrinkage of Retinal Ganglion Cells. Investig. Opthalmol. Vis. Sci. 2011, 52, 1539–1547. [Google Scholar] [CrossRef] [PubMed]
- Van Dijk, H.W.; Verbraak, F.D.; Kok, P.H.B.; Stehouwer, M.; Garvin, M.K.; Sonka, M.; Devries, J.H.; Schlingemann, R.O.; Abràmoff, M.D. Early Neurodegeneration in the Retina of Type 2 Diabetic Patients. Investig. Opthalmol. Vis. Sci. 2012, 53, 2715–2719. [Google Scholar] [CrossRef]
- Bandello, F.; Tejerina, A.N.; Vujosevic, S.; Varano, M.A.; Egan, C.; Sivaprasad, S.; Menon, G.; Massin, P.; Verbraak, F.D.; Lund-Andersen, H.; et al. Retinal Layer Location of Increased Retinal Thickness in Eyes with Subclinical and Clinical Macular Edema in Diabetes Type 2. Ophthalmic Res. 2015, 54, 112–117. [Google Scholar] [CrossRef]
- Énzsöly, A.; Szabó, A.; Kántor, O.; Dávid, C.; Szalay, P.; Szabó, K.; Szél, Á.; Németh, J.; Lukáts, Á. Pathologic Alterations of the Outer Retina in Streptozotocin-Induced Diabetes. Investig. Opthalmology Vis. Sci. 2014, 55, 3686–3699. [Google Scholar] [CrossRef] [PubMed]
- Kern, T.S.; Berkowitz, B.A. Photoreceptors in diabetic retinopathy. J. Diabetes Investig. 2015, 6, 371–380. [Google Scholar] [CrossRef] [PubMed]
- Frizziero, L.; Parrozzani, R.; Londei, D.; Pilotto, E.; Midena, E. Quantification of vascular and neuronal changes in the peripapillary retinal area secondary to diabetic retinopathy. Br. J. Ophthalmol. 2020. [Google Scholar] [CrossRef]
- Kornfield, T.E.; Newman, E.A. Regulation of Blood Flow in the Retinal Trilaminar Vascular Network. J. Neurosci. 2014, 34, 11504–11513. [Google Scholar] [CrossRef] [PubMed]
- Onishi, A.C.; Nesper, P.L.; Roberts, P.K.; Moharram, G.A.; Chai, H.; Liu, L.; Jampol, L.M.; Fawzi, A.A. Importance of Considering the Middle Capillary Plexus on OCT Angiography in Diabetic Retinopathy. Investig. Opthalmol. Vis. Sci. 2018, 59, 2167–2176. [Google Scholar] [CrossRef]
- Kim, M.; Kim, R.-Y.; Park, W.; Park, Y.-G.; Kim, I.-B.; Park, Y.-H. Electroretinography and retinal microvascular changes in type 2 diabetes. Acta Ophthalmol. 2020. [Google Scholar] [CrossRef] [PubMed]
- Hasegawa, N.; Nozaki, M.; Takase, N.; Yoshida, M.; Ogura, Y. New Insights into Microaneurysms in the Deep Capillary Plexus Detected by Optical Coherence Tomography Angiography in Diabetic Macular Edema. Investig. Opthalmol. Vis. Sci. 2016, 57, OCT348–OCT355. [Google Scholar] [CrossRef]
- Park, J.J.; Soetikno, B.T.; Fawzi, A.A. Characterization of the middle capillary plexus using optical coherence tomography angiography in healthy and diabetic eyes. Retina 2016, 36, 2039–2050. [Google Scholar] [CrossRef] [PubMed]
- Cunha-Vaz, J.; Ribeiro, L.; Lobo, C. Phenotypes and biomarkers of diabetic retinopathy. Prog. Retina Eye Res. 2014, 41, 90–111. [Google Scholar] [CrossRef] [PubMed]
- Abramoff, M.D.; Fort, P.E.; Han, I.C.; Jayasundera, K.T.; Sohn, E.H.; Gardner, T.W. Approach for a Clinically Useful Comprehensive Classification of Vascular and Neural Aspects of Diabetic Retinal Disease. Investig. Opthalmol. Vis. Sci. 2018, 59, 519–527. [Google Scholar] [CrossRef]
- Kaizu, Y.; Nakao, S.; Arima, M.; Wada, I.; Yamaguchi, M.; Sekiryu, H.; Hayami, T.; Ishikawa, K.; Ikeda, Y.; Sonoda, K.-H. Capillary dropout is dominant in deep capillary plexus in early diabetic retinopathy in optical coherence tomography angiography. Acta Ophthalmol. 2019, 97, e811–e812. [Google Scholar] [CrossRef] [PubMed]
- Sacconi, R.; Corbelli, E.; Carnevali, A.; Mercuri, S.; Rabiolo, A.; Querques, L.; Marchini, G.; Bandello, F.; Querques, G. Optical coherence tomography angiography in pseudophakic cystoid macular oedema compared to diabetic macular oedema: Qualitative and quantitative evaluation of retinal vasculature. Br. J. Ophthalmol. 2018, 102, 1684–1690. [Google Scholar] [CrossRef]


| Control Group | noDR Group | DR Group | |
|---|---|---|---|
| Eyes, n. | 18 | 22 | 22 |
| Age, years, mean ± SD | 50.0 ± 14.8 | 51.9 ± 16.3 | 49.5 ±12.5 |
| Sex (M:F) | 4:5 | 6:5 | 6:5 |
| Duration, years, mean ± SD | NA | 14.5 ± 8.0 | 15.8 ± 9.3 |
| Type of DM (1:2) | NA | 3:8 | 4:7 |
| IOP, mmHg, mean ± SD | 15.8 ± 1.3 | 17.3 ± 1.9 | 16.2 ± 2.1 |
| Refractive error, diopters, mean ± SD | −0.15 ± 1.31 | −0.06 ± 1.17 | −0.22 ± 0.87 |
| BCVA, ETDRS score, mean ± SD | 85 ± 0 | 85 ± 0 | 85 ± 0 |
| Controls | All Diabetics Group | p-Value * | noDR Group | DR Group | p-Value * | |
|---|---|---|---|---|---|---|
| RNFL | 29.4 ± 2.5 | 28.7 ± 2.5 | 0.5899 | 29.0 ± 3.2 | 28.5 ± 1.5 | 0.7090 |
| GCL | 43.5 ± 1.6 | 42.5 ± 2.4 | 0.1653 | 42.9 ± 2.5 | 42.1 ± 2.4 | 0.0574 |
| IPL | 35.2 ± 1.3 | 35.0 ± 2.0 | 0.6570 | 35.1 ± 2.2 | 34.9 ± 1.8 | 0.8156 |
| INL | 35.3 ± 1.6 | 34.8 ± 1.5 | 0.2358 | 34.9 ± 1.5 | 34.8 ± 1.6 | 0.4925 |
| OPL | 29.7 ± 2.2 | 30.4 ± 3.0 | 0.4610 | 29.4 ± 2.7 | 31.5 ± 3.0 | 0.1052 |
| ONL | 66.2 ± 6.0 | 63.4 ± 8.9 | 0.4078 | 64.3 ± 7.0 | 62.5 ± 10.5 | 0.6387 |
| ORL | 80.5 ± 2.8 | 84.0 ± 13.2 | 0.0845 | 82.5 ± 3.0 | 85.5 ± 18.5 | 0.1896 |
Publisher’s Note: MDPI stays neutral with regard to jurisdictional claims in published maps and institutional affiliations. |
© 2020 by the authors. Licensee MDPI, Basel, Switzerland. This article is an open access article distributed under the terms and conditions of the Creative Commons Attribution (CC BY) license (http://creativecommons.org/licenses/by/4.0/).
Share and Cite
Frizziero, L.; Midena, G.; Longhin, E.; Berton, M.; Torresin, T.; Parrozzani, R.; Pilotto, E. Early Retinal Changes by OCT Angiography and Multifocal Electroretinography in Diabetes. J. Clin. Med. 2020, 9, 3514. https://doi.org/10.3390/jcm9113514
Frizziero L, Midena G, Longhin E, Berton M, Torresin T, Parrozzani R, Pilotto E. Early Retinal Changes by OCT Angiography and Multifocal Electroretinography in Diabetes. Journal of Clinical Medicine. 2020; 9(11):3514. https://doi.org/10.3390/jcm9113514
Chicago/Turabian StyleFrizziero, Luisa, Giulia Midena, Evelyn Longhin, Marianna Berton, Tommaso Torresin, Raffaele Parrozzani, and Elisabetta Pilotto. 2020. "Early Retinal Changes by OCT Angiography and Multifocal Electroretinography in Diabetes" Journal of Clinical Medicine 9, no. 11: 3514. https://doi.org/10.3390/jcm9113514
APA StyleFrizziero, L., Midena, G., Longhin, E., Berton, M., Torresin, T., Parrozzani, R., & Pilotto, E. (2020). Early Retinal Changes by OCT Angiography and Multifocal Electroretinography in Diabetes. Journal of Clinical Medicine, 9(11), 3514. https://doi.org/10.3390/jcm9113514