Application of Deep Learning in the Identification of Cerebral Hemodynamics Data Obtained from Functional Near-Infrared Spectroscopy: A Preliminary Study of Pre- and Post-Tooth Clenching Assessment

 ,
, 
Abstract
1. Introduction
2. Materials and Methods
2.1. Subjects
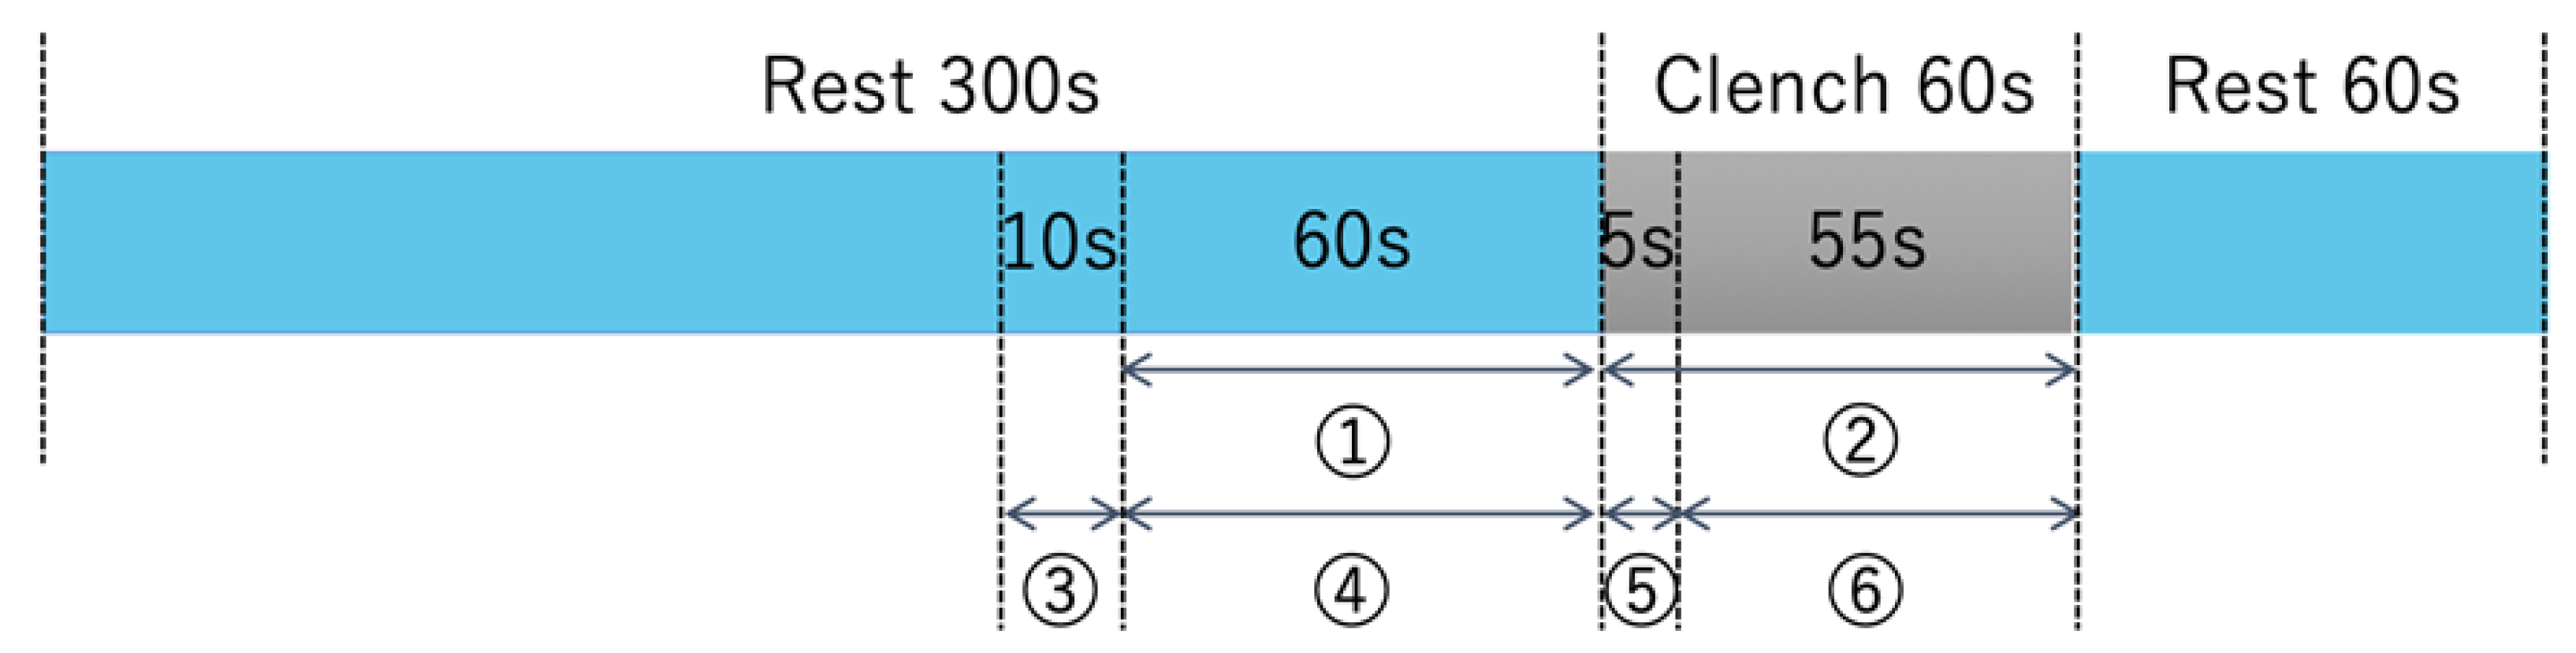
2.2. Exercise Task
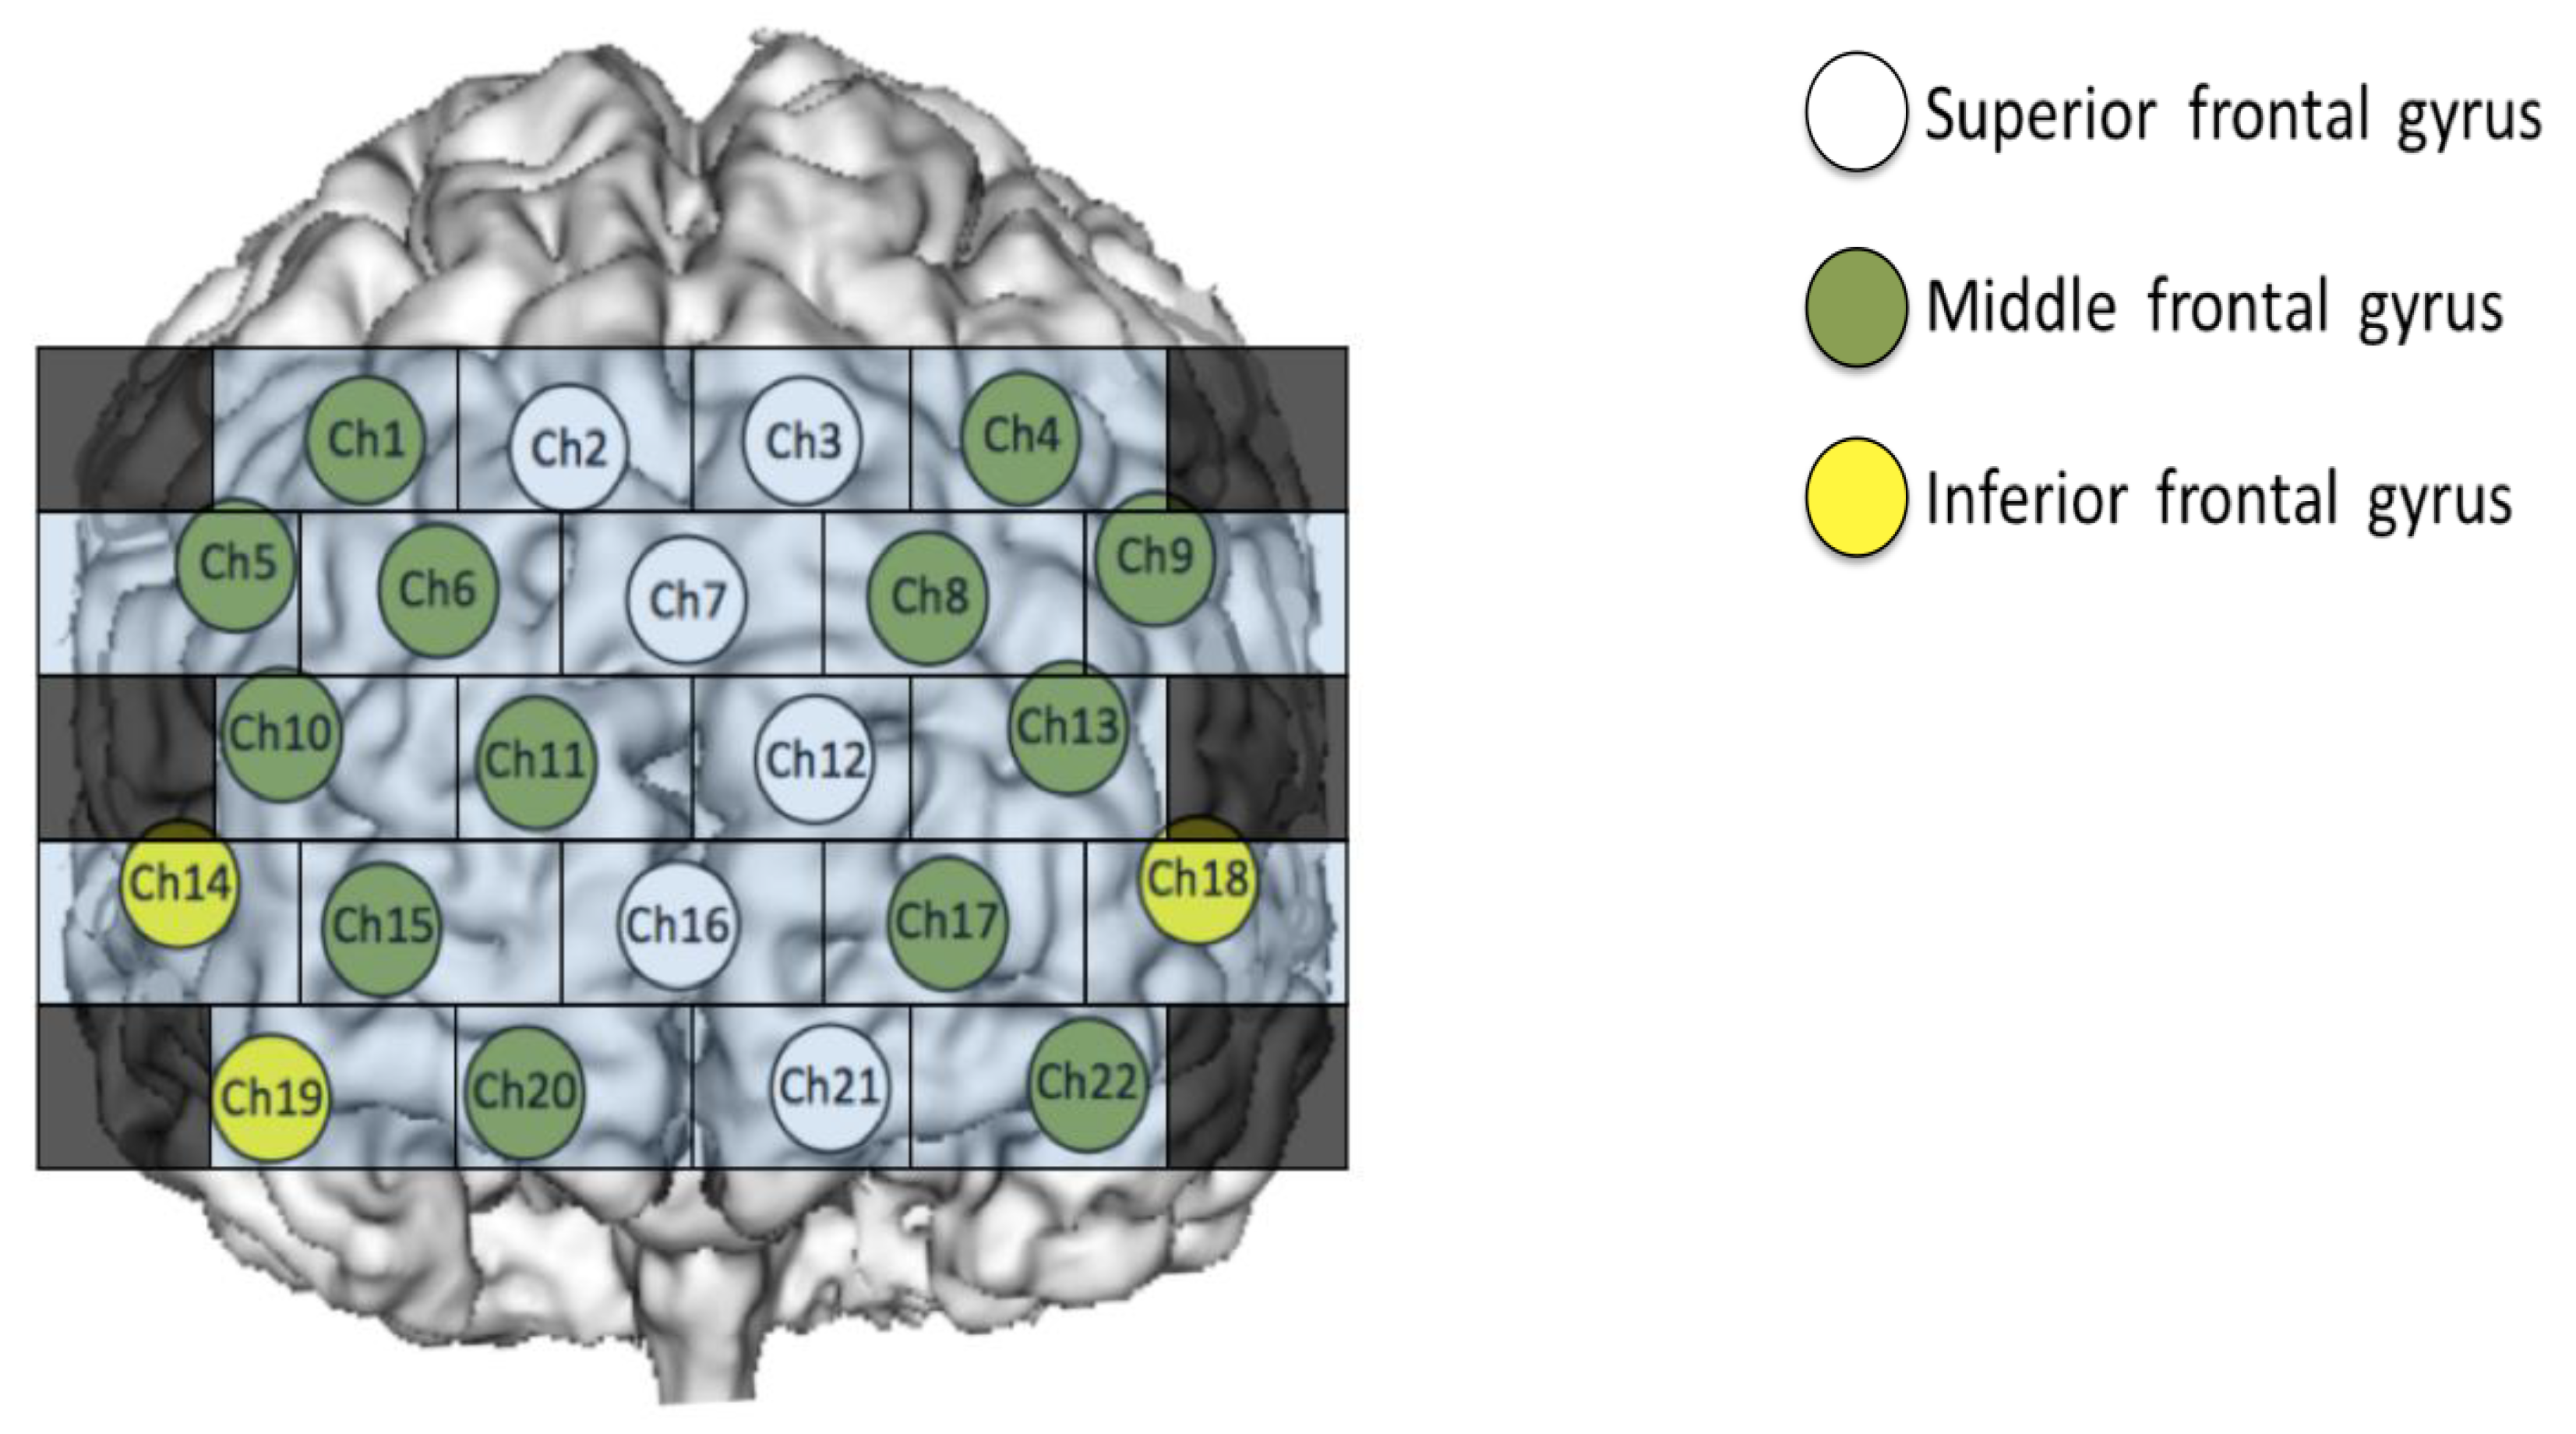
2.3. Measurement of Brain Function Using Functional Near-Infrared Spectroscopy (fNIRS)
2.4. Evaluation of Brain Activity Using Hemoglobin (Hb) Data
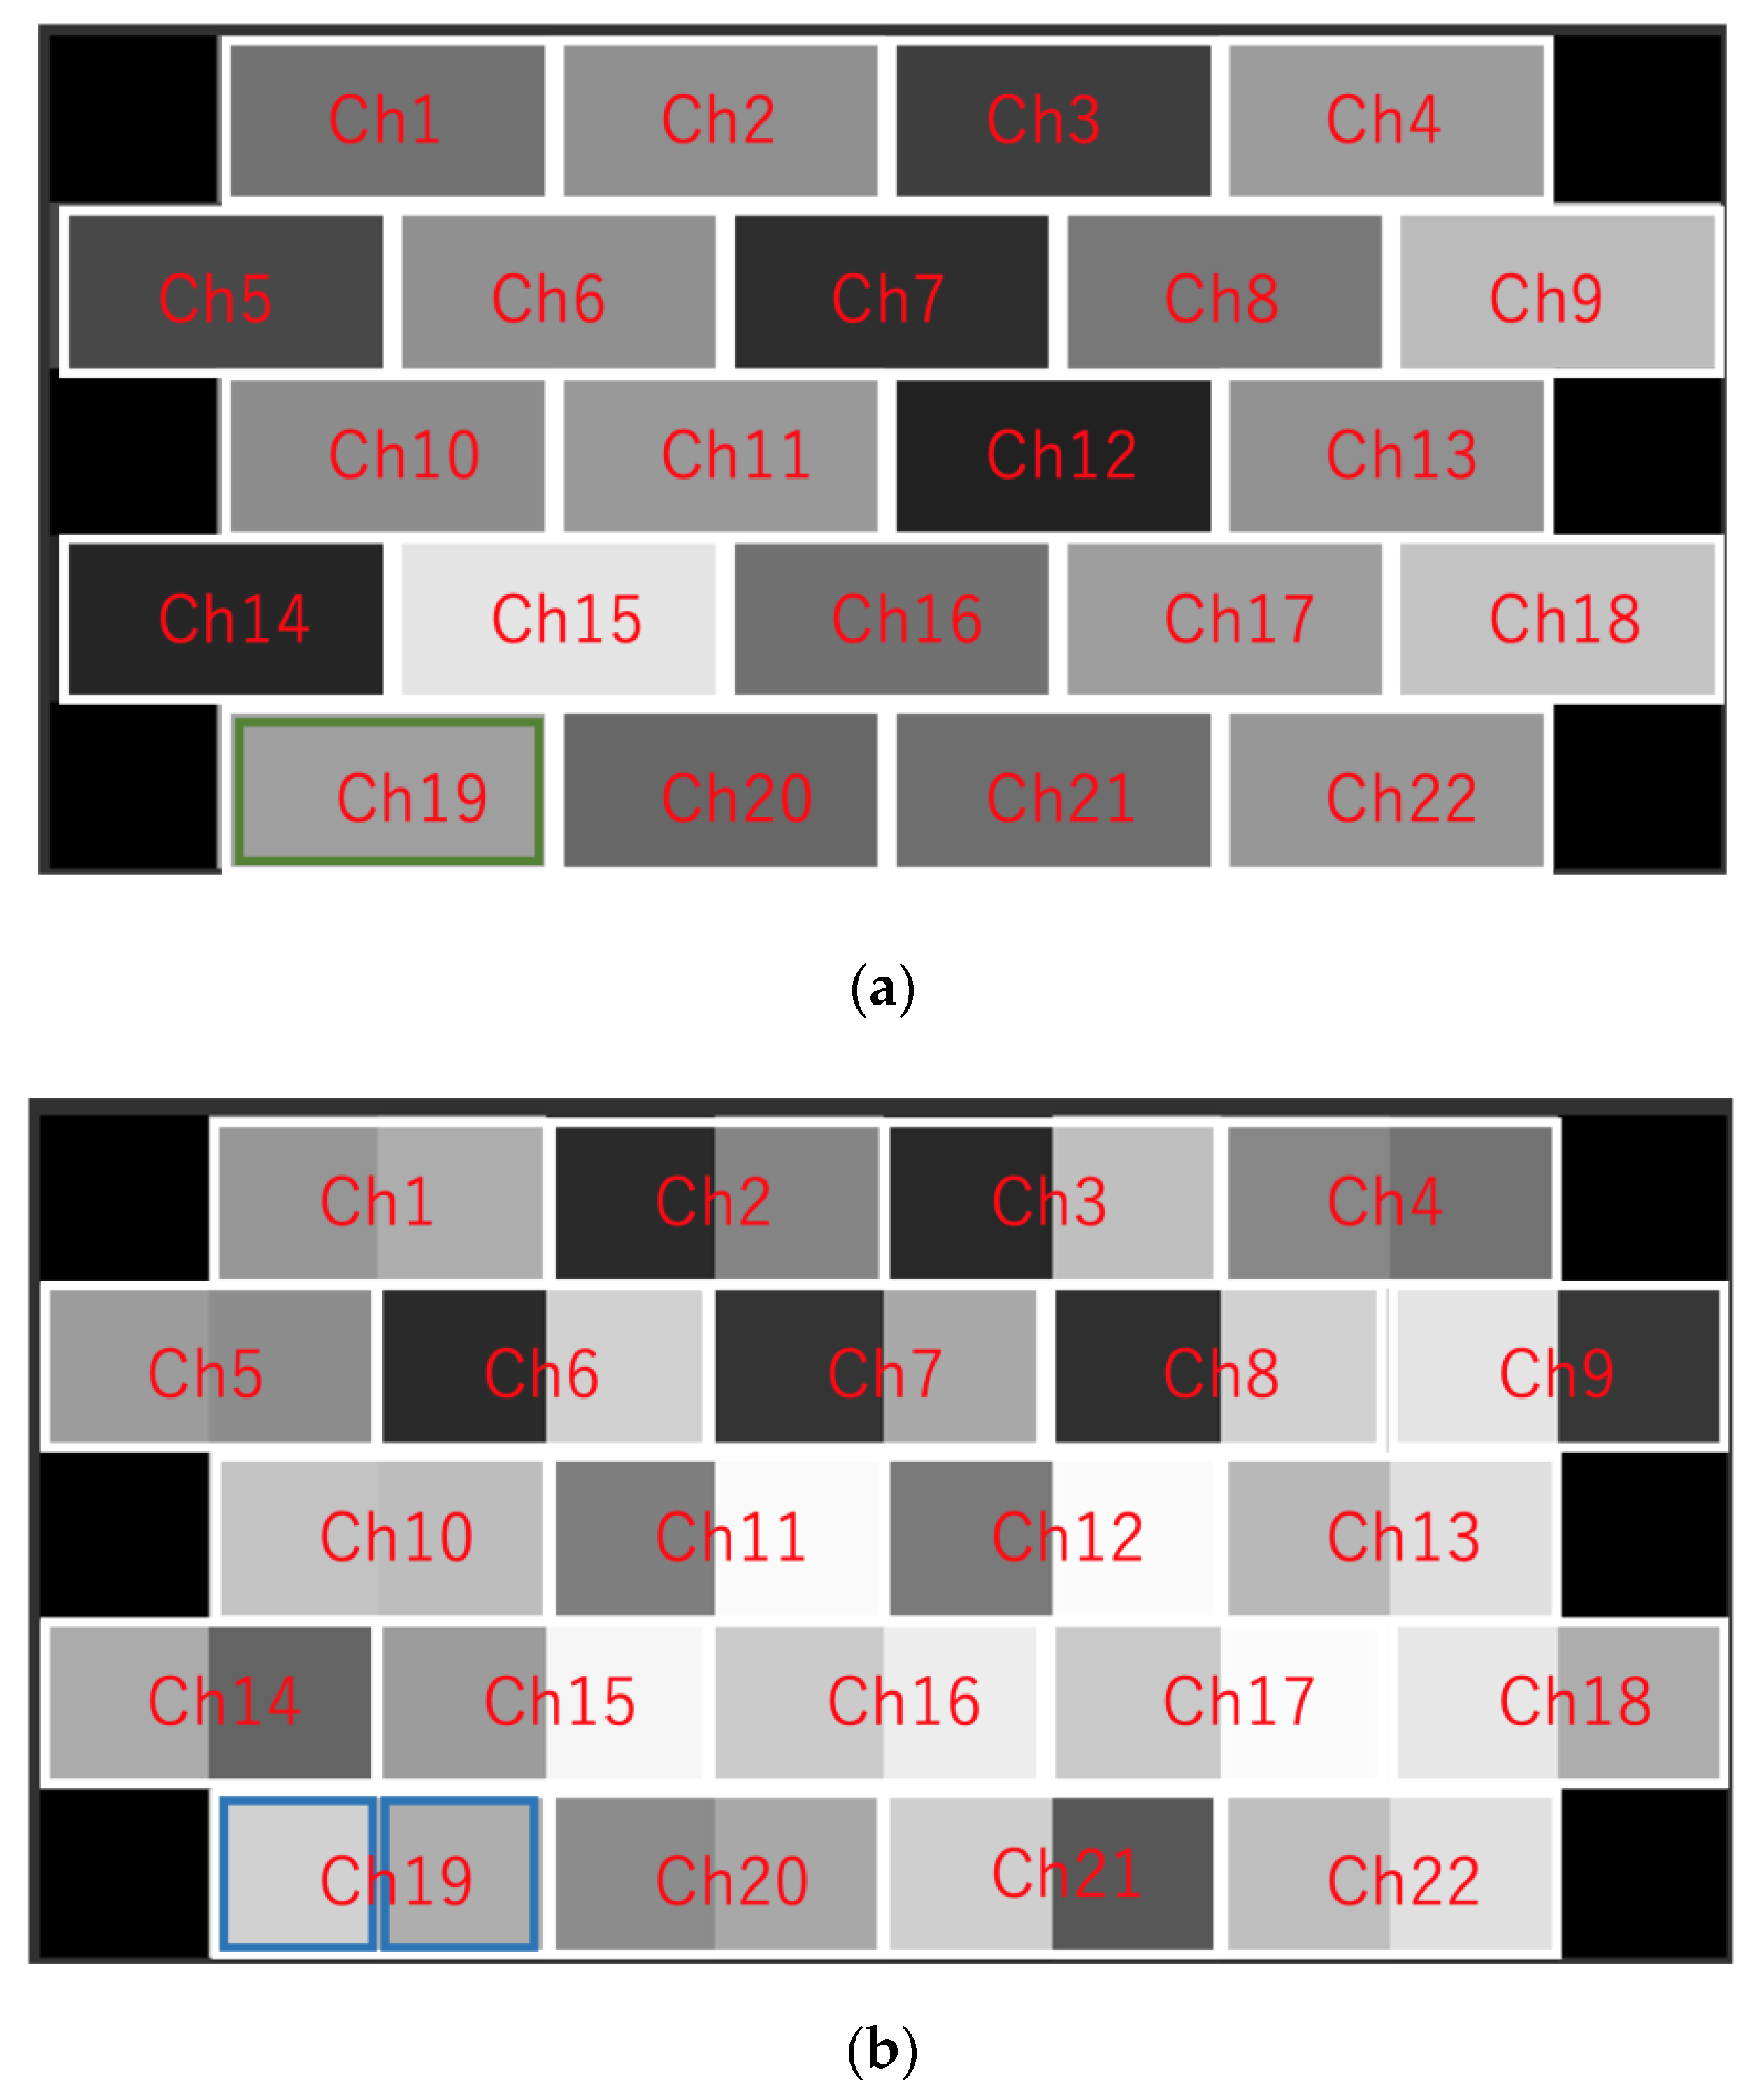
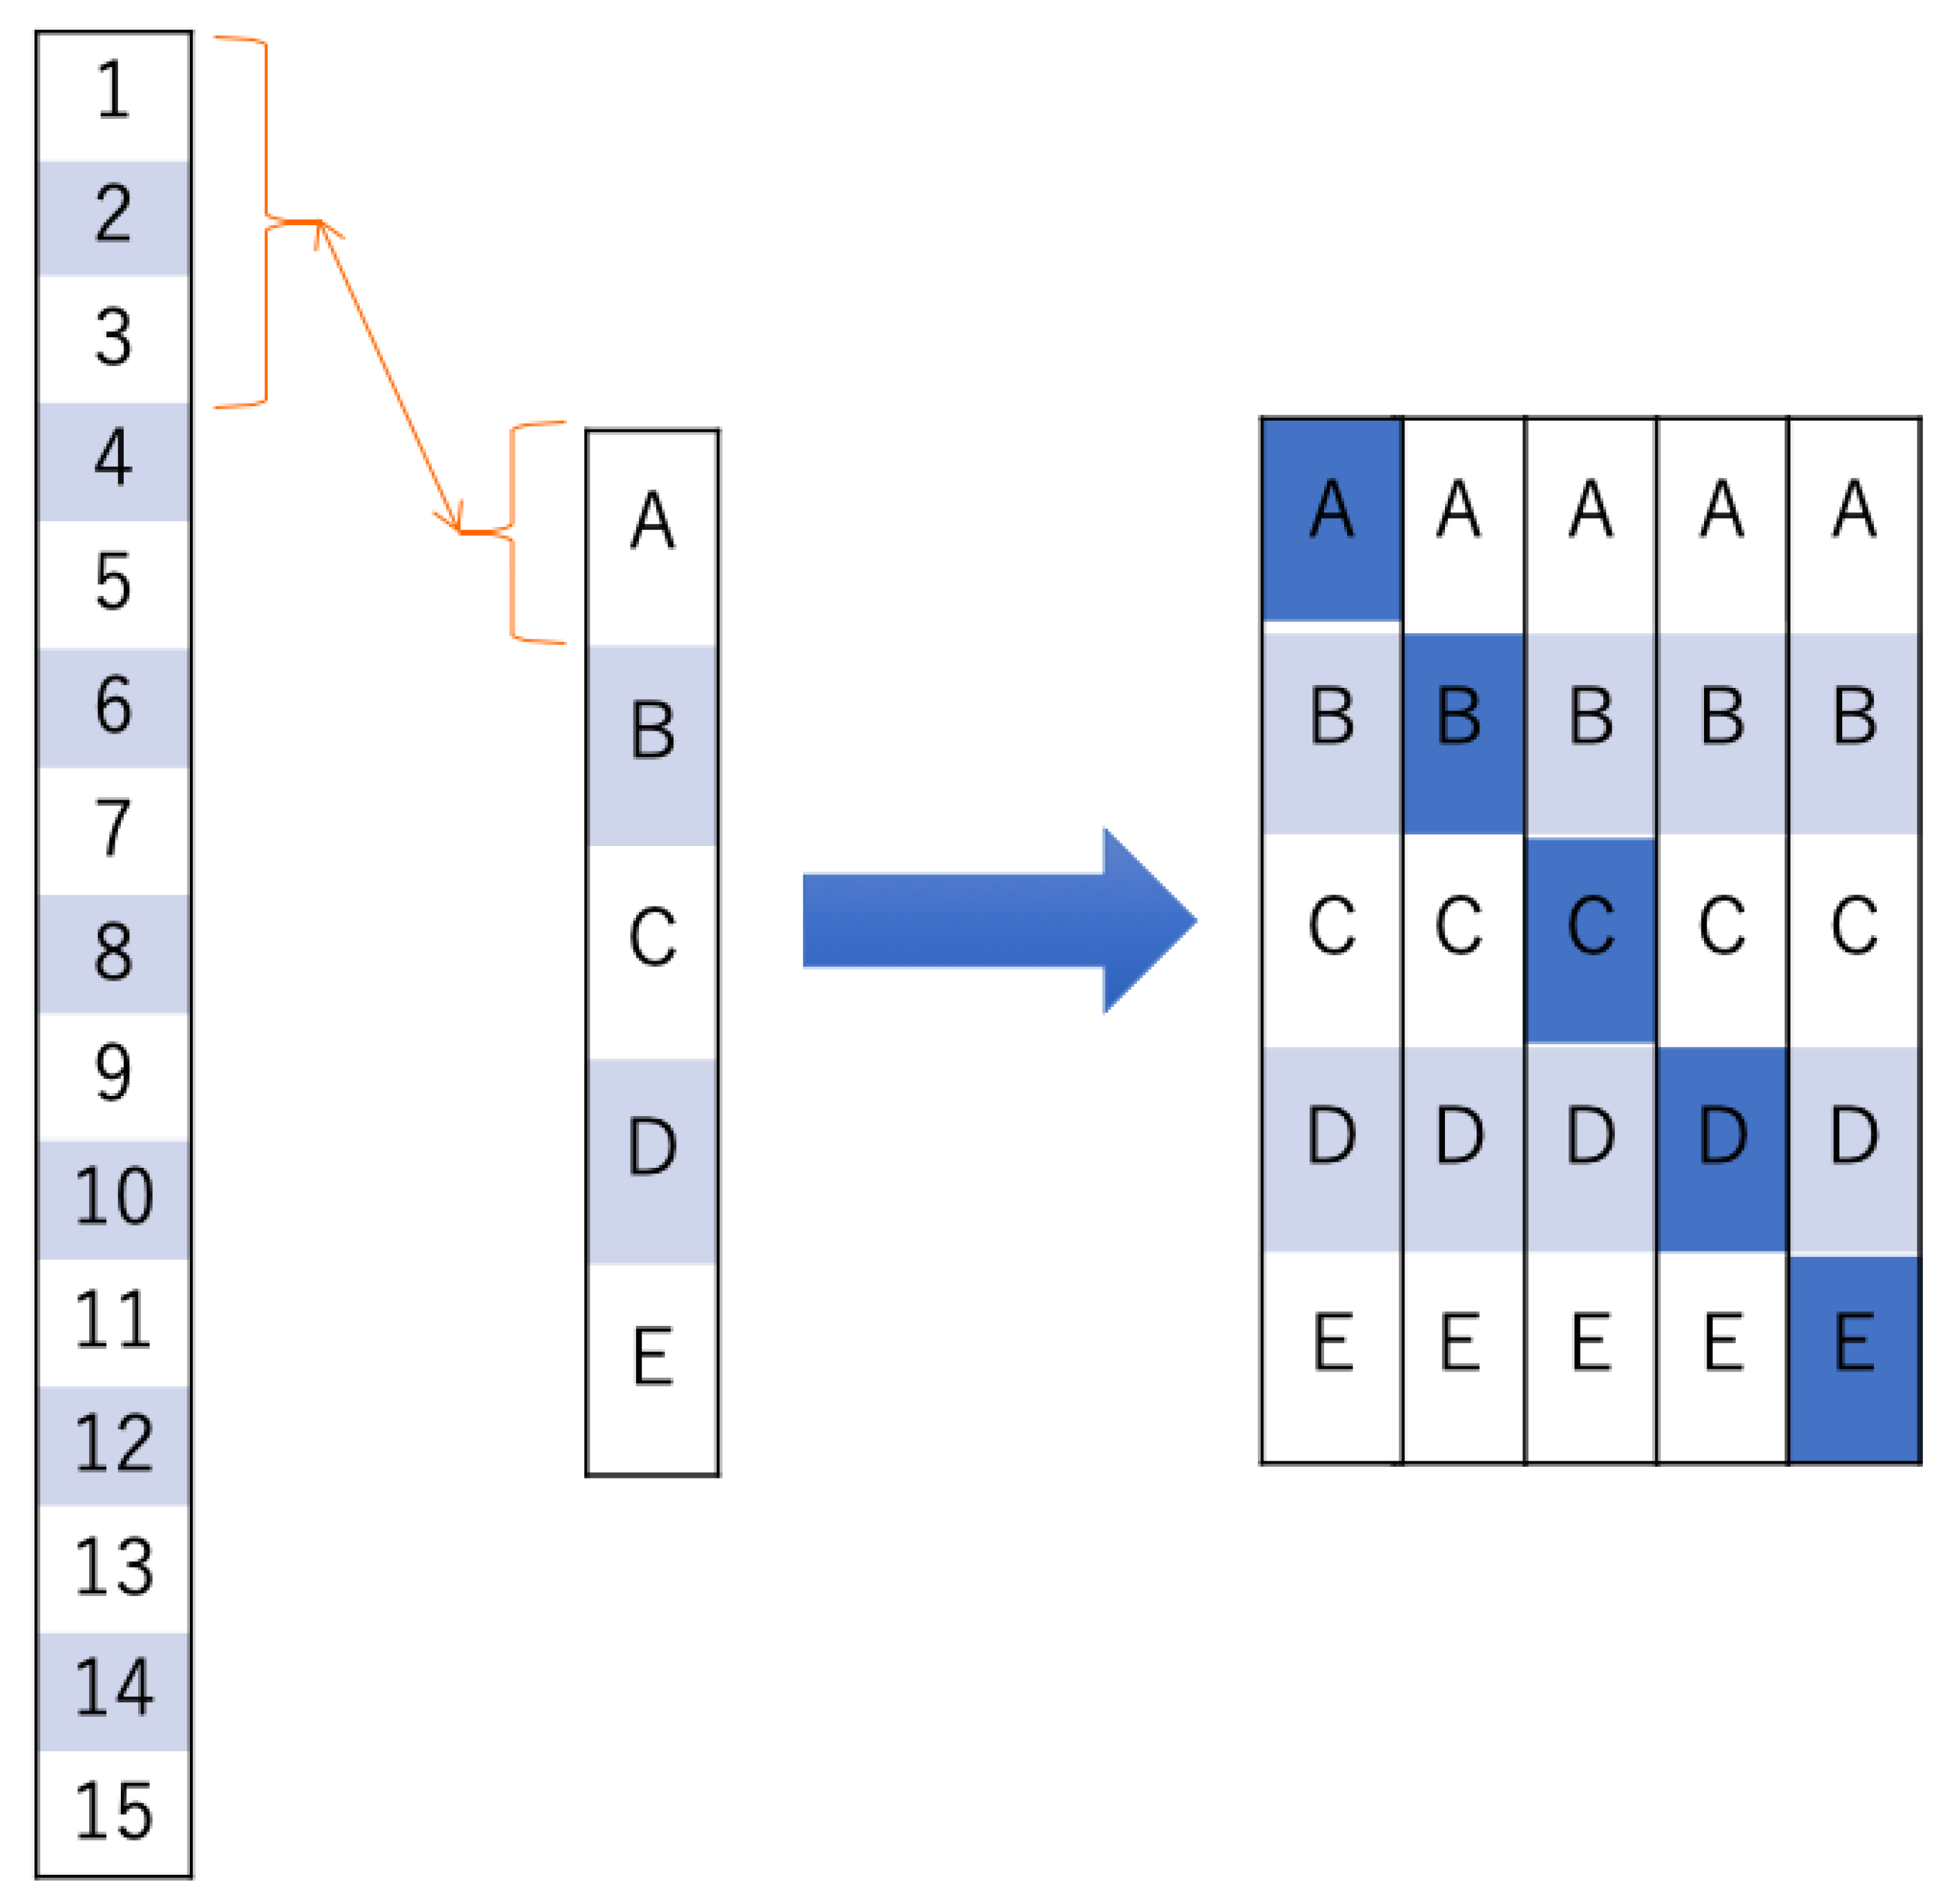
2.5. Evaluation of Brain Activity Using Deep Learning (DL)
3. Results
3.1. Evaluation of Brain Activity Using Hb Data
3.2. Identification Rate of Neural Network
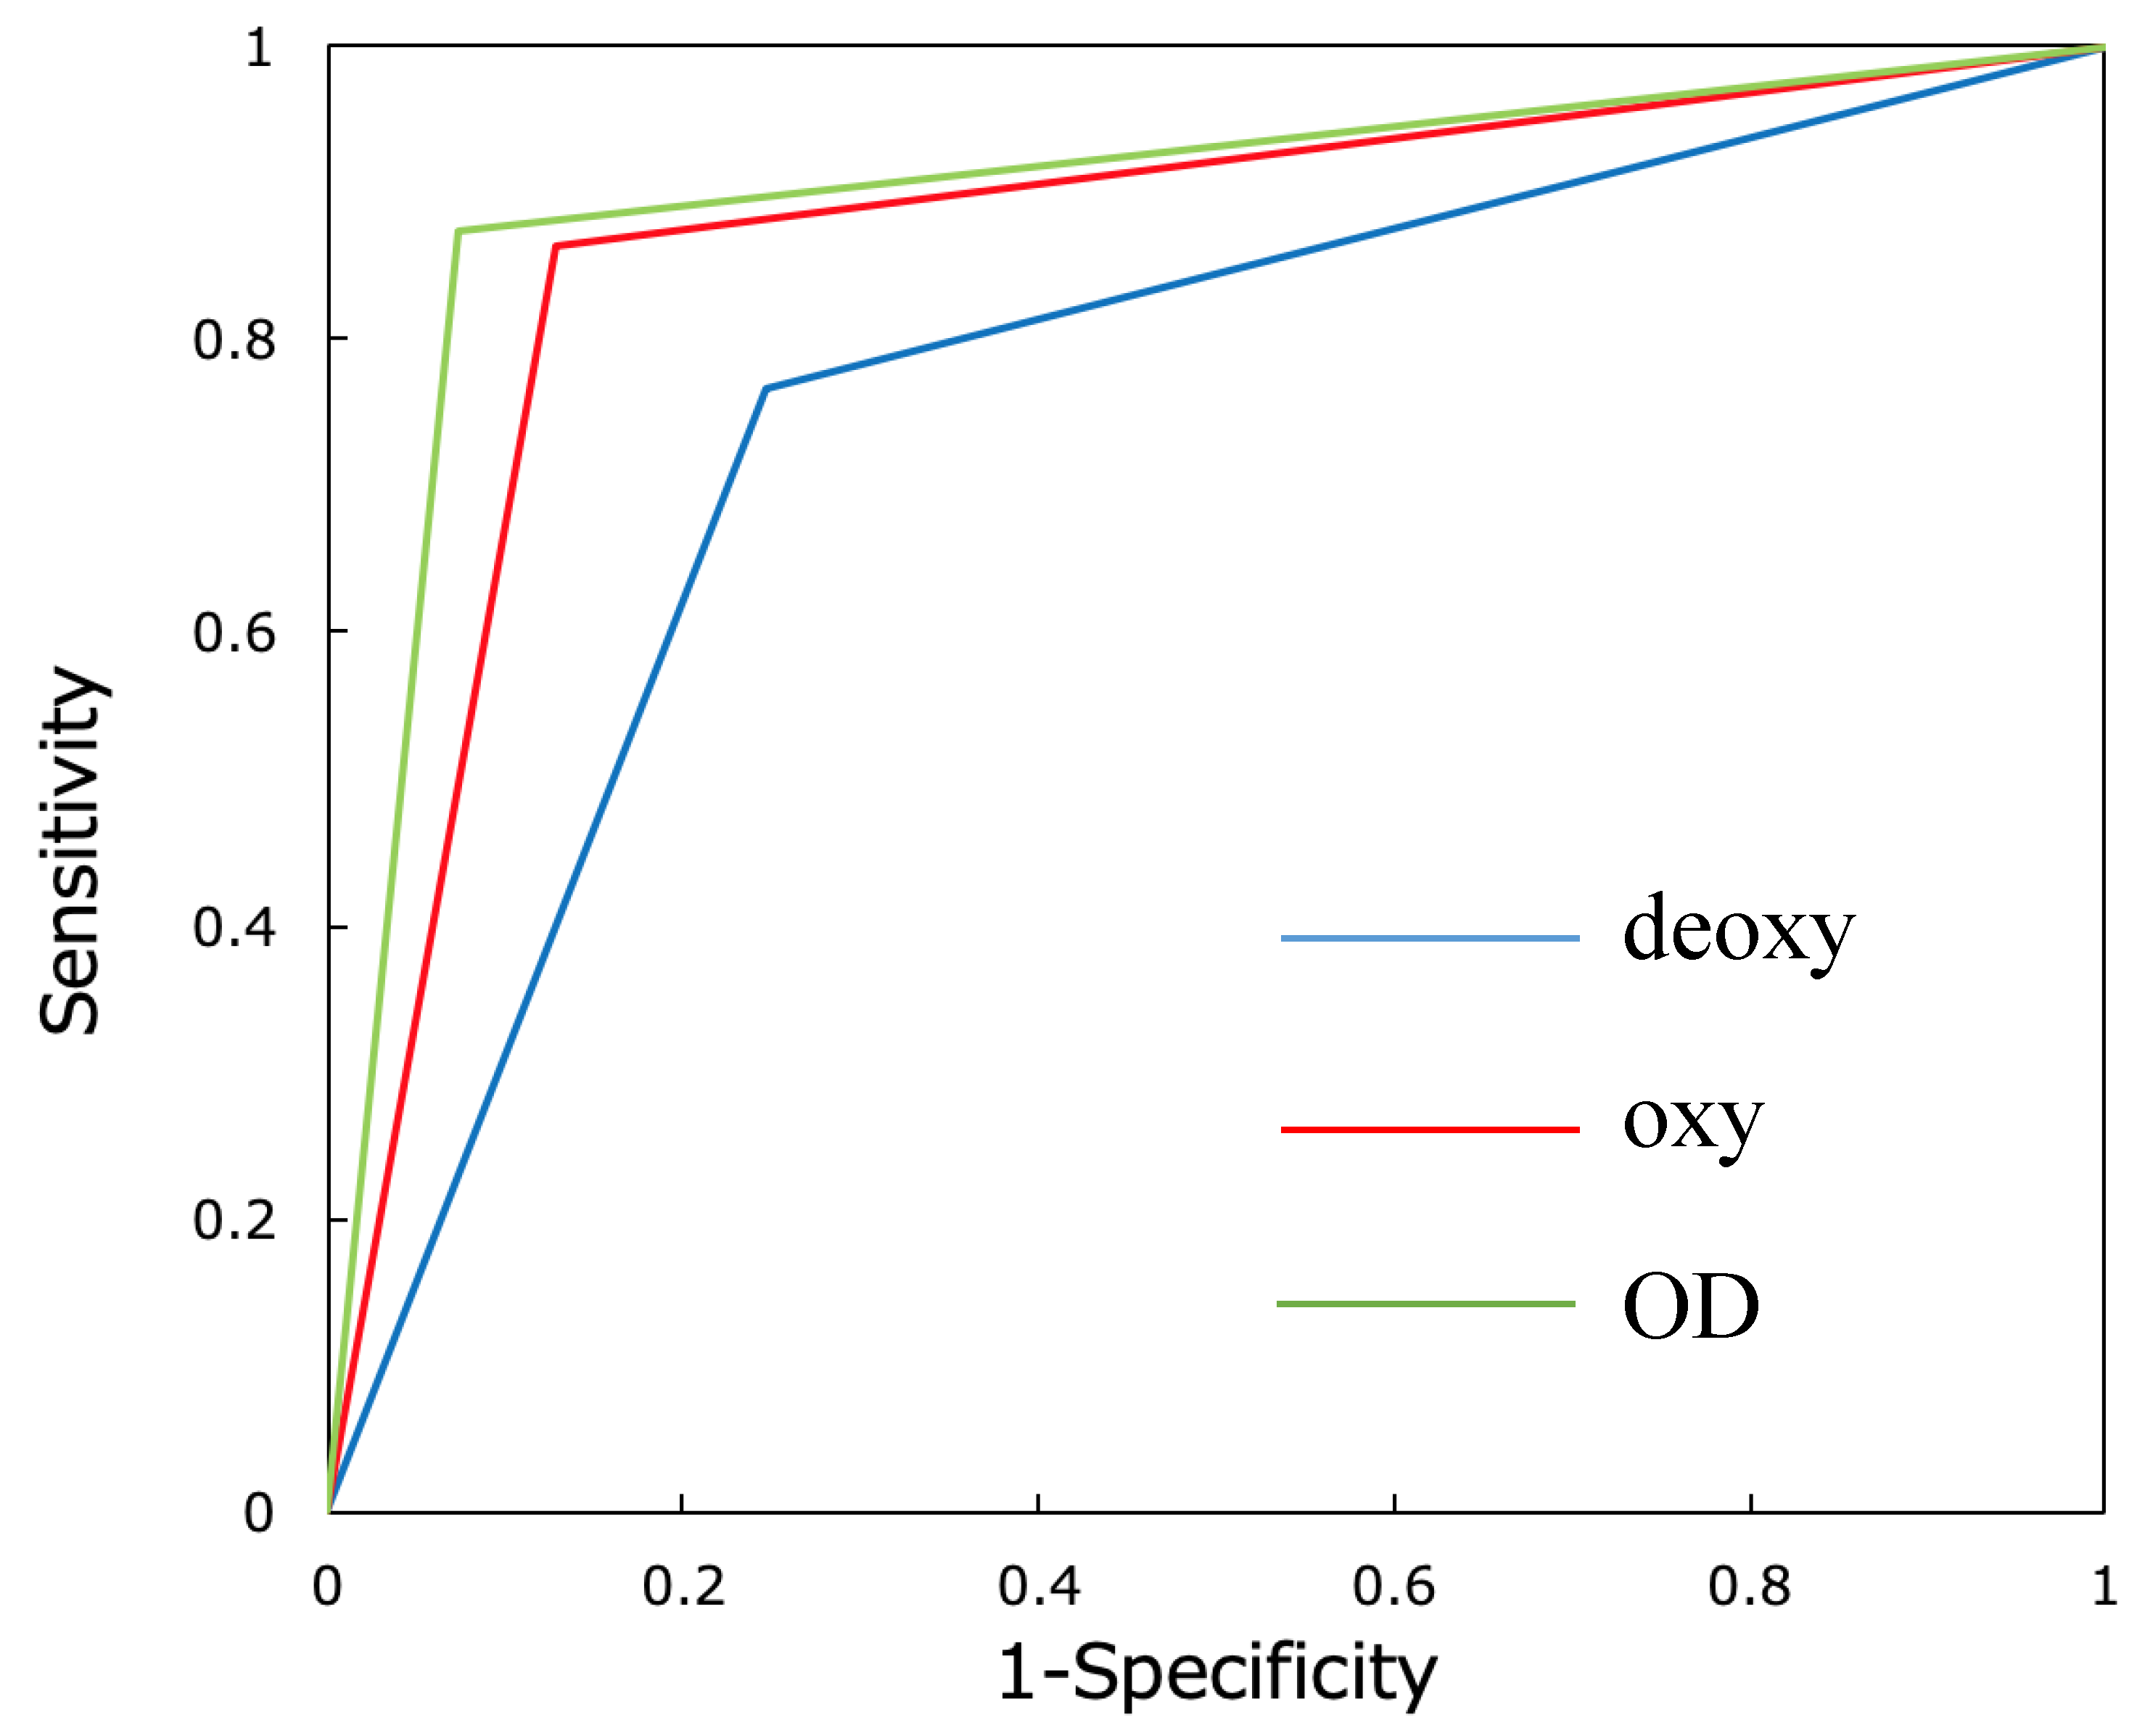
3.3. Verification of Identification Accuracy by Receiver Operating Characteristic (ROC) Curve Analysis
3.4. Comparison of Identification Accuracy with the Number of Images Identified for Verification
4. Discussion
4.1. Evaluation of Brain Activity Using Hb Data
4.2. Evaluation of Brain Activity Using DL
4.3. Limitations of the Study
5. Conclusions
Author Contributions
Funding
Conflicts of Interest
References
- Rhyu, I.J.; Bytheway, J.A.; Kohler, S.J.; Lange, H.; Lee, K.J.; Boklewski, J.; McCormick, K.; Williams, N.I.; Stanton, G.B.; Greenough, W.T.; et al. Effects of aerobic exercise training on cognitive function and cortical vascularity in monkeys. Neuroscience 2010, 167, 1239–1248. [Google Scholar] [PubMed]
- Banu, R.F.; Veeravalli, P.T.; Kumar, V.A. Comparative evaluation of changes in brain activity and congnitive function of edentulous patients, with dentures and two-implant supported mandibular Overdenture—Pilot study. Clin. Implant Dent. Relat. Res. 2016, 18, 580–587. [Google Scholar]
- Hirano, Y.; Obata, T.; Kashikura, K.; Nonaka, H.; Tachibana, A.; Ikehira, H.; Onozuka, M. Effects of chewing in working memory processing. Neurosci. Lett. 2008, 436, 189–192. [Google Scholar] [PubMed]
- Sakuma, S.; Kojima, H.; Takenaka, M.; Hattori, H.; Adachi, M.; Tsuchiya, A.; Hishikawa, T.; Ito, Y.; Tanaka, Y. Effect of tooth clenching level on prefrontal cortex activity: Examination using functional near-infrared spectroscopy. Aichi-Gakuin. Dent. Sci. 2014, 27, 29–35. [Google Scholar]
- Sakuma, S.; Kojima, H.; Takenaka, M.; Hattori, H.; Adachi, M.; Tsuchiya, A.; Hishikawa, T.; Ito, Y.; Tanaka, Y. Effect of different mastication periods on prefrontal cortical activity: Examination activity: Examination using functional near-infrared spectroscopy. Aichi-Gakuin. Dent. Sci. 2014, 27, 1–7. [Google Scholar]
- Ferrari, M.; Quaresima, V. A brief review on the history of human functional near-infrared spectroscopy (fNIRS) development and fields of application. NeuroImage 2012, 63, 921–935. [Google Scholar]
- Torricelli, A.; Contini, D.; Pifferi, A.; Caffini, M.; Re, R.; Zucchelli, L.; Spinelli, L. Time domain functional NIRS imaging for human brain mapping. NeuroImage 2014, 85, 28–50. [Google Scholar]
- Takizawa, R.; Fukuda, M.; Kawasaki, S.; Kasai, K.; Mimura, M.; Pu, S.; Noda, T.; Niwa, S.-I.; Okazaki, Y. Neuroimaging‒aided differential diagnosis of the depressive state. Neuroimage 2014, 85, 498–507. [Google Scholar]
- Watanabe, H.; Homae, F.; Tagaac, G. General to specific development of functional activation in the cerebral cortexes of 2- to 3-month-old infants. NeuroImage 2010, 50, 1536–1544. [Google Scholar]
- Samra, S.K.; Dy, E.A.; Welch, K.; Dorje, P.; Zelenock, G.B.; Stanley, J.C. Evaluation of a cerebral oximeter as a monitor of cerebral ischemia during carotid endarterectomy. Anesthesiology 2000, 93, 964–970. [Google Scholar]
- Miyai, I.; Yagura, H.; Hatakenaka, M.; Oda, I.; Konishi, I.; Kubota, K. Longitudinal optical imaging study for locomotor recovery after stroke. Stroke 2003, 34, 2866–2870. [Google Scholar] [CrossRef] [PubMed]
- Maier, A.; Syben, C.; Lasser, T.; Riess, C. A gentle introduction to deep learning in medical image processing. Z. Med. Phys. 2019, 29, 86–101. [Google Scholar] [CrossRef]
- Zaharchuk, G.; Gong, E.; Wintermark, M.; Rubin, D.; Langlotz, C.P. Deep learning in neuroradiology. AJNR Am. J. Neuroradiol. 2018, 39, 1776–1784. [Google Scholar] [CrossRef] [PubMed]
- Gupta, A.; Harrison, P.J.; Weislander, H.; Pielawski, N.; Kartasalo, K.; Partel, G.; Solorzano, L.; Suveer, A.; Klemm, A.H.; Spjuth, O.; et al. Deep learning in image cytometry: A review. Cytom. Part A 2019, 95A, 366–380. [Google Scholar] [CrossRef] [PubMed]
- Zhou, X.; Takayama, R.; Wang, S.; Zhou, X.; Hara, T.; Fujita, H. Automated segmentation of 3D anatomical structures on CT images by using a deep convolutional network based on end-to-end learning approach. In Proceedings of the SPIE Medical Imaging: Image Processing, Orlando, FL, USA, 11–16 February 2017. [Google Scholar]
- Bobo, M.F.; Bao, S.; Huo, Y.; Yao, Y.; Virostko, J.; Plassard, A.J.; Lyu, I.; Assad, A.; Abramson, R.G.; Hilmes, M.A.; et al. Fully convolutional neural networks improve abdominal organ segmentation. In Proceedings of the SPIE Medical Imaging: Image Processing, Houston, TX, USA, 10–15 February 2018. [Google Scholar]
- Gao, X.W.; Hui, R.; Tian, Z. Classification of CT brain images based on deep learning networks. Comput. Methods Programs Biomed. 2017, 138, 49–56. [Google Scholar] [CrossRef] [PubMed]
- Zhao, X.; Wu, Y.; Song, G.; Li, Z.; Zhang, Y.; Fan, Y. A deep learning model integrating FCNNs and CRFs for brain tumor segmentation. Med. Image Anal. 2017, 43, 98–111. [Google Scholar] [CrossRef] [PubMed]
- Ariji, Y.; Fukuda, M.; Kise, Y.; Nozawa, M.; Yanashita, Y.; Fujita, H.; Katsumata, A.; Ariji, E. Contrast-enhanced computed tomography image assessment of cervical lymph node metastasis in patients with oral cancer by using a deep learning system of artificial intelligence. Oral Surg. Oral Med. Oral Pathol. Oral Radiol. 2019, 127, 458–463. [Google Scholar] [CrossRef] [PubMed]
- Gibbs, C.H.; Mahan, P.E.; Lundeen, H.C.; Brehnan, K.; Walsh, E.K.; Holbrook, W.B. Occlusal forces during chewing and swallowing as measured by sound transmission. J. Prosthet. Dent. 1981, 46, 443–449. [Google Scholar] [CrossRef]
- Yamashita, Y.; Maki, A.; Koizumi, H. Measurement system for noninvasive dynamic optical topography. J. Biomed. Opt. 1999, 4, 414–417. [Google Scholar] [CrossRef]
- Hoshi, Y. Functional near-infrared optical imaging: Utility and limitations in human brain mapping. Psychophysiology 2003, 40, 511–520. [Google Scholar] [CrossRef]
- Petzold, G.C.; Murthy, V.N. Role of astrocytes in neurovascular coupling. Neuron 2011, 71, 782–797. [Google Scholar] [CrossRef] [PubMed]
- Kirilina, E.; Jelzow, A.; Heine, A.; Niessing, M.; Wabnitz, H.; Brühl, R.; Ittermann, B.; Jacobs, A.M.; Tachtsidis, I. The physiological origin of task-evoked systemic artefacts in functional near infrared spectroscopy. Neuroimage 2012, 61, 70–81. [Google Scholar] [CrossRef]
- Jasper, H.H. The ten-twenty electrode system of the International Federation. Electroencephalogr. Clin. Neurophysiol. 1958, 10, 367–380. [Google Scholar]
- Tsuzuki, D.; Jurcak, V.; Singh, A.K.; Okamoto, M.; Watanabe, E.; Dan, I. Virtual spatial registration of stand-alone fNIRS data to MNI space. Neuloimage 2007, 34, 1506–1518. [Google Scholar] [CrossRef] [PubMed]
- Sakuma, S.; Inamoto, K.; Higuchi, N.; Ariji, Y.; Nakayama, M.; Izumi, M. Experimental pain in the gingiva and its impact on prefrontal cortical hemodynamics: A functional near-infrared spectroscopy study. Neurosci. Lett. 2014, 575, 74–79. [Google Scholar] [CrossRef]
- Iida, T.; Sakayanagi, M.; Svensson, P.; Komiyama, O.; Hirayama, T.; Kaneda, T.; Sakatani, K.; Kawara, M. Influence of periodontal afferent inputs for human cerebral blood oxygenation during jaw movements. Exp. Brain Res. 2012, 216, 375–384. [Google Scholar] [CrossRef]
- Sato, H.; Obata, A.N.; Moda, I.; Ozaki, K.; Yasuhara, T.; Yamamoto, Y.; Kiguchi, M.; Maki, A.; Kubota, K.; Koizumi, H. Application of near-infrared spectroscopy to measurement of hemodynamic signals accompanying stimulated saliva secretion. J. Biomed. Opt. 2011, 16, 047002. [Google Scholar] [CrossRef]
- Taoka, T.; Iwasaki, S.; Uchida, H.; Fukusumi, A.; Nakagawa, H.; Kichikawa, K.; Takayama, K.; Yoshioka, T.; Takewa, M.; Ohishi, H. Age correlation of the time lag in signal change on EPI-fMRI. J. Comput. Assist. Tomogr. 1998, 22, 514–517. [Google Scholar] [CrossRef]
- Izzetoglu, M.; Chitrapu, P.; Bunce, S.; Onaral, B. Motion Artifact Cancellation in NIR Spectroscopy using discrete Kalman filtering. BioMed. Engin. OnLine 2010, 9, 16. [Google Scholar] [CrossRef]
- Cui, X.; Bray, S.; Reiss, A.L. Functional near infrared spectroscopy (NIRS) signal improvement based on negative correlation between oxygenated and deoxygenated hemoglobin dynamics. Neuroimage 2010, 49, 3039–3046. [Google Scholar] [CrossRef] [PubMed]
- He, H.; Garcia, E.A. Learning from imbalanced data. IEEE Trans. Knowl. Data Eng. 2009, 21, 1263–1284. [Google Scholar]
- Krizhevsky, A.; Sutskever, I.; Hinton, G.E. ImageNet classification with deep convolutional neural networks. Commun. ACM 2012, 25, 1090–1098. [Google Scholar]
- Fox, P.T.; Raichle, M.E. Focal physiological uncoupling of cerebral blood flow and oxidative metabolism during somatosensory stimulation in human subjects. Proc. Natl. Acad. Sci. USA 1986, 83, 1140–1144. [Google Scholar] [PubMed]
- Sakatani, K.; Xie, Y.; Lichty, W.; Li, S.; Zuo, H. Language-activated cerebral blood oxygenation and hemodynamic changes of the left prefrontal cortex in poststroke aphasic patients: A near-infrared spectroscopy study. Stroke 1998, 29, 1299–1304. [Google Scholar]
- Sakatani, K.; Lichty, W.; Xie, Y.; Li, S.; Zuo, H. Effects of aging on language-activated cerebral blood oxygenation changes of the left prefrontal cortex: Near infrared spectroscopy study. J. Stroke Cerebrovasc. Dis. 1999, 8, 398–403. [Google Scholar] [PubMed]
- Hoshi, Y.; Kobayashi, N.; Tamura, M. Interpretation of near-infrared spectroscopy signals: A study with a newly developed perfused rat brain model. J. Appl. Physiol. 2001, 90, 1657–1662. [Google Scholar]
- Kamiya, K.; Narita, N.; Iwaki, S. Improved Prefrontal Activity and Chewing Performance as Function of Wearing Denture in Partially Edentulous Elderly Individuals: Functional Near-Infrared Spectroscopy Study. PLoS ONE 2016, 11, e0158070. [Google Scholar] [CrossRef]
- Taga, G.; Watanabe, H.; Homae, F. Spatial variation in the hemoglobin phase of oxygenation and deoxygenation in the developing cortex of infants. Neurophotonics 2018, 5, 011017. [Google Scholar]
- Dravida, S.; Noah, J.A.; Zhang, X.; Hirsch, J. Comparison of oxyhemoglobin and deoxyhemoglobin signal reliability with and without global mean removal for digit manipulation motor tasks. Neurophotonics 2018, 5, 011006. [Google Scholar] [CrossRef] [PubMed]


| Prediction Rest | Prediction Clench | |
|---|---|---|
| Correct Rest | True-Negative | False-Positive |
| Correct Clench | False-Negative | True-Positive |
| Channels | Oxy-Hb Change | p-Value | Channels | Oxy-Hb Change | p-Value |
|---|---|---|---|---|---|
| Ch1 | 0.038 ± 0.134 | 6.83 | Ch12 | −0.043 ± 0.360 | 14.46 |
| Ch2 | −0.021 ± 0.151 | 13.27 | Ch13 | 0.092 ± 0.252 | 4.22 |
| Ch3 | −0.006 ± 0.125 | 19.14 | Ch14 | 0.084 ± 0.553 | 12.69 |
| Ch4 | 0.027 ± 0.104 | 7.54 | Ch15 | 0.080 ± 0.182 | 2.68 |
| Ch5 | 0.057 ± 0.200 | 6.67 | Ch16 | −0.040 ± 0.306 | 12.20 |
| Ch6 | −0.006 ± 0.124 | 18.71 | Ch17 | −0.098 ± 0.540 | 11.19 |
| Ch7 | −0.044 ± 0.229 | 10.67 | Ch18 | 0.179 ± 0.196 | 0.09 |
| Ch8 | −0.033 ± 0.242 | 13.58 | Ch19 | 0.305 ± 0.247 | 0.01 |
| Ch9 | 0.097 ± 0.095 | 0.04 | Ch20 | 0.093 ± 0.356 | 7.63 |
| Ch10 | 0.128 ± 0.158 | 0.20 | Ch21 | 0.061 ± 0.293 | 9.88 |
| Ch11 | −0.032 ± 0.221 | 13.00 | Ch22 | 0.132 ± 0.320 | 3.20 |
| Channels | Deoxy-Hb Change | p-Value | Channels | Deoxy-Hb Change | p-Value |
|---|---|---|---|---|---|
| Ch1 | −0.029 ± 0.041 | 0.42 | Ch12 | −0.023 ± 0.054 | 3.03 |
| Ch2 | −0.025 ± 0.053 | 2.09 | Ch13 | −0.013 ± 0.059 | 9.23 |
| Ch3 | −0.027 ± 0.047 | 1.08 | Ch14 | 0.240 ± 0.515 | 2.27 |
| Ch4 | −0.042 ± 0.087 | 2.03 | Ch15 | −0.041 ± 0.079 | 1.52 |
| Ch5 | 0.043 ± 0.190 | 9.13 | Ch16 | −0.074 ± 0.108 | 0.47 |
| Ch6 | −0.030 ± 0.052 | 1.09 | Ch17 | −0.119 ± 0.288 | 3.19 |
| Ch7 | −0.045 ± 0.039 | 0.02 | Ch18 | 0.078 ± 0.180 | 2.78 |
| Ch8 | −0.036 ± 0.048 | 0.30 | Ch19 | 0.068 ± 0.126 | 1.40 |
| Ch9 | −0.021 ± 0.112 | 10.95 | Ch20 | −0.037 ± 0.123 | 6.40 |
| Ch10 | 0.016 ± 0.108 | 12.79 | Ch21 | −0.028 ± 0.093 | 6.34 |
| Ch11 | −0.028 ± 0.051 | 1.32 | Ch22 | −0.068 ± 0.240 | 6.78 |
| Identification RateGroups | Accuracy (%) | Recall (%) | Specificity (%) | Precision (%) | F-Value |
|---|---|---|---|---|---|
| Group A | 78.0 | 75.1 | 80.9 | 79.7 | 0.773 |
| Group B | 84.4 | 86.0 | 82.9 | 83.4 | 0.847 |
| Group C | 88.1 | 97.9 | 78.4 | 81.9 | 0.892 |
| Group D | 98.4 | 97.3 | 99.5 | 99.5 | 0.984 |
| Group E | 85.3 | 77.2 | 93.5 | 92.2 | 0.840 |
| Average ± SD | 86.8 ± 7.4 | 86. 7 ± 10.8 | 87.0 ± 9.0 | 87.3 ± 8.3 | 0.867 ± 0.078 |
| Identification Rate Groups | Accuracy (%) | Recall (%) | Specificity (%) | Precision (%) | F-Value |
|---|---|---|---|---|---|
| Group A | 56.2 | 62.8 | 49.7 | 55.5 | 0.590 |
| Group B | 86.2 | 90.8 | 81.6 | 83.2 | 0.868 |
| Group C | 90.2 | 88.7 | 91.6 | 91.3 | 0.900 |
| Group D | 84.1 | 73.7 | 94.5 | 93.0 | 0.822 |
| Group E | 64.0 | 67.9 | 60.2 | 63.0 | 0.654 |
| Average ± SD | 76.1 ± 15.1 | 76.8 ± 12.5 | 75.5 ± 19.7 | 77.2 ± 17.0 | 0.767 ± 0.137 |
| Identification RateGroups | Accuracy (%) | Recall (%) | Specificity (%) | Precision (%) | F-Value |
|---|---|---|---|---|---|
| Group A | 83.3 | 70.0 | 96.5 | 95.3 | 0.807 |
| Group B | 85.3 | 87.5 | 83.1 | 83.8 | 0.856 |
| Group C | 94.8 | 92.0 | 97.6 | 97.5 | 0.946 |
| Group D | 98.8 | 97.6 | 100 | 100 | 0.988 |
| Group E | 89.2 | 93.5 | 85.0 | 86.1 | 0.897 |
| Average ± SD | 90.3 ± 6.5 | 88.1 ± 10.8 | 92.4 ± 7.8 | 92.5 ± 7.1 | 0.899 ± 0.071 |
Publisher’s Note: MDPI stays neutral with regard to jurisdictional claims in published maps and institutional affiliations. |
© 2020 by the authors. Licensee MDPI, Basel, Switzerland. This article is an open access article distributed under the terms and conditions of the Creative Commons Attribution (CC BY) license (http://creativecommons.org/licenses/by/4.0/).
Share and Cite
Takagi, S.; Sakuma, S.; Morita, I.; Sugimoto, E.; Yamaguchi, Y.; Higuchi, N.; Inamoto, K.; Ariji, Y.; Ariji, E.; Murakami, H. Application of Deep Learning in the Identification of Cerebral Hemodynamics Data Obtained from Functional Near-Infrared Spectroscopy: A Preliminary Study of Pre- and Post-Tooth Clenching Assessment. J. Clin. Med. 2020, 9, 3475. https://doi.org/10.3390/jcm9113475
Takagi S, Sakuma S, Morita I, Sugimoto E, Yamaguchi Y, Higuchi N, Inamoto K, Ariji Y, Ariji E, Murakami H. Application of Deep Learning in the Identification of Cerebral Hemodynamics Data Obtained from Functional Near-Infrared Spectroscopy: A Preliminary Study of Pre- and Post-Tooth Clenching Assessment. Journal of Clinical Medicine. 2020; 9(11):3475. https://doi.org/10.3390/jcm9113475
Chicago/Turabian StyleTakagi, Shinya, Shigemitsu Sakuma, Ichizo Morita, Eri Sugimoto, Yoshihiro Yamaguchi, Naoya Higuchi, Kyoko Inamoto, Yoshiko Ariji, Eiichiro Ariji, and Hiroshi Murakami. 2020. "Application of Deep Learning in the Identification of Cerebral Hemodynamics Data Obtained from Functional Near-Infrared Spectroscopy: A Preliminary Study of Pre- and Post-Tooth Clenching Assessment" Journal of Clinical Medicine 9, no. 11: 3475. https://doi.org/10.3390/jcm9113475
APA StyleTakagi, S., Sakuma, S., Morita, I., Sugimoto, E., Yamaguchi, Y., Higuchi, N., Inamoto, K., Ariji, Y., Ariji, E., & Murakami, H. (2020). Application of Deep Learning in the Identification of Cerebral Hemodynamics Data Obtained from Functional Near-Infrared Spectroscopy: A Preliminary Study of Pre- and Post-Tooth Clenching Assessment. Journal of Clinical Medicine, 9(11), 3475. https://doi.org/10.3390/jcm9113475