Performance of FRAX in Predicting Fractures in US Postmenopausal Women with Varied Race and Genetic Profiles


Abstract
1. Introduction
2. Experimental Section
2.1. Data Source
2.2. Participants
2.3. Outcomes: Incident Fractures
2.4. Genotyping
2.5. Genetic Risk Scores (GRS)
2.6. Fracture Probability
2.7. Statistical Analysis
3. Results
3.1. Baseline Characteristics
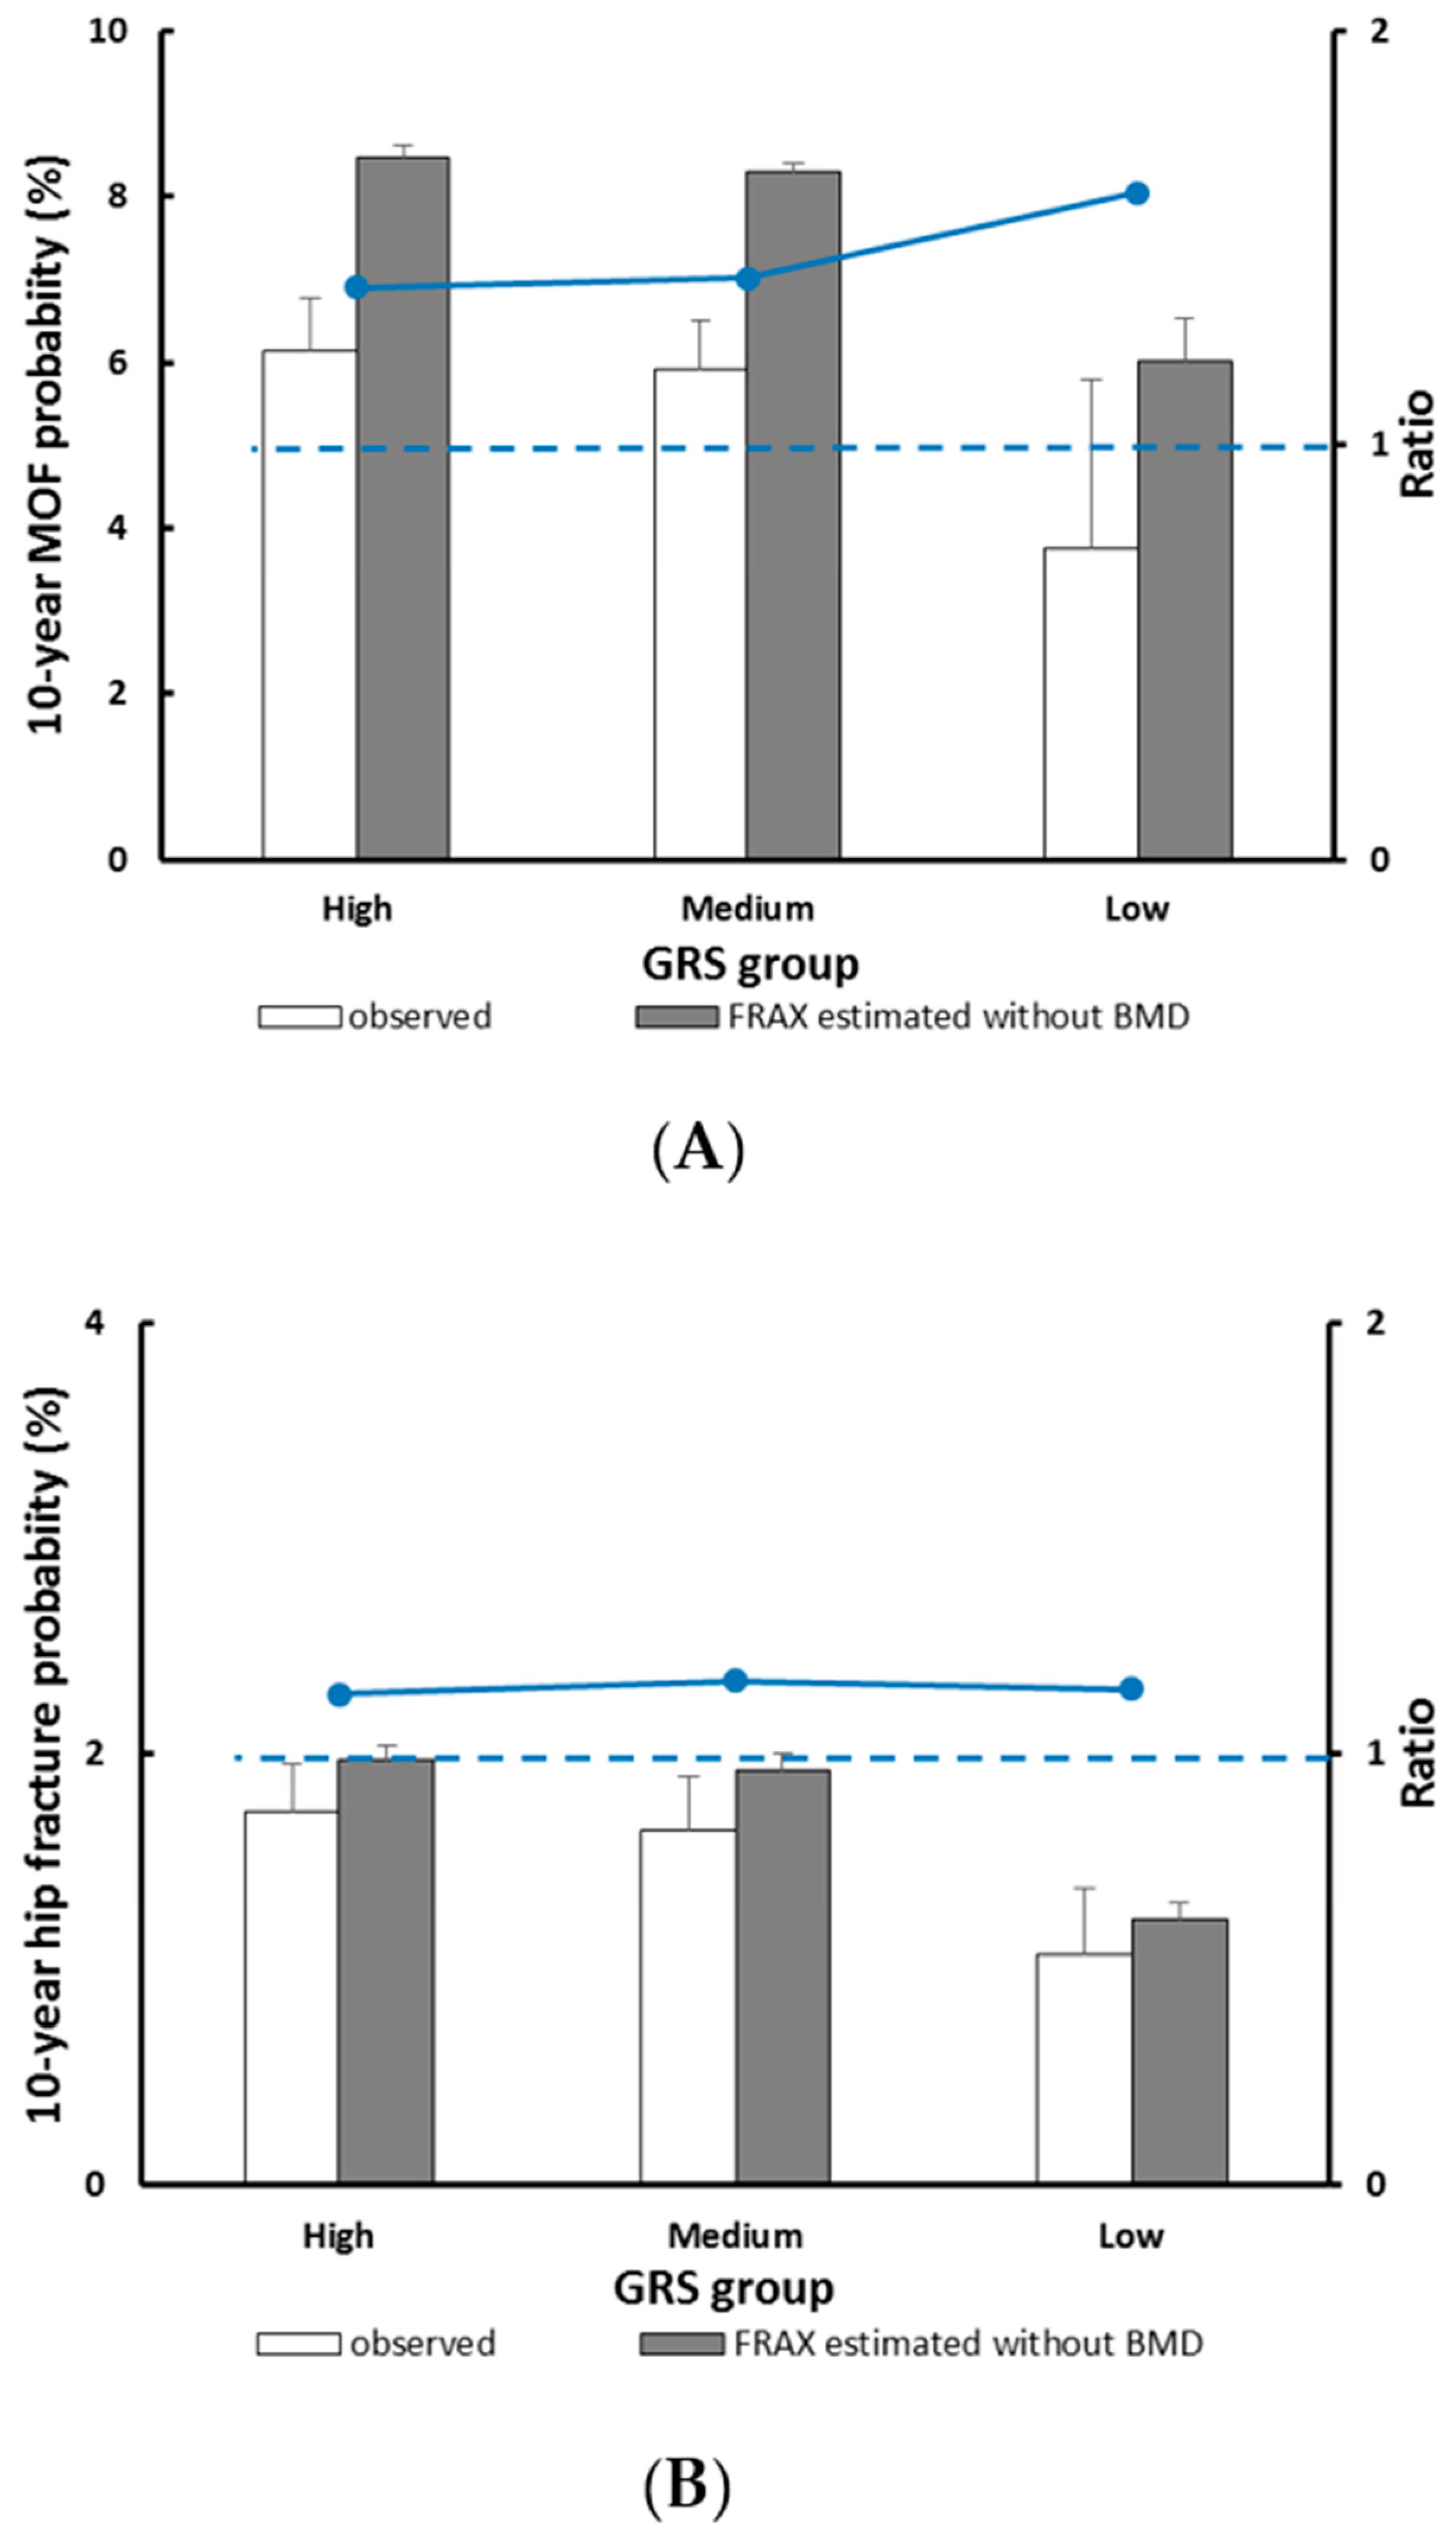
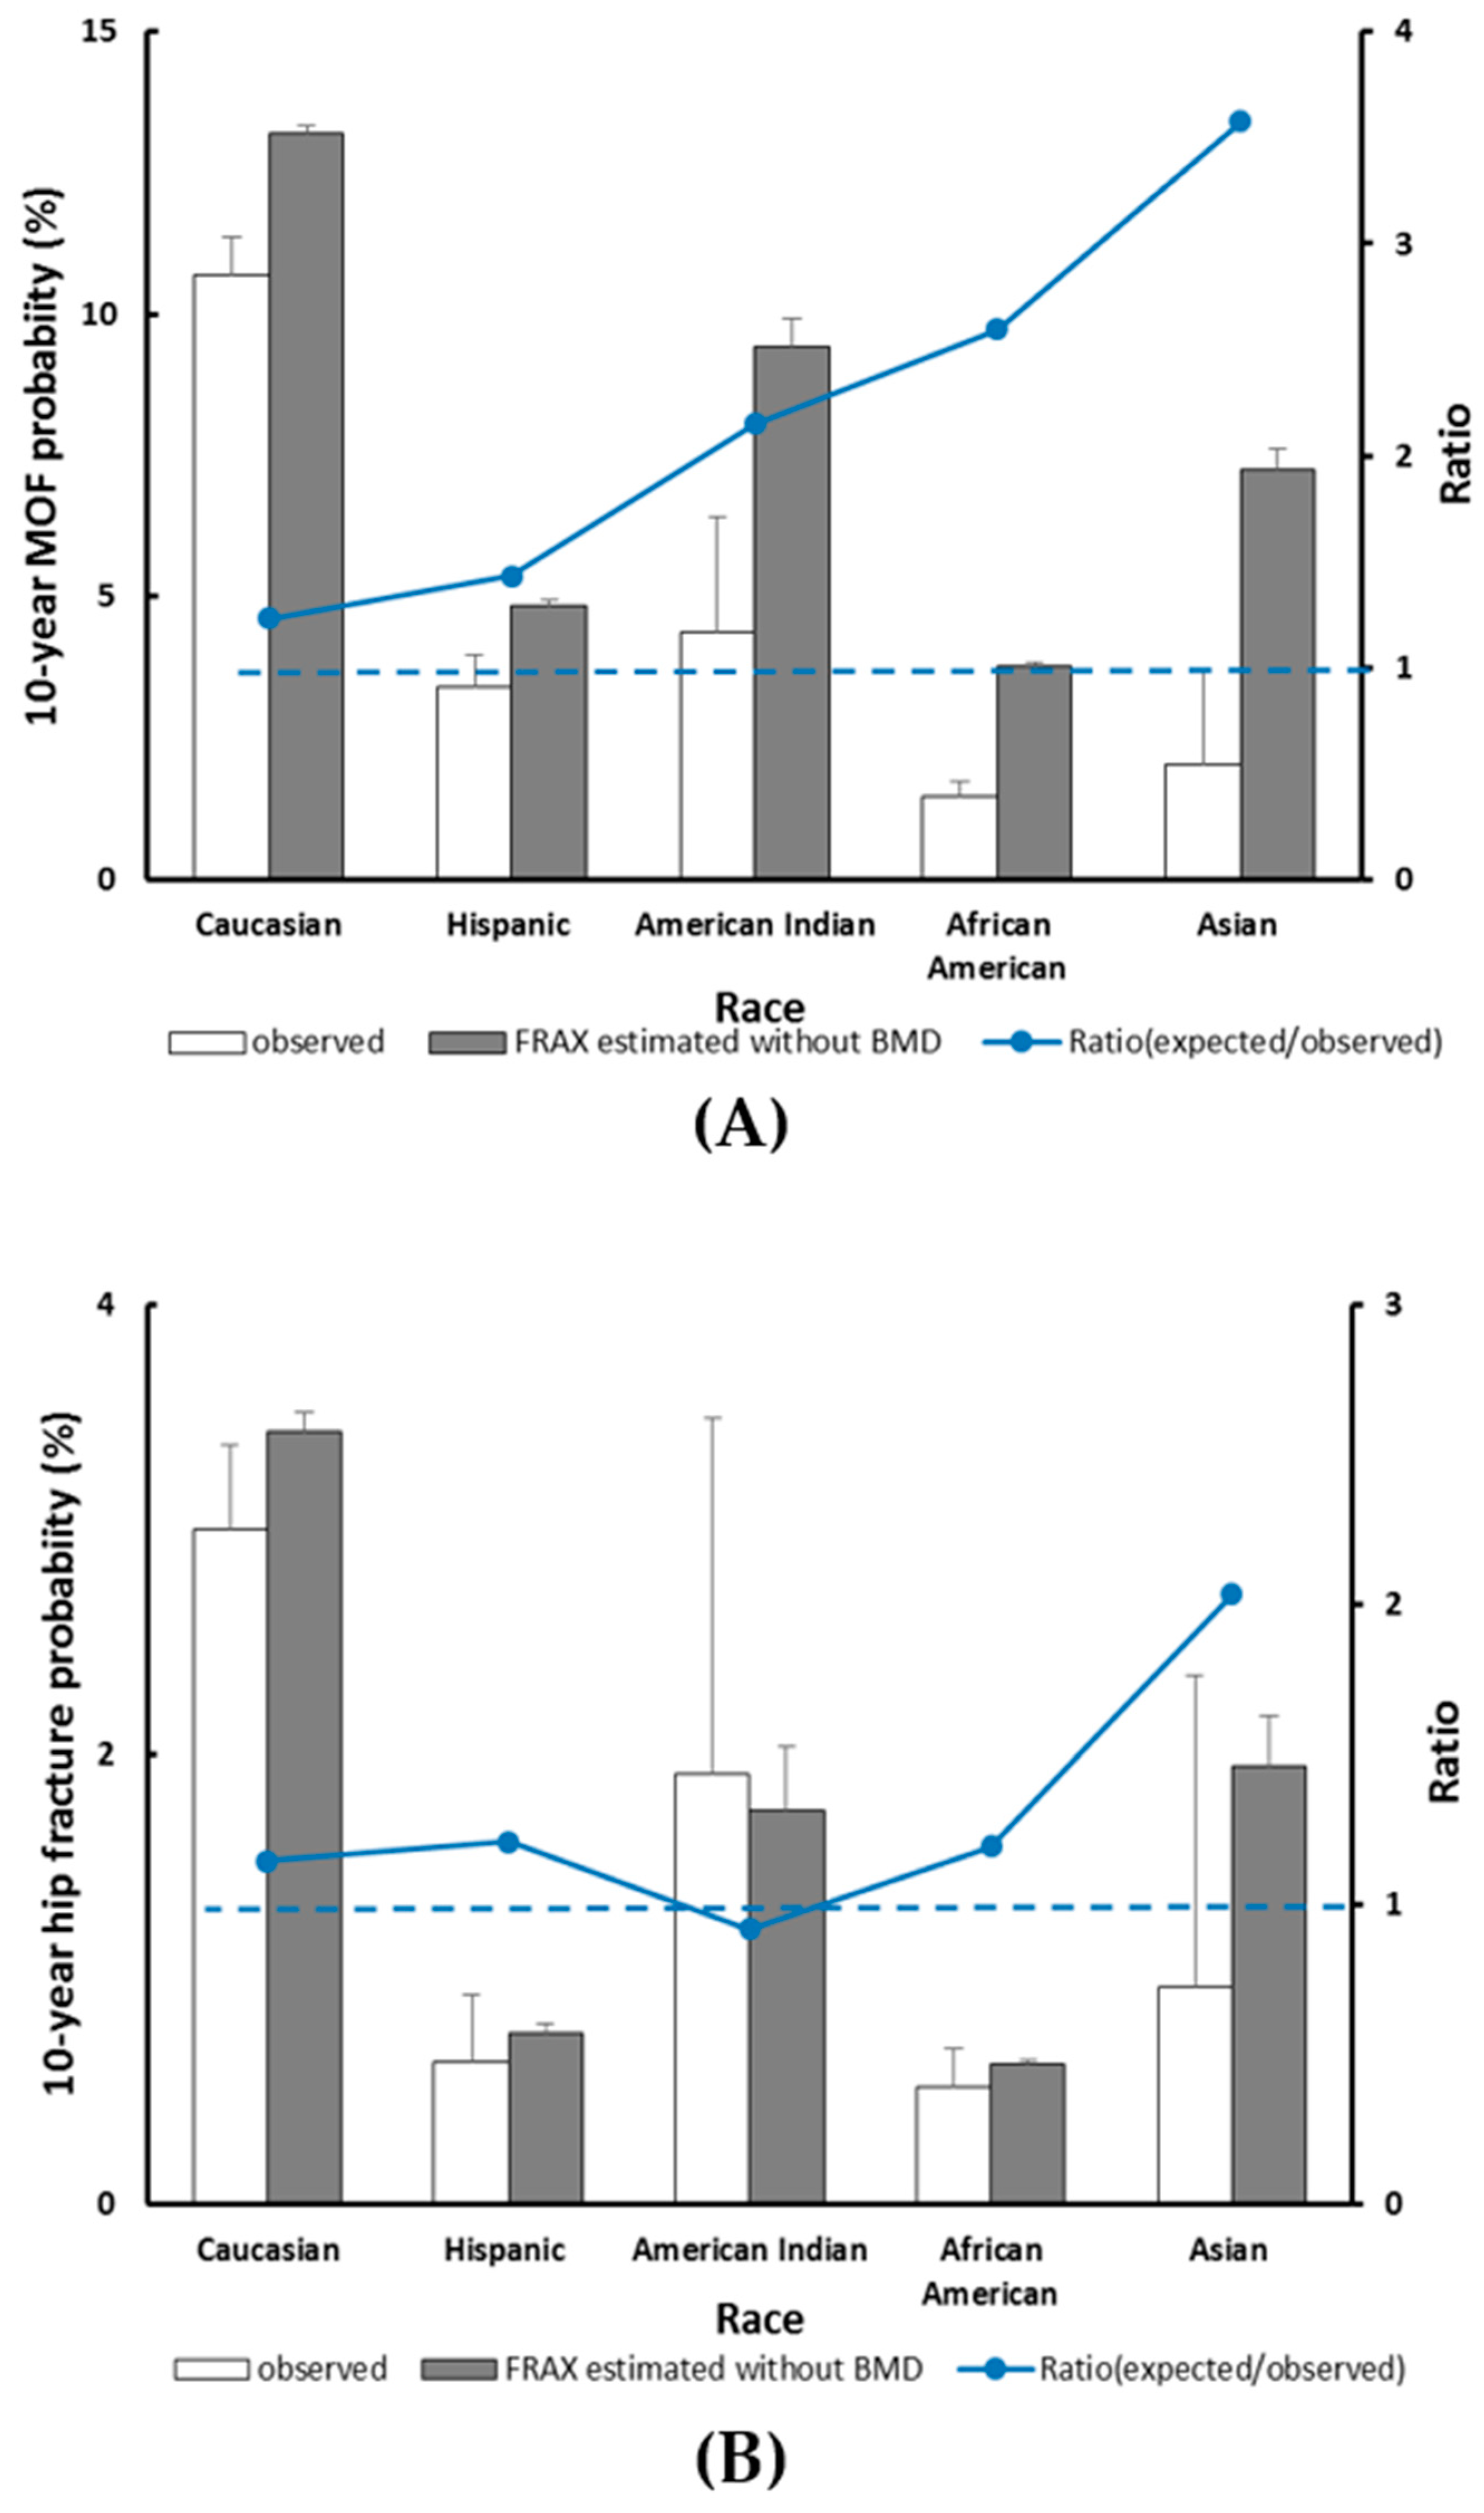
3.2. Performance of Fracture Risk Assessment Tool (FRAX) in Predicting Major Osteoporotic Fracture (MOF) and Hip Fracture
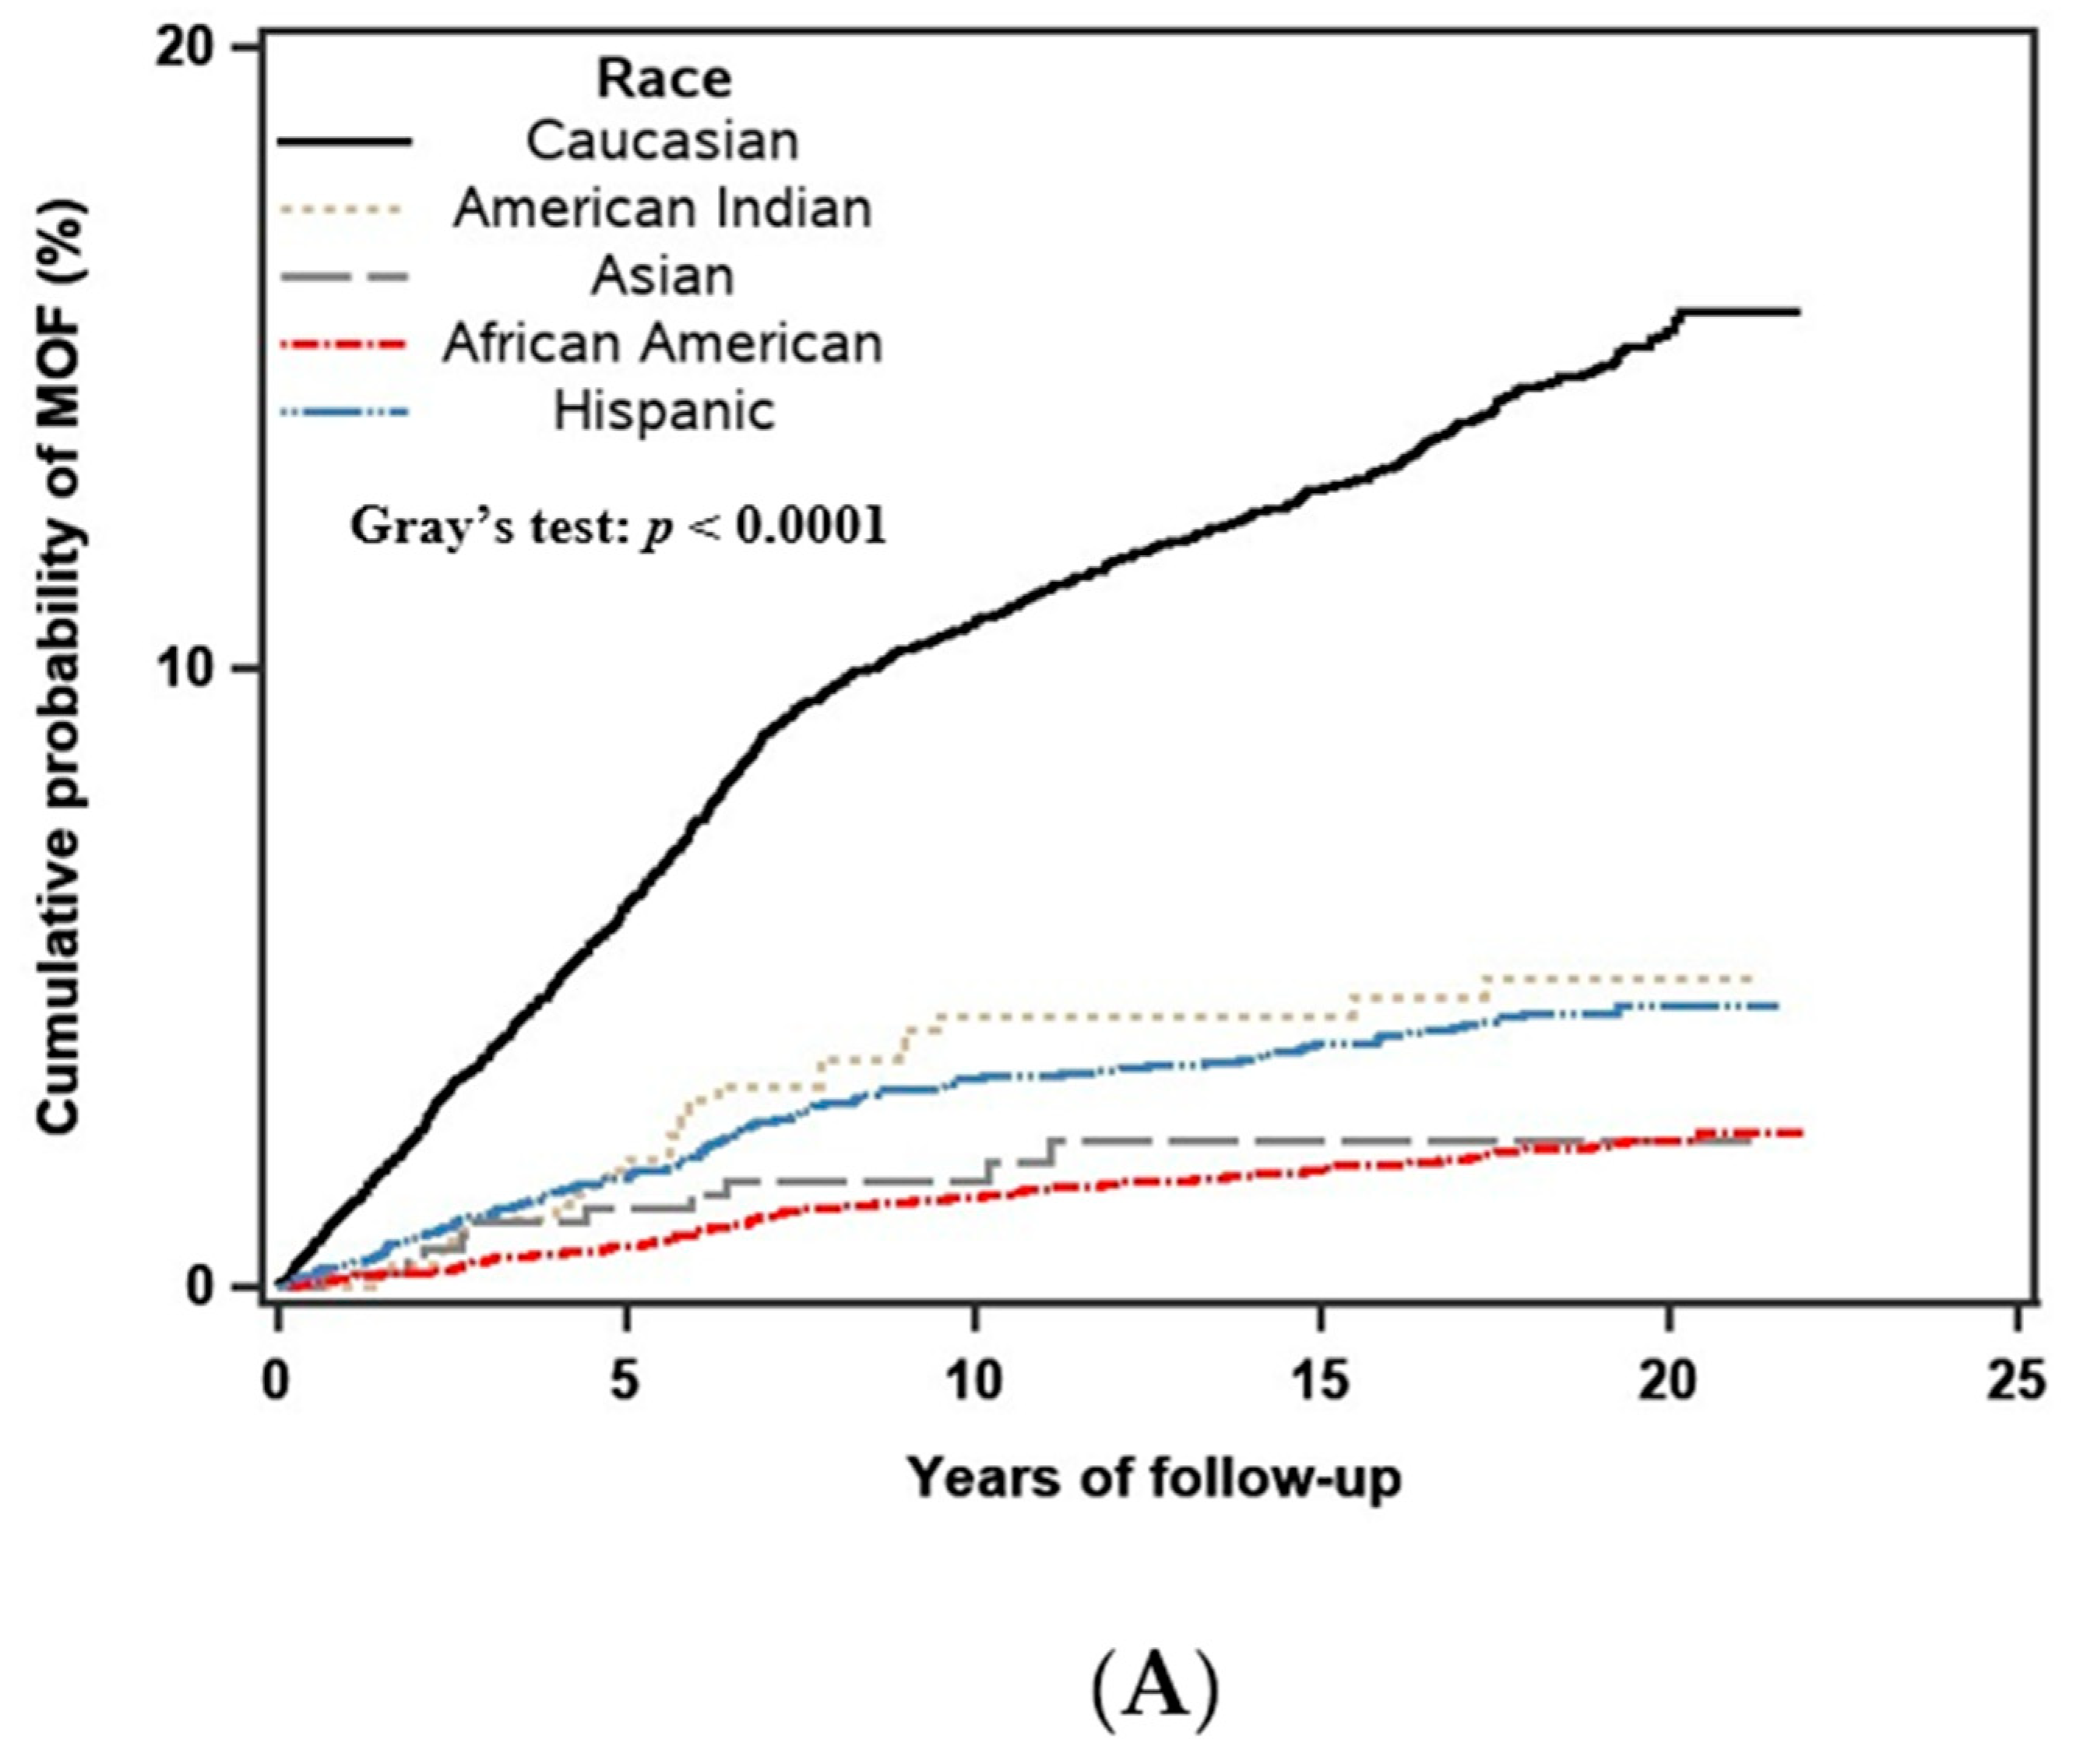
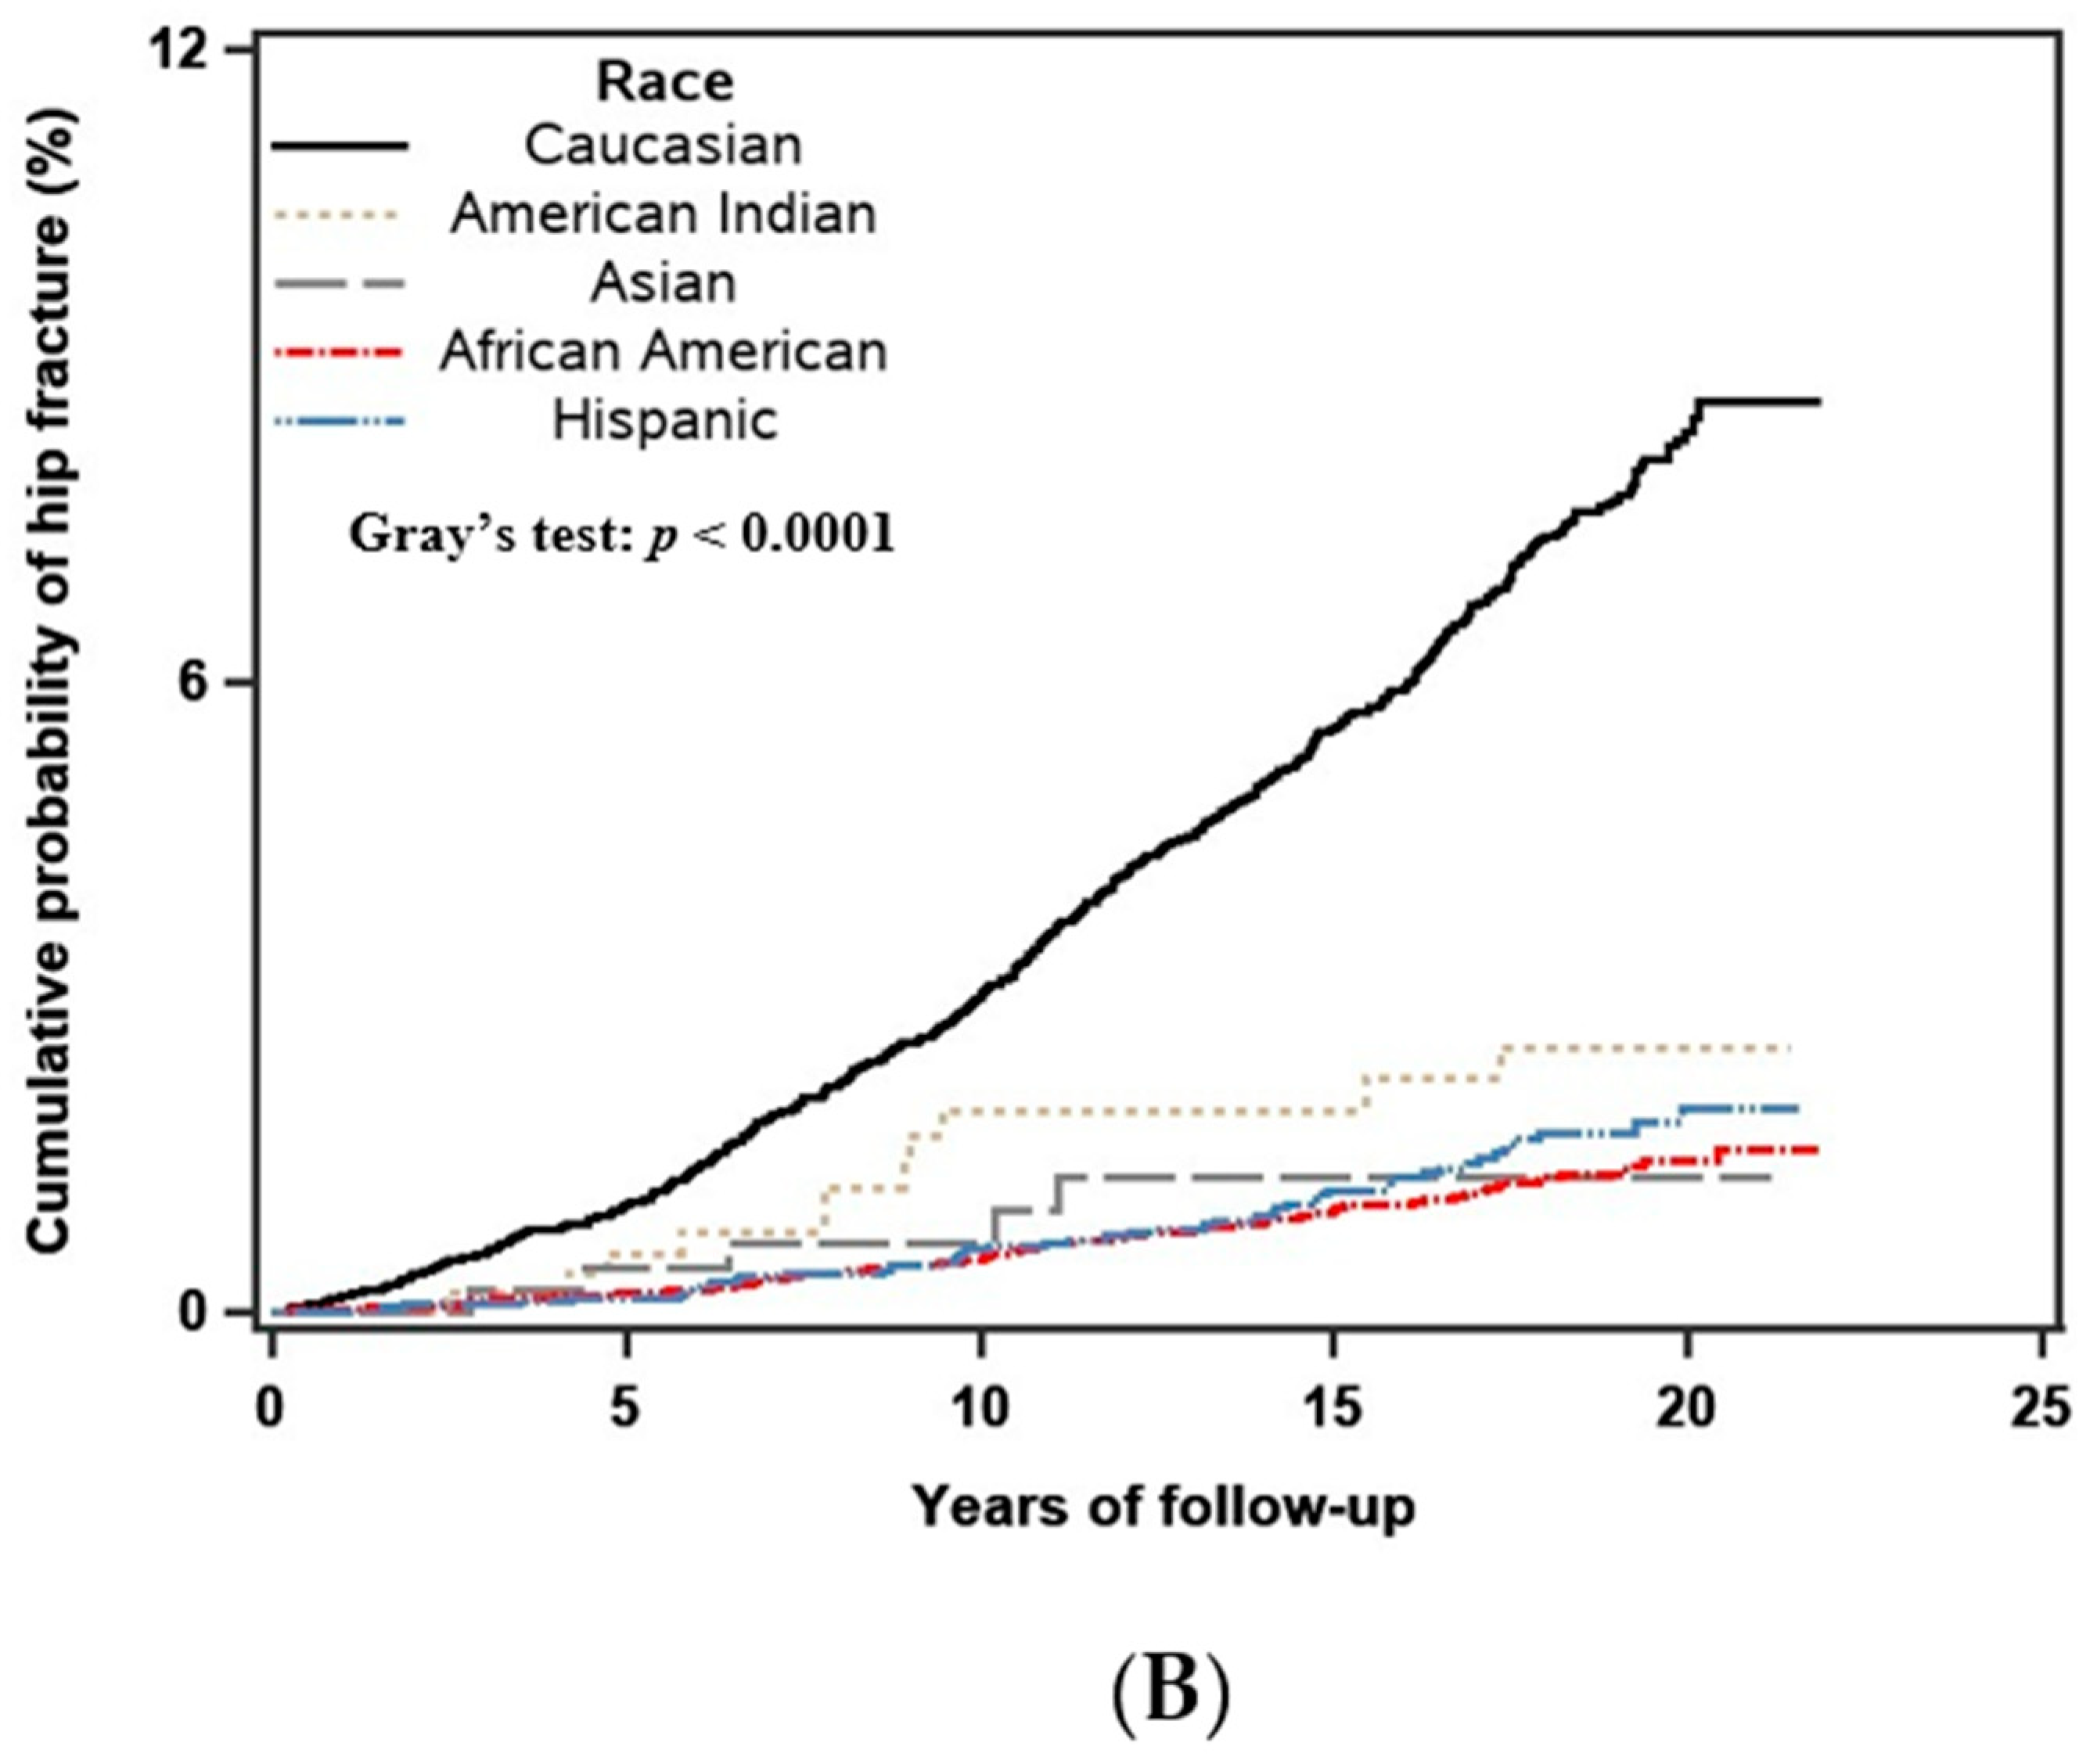
3.3. Race/Ethnicity and the Fracture Outcome
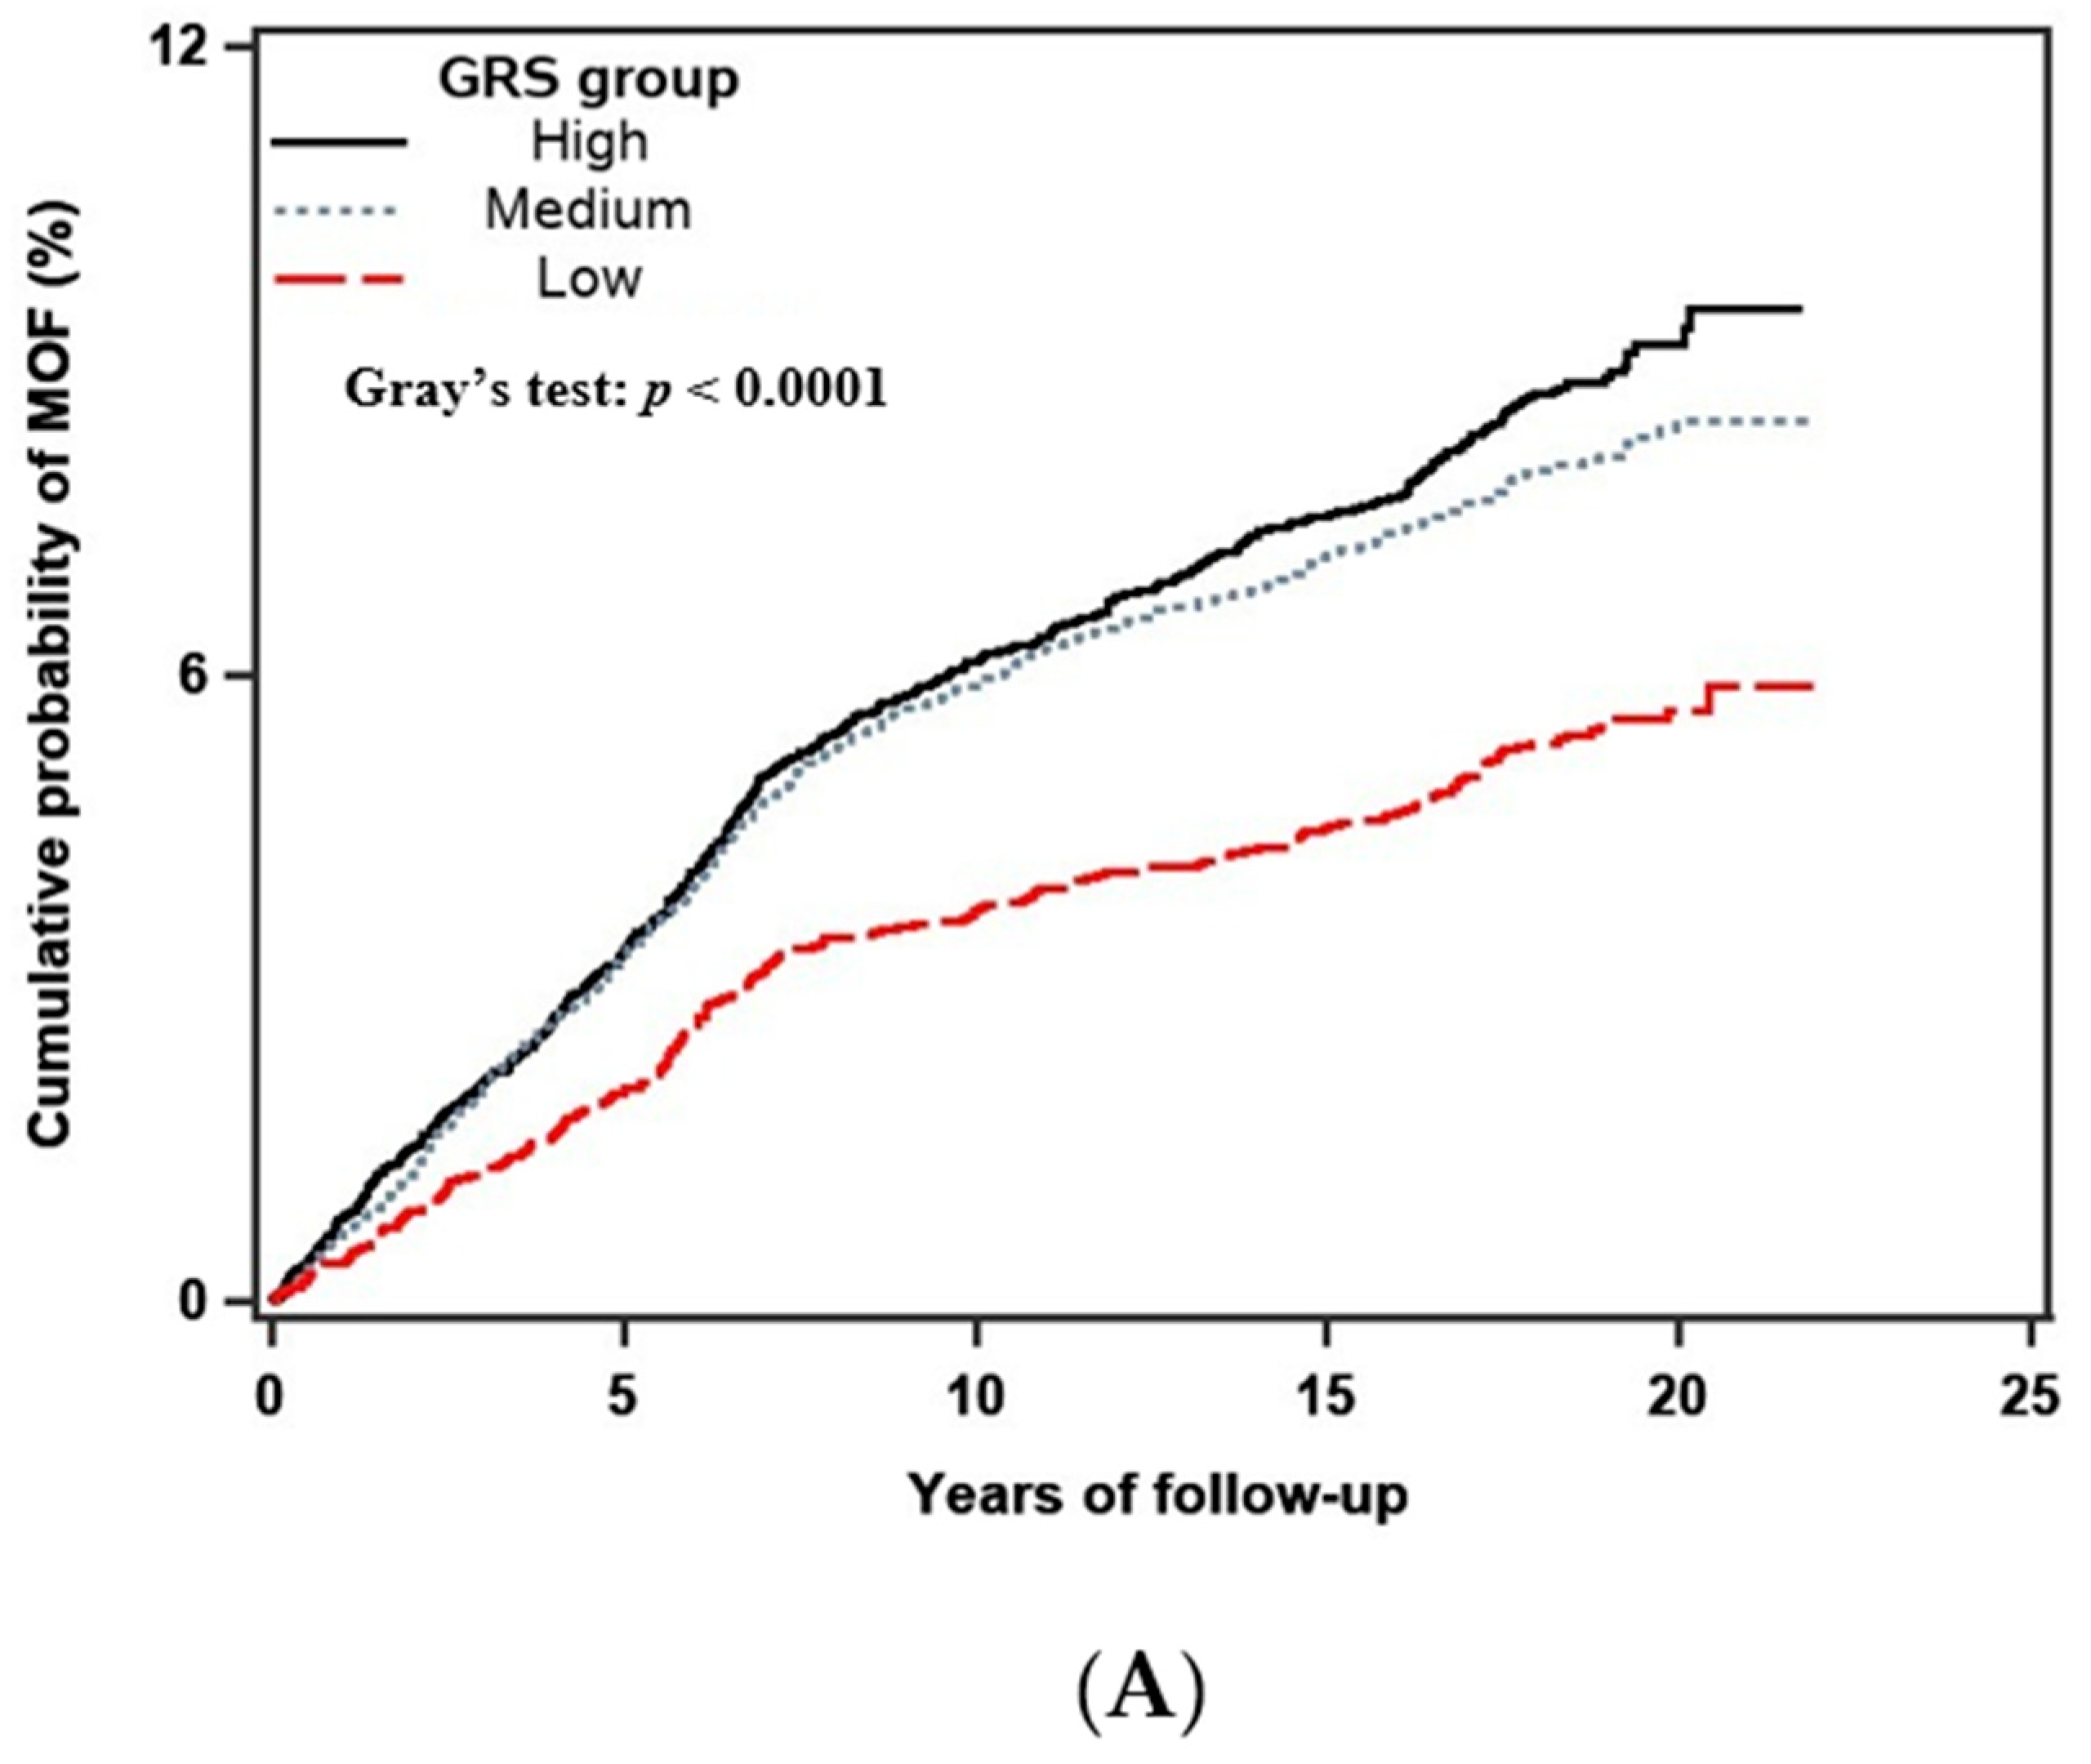
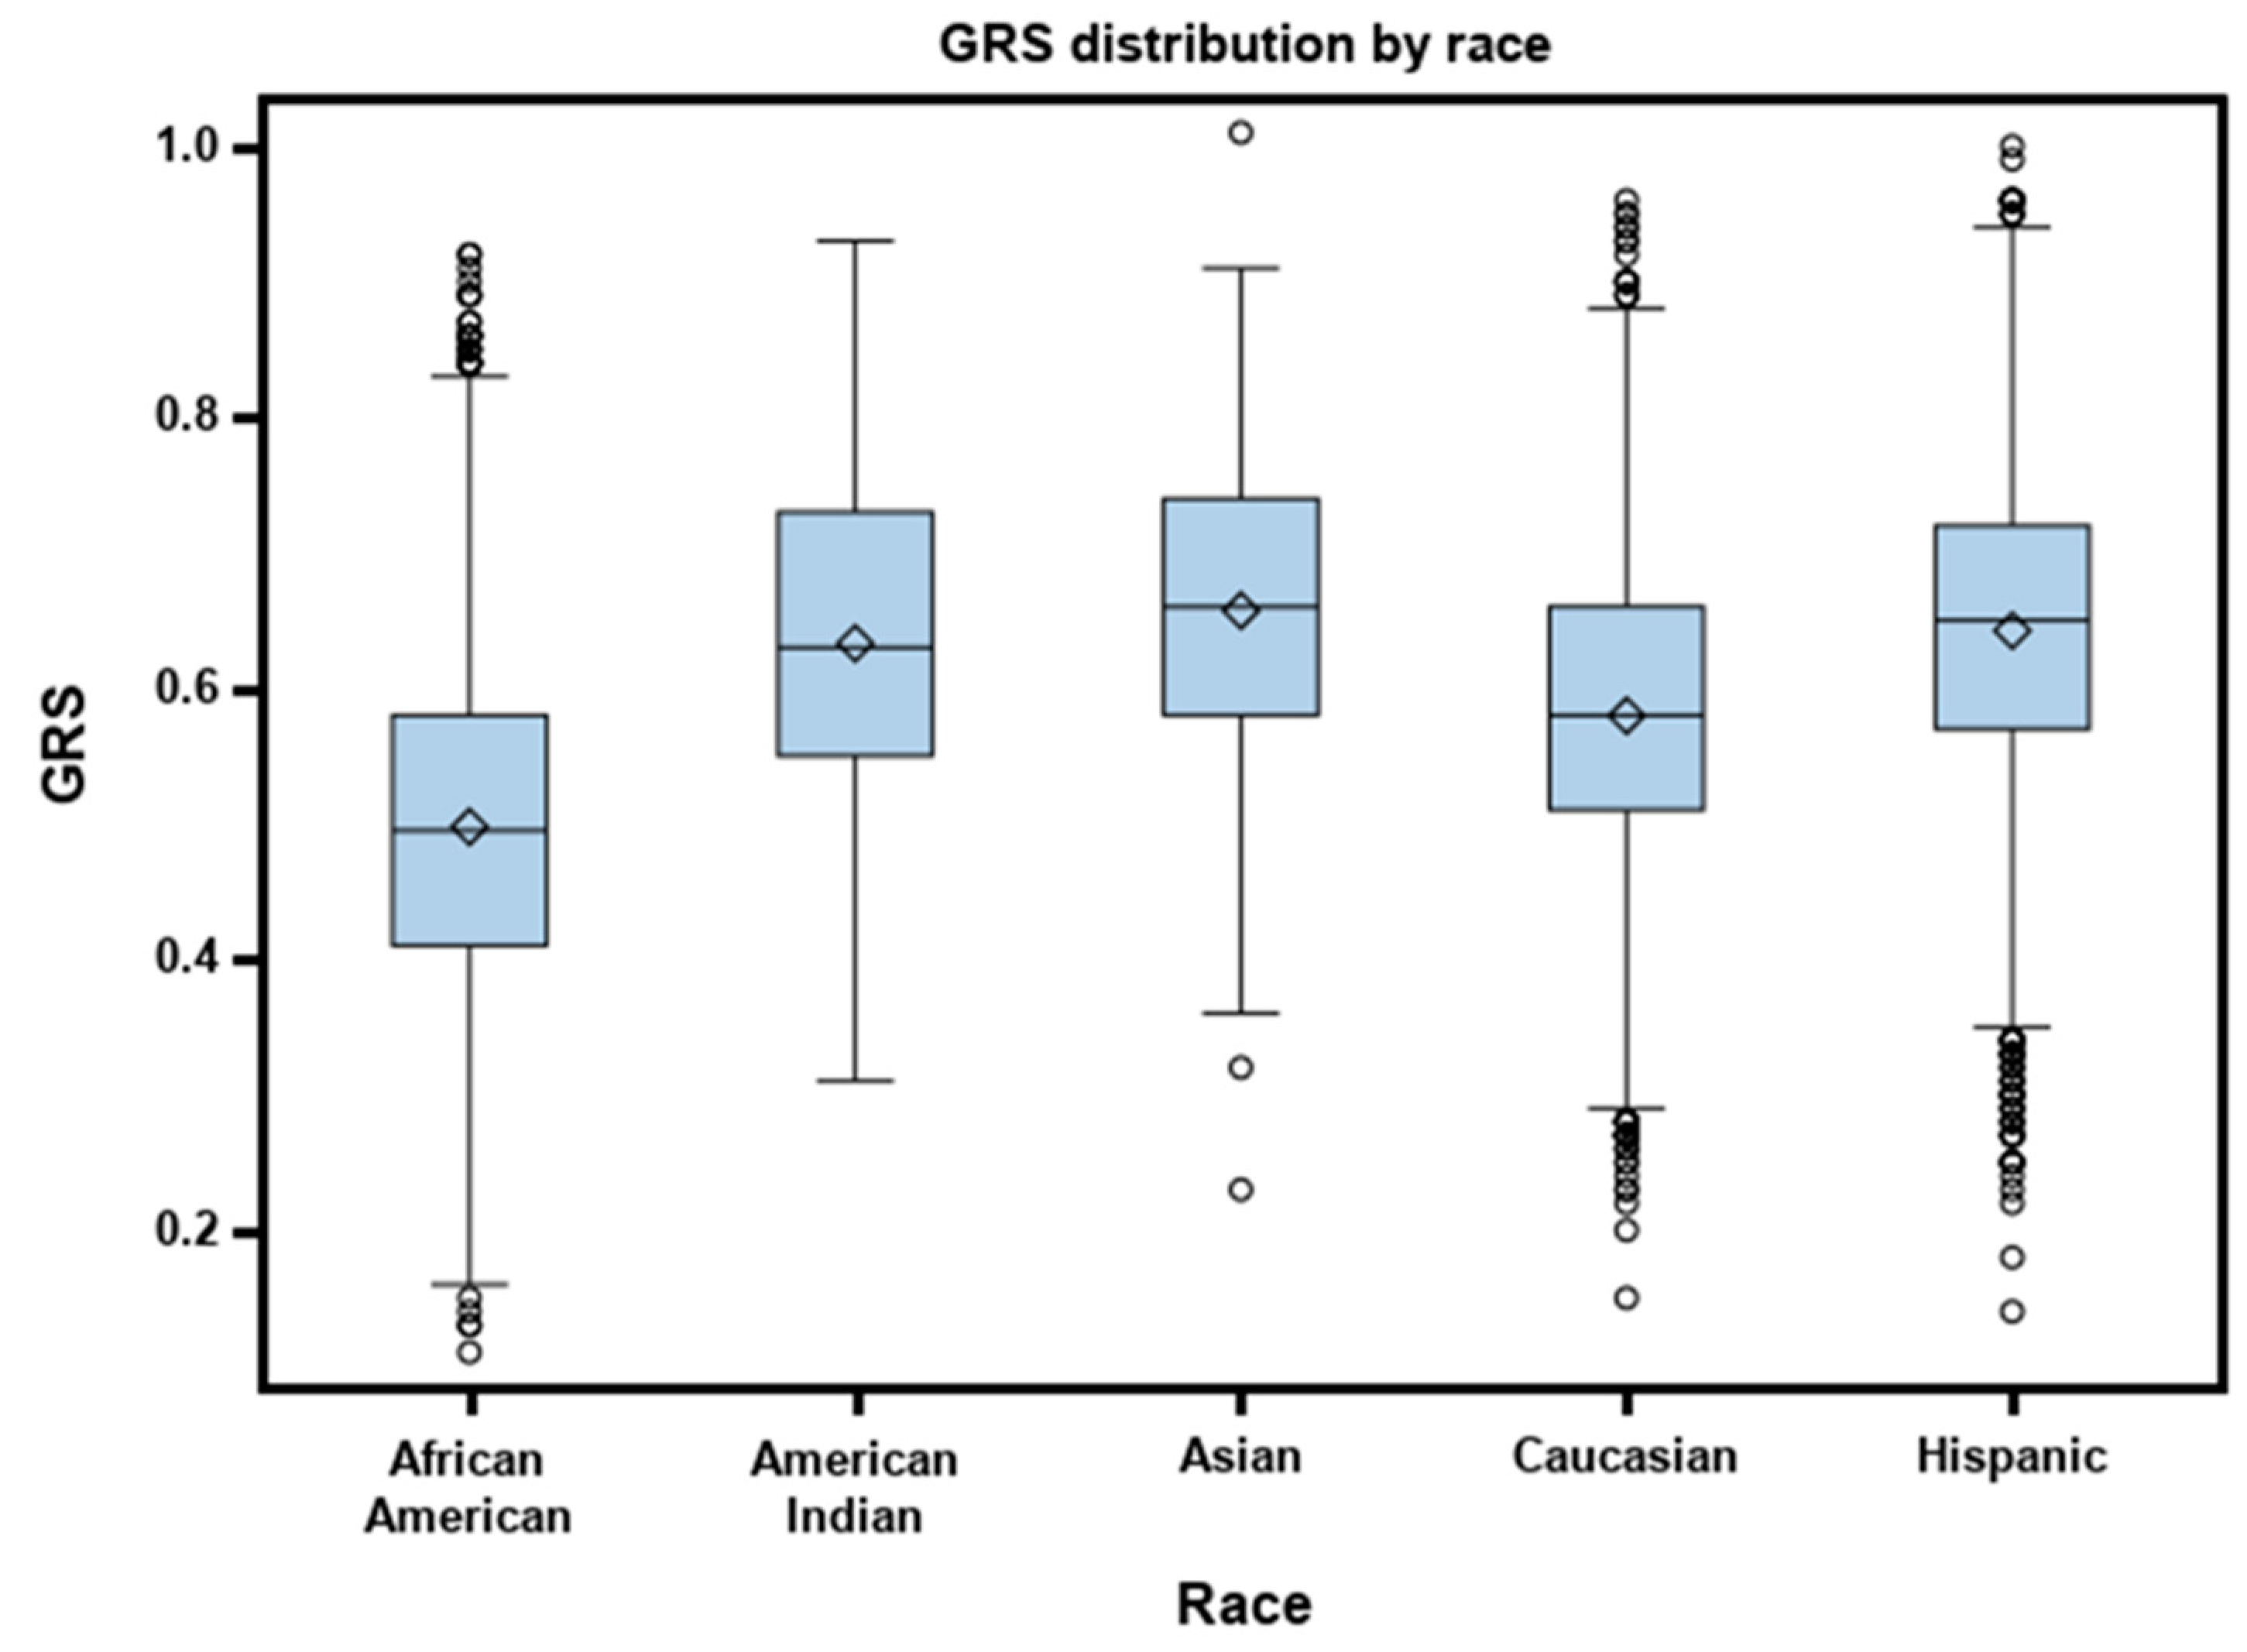
3.4. GRS and the Fracture Outcome
3.5. Sensitivity Analysis
4. Discussion
5. Conclusions
Author Contributions
Funding
Acknowledgments
Conflicts of Interest
Appendix A

| Major Osteoporotic Fracture | Hip Fracture | |
|---|---|---|
| HR (95% CI) | HR (95% CI) | |
| Adjusted for FRAX probability | ||
| low | 1 (reference) | 1 (reference) |
| medium | 1.37 (1.11–1.70) | 1.32 (0.98–1.77) |
| high | 1.39 (1.10–1.74) | 1.41 (1.03–1.95) |
| Adjusted for FRAX probability + race | ||
| low | 1 (reference) | 1 (reference) |
| medium | 1.15 (0.93–1.43) | 1.04 (0.77–1.40) |
| high | 1.18 (0.93–1.50) | 1.15 (0.82–1.61) |
| Major Osteoporotic Fracture | Hip Fracture | |
|---|---|---|
| HR (95% CI) | HR (95% CI) | |
| Adjusted for FRAX probability | ||
| Caucasian | 1 (reference) | 1 (reference) |
| American Indian | 0.31 (0.19–0.50) | 0.32 (0.16–0.65) |
| Asian | 0.10 (0.04–0.28) | 0.15 (0.05–0.48) |
| AA | 0.22 (0.18–0.27) | 0.21 (0.16–0.28) |
| Hispanic | 0.34 (0.27–0.43) | 0.22 (0.15–0.31) |
| Adjusted for FRAX probability + GRS group | ||
| Caucasian | 1 (reference) | 1 (reference) |
| American Indian | 0.30 (0.19–0.49) | 0.31 (0.15–0.64) |
| Asian | 0.10 (0.04–0.27) | 0.15 (0.05–0.47) |
| AA | 0.23 (0.18–0.28) | 0.22 (0.17–0.29) |
| Hispanic | 0.34 (0.27–0.43) | 0.21 (0.15–0.30) |

References
- Johnell, O.; Kanis, J.A. An estimate of the worldwide prevalence, mortality and disability associated with hip fracture. Osteoporos. Int. 2004, 15, 897–902. [Google Scholar] [CrossRef] [PubMed]
- Johnell, O.; Kanis, J.A. An estimate of the worldwide prevalence and disability associated with osteoporotic fractures. Osteoporos. Int. 2006, 17, 1726–1733. [Google Scholar] [CrossRef] [PubMed]
- Sözen, T.; Özışık, L.; Başaran, N.Ç. An overview and management of osteoporosis. Eur. J. Rheumatol. 2017, 4, 46–56. [Google Scholar] [CrossRef] [PubMed]
- Reginster, J.Y.; Burlet, N. Osteoporosis: A still increasing prevalence. Bone 2006, 38, S4–S9. [Google Scholar] [CrossRef] [PubMed]
- Watts, N.B.; Bilezikian, J.P.; Camacho, P.M.; Greenspan, S.L.; Harris, S.T.; Hodgson, S.F.; Kleerekoper, M.; Luckey, M.M.; McClung, M.R.; Pollack, R.P.; et al. American Association of Clinical Endocrinologists Medical Guidelines for Clinical Practice for the diagnosis and treatment of postmenopausal osteoporosis. Endocr. Pract. 2010, 16, 1–37. [Google Scholar] [CrossRef] [PubMed]
- Wright, N.C.; Looker, A.C.; Saag, K.G.; Curtis, J.R.; Delzell, E.S.; Randall, S.; Dawson-Hughes, B. The recent prevalence of osteoporosis and low bone mass in the United States based on bone mineral density at the femoral neck or lumbar spine. J. Bone Miner. Res. 2014, 29, 2520–2526. [Google Scholar] [CrossRef] [PubMed]
- Dyer, S.M.; Crotty, M.; Fairhall, N.; Magaziner, J.; Beaupre, L.A.; Cameron, I.D.; Sherrington, C. A critical review of the long-term disability outcomes following hip fracture. BMC Geriatr. 2016, 16, 158. [Google Scholar] [CrossRef]
- Sànchez-Riera, L.; Carnahan, E.; Vos, T.; Veerman, L.; Norman, R.; Lim, S.S.; Hoy, D.; Smith, E.; Wilson, N.; Nolla, J.M.; et al. The global burden attributable to low bone mineral density. Ann. Rheum. Dis. 2014, 73, 1635. [Google Scholar] [CrossRef]
- Harvey, N.; Dennison, E.; Cooper, C. Osteoporosis: Impact on health and economics. Nat. Rev. Rheumatol. 2010, 6, 99–105. [Google Scholar] [CrossRef]
- Kanis, J.A. World Health Organization Scientific Group. Assessment of Osteoporosis at the Primary Health-Care Level; Technical Report; World Health Organization Collaborating Centre for Metabolic Bone Diseases: Sheffield, UK, 2008. [Google Scholar]
- Kanis, J.A.; Oden, A.; Johnell, O.; Johansson, H.; De Laet, C.; Brown, J.; Burckhardt, P.; Cooper, C.; Christiansen, C.; Cummings, S.; et al. The use of clinical risk factors enhances the performance of BMD in the prediction of hip and osteoporotic fractures in men and women. Osteoporos. Int. 2007, 18, 1033–1046. [Google Scholar] [CrossRef]
- Sornay-Rendu, E.; Munoz, F.; Delmas, P.D.; Chapurlat, R.D. The FRAX tool in French women: How well does it describe the real incidence of fracture in the OFELY cohort? J. Bone Miner. Res. 2010, 25, 2101–2107. [Google Scholar] [CrossRef] [PubMed]
- Crandall, C.J.; Schousboe, J.T.; Morin, S.N.; Lix, L.M.; Leslie, W. Performance of FRAX and FRAX-Based Treatment Thresholds in Women Aged 40 Years and Older: The Manitoba BMD Registry. J. Bone Miner. Res. 2019, 34, 1419–1427. [Google Scholar] [CrossRef] [PubMed]
- Briot, K.; Paternotte, S.; Kolta, S.; Eastell, R.; Felsenberg, D.; Reid, D.M.; Glüer, C.-C.; Roux, C. FRAX®: Prediction of Major Osteoporotic Fractures in Women from the General Population: The OPUS Study. PLoS ONE 2014, 8, e83436. [Google Scholar] [CrossRef] [PubMed]
- Estrada, K.; Styrkarsdottir, U.; Evangelou, E.; Hsu, Y.H.; Duncan, E.L.; Ntzani, E.E.; Oei, L.; Albagha, O.M.; Amin, N.; Kemp, J.P.; et al. Genome-wide meta-analysis identifies 56 bone mineral density loci and reveals 14 loci associated with risk of fracture. Nat. Genet. 2012, 44, 491–501. [Google Scholar] [CrossRef] [PubMed]
- Melton, L.J., III. History of the Rochester Epidemiology Project. Mayo Clin. Proc. 1996, 71, 266–274. [Google Scholar] [CrossRef] [PubMed]
- Dawson-Hughes, B.; Tosteson, A.N.; Melton, L.J., III; Baim, S.; Favus, M.J.; Khosla, S.; Lindsay, R.L. Implications of absolute fracture risk assessment for osteoporosis practice guidelines in the USA. Osteoporos. Int. 2008, 19, 449–458. [Google Scholar] [CrossRef]
- World Health Organization. WHO Scientific Group on the Assessment of Osteoporosis at the Primary Health-Care Level in Summary Meeting Report; World Health Organization: Geneva, Switzerland, 2007. [Google Scholar]
- Stewart, T.L.; Ralston, S.H. Role of genetic factors in the pathogenesis of osteoporosis. J. Endocrinol. 2000, 166, 235–245. [Google Scholar] [CrossRef]
- Mikkola, T.M.; Sipilä, S.; Rantanen, T.; Sievänen, H.; Suominen, H.; Kaprio, J.; Koskenvuo, M.; Kauppinen, M.; Heinonen, A. Genetic and Environmental Influence on Structural Strength of Weight-Bearing and Non–Weight-Bearing Bone: A Twin Study. J. Bone Miner. Res. 2008, 23, 492–498. [Google Scholar] [CrossRef]
- Koromani, F.; Trajanoska, K.; Rivadeneira, F.; Oei, L. Recent Advances in the Genetics of Fractures in Osteoporosis. Front. Endocrinol. 2019, 10, 337. [Google Scholar] [CrossRef]
- Michaëlsson, K.; Melhus, H.; Ferm, H.; Ahlbom, A.; Pedersen, N.L. Genetic Liability to Fractures in the Elderly. Arch. Intern. Med. 2005, 165, 1825–1830. [Google Scholar] [CrossRef]
- Kim, S.K. Identification of 613 new loci associated with heel bone mineral density and a polygenic risk score for bone mineral density, osteoporosis and fracture. PLoS ONE 2018, 13, e0200785. [Google Scholar] [CrossRef] [PubMed]
- Morris, J.A.; Kemp, J.P.; Youlten, S.E.; Laurent, L.; Logan, J.G.; Chai, R.C.; Vulpescu, N.A.; Forgetta, V.; Kleinman, A.; Mohanty, S.T.; et al. An atlas of genetic influences on osteoporosis in humans and mice. Nat. Genet. 2019, 51, 258–266. [Google Scholar] [CrossRef]
- Bush, W.S.; Moore, J.H. Chapter 11: Genome-wide association studies. PLoS Comput. Biol. 2012, 8, e1002822. [Google Scholar] [CrossRef]
- Ho-Le, T.P.; Center, J.R.; Eisman, J.A.; Nguyen, H.T.; Nguyen, T.V. Prediction of Bone Mineral Density and Fragility Fracture by Genetic Profiling. J. Bone Miner. Res. 2017, 32, 285–293. [Google Scholar] [CrossRef] [PubMed]
- Eriksson, J.; Evans, D.S.; Nielson, C.M.; Shen, J.; Srikanth, P.; Hochberg, M.; McWeeney, S.; Cawthon, P.M.; Wilmot, B.; Zmuda, J. Limited clinical utility of a genetic risk score for the prediction of fracture risk in elderly subjects. J. Bone Miner. Res. 2015, 30, 184–194. [Google Scholar] [CrossRef] [PubMed]
- Gibson, G. On the utilization of polygenic risk scores for therapeutic targeting. PLoS Genet. 2019, 15, e1008060. [Google Scholar] [CrossRef]
- The Women’s Health Initiative Study Group. Design of the Women’s Health Initiative clinical trial and observational study. Control Clin. Trials 1998, 19, 61–109. [Google Scholar] [CrossRef]
- Zhang, M.-J.; Zhang, X.; Scheike, T.H. Modeling cumulative incidence function for competing risks data. Expert Rev. Clin. Pharmacol. 2008, 1, 391–400. [Google Scholar] [CrossRef]
- Lee, S.H.; Lee, S.W.; Ahn, S.H.; Kim, T.; Lim, K.H.; Kim, B.J.; Cho, E.H.; Kim, S.W.; Kim, T.H.; Kim, G.S.; et al. Multiple gene polymorphisms can improve prediction of nonvertebral fracture in postmenopausal women. J. Bone Miner. Res. 2013, 28, 2156–2164. [Google Scholar] [CrossRef]
- Wu, Q.; Nasoz, F.; Jung, J.; Bhattarai, B.; Han, M.V. Machine learning approaches for fracture risk assessment: a comparative analysis of genomic and phenotypic data in 5,130 older men. medRxiv 2020. [Google Scholar] [CrossRef]
- Ettinger, B.; Black, D.M.; Dawson-Hughes, B.; Pressman, A.R.; Melton, L.J., 3rd. Updated fracture incidence rates for the US version of FRAX. Osteoporos. Int. 2010, 21, 25–33. [Google Scholar] [CrossRef] [PubMed]
- Crandall, C.J.; Larson, J.; LaCroix, A.; Cauley, J.A.; LeBoff, M.S.; Li, W.; LeBlanc, E.S.; Edwards, B.J.; Manson, J.E.; Ensrud, K. Predicting Fracture Risk in Younger Postmenopausal Women: Comparison of the Garvan and FRAX Risk Calculators in the Women’s Health Initiative Study. J. Gen. Intern. Med. 2019, 34, 235–242. [Google Scholar] [CrossRef] [PubMed]
- Cheung, E.; Cheung, C.L.; Kung, A.W.; Tan, K.C. Possible FRAX-based intervention thresholds for a cohort of Chinese postmenopausal women. Osteoporos. Int. 2014, 25, 1017–1023. [Google Scholar] [CrossRef] [PubMed]
- Leslie, W.D.; Morin, S.N.; Lix, L.M.; Niraula, S.; McCloskey, E.V.; Johansson, H.; Harvey, N.C.; Kanis, J.A. Performance of FRAX in Women with Breast Cancer Initiating Aromatase Inhibitor Therapy: A Registry-Based Cohort Study. J. Bone Miner. Res. 2019, 34, 1428–1435. [Google Scholar] [CrossRef]
- Bolland, M.J.; Siu, A.T.; Mason, B.H.; Horne, A.M.; Ames, R.W.; Grey, A.B.; Gamble, G.D.; Reid, I.R. Evaluation of the FRAX and Garvan fracture risk calculators in older women. J. Bone Miner. Res. 2011, 26, 420–427. [Google Scholar] [CrossRef]
- Pluskiewicz, W.; Adamczyk, P.; Franek, E.; Leszczynski, P.; Sewerynek, E.; Wichrowska, H.; Napiorkowska, L.; Kostyk, T.; Stuss, M.; Stepien-Klos, W.; et al. Ten-year probability of osteoporotic fracture in 2012 Polish women assessed by FRAX and nomogram by Nguyen et al.—Conformity between methods and their clinical utility. Bone 2010, 46, 1661–1667. [Google Scholar] [CrossRef]
- Kanis, J.A.; Oden, A.; Johansson, H.; McCloskey, E. Pitfalls in the external validation of FRAX. Osteoporos. Int. 2012, 23, 423–431. [Google Scholar] [CrossRef]


| Subjects with Major Osteoporotic Fracture Event (n = 1637) | Subjects without Major Osteoporotic Fracture Event (n = 22,281) | p-Value | |
|---|---|---|---|
| Age (year), Mean ± standard deviation (SD) | 67.99 ± 6.52 | 63.26 (±7.32) | <0.0001 |
| Weight (kg), Mean ± SD | 73.59 ± 15.21 | 77.32 (±16.92) | <0.0001 |
| Height (cm), Mean ± SD | 161.25 ± 6.30 | 161.06 (±6.29) | 0.28 |
| Body mass index (kg/m2), Mean ± SD | 28.27 ± 6.30 | 29.73 (±6.09) | <0.0001 |
| Smoking, n (%) | 0.35 | ||
| Never | 858 (52.42) | 11,704 (52.52) | |
| Past | 639 (39.03) | 8448 (37.92) | |
| Current | 140 (8.55) | 2129 (9.56) | |
| ≥3 alcoholic drinks per day, n (%) | 0.05 | ||
| Yes | 24 (1.47) | 216 (0.97) | |
| No | 1613 (98.53) | 22,065 (99.03) | |
| Rheumatoid arthritis, n (%) | 0.91 | ||
| Yes | 109 (6.66) | 1500 (6.73) | |
| No | 1528 (93.34) | 20,781 (93.27) | |
| Previous fragility fractures, n (%) | <0.0001 | ||
| Yes | 835 (51.01) | 6902 (30.98) | |
| No | 802 (48.99) | 15,379 (95.04) | |
| Familial history of hip fracture, n (%) | <0.0001 | ||
| Yes | 271 (16.55) | 2156 (9.68) | |
| No | 1366 (83.45) | 20,125 (93.64) | |
| Race, n (%) | |||
| Caucasian | 1255 (76.66) | 7948 (35.67) | <0.0001 |
| American Indian | 24 (1.47) | 535 (2.40) | |
| Asian | 10 (0.61) | 467 (2.10) | |
| African American | 189 (11.55) | 9231 (41.43) | |
| Hispanic | 159 (9.71) | 4100 (18.40) | |
| Genetic risk score (GRS), Mean ± SD | 0.58 ± 0.12 | 0.56 ± 0.13 | <0.0001 |
| Fracture Risk Assessment Tool (FRAX®) for MOF (%), Mean ± SD | 13.51 ± 8.57 | 7.39 ± 6.27 | <0.0001 |
| FRAX® for hip fracture (%), Mean ± SD | 4.02 ± 5.45 | 1.61 ± 2.88 | <0.0001 |
| Major Osteoporotic Fracture | Hip Fracture | |
|---|---|---|
| HR (95% CI) | HR (95% CI) | |
| Adjusted for FRAX probability | ||
| low | 1(reference) | 1(reference) |
| medium | 1.21 (1.05–1.39) | 1.27 (1.04–1.55) |
| high | 1.30 (1.12–1.50) | 1.46 (1.17–1.80) |
| Adjusted for FRAX probability + race | ||
| low | 1(reference) | 1(reference) |
| medium | 1.01 (0.88–1.16) | 1.00 (0.81–1.22) |
| high | 1.08 (0.92–1.25) | 1.17 (0.93–1.46) |
| Major Osteoporotic Fracture | Hip Fracture | |
|---|---|---|
| HR (95% CI) | HR (95% CI) | |
| Adjusted for FRAX probability | ||
| Caucasian | 1 (reference) | 1 (reference) |
| American Indian | 0.40 (0.26–0.59) | 0.39 (0.21–0.70) |
| Asian | 0.22 (0.12–0.41) | 0.22 (0.09–0.52) |
| AA | 0.24 (0.20–0.28) | 0.22 (0.17–0.27) |
| Hispanic | 0.44 (0.37–0.52) | 0.25 (0.20–0.34) |
| Adjusted for FRAX probability + GRS group | ||
| Caucasian | 1 (reference) | 1 (reference) |
| American Indian | 0.39 (0.26–0.59) | 0.38 (0.21–0.68) |
| Asian | 0.22 (0.12–0.40) | 0.20 (0.09–0.49) |
| AA | 0.24 (0.20–0.29) | 0.20 (0.18–0.28) |
| Hispanic | 0.43 (0.36–0.52) | 0.24 (0.18–0.32) |
© 2020 by the authors. Licensee MDPI, Basel, Switzerland. This article is an open access article distributed under the terms and conditions of the Creative Commons Attribution (CC BY) license (http://creativecommons.org/licenses/by/4.0/).
Share and Cite
Wu, Q.; Xiao, X.; Xu, Y. Performance of FRAX in Predicting Fractures in US Postmenopausal Women with Varied Race and Genetic Profiles. J. Clin. Med. 2020, 9, 285. https://doi.org/10.3390/jcm9010285
Wu Q, Xiao X, Xu Y. Performance of FRAX in Predicting Fractures in US Postmenopausal Women with Varied Race and Genetic Profiles. Journal of Clinical Medicine. 2020; 9(1):285. https://doi.org/10.3390/jcm9010285
Chicago/Turabian StyleWu, Qing, Xiangxue Xiao, and Yingke Xu. 2020. "Performance of FRAX in Predicting Fractures in US Postmenopausal Women with Varied Race and Genetic Profiles" Journal of Clinical Medicine 9, no. 1: 285. https://doi.org/10.3390/jcm9010285
APA StyleWu, Q., Xiao, X., & Xu, Y. (2020). Performance of FRAX in Predicting Fractures in US Postmenopausal Women with Varied Race and Genetic Profiles. Journal of Clinical Medicine, 9(1), 285. https://doi.org/10.3390/jcm9010285