Association between Achievement of Estimated Average Glucose Level and 6-Month Neurologic Outcome in Comatose Cardiac Arrest Survivors: A Propensity Score-Matched Analysis

 , , ,
, , ,
Abstract
1. Introduction
2. Patients and Methods
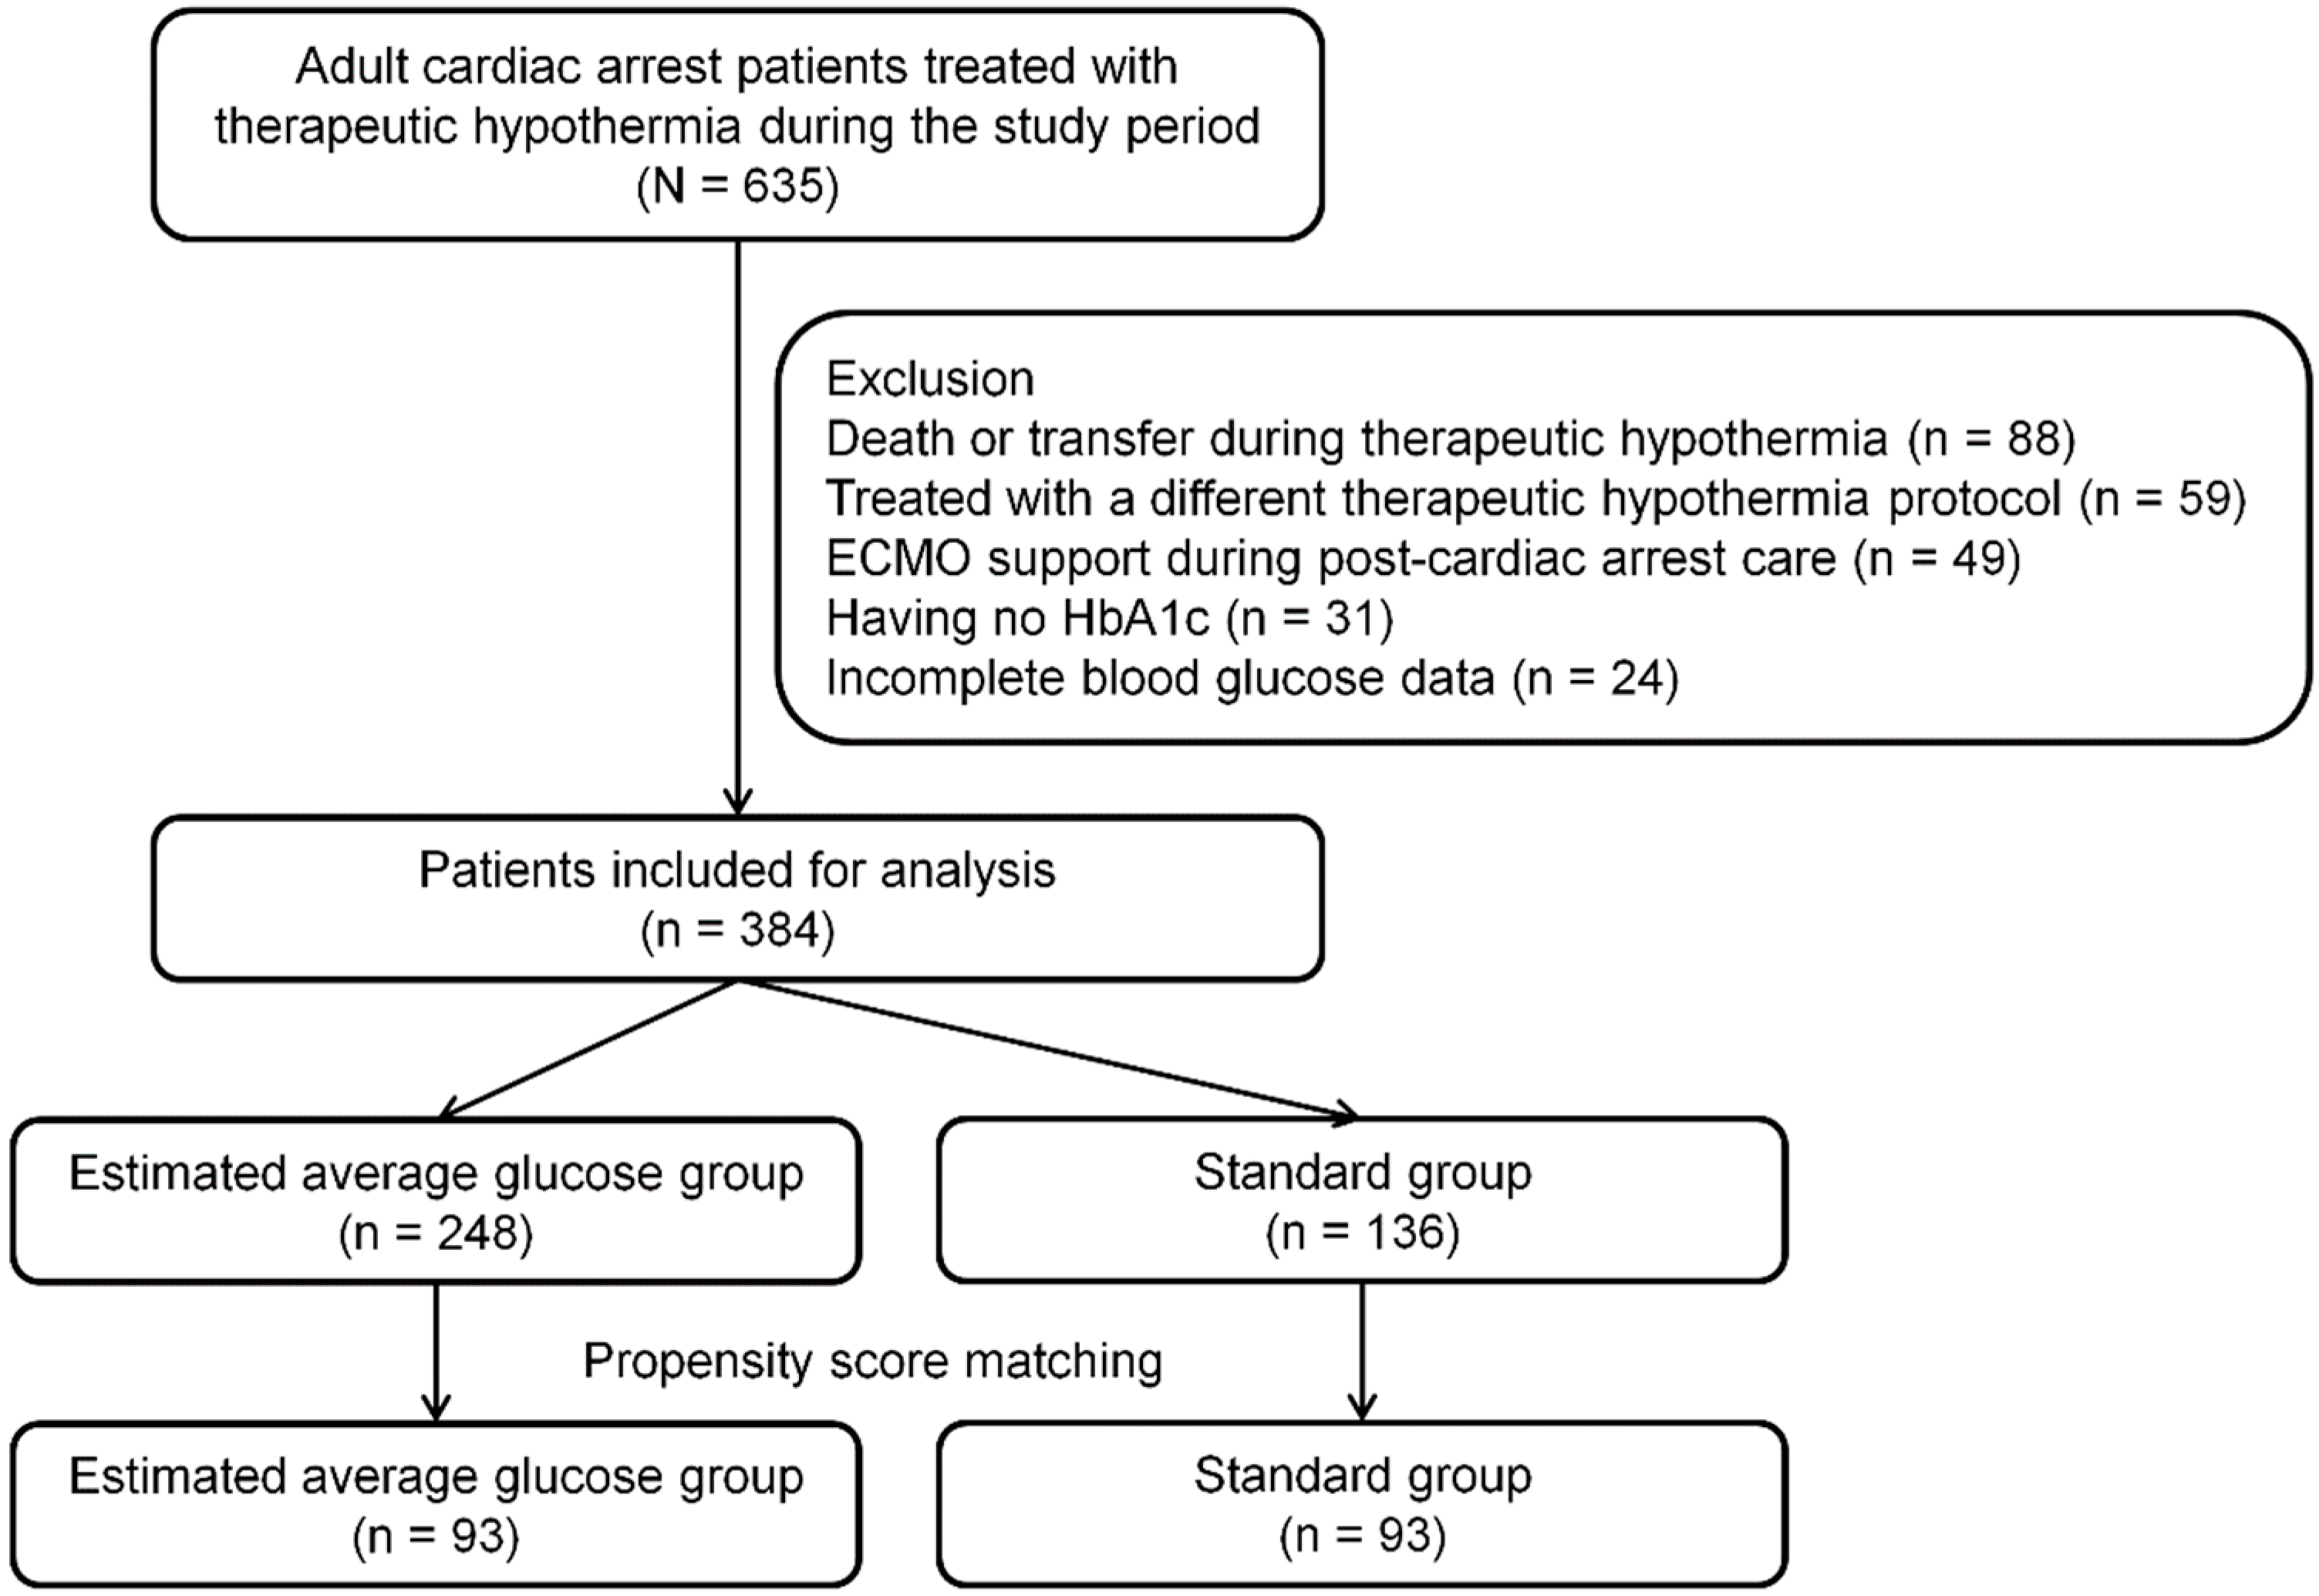
2.1. Study Design and Patients
2.2. Therapeutic Hypothermia and Measurement and Glucose Control
2.3. Data Collection and Primary Outcome
2.4. Statistical Analysis
3. Results
3.1. Matched Cohort
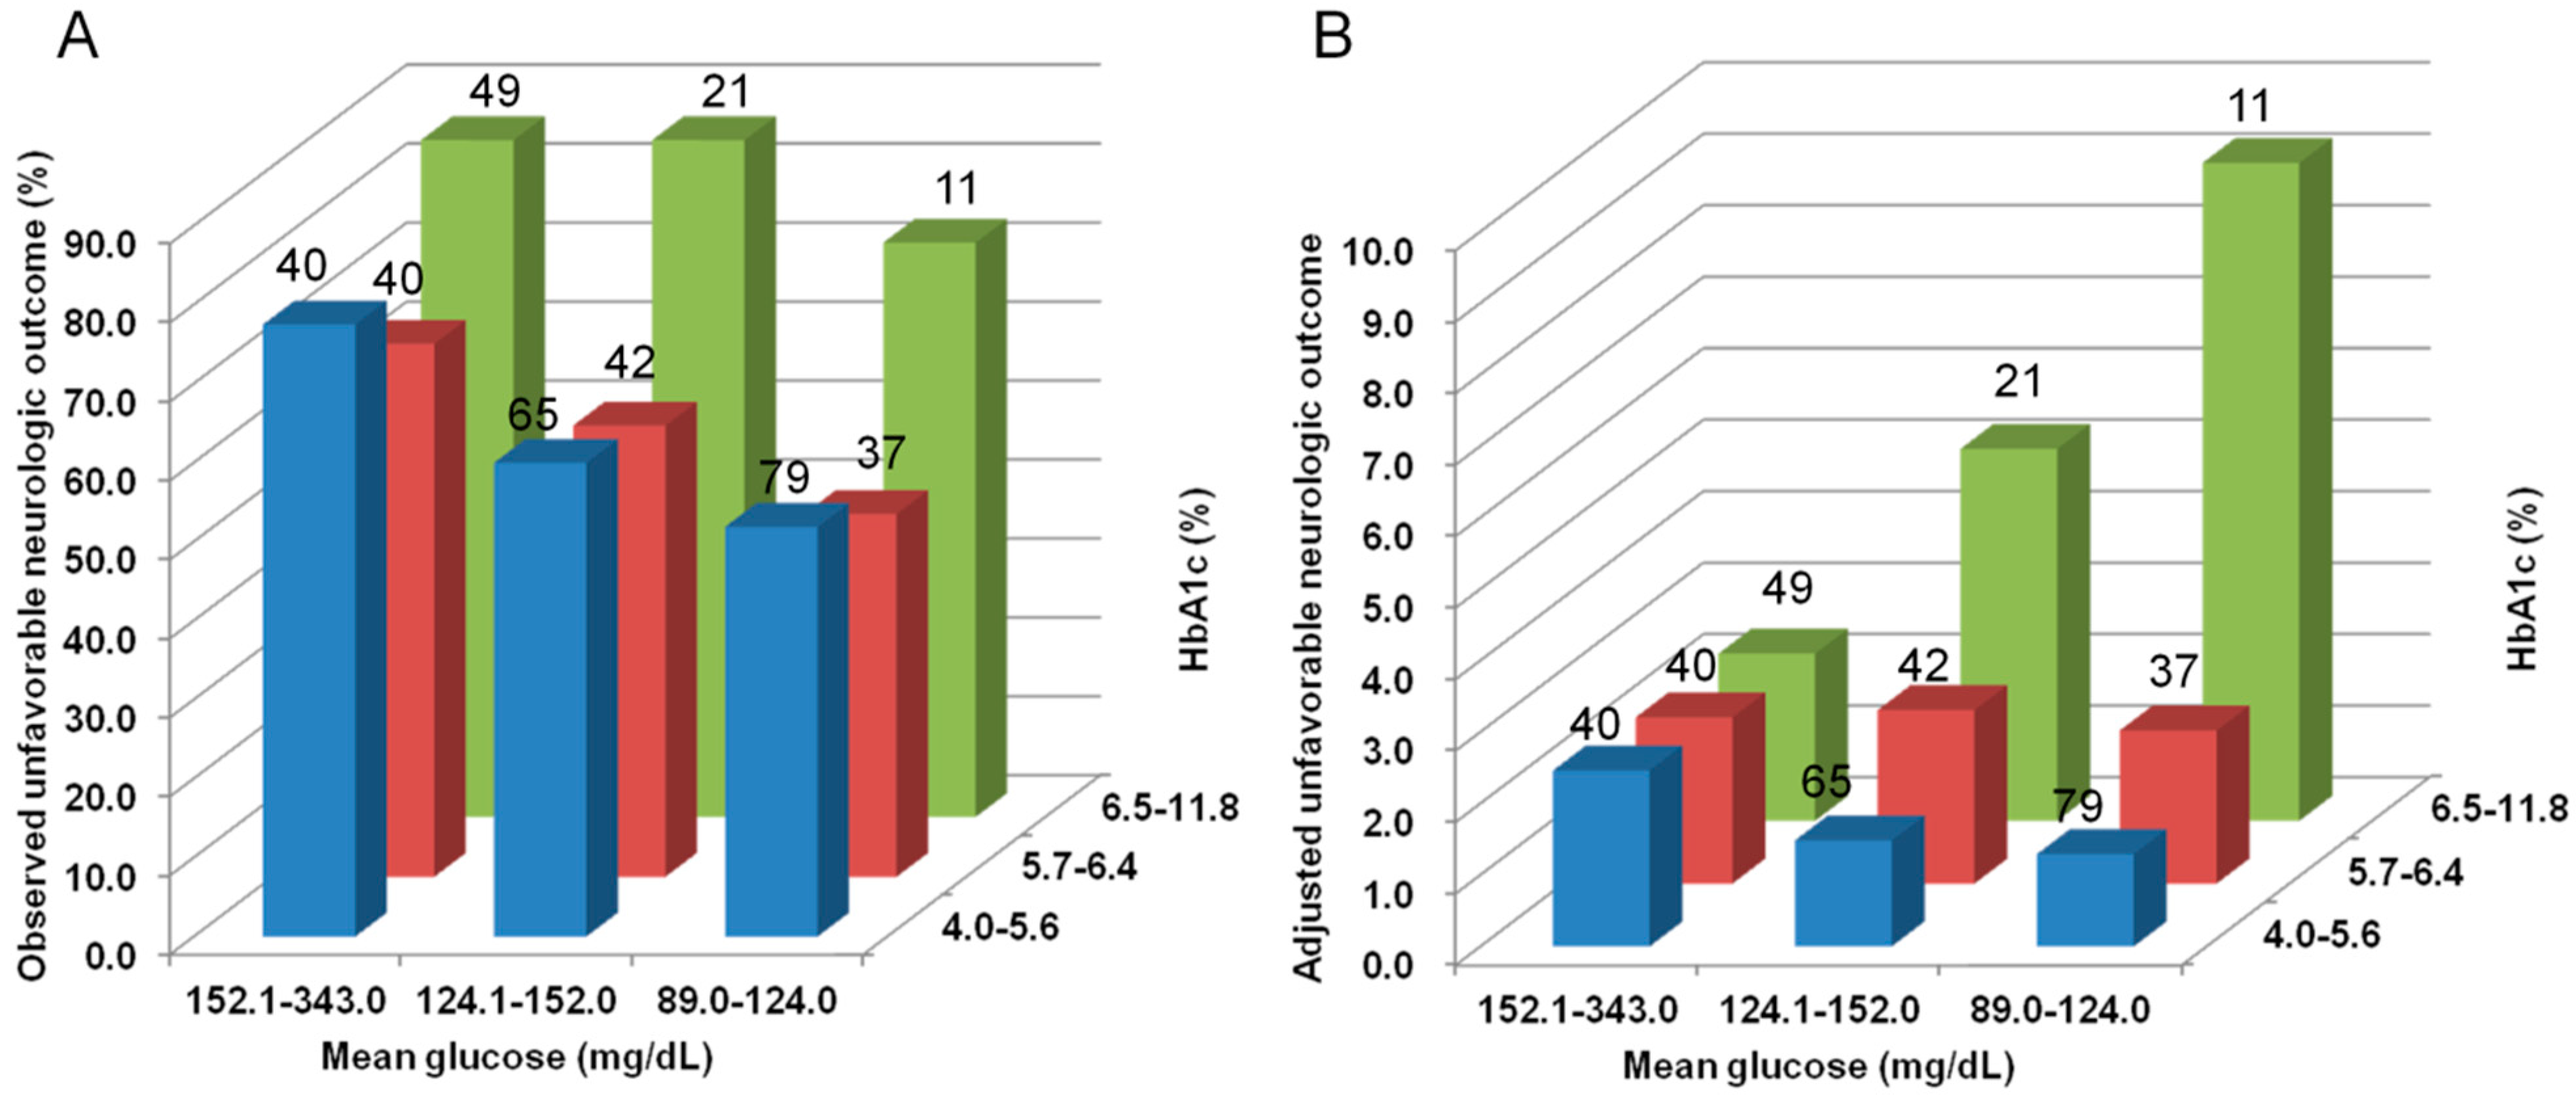
3.2. Outcomes
4. Discussion
5. Conclusions
Supplementary Materials
Author Contributions
Funding
Conflicts of Interest
References
- Nolan, J.P.; Soar, J.; Cariou, A.; Cronberg, T.; Moulaert, V.R.; Deakin, C.D.; Bottiger, B.W.; Friberg, H.; Sunde, K.; Sandroni, C. European Resuscitation Council and European Society of Intensive Care Medicine Guidelines for Post-resuscitation Care 2015: Section 5 of the European Resuscitation Council Guidelines for Resuscitation 2015. Resuscitation 2015, 95, 202–222. [Google Scholar] [CrossRef] [PubMed]
- Callaway, C.W.; Donnino, M.W.; Fink, E.L.; Geocadin, R.G.; Golan, E.; Kern, K.B.; Leary, M.; Meurer, W.J.; Peberdy, M.A.; Thompson, T.M.; et al. Part 8: Post-Cardiac Arrest Care: 2015 American Heart Association Guidelines Update for Cardiopulmonary Resuscitation and Emergency Cardiovascular Care. Circulation 2015, 132, S465–S482. [Google Scholar] [CrossRef] [PubMed]
- Skrifvars, M.B.; Pettilä, V.; Rosenberg, P.H.; Castrén, M. A multiple logistic regression analysis of in-hospital factors related to survival at six months in patients resuscitated from out-of-hospital ventricular fibrillation. Resuscitation 2003, 59, 319–328. [Google Scholar] [CrossRef]
- Nielsen, N.; Sunde, K.; Hovdenes, J.; Riker, R.R.; Rubertsson, S.; Stamment, P.; Nilsson, F.; Friberg, H.; The Hypothermia Network. Adverse events and their relation to mortality in out-of-hospital cardiac arrest patients treated with therapeutic hypothermia. Crit. Care Med. 2011, 39, 57–64. [Google Scholar] [CrossRef] [PubMed]
- Kim, S.H.; Choi, S.P.; Park, K.N.; Lee, S.J.; Lee, K.W.; Jeong, T.O.; Youn, C.S.; Korean Hypothermia Network Investigators. Association of blood glucose at admission with outcomes in patients treated with therapeutic hypothermia after cardiac arrest. Am. J. Emerg. Med. 2014, 32, 900–904. [Google Scholar] [CrossRef] [PubMed]
- McCowen, K.C.; Malhotra, A.; Bistrian, B.R. Stress-induced hyperglycemia. Crit. Care Clin. 2011, 17, 107–124. [Google Scholar] [CrossRef]
- Investigators, N.-S.S.; Finfer, S.; Chittock, D.R.; Su, S.Y.; Blair, D.; Foster, D.; Dhingra, V.; Bellomo, R.; Cook, D.; Dodek, P.; et al. Intensive versus conventional glucose control in critically ill patients. N. Engl. J. Med. 2009, 360, 1283–1297. [Google Scholar]
- Oksanen, T.; Skrifvars, M.B.; Varpula, T.; Kuitunen, A.; Pettila, V.; Nurmi, J.; Castren, M. Strict versus moderate glucose control after resuscitation from ventricular fibrillation. Intensive Care Med. 2007, 33, 2093–2100. [Google Scholar] [CrossRef] [PubMed]
- Nathan, D.M.; Turgeon, H.; Regan, S. Relationship between glycated haemoglobin levels and mean glucose levels over time. Diabetologia 2007, 50, 2239–2244. [Google Scholar] [CrossRef]
- Hempe, J.M.; Gomez, R.; McCarter, R.J., Jr.; Chalew, S.A. High and low hemoglobin glycation phenotypes in type 1 diabetes: A challenge for interpretation of glycemic control. J. Diabetes Complicat. 2002, 16, 313–320. [Google Scholar] [CrossRef]
- Nathan, D.M.; Singer, D.E.; Hurxthal, K.; Goodson, J.D. The clinical information value of the glycosylated hemoglobin assay. N. Engl. J. Med. 1984, 310, 341–346. [Google Scholar] [CrossRef] [PubMed]
- Nathan, D.M.; Kuenen, J.; Borg, R.; Zheng, H.; Schoenfeld, D.; Heine, R.J.; Group, A.c.-D.A.G.S. Translating the A1C assay into estimated average glucose values. Diabetes Care 2008, 31, 1473–1478. [Google Scholar] [CrossRef] [PubMed]
- Wang, C.H.; Chang, J.L.; Huang, C.H.; Chang, W.T.; Tsai, M.S.; Yu, P.H.; Wu, Y.W.; Chen, W.J.; Tseng, W.K. The association between long-term glycaemic control, glycaemic gap and neurological outcome of in-hospital cardiac arrest in diabetics: A retrospective cohort study. Resuscitation 2018, 133, 18–24. [Google Scholar] [CrossRef] [PubMed]
- Vincent, J.L.; de Mendonca, A.; Cantraine, F.; Moreno, R.; Takala, J.; Suter, P.M.; Sprung, C.L.; Colardyn, F.; Blecher, S. Use of the SOFA score to assess the incidence of organ dysfunction/failure in intensive care units: Results of a multicenter, prospective study. Working group on "sepsis-related problems" of the European Society of Intensive Care Medicine. Crit. Care Med. 1998, 26, 1793–1800. [Google Scholar] [CrossRef] [PubMed]
- American Diabetes Association. Diagnosis and classification of diabetes mellitus. Diabetes Care 2010, 33, e57. [Google Scholar]
- Booth, C.M.; Boone, R.H.; Tomlinson, G.; Detsky, A.S. Is this patient dead, vegetative, or severely neurologically impaired? Assessing outcome for comatose survivors of cardiac arrest. JAMA 2004, 291, 870–879. [Google Scholar] [CrossRef] [PubMed]
- Nielsen, N.; Hovdenes, J.; Nilsson, F.; Rubertsson, S.; Stammet, P.; Sunde, K.; Valsson, F.; Wanscher, M.; Friberg, H.; Hypothermia, N. Outcome, timing and adverse events in therapeutic hypothermia after out-of-hospital cardiac arrest. Acta Anaesthesiol. Scand. 2009, 53, 926–934. [Google Scholar] [CrossRef]
- Daviaud, F.; Dumas, F.; Demars, N.; Geri, G.; Bougle, A.; Morichau-Beauchant, T.; Nguyen, Y.L.; Bougouin, W.; Pene, F.; Charpentier, J.; et al. Blood glucose level and outcome after cardiac arrest: Insights from a large registry in the hypothermia era. Intensive Care Med. 2014, 40, 855–862. [Google Scholar] [CrossRef]
- Beiser, D.G.; Carr, G.E.; Edelson, D.P.; Peberdy, M.A.; Hoek, T.L. Derangements in blood glucose following initial resuscitation from in-hospital cardiac arrest: A report from the national registry of cardiopulmonary resuscitation. Resuscitation 2009, 80, 624–630. [Google Scholar] [CrossRef]
- Borgquist, O.; Wise, M.P.; Nielsen, N.; Al-Subaie, N.; Cranshaw, J.; Cronberg, T.; Glover, G.; Hassager, C.; Kjaergaard, J.; Kuiper, M.; et al. Dysglycemia, Glycemic Variability, and Outcome After Cardiac Arrest and Temperature Management at 33 degrees C and 36 degrees C. Crit. Care Med. 2017, 45, 1337–1343. [Google Scholar] [CrossRef]
- Kar, P.; Plummer, M.P.; Bellomo, R.; Jenkins, A.J.; Januszewski, A.S.; Chapman, M.J.; Jones, K.L.; Horowitz, M.; Deane, A.M. Liberal glycemic control in critically ill patients with type 2 diabetes: An exploratory study. Crit. Care Med. 2016, 44, 1695–1703. [Google Scholar] [CrossRef] [PubMed]
- Luethi, N.; Cioccari, L.; Biesenbach, P.; Lucchetta, L.; Kagaya, H.; Morgan, R.; Di Muzio, F.; Presello, B.; Gaafar, D.; Hay, A.; et al. Liberal glucose control in ICU patients with diabetes: A before-and-after study. Crit. Care Med. 2018, 46, 935–942. [Google Scholar] [CrossRef] [PubMed]
- Luethi, N.; Cioccari, L.; Eastwood, G.; Biesenbach, P.; Morgan, R.; Sprogis, S.; Young, H.; Peck, L.; Chong, C.K.; Moore, S. Hospital-acquired complications in intensive care unit patients with diabetes: A before-and-after study of a conventional versus liberal glucose control protocol. Acta Anaesthesiol. Scand. 2019, 63, 761–768. [Google Scholar] [CrossRef] [PubMed]
- Investigators, N.-S.S.; Finfer, S.; Liu, B.; Chittock, D.R.; Norton, R.; Myburgh, J.A.; McArthur, C.; Mitchell, I.; Foster, D.; Dhingra, V.; et al. Hypoglycemia and risk of death in critically ill patients. N. Engl. J. Med. 2012, 367, 1108–1118. [Google Scholar] [CrossRef] [PubMed]
- Jakkula, P.; Reinikainen, M.; Hastbacka, J.; Loisa, P.; Tiainen, M.; Pettila, V.; Toppila, J.; Lahde, M.; Backlund, M.; Okkonen, M.; et al. Targeting two different levels of both arterial carbon dioxide and arterial oxygen after cardiac arrest and resuscitation: A randomised pilot trial. Intensive Care Med. 2018, 44, 2112–2121. [Google Scholar] [CrossRef]
- Eastwood, G.M.; Schneider, A.G.; Suzuki, S.; Peck, L.; Young, H.; Tanaka, A.; Martensson, J.; Warrillow, S.; McGuinness, S.; Parke, R.; et al. Targeted therapeutic mild hypercapnia after cardiac arrest: A phase II multi-centre randomised controlled trial (the CCC trial). Resuscitation 2016, 104, 83–90. [Google Scholar] [CrossRef]
- Wiberg, S.; Hassager, C.; Stammet, P.; Winther-Jensen, M.; Thomsen, J.H.; Erlinge, D.; Wanscher, M.; Nielsen, N.; Pellis, T.; Aneman, A.; et al. Single versus Serial Measurements of Neuron-Specific Enolase and Prediction of Poor Neurological Outcome in Persistently Unconscious Patients after Out-Of-Hospital Cardiac Arrest—A TTM-Trial Substudy. PLoS ONE 2017, 12, e0168894. [Google Scholar] [CrossRef]


| 1. Target glucose level: 80–200 mg/dL | |
| 2. Measure blood glucose every four hours in blood samples obtained from an arterial catheter using the Accu-check, except if hypoglycemia (<70 mg/dL) or hyperglycemia (>350 mg/dL) are observed. | |
| 3. Intervention for glucose control | |
| Glucose Level | Intervention |
| <60 mg/dL | Administer 50 mL of D20W intravenously and recheck glucose in 30 min. If glucose remains <60 mg/dL, repeat intravenous administration of 50 mL of D20W every 30 min until glucose is >60 mg/dL |
| 60–79 mg/dL | Do not give an insulin injection. Recheck blood glucose every hour. If glucose remains <70 mg/dL, administer 25 mL of D20W intravenously every hour until glucose is >70 mg/dL |
| 80–200 mg/dL | Do not give an insulin injection. Recheck blood glucose every 4 h |
| 201–250 mg/dL | Administer 2 U of regular insulin intravenously. Recheck blood glucose every 4 h |
| 251–350 mg/dL | Administer 4 U of regular insulin intravenously. Recheck blood glucose every 4 h |
| >350 mg/dL | Administer 6 U of regular insulin intravenously. Recheck blood glucose in 1 h |
| Total (n = 384) | EAG (n = 248) | Standard (n = 136) | p | ASD | |
|---|---|---|---|---|---|
| Demographic characteristics | |||||
| Age (years), median (IQR) | 61.0 (50.0–70.0) | 59.0 (47.0–68.0) | 63.5 (53.3–72.0) | 0.002 | 0.326 |
| Male, n (%) | 255 (66.4) | 170 (68.5) | 85 (62.5) | 0.230 | 0.112 |
| Pre-existing illness, n (%) | |||||
| Coronary artery disease | 65 (16.9) | 36 (14.5) | 29 (21.3) | 0.089 | 0.170 |
| Congestive heart failure | 37 (9.6) | 24 (9.7) | 13 (9.6) | 0.970 | 0.004 |
| Hypertension | 167 (43.5) | 99 (39.9) | 68 (50.0) | 0.057 | 0.176 |
| Diabetes | 115 (29.9) | 54 (21.8) | 61 (44.9) | <0.001 | 0.511 |
| Pulmonary disease | 18 (4.7) | 10 (4.0) | 8 (5.9) | 0.412 | 0.083 |
| Renal impairment | 48 (12.5) | 30 (12.1) | 18 (13.2) | 0.747 | 0.032 |
| Cerebrovascular accident | 27 (7.0) | 16 (6.5) | 11 (8.1) | 0.549 | 0.060 |
| Hepatic disease | 6 (1.6) | 4 (1.6) | 2 (1.5) | 1.000 | 0.011 |
| Body mass index (kg/m2), median (IQR) | 22.9 (21.3–25.2) | 23.1 (21.3–25.4) | 22.8 (21.1–24.8) | 0.337 | 0.156 |
| Cardiac arrest characteristics | |||||
| OHCA, n (%) | 319 (83.1) | 216 (87.1) | 103 (75.7) | 0.005 | 0.215 |
| Witnessed, n (%) | 286 (74.5) | 182 (73.4) | 104 (76.5) | 0.507 | 0.054 |
| Bystander CPR, n (%) | 240 (62.5) | 156 (62.9) | 84 (61.8) | 0.826 | 0.018 |
| Shockable rhythm, n (%) | 130 (33.9) | 94 (37.9) | 36 (26.5) | 0.024 | 0.194 |
| Cardiac etiology, n (%) | 214 (55.7) | 141 (56.9) | 73 (53.7) | 0.549 | 0.050 |
| Adrenaline (mg), median (IQR) | 2.0 (1.0–4.0), 381 * | 2.0 (0.0–4.0), 245 * | 3.0 (2.0–5.0) | <0.001 | 0.311 |
| Time to ROSC (min), median (IQR) | 27.0 (15.0–40.0) | 25.0 (15.0–37.0) | 30.0 (16.0–42.0) | 0.045 | 0.266 |
| Clinical characteristics | |||||
| HbA1c (%), median (IQR) | 5.7 (5.3–6.3) | 5.6 (5.3–6.1) | 5.9 (5.4–7.0) | <0.001 | 0.494 |
| Hemoglobin (mg/dL), median (IQR) | 13.0 (10.9–14.8) | 13.3 (11.2–14.9) | 12.1 (10.6–14.5) | 0.023 | 0.220 |
| Lactate (mmol/L), median (IQR) | 7.4 (4.2–10.3) | 6.8 (4.2–9.7) | 8.1 (4.3–10.9) | 0.075 | 0.174 |
| Glucose (mg/dL), median (IQR) | 230 (169–301) | 214 (159–274) | 281 (201–337) | <0.001 | 0.525 |
| PaO2 (mmHg), median (IQR) | 137 (85–220) | 137 (87–220) | 139 (81–223) | 0.845 | 0.034 |
| PaCO2 (mmHg), median (IQR) | 38.0 (30.9–47.0) | 38.0 (31.0–46.0) | 38.4 (30.1–48.8) | 0.516 | 0.101 |
| GCS, median (IQR) | 3 (3–3) | 3 (3–4) | 3 (3–3) | 0.083 | 0.224 |
| SOFA score, median (IQR) | 9 (7–12) | 8 (6–11) | 10 (7–13) | <0.001 | 0.372 |
| Time from ROSC to TH (min), median (IQR) | 235 (175–310) | 240 (180–315) | 231 (163–302) | 0.221 | 0.120 |
| Induction duration (h), median (IQR) | 2.3 (1.3–3.3) | 2.5 (1.5–3.5) | 2.0 (1.0–2.8) | 0.001 | 0.360 |
| Rewarming duration (h), median (IQR) | 13.0 (12.0–16.0) | 13.0 (12.0–16.0) | 14.0 (12.0–16.0) | 0.244 | 0.155 |
| Total (n = 186) | EAG (n = 93) | Standard (n = 93) | p | ASD | |
|---|---|---|---|---|---|
| Demographic characteristics | |||||
| Age (years), median (IQR) | 62.0 (51.0–70.0) | 63.0 (51.0–70.0) | 60.0 (50.5–69.5) | 0.442 | 0.101 |
| Male, n (%) | 122 (65.6) | 61 (65.6) | 61 (65.6) | 1.000 | 0.000 |
| Pre-existing illness, n (%) | |||||
| Coronary artery disease | 29 (15.6) | 10 (10.8) | 19 (20.4) | 0.078 | 0.283 |
| Congestive heart failure | 17 (9.1) | 7 (7.5) | 10 (10.8) | 0.629 | 0.114 |
| Hypertension | 82 (44.1) | 44 (47.3) | 38 (40.9) | 0.488 | 0.126 |
| Diabetes | 52 (28.0) | 26 (28.0) | 26 (28.0) | 1.000 | 0.000 |
| Pulmonary disease | 11 (5.9) | 5 (5.4) | 6 (6.5) | 1.000 | 0.046 |
| Renal impairment | 17 (9.1) | 10 (10.8) | 7 (7.5) | 0.629 | 0.110 |
| Cerebrovascular accident | 15 (8.1) | 8 (8.6) | 7 (7.5) | 1.000 | 0.039 |
| Hepatic disease | 1 (0.5) | 0 (0.0) | 1 (1.1) | NA | 0.148 |
| Body mass index (kg/m2), median (IQR) | 23.1 (21.3–25.4) | 23.1 (21.2–25.4) | 23.2 (21.4–25.2) | 0.948 | 0.023 |
| Cardiac arrest characteristics | |||||
| OHCA, n (%) | 153 (82.3) | 76 (81.7) | 77 (82.8) | 1.000 | 0.028 |
| Witnessed, n (%) | 134 (72.0) | 66 (71.0) | 68 (73.1) | 0.864 | 0.048 |
| Bystander CPR, n (%) | 118 (63.4) | 60 (64.5) | 58 (62.4) | 0.880 | 0.044 |
| Shockable rhythm, n (%) | 54 (29.0) | 26 (28.0) | 28 (30.1) | 0.871 | 0.048 |
| Cardiac etiology, n (%) | 95 (51.1) | 44 (47.3) | 51 (54.8) | 0.360 | 0.157 |
| Adrenaline (mg), median (IQR) | 2.0 (1.0–5.0), 185 * | 3.0 (1.0–5.0), 92 * | 2.0 (1.0–5.0) | 0.975 | 0.041 |
| Time to ROSC (min), median (IQR) | 28.0 (15.8–40.0) | 29.0 (15.0–40.0) | 28.0 (16.0–39.5) | 0.523 | 0.082 |
| Clinical characteristics | |||||
| HbA1c (%), median (IQR) | 5.6 (5.3–6.2) | 5.6 (5.3–6.1) | 5.7 (5.4–6.4) | 0.053 | 0.143 |
| Hemoglobin (mg/dL), median (IQR) | 12.6 ± 2.6 | 12.4 ± 2.5 | 12.8 ± 2.6 | 0.366 | 0.135 |
| Lactate (mmol/L), median (IQR) | 7.8 (4.2–10.3) | 7.0 (4.2–10.3) | 8.0 (4.3–10.4) | 0.866 | 0.123 |
| Glucose (mg/dL), median (IQR) | 235 ± 84 | 232 ± 84 | 239 ± 85 | 0.558 | 0.081 |
| PaO2 (mmHg), median (IQR) | 140 (92–232) | 134 (96–229) | 145 (86–245) | 0.805 | 0.014 |
| PaCO2 (mmHg), median (IQR) | 36.5 (29.1–47.0) | 35.7 (29.0–47.0) | 38.0 (30.0–47.2) | 0.708 | 0.041 |
| Glasgow Coma Scale, median (IQR) | 3 (3–3) | 3 (3–3) | 3 (3–3) | 0.906 | 0.046 |
| SOFA score, median (IQR) | 9 (7–12) | 10 (7–12) | 9 (7–12) | 0.769 | 0.066 |
| Time from ROSC to TH (min), median (IQR) | 240 (185–309) | 260 (199–313) | 234 (165–301) | 0.178 | 0.191 |
| Induction duration (h), median (IQR) | 2.0 (1.0–3.0) | 2.3 (1.0–3.0) | 2.0 (1.1–2.8) | 0.818 | 0.089 |
| Rewarming duration (h), median (IQR) | 14.0 (12.0–16.0) | 13.0 (12.0–16.0) | 14.0 (12.0–16.0) | 0.948 | 0.011 |
| Model | Number | Odds Ratio (95% Confidence Interval) | p |
|---|---|---|---|
| Crude | 384 | 0.444 (0.278–0.707) | 0.001 |
| Non-diabetic and pre-diabetic | 303 | 0.477 (0.282–0.804) | 0.006 |
| Diabetic | 81 | 0.718 (0.218–2.361) | 0.586 |
| Adjusted | 384 | 0.896 (0.455–1.764) | 0.750 |
| Non-diabetic and pre-diabetic | 303 | 0.974 (0.469–2.022) | 0.943 |
| Diabetic | 81 | 0.314 (0.037–2.697) | 0.291 |
| Crude in matched cohort | 186 | 1.176 (0.617–2.242) | 0.622 |
| Non-diabetic and pre-diabetic | 150 | 1.273 (0.635–2.551) | 0.497 |
| Diabetic | 36 | 1.083 (0.158–7.435) | 0.935 |
| Adjusted in matched cohort | 186 | 0.540 (0.143–2.034) | 0.362 |
| Non-diabetic and pre-diabetic | 150 | 1.157 (0.448–2.990) | 0.763 |
| Diabetic | 36 | 3.827 (0.111–131.563) | 0.457 |
© 2019 by the authors. Licensee MDPI, Basel, Switzerland. This article is an open access article distributed under the terms and conditions of the Creative Commons Attribution (CC BY) license (http://creativecommons.org/licenses/by/4.0/).
Share and Cite
Jung, Y.H.; Lee, B.K.; Jeung, K.W.; Lee, D.H.; Lee, H.Y.; Cho, Y.S.; Youn, C.S.; Park, J.S.; Min, Y.I. Association between Achievement of Estimated Average Glucose Level and 6-Month Neurologic Outcome in Comatose Cardiac Arrest Survivors: A Propensity Score-Matched Analysis. J. Clin. Med. 2019, 8, 1480. https://doi.org/10.3390/jcm8091480
Jung YH, Lee BK, Jeung KW, Lee DH, Lee HY, Cho YS, Youn CS, Park JS, Min YI. Association between Achievement of Estimated Average Glucose Level and 6-Month Neurologic Outcome in Comatose Cardiac Arrest Survivors: A Propensity Score-Matched Analysis. Journal of Clinical Medicine. 2019; 8(9):1480. https://doi.org/10.3390/jcm8091480
Chicago/Turabian StyleJung, Yong Hun, Byung Kook Lee, Kyung Woon Jeung, Dong Hun Lee, Hyoung Youn Lee, Yong Soo Cho, Chun Song Youn, Jung Soo Park, and Yong II Min. 2019. "Association between Achievement of Estimated Average Glucose Level and 6-Month Neurologic Outcome in Comatose Cardiac Arrest Survivors: A Propensity Score-Matched Analysis" Journal of Clinical Medicine 8, no. 9: 1480. https://doi.org/10.3390/jcm8091480
APA StyleJung, Y. H., Lee, B. K., Jeung, K. W., Lee, D. H., Lee, H. Y., Cho, Y. S., Youn, C. S., Park, J. S., & Min, Y. I. (2019). Association between Achievement of Estimated Average Glucose Level and 6-Month Neurologic Outcome in Comatose Cardiac Arrest Survivors: A Propensity Score-Matched Analysis. Journal of Clinical Medicine, 8(9), 1480. https://doi.org/10.3390/jcm8091480