Article

Mechanical Ventilation Strategies Targeting Different Magnitudes of Collapse and Tidal Recruitment in Porcine Acid Aspiration-Induced Lung Injury

1
Department of Anesthesiology and Intensive Care Medicine, University Hospital Leipzig, 04103 Leipzig, Germany
2
Department of Anesthesiology, Intensive Care Medicine and Pain Therapy, St. Georg Hospital, 04129 Leipzig, Germany
3
Department of Visceral, Transplantation, Vascular and Thoracic Surgery, University Hospital Leipzig, 04103 Leipzig, Germany
4
Innovation Center Computer Assisted Surgery (ICCAS), University of Leipzig, Medical Faculty, 04103 Leipzig, Germany
5
Laboratory of Pneumology LIM09, Medical Faculty, São Paulo University, São Paulo 05508-060, Brazil
6
Department of Electronic Engineering, Federal University of Minas Gerais, Belo Horizonte 31270-901, Brazil
7
Department of Anesthesiology, University Medicine Göttingen, University of Göttingen, 37075 Göttingen, Germany
8
Department of Anesthesiology and Intensive Care Medicine, Hannover Medical School, 30625 Hannover, Germany
9
Department of Anesthesiology and Critical Care Medicine, University Hospital Dresden, Technische Universität Dresden, 01307 Dresden, Germany
10
Department for Horses, University of Leipzig, 04103 Leipzig, Germany
11
Department of Anesthesiology and Intensive Care Medicine, University Hospital Bonn, 53127 Bonn, Germany
12
Department of Anesthesiology, Intensive Care and Emergency Medicine, Pain Therapy, Bergmannstrost Hospital Halle, 06112 Halle, Germany
13
Department of Anesthesiology, Intensive Care Medicine, Emergency Medicine and Pain Therapy Heinrich-Braun-Hospital Zwickau, 08060 Zwickau, Germany
*
Author to whom correspondence should be addressed.
These authors contributed equally to this study.
J. Clin. Med. 2019, 8(8), 1250; https://doi.org/10.3390/jcm8081250
Submission received: 25 June 2019 / Revised: 6 August 2019 / Accepted: 14 August 2019 / Published: 18 August 2019

Abstract

:
Reducing ventilator-associated lung injury by individualized mechanical ventilation (MV) in patients with Acute Respiratory Distress Syndrome (ARDS) remains a matter of research. We randomly assigned 27 pigs with acid aspiration-induced ARDS to three different MV protocols for 24 h, targeting different magnitudes of collapse and tidal recruitment (collapse&TR): the ARDS-network (ARDSnet) group with low positive end-expiratory pressure (PEEP) protocol (permissive collapse&TR); the Open Lung Concept (OLC) group, PaO2/FiO2 >400 mmHg, indicating collapse&TR <10%; and the minimized collapse&TR monitored by Electrical Impedance Tomography (EIT) group, standard deviation of regional ventilation delay, SDRVD. We analyzed cardiorespiratory parameters, computed tomography (CT), EIT, and post-mortem histology. Mean PEEP over post-randomization measurements was significantly lower in the ARDSnet group at 6.8 ± 1.0 cmH2O compared to the EIT (21.1 ± 2.6 cmH2O) and OLC (18.7 ± 3.2 cmH2O) groups (general linear model (GLM) p < 0.001). Collapse&TR and SDRVD, averaged over all post-randomization measurements, were significantly lower in the EIT and OLC groups than in the ARDSnet group (collapse p < 0.001, TR p = 0.006, SDRVD p < 0.004). Global histological diffuse alveolar damage (DAD) scores in the ARDSnet group (10.1 ± 4.3) exceeded those in the EIT (8.4 ± 3.7) and OLC groups (6.3 ± 3.3) (p = 0.16). Sub-scores for edema and inflammation differed significantly (ANOVA p < 0.05). In a clinically realistic model of early ARDS with recruitable and nonrecruitable collapse, mechanical ventilation involving recruitment and high-PEEP reduced collapse&TR and resulted in improved hemodynamic and physiological conditions with a tendency to reduced histologic lung damage.

1. Introduction

In patients with Acute Respiratory Distress Syndrome (ARDS) mechanical ventilation with low tidal volumes (VT) can reduce complications such as ventilator associated lung injury (VALI) and mortality [1,2,3]. It remains uncertain, however, which magnitude of collapse and associated tidal recruitment (TR, i.e., cyclic opening and re-collapse during mechanical ventilation) should be targeted: while individualized high positive end-expiratory pressure (PEEP) and/or lung recruitment seems to be beneficial in some patients by reducing TR, it can instead be harmful in others [4,5,6,7].
A pragmatic approach individually selecting the PEEP level based on the ARDS severity is the low-PEEP table of the ARDS-network (ARDSnet), combining low VT ventilation and PEEP-FiO2 combinations depending on oxygenation [2,8]. Among the advantages of the ARDSnet PEEP/FiO2-table are its straightforward use and the limitation of VT and plateau airway pressure potentially reducing VALI.
Another approach to reduce VALI is based mainly on physiological rationale and involves reducing collapse and TR (collapse&TR) by combining lung re-aeration by recruitment maneuvers (RM) and subsequent decremental PEEP-titration along the expiratory limb of the individual pressure–volume curves [5,9,10,11,12,13,14]. Many parameters (e.g., oxygenation, compliance, quantitative computed tomography) can be estimated during a decremental PEEP-titration and can be used to identify an “individually optimized” lung condition and the corresponding PEEP to maintain it [9,10,15,16,17,18]. However, if lung collapse was assessed again after commencing mechanical ventilation with the “individualized” PEEP, it was seldom truly minimized or zero, suggesting the presence of nonrecruitable lung tissue [9,10,19].
Electrical Impedance Tomography (EIT) is a non-invasive bedside method for functional lung imaging. Parameters derived from EIT have been proposed to aid in detecting TR and/or collapse [20,21,22,23]. For example, the EIT-derived regional ventilation delay (RVD) and more specifically its variability considering all pixels (standard deviation of regional ventilation delay, SDRVD), was proposed for selecting individualized PEEPs high enough to minimize TR but also low enough to avoid PEEP-related complications (e.g., hyperinflation) [23]. Such attractive features of the SDRVD-approach and especially the avoidance of over-recruitment await further support and comparison with other approaches to mechanical ventilation [23].
In this study we used the clinically realistic and anesthesia-relevant acid-aspiration model for pulmonary (direct) ARDS, which so far has been deemed less recruitable. We performed a randomized comparison of three groups of pigs, which received mechanical ventilation for 24 h with PEEP individualized as follows: ARDSnet low-PEEP table, EIT-derived SDRVD, or Open-Lung-Concept (OLC) [2,9,23]. We analyzed changes in EIT, computed tomography (CT), histology, and cardiorespiratory parameters. We hypothesized that ventilation with PEEP individualized according to the EIT-derived SDRVD reduces collapse&TR to an extent comparable with the OLC and is associated with less histological damage than ARDSnet.

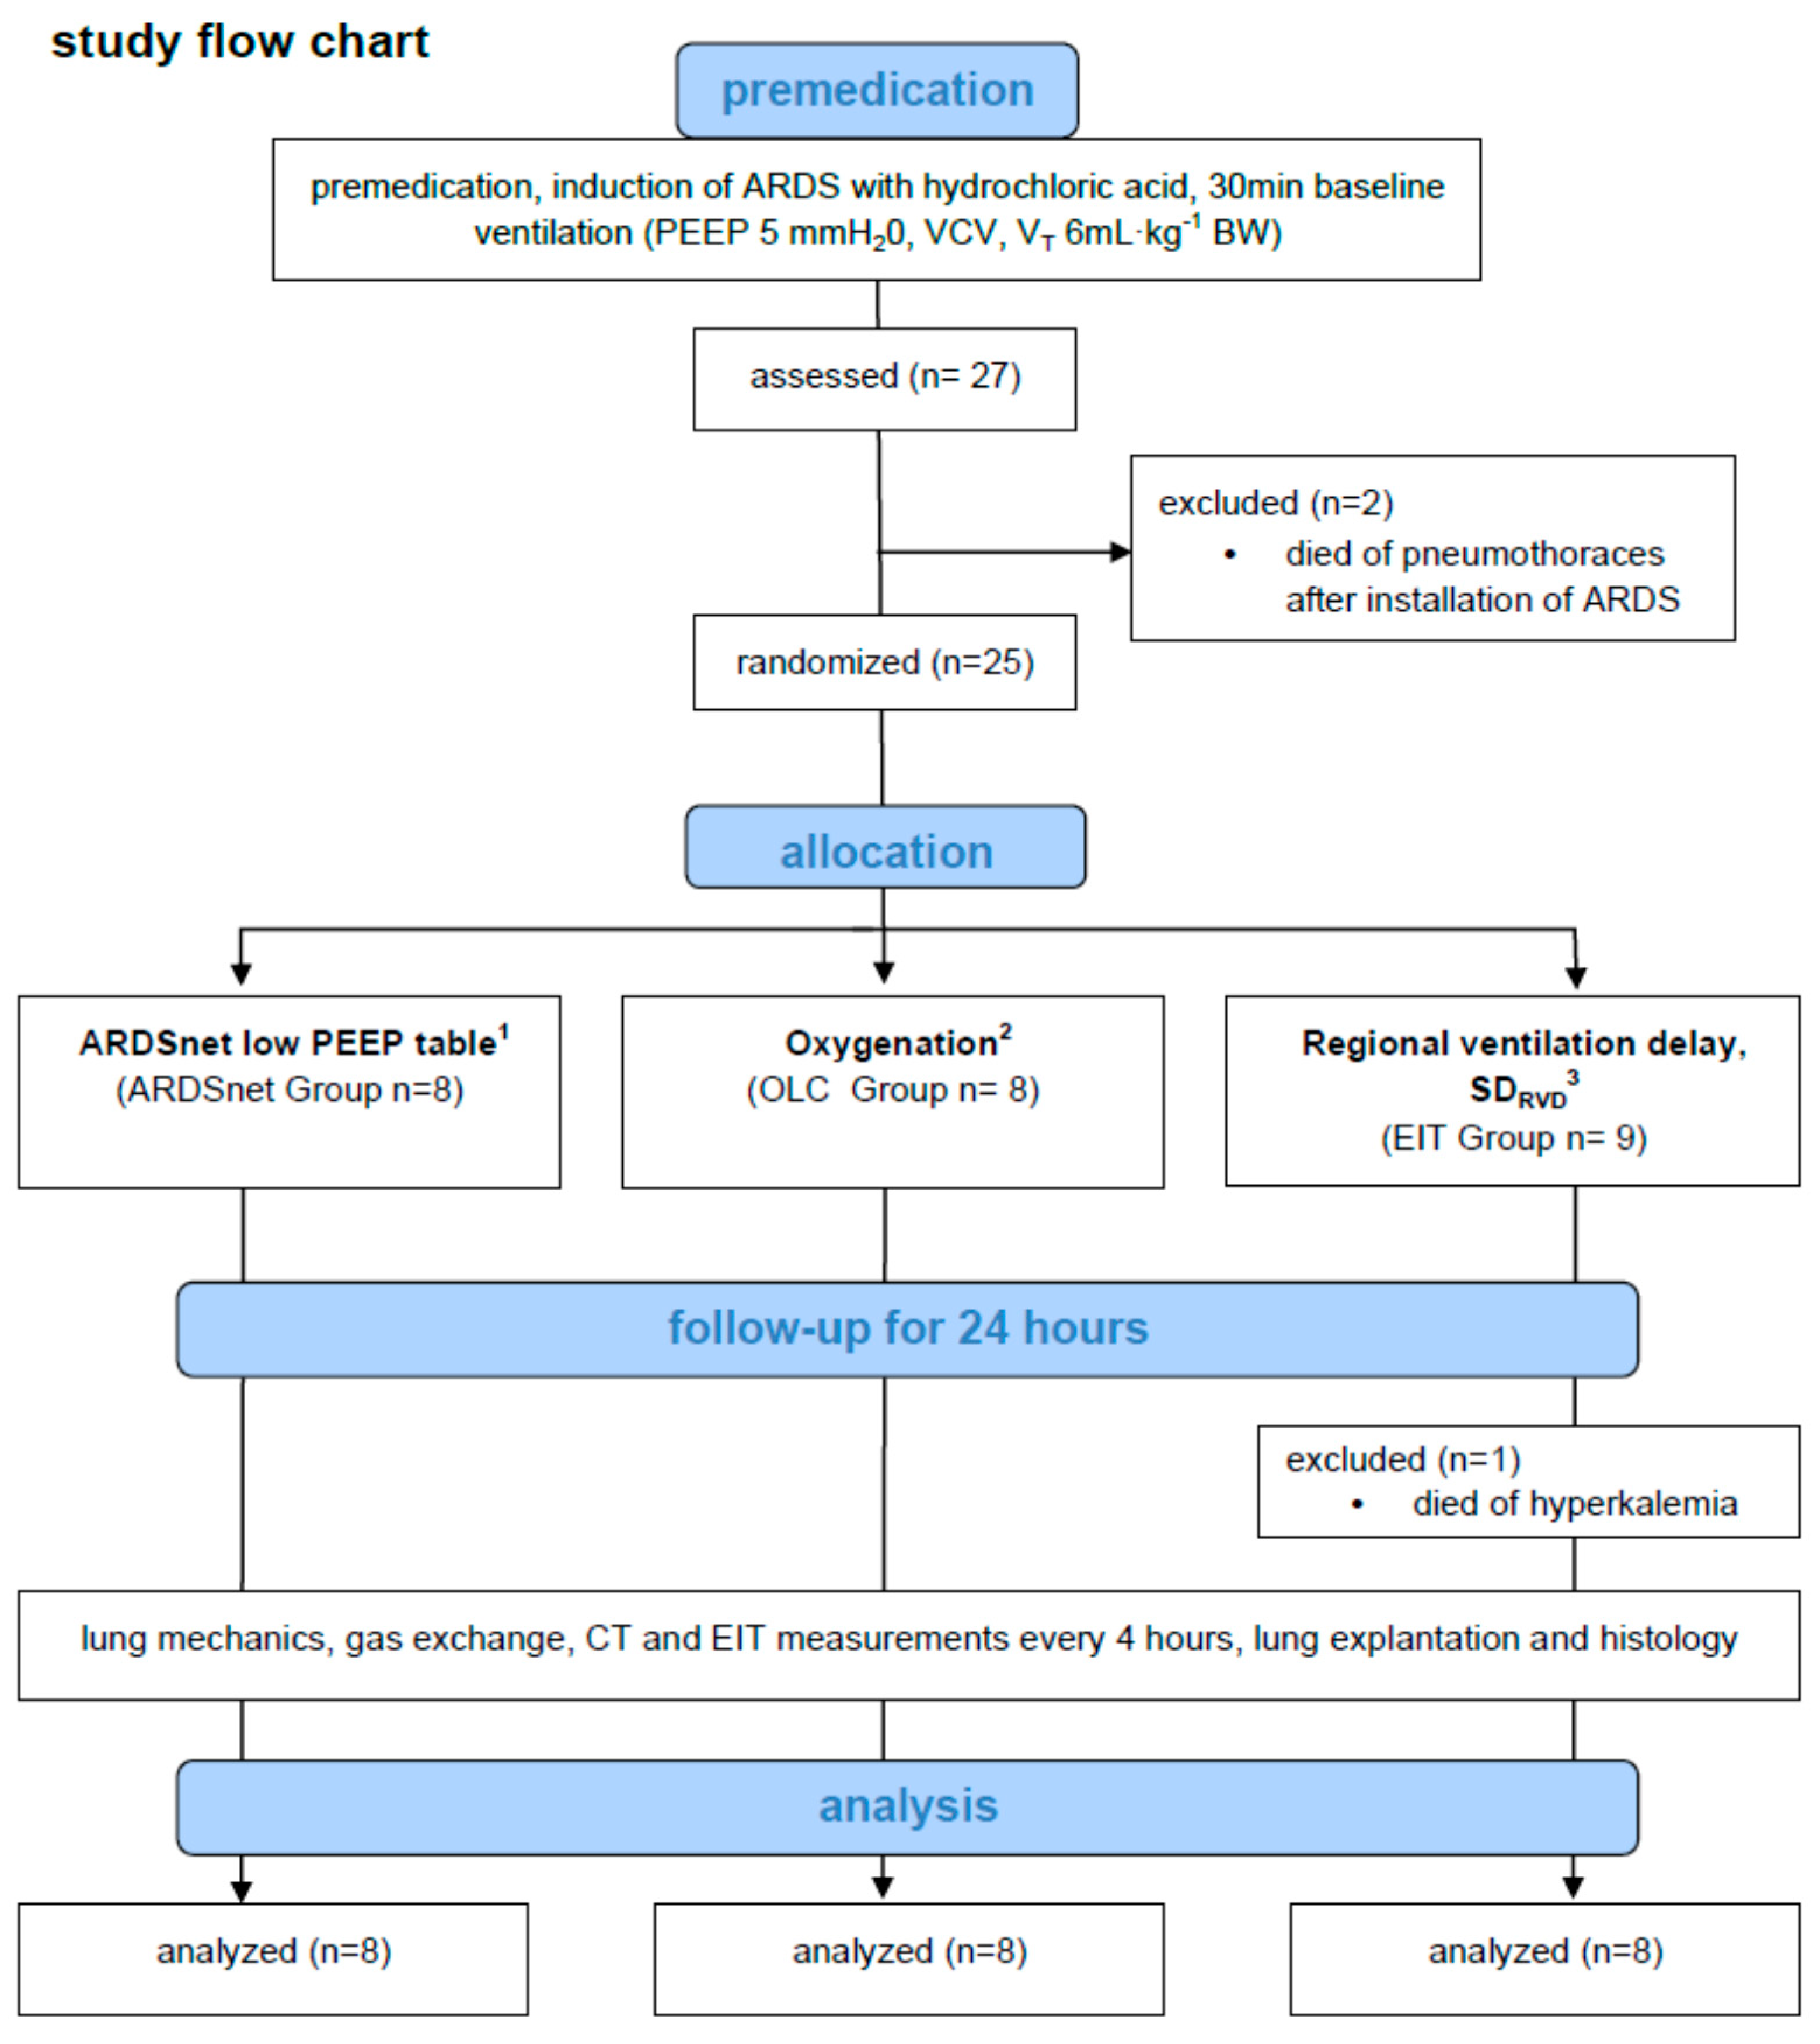
2. Materials and Methods

2.1. Animal Handling and Preparation

After approval by the animal ethics committee (Regierungspräsidium Leipzig, Leipzig, Germany, reference number TVV35/11, date of approval: 22 July 2008), animal experiments complying with the ARRIVE guidelines were conducted in the Surgical Clinic, Faculty of Veterinary Medicine, University of Leipzig, Leipzig, Germany [24]. Figure 1 illustrates the study flow-chart. Figure S1 in the Supplementary Materials (SM) illustrates the sequence of measurements.
Pigs (weight 36.8 ± 5.0 kg) were fasted and premedicated with midazolam (1 mg·kg−1 intramuscular) and ketamine (15 mg·kg−1 intramuscular). Animals were anaesthetized by infusion of fentanyl 5 (3–30) mg·kg−1·h−1, midazolam 2 (1–6) mg·kg−1·h−1, ketamine 15 (5–30) mg·kg−1·h−1, and pancuronium 0.15 mg·kg−1·h−1 and remained on the CT-table in supine position throughout the study.
After tracheostomy, baseline (BL) ventilation was initiated (PEEP 5 cmH2O, VT 6 mL·kg−1 bodyweight, inspiratory-to-expiratory (I:E) ratio 1:2, FiO2 30%). Respiratory rate (RR) was adjusted to maintain pH > 7.30. Sterile surgical instrumentation included arterial, central venous, pulmonary artery, and suprapubic urine catheters. Heparin (200 IE·h−1), Ringer-Acetat (5 mL·kg−1·h−1) and Cefuroxime (prophylaxis, 750 mg every 6 h) infusions were started after instrumentation.
Mean arterial pressure (MAP), mean pulmonary artery pressure, central venous pressure, heart rate (HR) and body temperature were monitored and waveforms were recorded continuously. Cardiac output (CO) was measured by transpulmonary thermodilution and systemic vascular resistance (SVR) and pulmonary vascular resistance (PVR) were calculated. Airway flow and pressure waveform signals were acquired continuously from the ventilator. Peak airway pressure (Paw-peak), plateau airway pressure (Paw-plateau), respiratory system compliance (compliance), and driving pressure (=Paw-plateau minus PEEP) were calculated using standard procedures [14]. Paw-plateau and PEEP were measured during zero flow conditions. All blood gas measurements (arterial and mixed-venous, co-oximetry) were performed after 5 min of ventilation with pure oxygen (100% O2). Intrapulmonary shunt (shunt) was calculated [25].
After the study, animals were euthanized by injecting 50 mmol potassium chloride during deepened anesthesia.

2.2. Acid Aspiration-Induced Pulmonary Acute Respiratory Distress Syndrome

Pulmonary ARDS was induced by intra-tracheal hydrochloric acid instillation (HCl, 0.1 molar). After five minutes of 100% O2-ventilation, a suctioning catheter was advanced through the endotracheal tube and 60 mL of HCl were instilled. Lung injury compatible with moderate ARDS was considered established when the PaO2 (100% O2) remained lower than 200 mmHg for 30 min under BL ventilation [26]. If this criterion was not reached, additional 30 mL HCl aliquots were instilled until PaO2 remained stable below 200 mmHg for 30 min.

2.3. Individualization of PEEP and Mechanical Ventilation

After establishing ARDS, 24 pigs were randomized (sealed envelopes) to one of three ventilation protocols using different individualized PEEPs for 24 h: ARDSnet [2], OLC [9], and EIT-derived SDRVD (EIT) [23].
In the OLC and EIT groups, PEEP was titrated according to different surrogates detecting the lung condition considered “optimal” according to the concept (see below). All decremental PEEP titrations were performed during volume-controlled ventilation (VCV, VT = 6 mL·kg−1 bodyweight) with 100% oxygen. An RM lasting two minutes during pressure-controlled ventilation (inspiratory pressure = 60 cmH2O, PEEP = 40 cmH2O) preceded decremental PEEP titrations. After recruitment, PEEP was reduced to 30 cmH2O (or 26 cmH2O in the case of intractable hemodynamic instability) and then decreased in steps of 2 cmH2O until either a PEEP = 6 cmH2O was reached or the SaO2 decreased below 90%. Every PEEP-level required about 10 min to allow for all necessary measurements (i.e., CT, EIT). In OLC animals, the PEEP-step, at which a 10% reduction of the individual maximum oxygenation (PaO2 during 100% O2 ventilation) occurred, was identified and 2 cmH2O added to obtain the PEEP used for subsequent ventilation [9]. In EIT animals, a slow inflation (inspiratory flow 4 L·min−1, inflation volume 12 mL·kg−1) was performed at every PEEP step and the minimal SDRVD identified the PEEP for subsequent ventilation (see below) [23]. RM and PEEP titration were repeated during the experiment based on objective experience-based criteria indicating derecruitment: an oxygenation decrease below 400 mmHg for OLC and a 20% increase of the SDRVD from the previous measurement point for EIT [10,27].

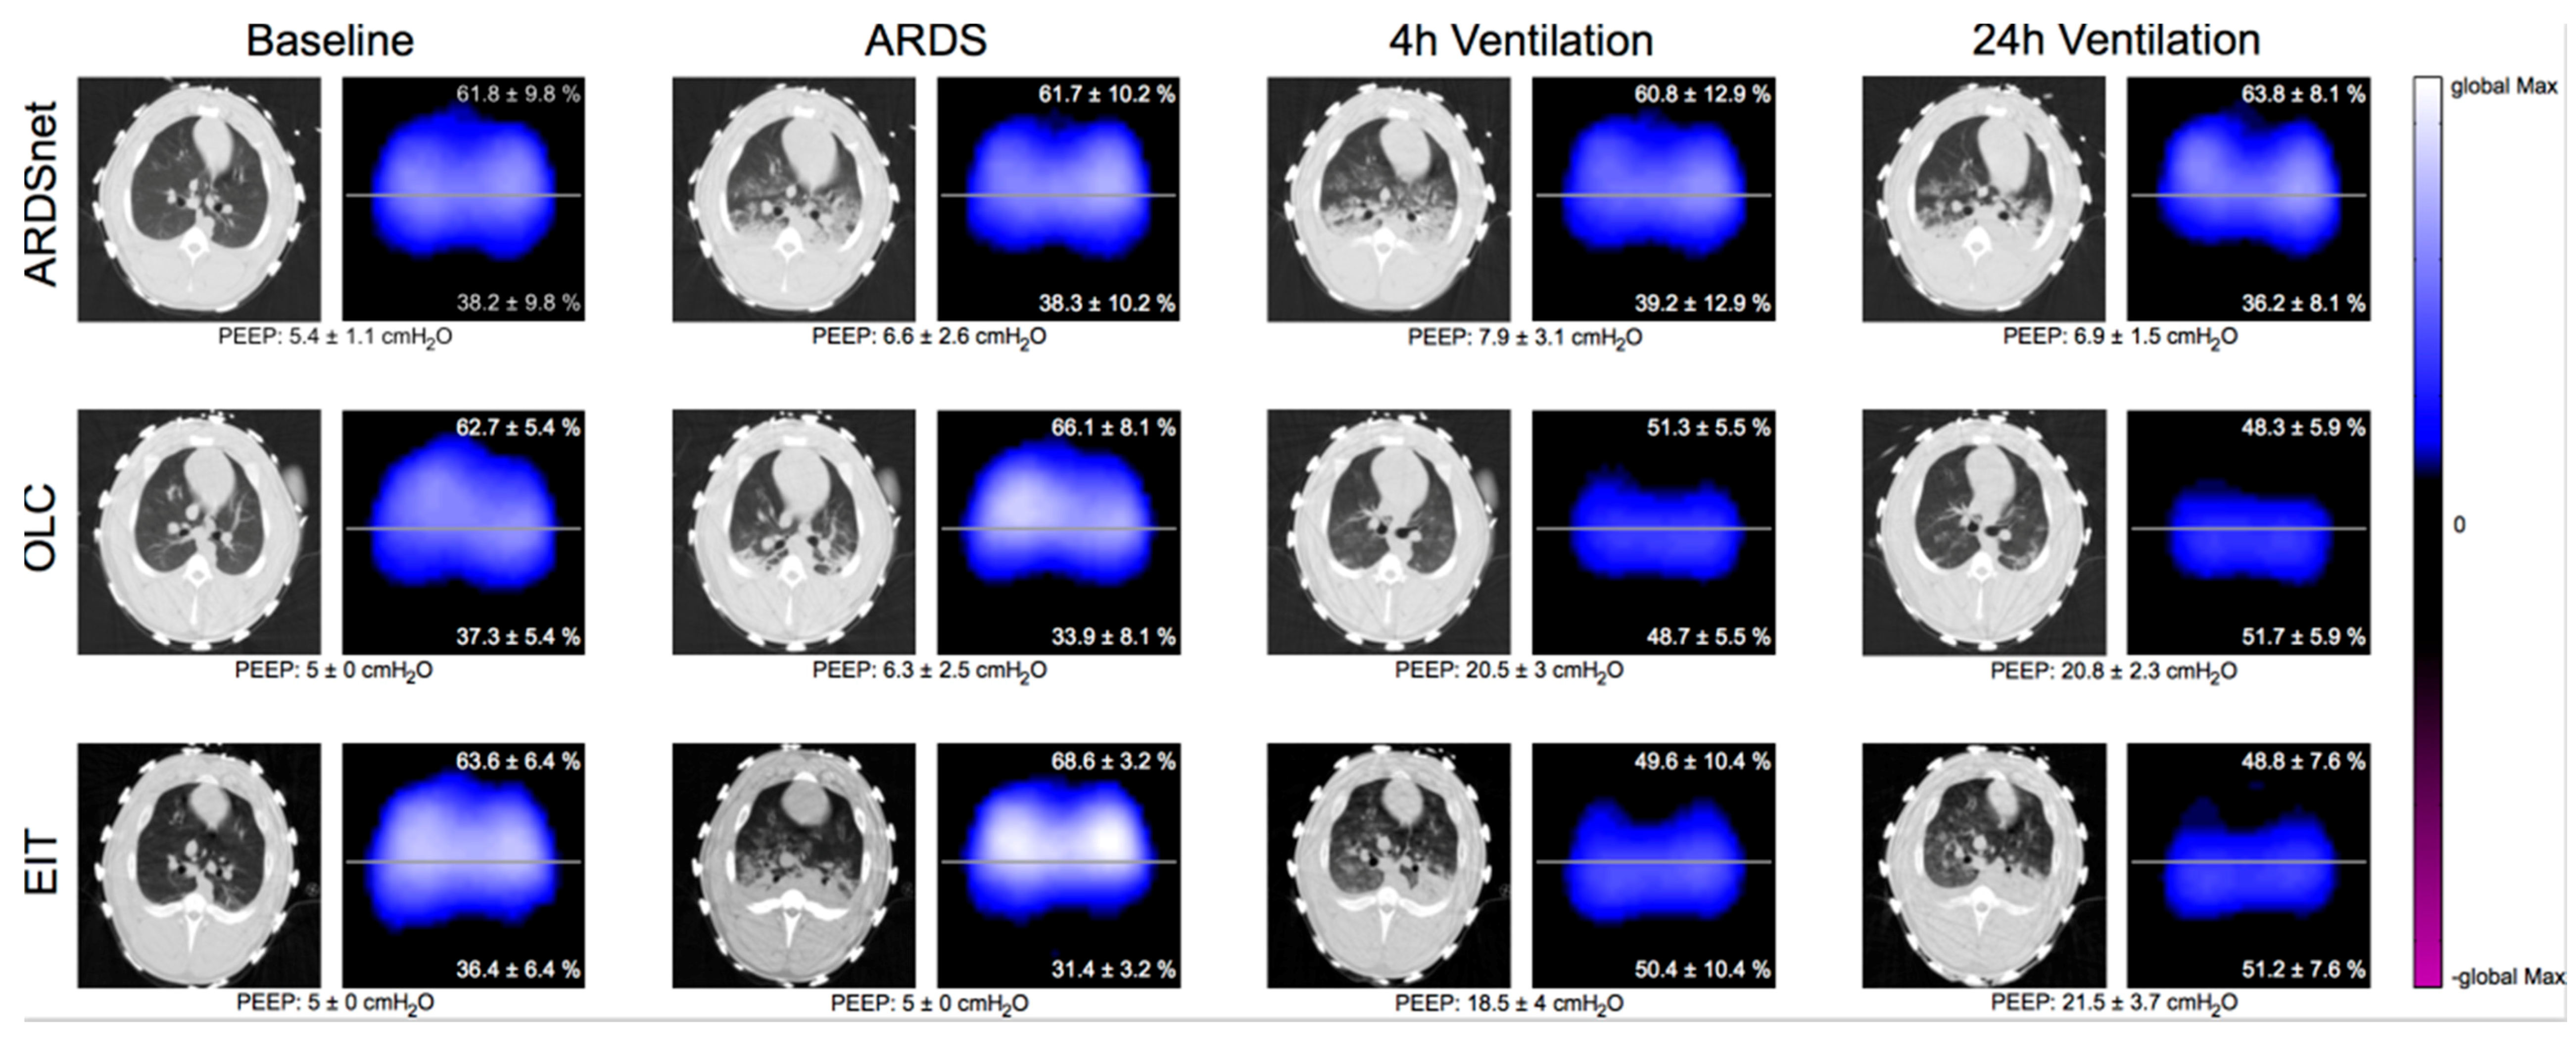
2.4. Quantitative Computed Tomography (qCT)

Whole-lung CT scans were taken without contrast medium. After manual segmentation of the lung images, qCT-parameters were calculated using standard procedures. Total lung mass (Mtotal) and volume (Vtotal) were identified within [−1000 to 100] Hounsfield units (HU). Differently aerated lung compartments were defined by the following intervals and calculated as a percentage of Mtotal: hyperinflated (Mhyper, [−1000 to −901] HU), normally aerated (Mnormal, [−900 to −501] HU), poorly aerated (Mpoor, [−500 to −101] HU), and non-aerated (Mnon, [−100 to 100] HU) [27,28,29,30]. We calculated TR by subtracting inspiratory from expiratory Mnon [9]. To characterize the time-weighted cumulative impact that different amounts of TR had on the lung parenchyma, we conceived the surrogate ‘tidal-recruitment-hours’ (TR-hours); we multiplied the amount of TR at a given measurement point by the period it had acted since the last measurement. These products from all measurement points were then summed up to give TR-hours.

2.5. Electrical Impedance Tomography

The PulmoVista 500 EIT-system (Dräger Medical Germany GmbH, Lübeck, Germany) was used. The SDRVD, representing inhomogeneous regional ventilation (EIT-surrogate for TR), was calculated offline from the EIT-data sampled during slow inflation [23]. SDRVD-hours were calculated in analogy to TR-hours. The regional distribution of ventilation was described using the center of ventilation (CoV) [31,32] with reconstructed tidal images based on Dräger algorithms (see Supplementary Material).

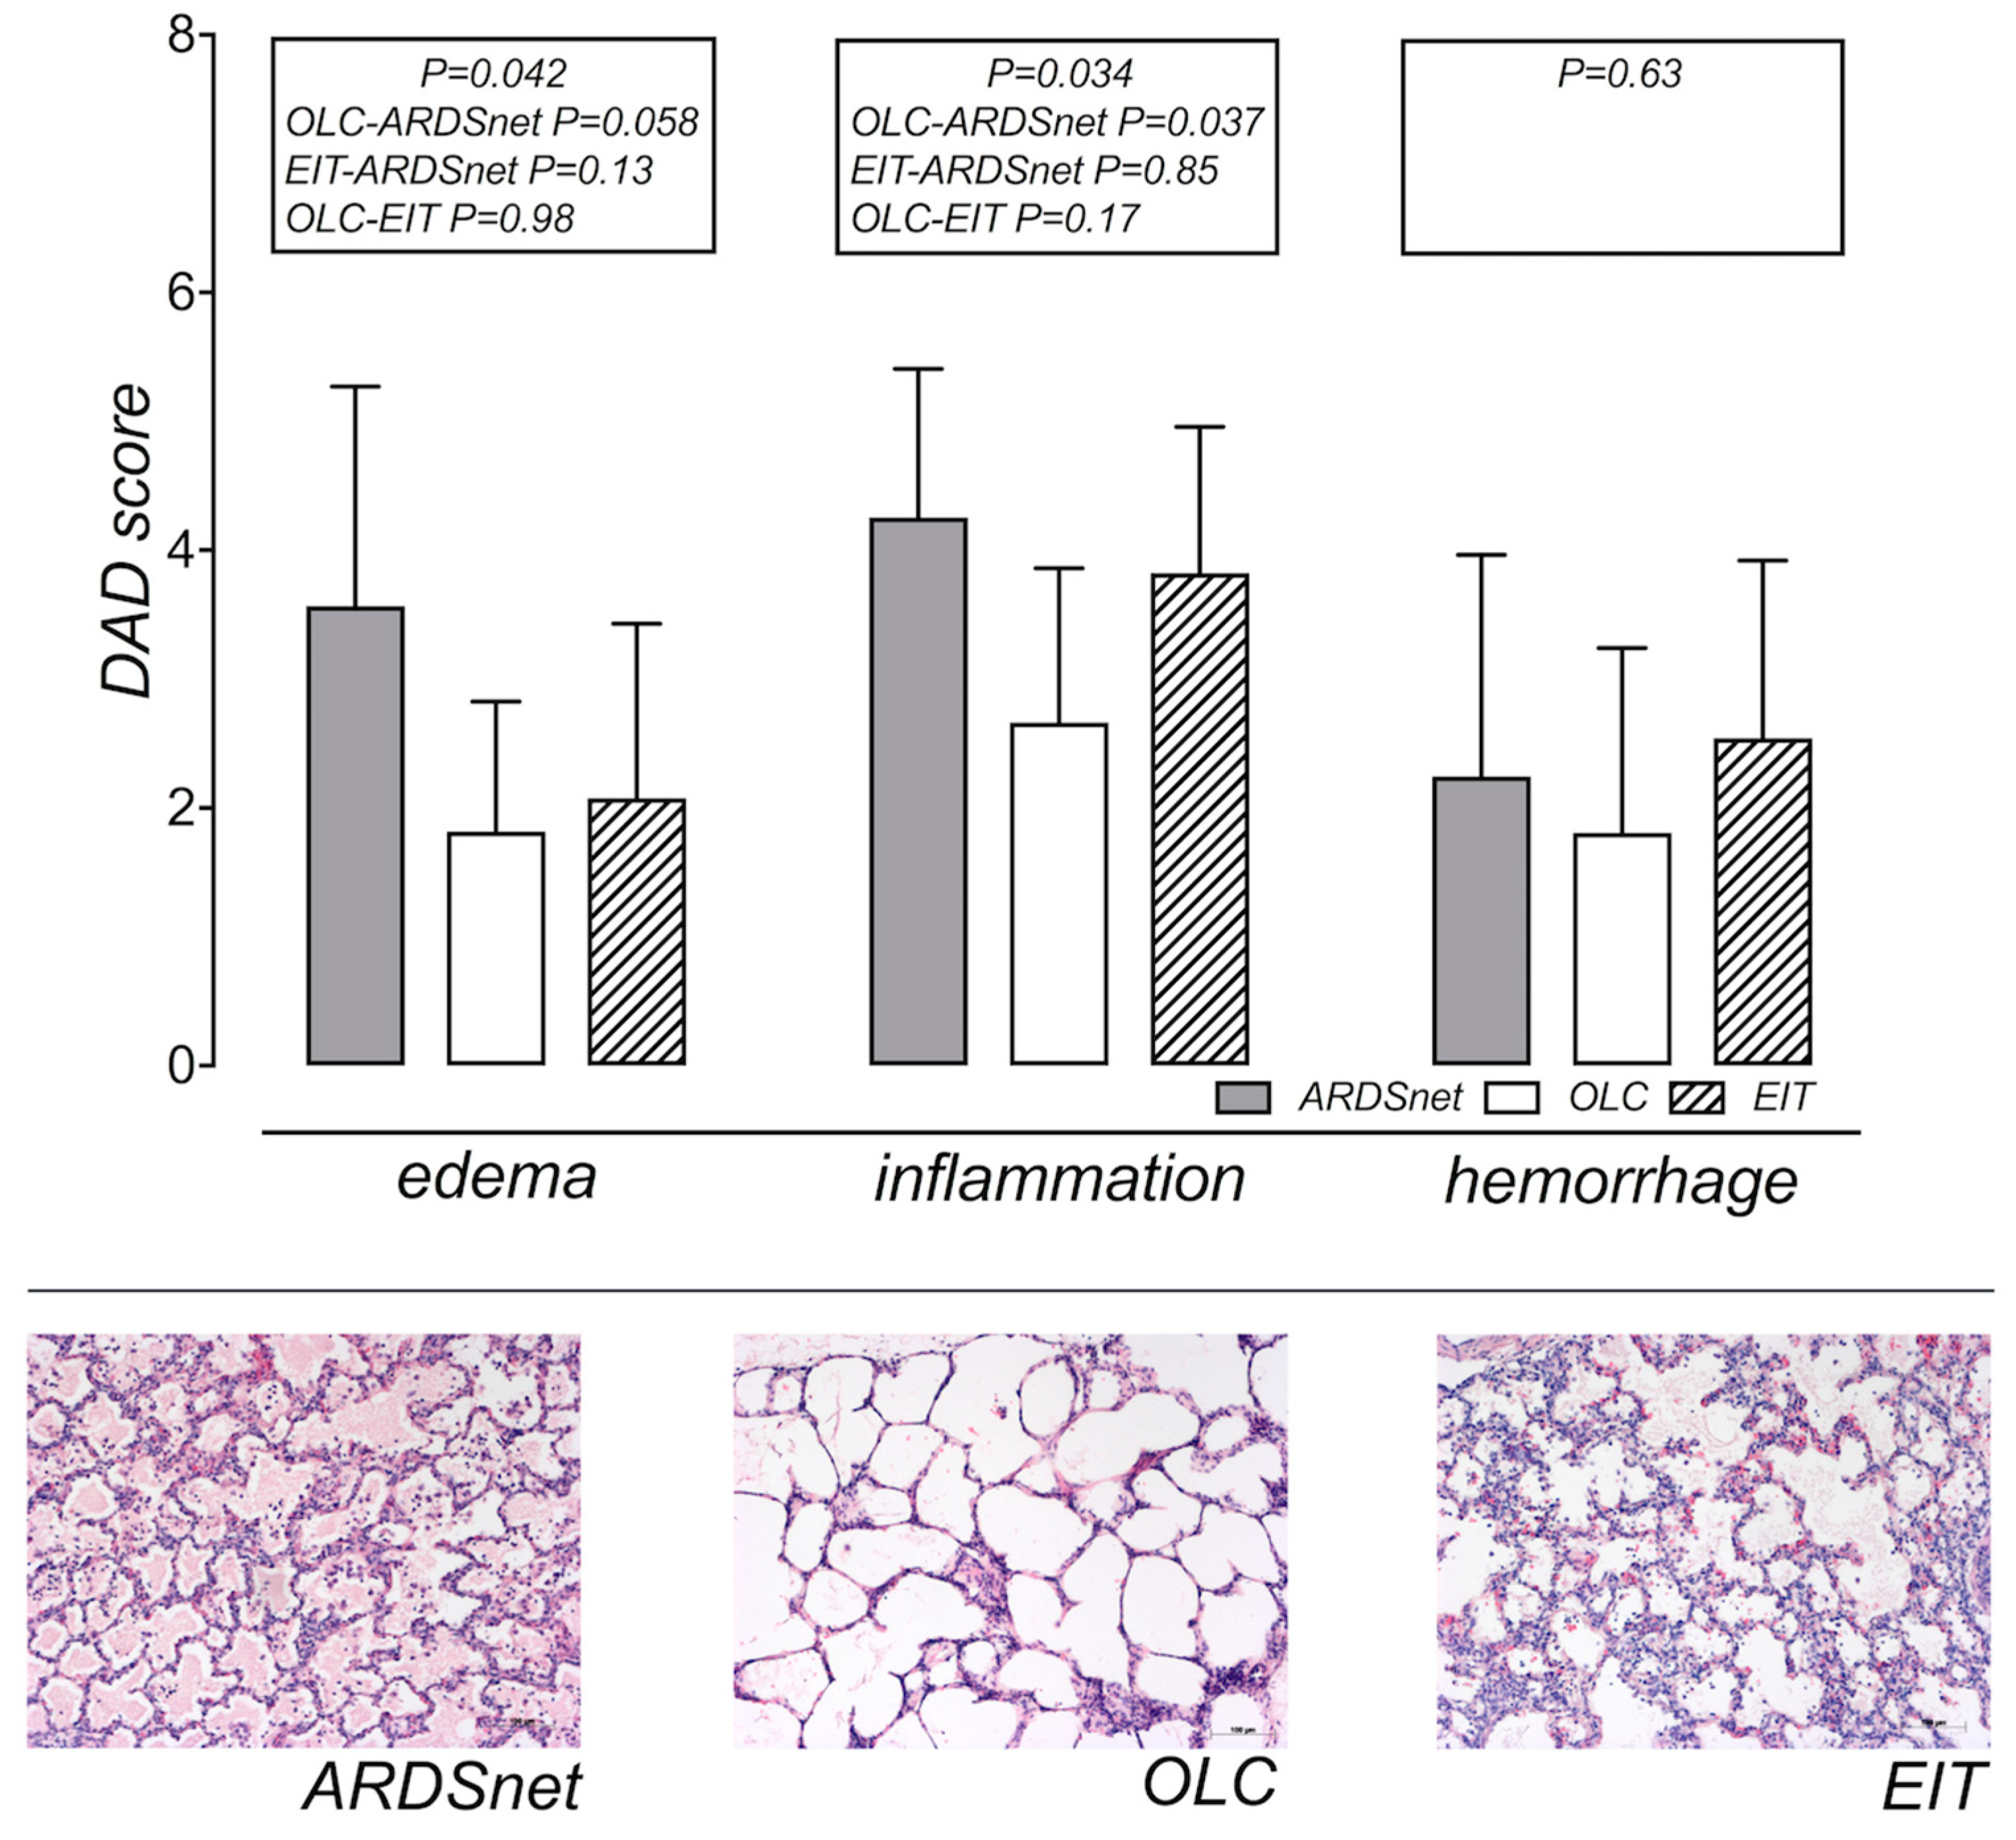
2.6. Tissue Processing and Histological Analysis

Four tissue samples (ventral, medial-ventral, medial-dorsal, and dorsal) were taken from the left lower lobe. Tissue samples were fixed per standardized protocol and stained with hematoxylin-eosin (see Supplementary Materials). We assessed the criteria hemorrhage, inflammation, and intra-alveolar edema by light microscopy and calculated the cumulative Diffuse Alveolar Damage (DAD) Score as the sum over all criteria [33,34]. The wet-to-dry ratio of the lung was measured as well.

2.7. Statistical Analysis

Our sample size estimation indicated that eight pigs per group were required (see Supplementary Materials). Data are presented as mean and standard deviation (SD) or 95% confidence interval (95% CI). Changes from BL to established ARDS (randomization) were analyzed using paired t-tests. General Linear Model (GLM) approaches were used to analyze changes between ARDS and 24 h for group, time, and interactions effects. Only if the GLM indicated significant differences, Sidak’s post-hoc tests were used. Correlation between continuous variables was derived from linear regression. We considered p values <0.05 significant.

3. Results

3.1. General Aspects and Effects of Induction of ARDS

To study 24 animals for a per-protocol analysis, we had to enroll 27 pigs. The mean amount of HCl required for inducing moderate ARDS (ARDSnet 124 ± 20, OLC 105 ± 30, EIT 135 ± 16 mL) differed marginally between groups (GLM p = 0.046, post-hoc: OLC vs. EIT p = 0.045). Induction of ARDS decreased compliance and PaO2 while PaCO2 and shunt increased (all p < 0.001, Table 1). Induction of ARDS increased collapse&TR significantly (Mnon BL 19.8% ± 11.8%, ARDS 51.8% ± 8.0%, p < 0.001, TR BL 6.1% ± 4.5%, ARDS 15.8% ± 12.0%, p = 0.001) and also caused significant changes in, Mnormal, Mpoor, gas content, Mtotal, and Vtotal as well as in the SDRVD (all p ≤ 0.01, Figure 2, SM: Figure S2, Table S1).
According to EIT, CoV did not change after induction of ARDS (p = 0.30, BL 55.8% ± 2.5%, ARDS 56.5% ± 3.1% p = 0.30, SM: Figure S3). We noticed randomization bias for PaO2 after ARDS induction (GLM p = 0.016, posthoc: ARDSnet vs. OLC p = 0.022, ARDSnet vs. EIT p = 0.063, OLC vs. EIT p = 0.95, Table 1) as well as for shunt (GLM p = 0.005, posthoc: ARDSnet vs. OLC p = 0.004, ARDSnet vs. EIT p = 0.11, OLC vs. EIT p = 0.40), but not for compliance or Mnon. Compared to BL, induction of ARDS decreased HR (p = 0.003) and increased SVR (p = 0.02) and PVR (p < 0.001), while CO and MAP did not change significantly (Table 1).

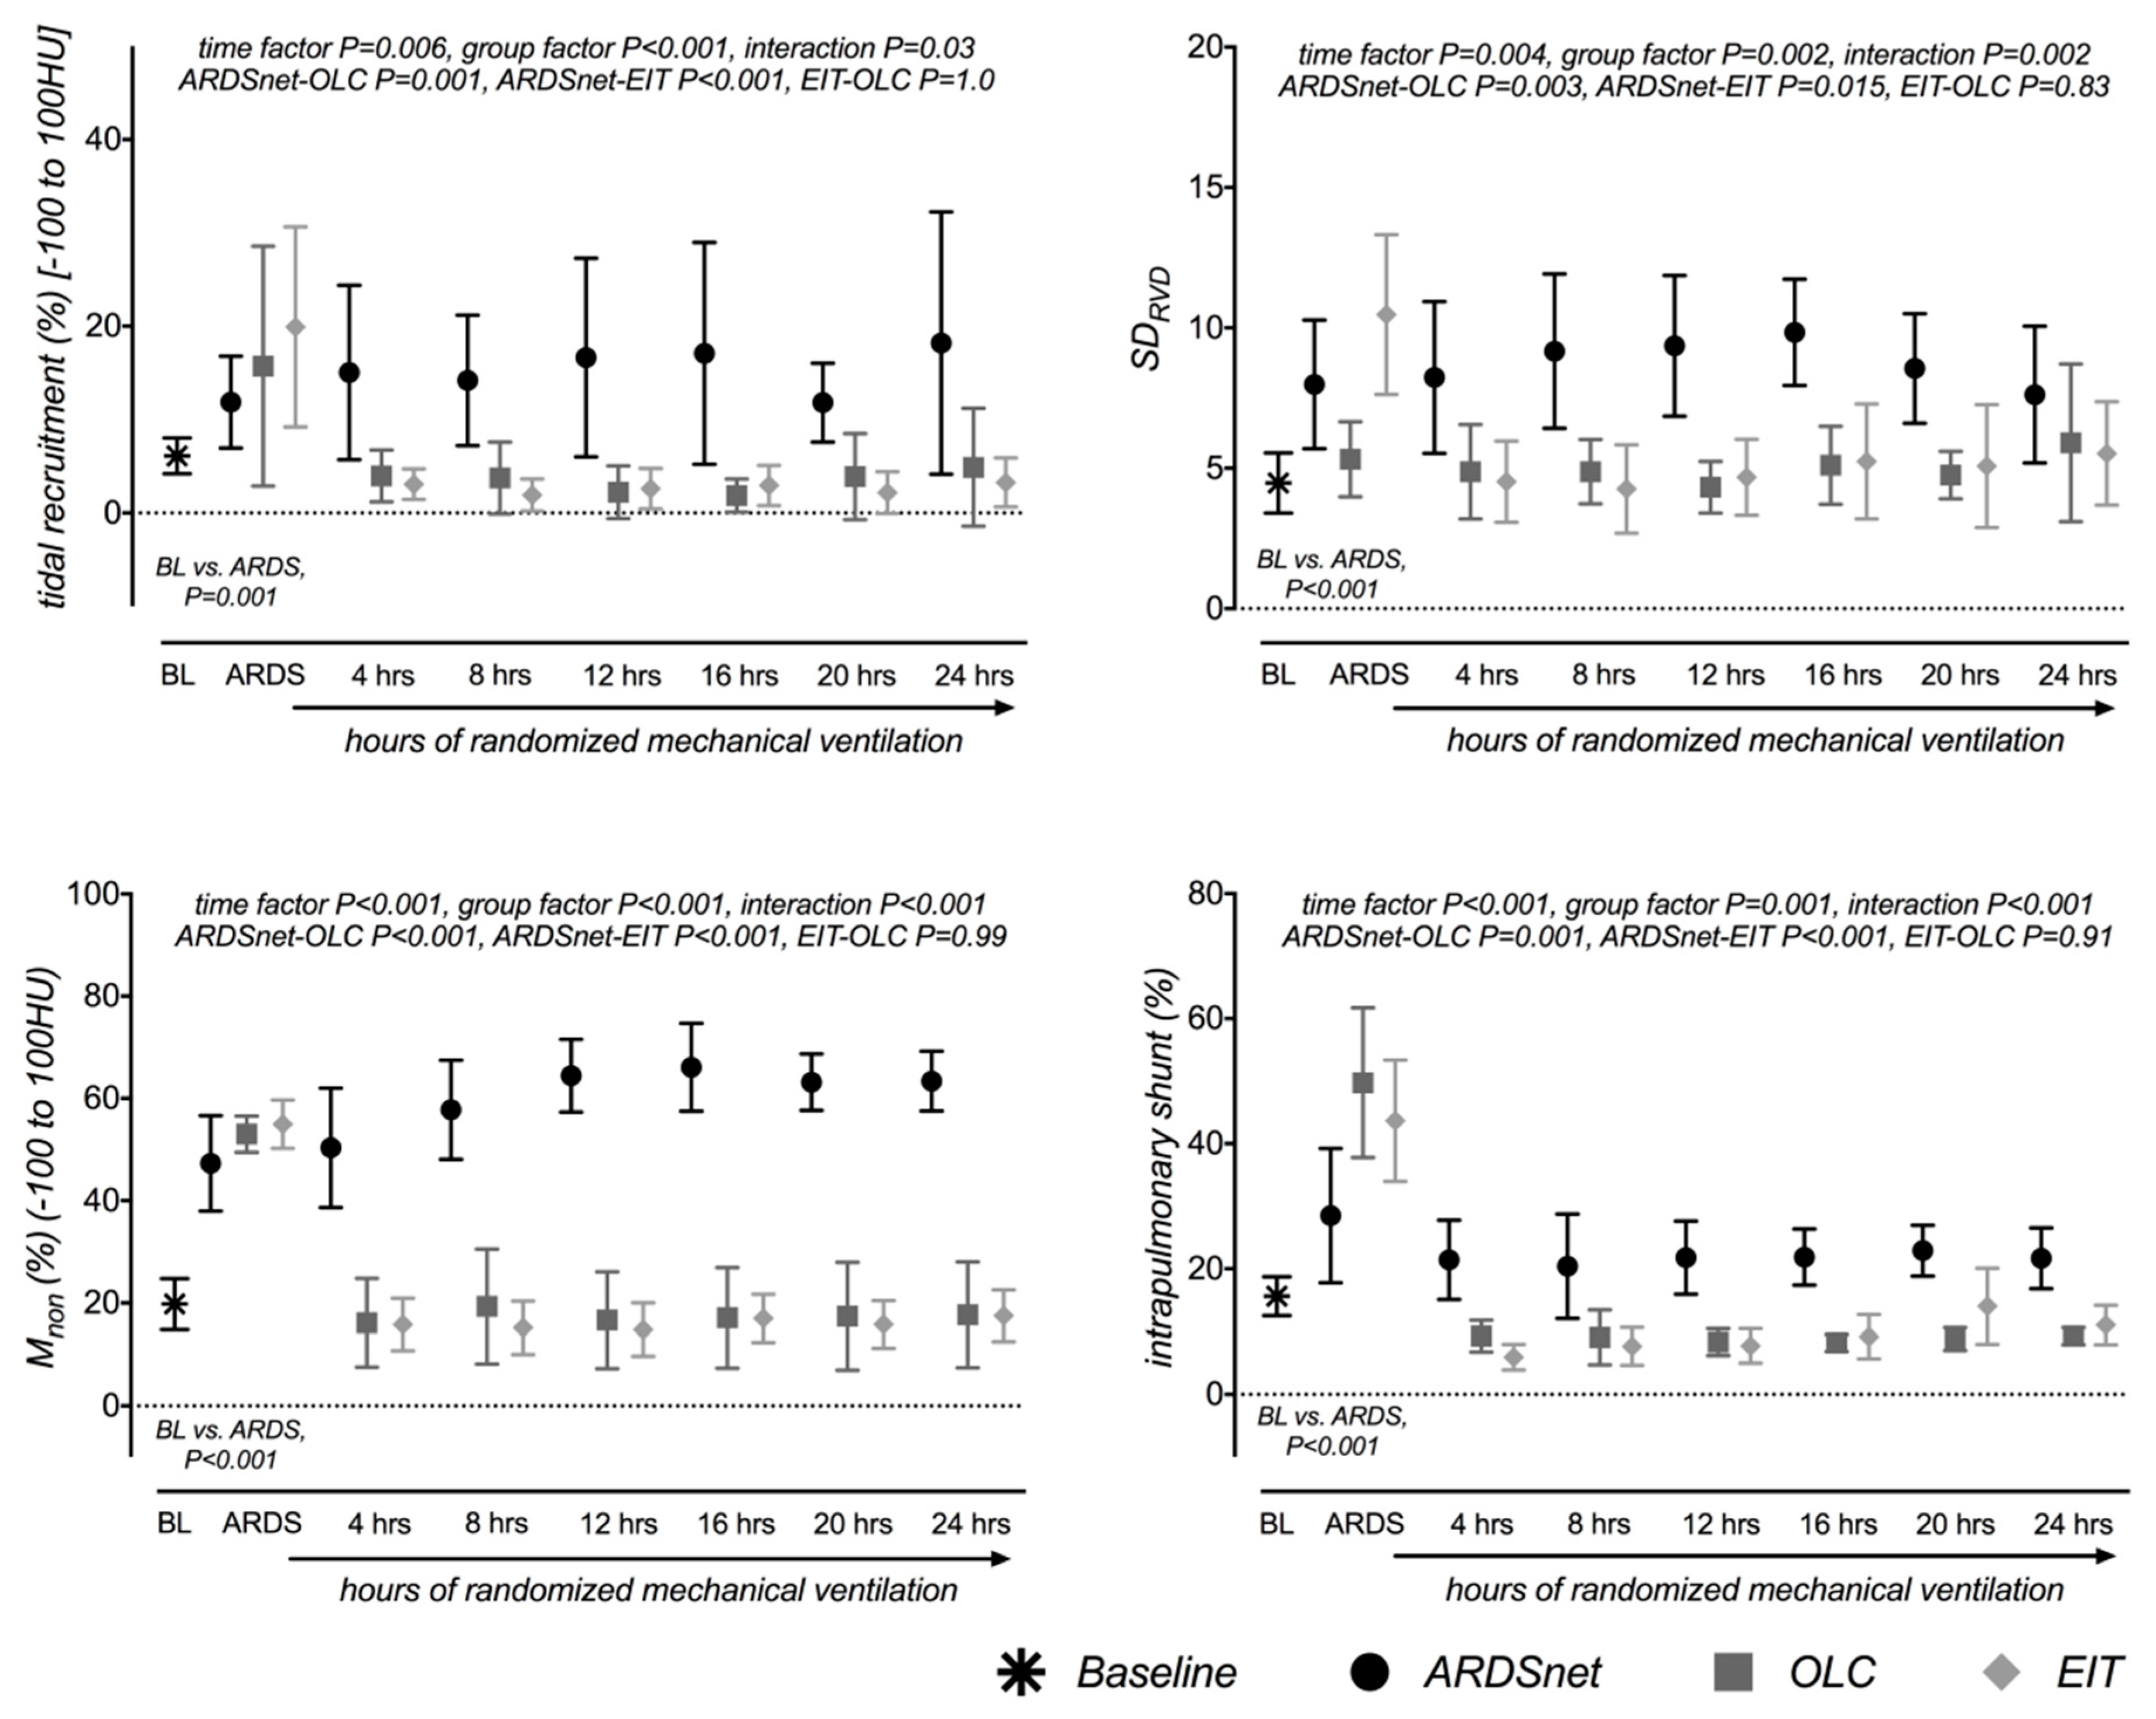
3.2. Effects on Lung Morphology and Function

Each group developed characteristic lung conditions with significant between-group differences (Table 1, Figure 2, SM: Figures S2 and S4, Table S1).
Mean PEEP over all post-randomization measurements was significantly lower (GLM p < 0.001) in ARDSnet (6.8 ± 1.0 cmH2O) compared to EIT (21.1 ± 2.6 cmH2O) and OLC (18.7 ± 3.2 cmH2O) (both p < 0.001), but not between EIT and OLC (p = 0.17). Mirroring the differences in PEEP, ARDSnet developed significantly more collapse&TR than OLC and EIT (Mnon and TR in Figure 2, SM: Table S1). Neither collapse nor TR differed significantly between OLC and EIT (both p = 1.0). OLC and EIT groups showed reduced Mnon (p < 0.001), TR (p = 0.006), and shunt (p < 0.001), and increased compliance (p < 0.001) and PaO2 (p < 0.001) in OLC and EIT groups. Gas content, Vtotal, Mnormal, and Mpoor changed significantly over time and between groups, with significant interaction (SM: Table S1, Figure S4, all p ≤ 0.01). In ARDSnet gas content, Vtotal, Mnormal (all p ≤ 0.001), and Mpoor (p < 0.01) were significantly smaller than in OLC and EIT and again without differences between EIT and OLC (p ≥ 0.3). The EIT-derived CoV indicated that ventilation occurred in more ventral regions in ARDSnet compared to OLC and EIT, in which recruitment and individualized PEEP had shifted ventilation more dorsally (SM: Figure S3).
Significantly more TR occurred in ARDSnet (362 ± 152 TR-hours) compared to OLC (64 ± 57 TR-hours) and EIT (67 ± 38 TR-hours) (GLM p < 0.001, post-hoc: ARDSnet vs. OLC or EIT p < 0.001, EIT vs. OLC p = 1.0). Although not directly comparable, SDRVD-hours showed a compatible behavior (ARDSnet 211 ± 53 SDRVD-hours, OLC 120 ± 28 SDRVD-hours, EIT 105 ± 42 SDRVD-hours) (GLM p = 0.001, post-hoc: ARDSnet vs. OLC or EIT p = 0.002, EIT vs. OLC p = 1.0, SM: Figure S5). TR quantified by qCT correlated strongly with EIT-derived SDRVD, as did the time-weighted parameters TR-hours and SDRVD-hours (R2 values 0.66 and 0.7, respectively, p < 0.001, SM: Figures S5 and S6).
SDRVD increased until 16 h and decreased subsequently in ARDSnet, whereas in OLC and EIT it decreased after recruitment and remained significantly lower than in ARDSnet (GLM time effect p = 0.004, group effect p = 0.002, interaction effect p = 0.002, post-hoc: ARDSnet vs. OLC or EIT p < 0.03, EIT vs. OLC p = 0.83, Figure 2 and SM: Table S1).
Compliance was significantly higher in OLC and EIT than ARDSnet (GLM, group effect p < 0.001, interaction effect p = 0.002, and post-hoc all p < 0.01, SM: Figure S4), but did not differ between OLC and EIT (p = 0.76).
In ARDSnet, PaO2 was lower and shunt was higher than in OLC and EIT groups (p ≤ 0.001 for all time points, group and post-hoc tests), but no difference was found between OLC and EIT (p = 0.91 for shunt p = 0.84 and for PaO2). The PaCO2 did not vary significantly between groups (p = 0.1) nor over time (p = 0.17).

3.3. Hemodynamics and Systemic Physiological Parameters

Most hemodynamic parameters remained largely unchanged for the first 8 h of ventilation. Afterwards, a systemic inflammatory response pattern developed progressively until 24 h. These results corroborate with the significant changes over time of SVR, PVR, MAP, HR, and body temperature (all p ≤ 0.001, without any between-group effects or interaction, Table 1 and Table S2). CO neither changed significantly with time nor between groups (all p ≥ 0.13). At 24 h, the cumulative fluid balance differed significantly between groups (ARDSnet 111 ± 64, OLC 131 ± 69, EIT 211 ± 45 mL/kg bodyweight, ANOVA at 24 h: p = 0.008, post-hoc: ARDSnet vs. OLC p = 0.88, ARDSnet vs. EIT p = 0.01, OLC vs. EIT p = 0.045, Table S2).

3.4. Assessment of Edema and Histology

During individualized ventilation, Mtotal (as a surrogate of edema) increased significantly until 8 h and remained elevated afterwards (time p < 0.001), without significant between-group differences (p = 0.12), or interaction (p = 0.06). The wet-to-dry ratio differed significantly between groups (ARDSnet 8.1 ± 0.4, OLC 7.7 ± 0.6, EIT 7.4 ± 0.4; GLM p = 0.02; post-hoc: ARDSnet vs. OLC p = 0.29, ARDSnet vs. EIT p = 0.02, OLC vs. EIT p = 0.46).
Figure 3 shows representative macroscopic and related microscopic specimens and summarizes the histologic analyses.
Because regional histological analysis detected no meaningful or significant differences (SM: Table S3), we averaged regional scores into global scores for the cumulative DAD as well as for each histological criterion [34]. Cumulative DAD scores were 10.1 ± 4.3, 6.3 ± 3.3, and 8.4 ± 3.7 for ARDSnet, OLC, and EIT, respectively (GLM p = 0.16). Intra-alveolar edema scores were lowest for OLC (1.8 ± 1.0), followed by EIT (2.1 ± 1.4) and ARDSnet (3.6 ± 1.7) (GLM p = 0.042, ARDSnet vs. OLC p = 0.058, ARDSnet vs. EIT p = 0.13, OLC vs. EIT p = 0.98). Inflammation showed similar results (OLC 2.7 ± 1.2, EIT 3.8 ± 1.1, ARDSnet 4.3 ± 1.2, p = 0.034, post-hoc: ARDSnet vs. OLC p = 0.037, ARDSnet vs. EIT: p = 0.85, OLC vs. EIT p = 0.17). Hemorrhage did not significantly differ between groups (OLC 1.8 ± 1.4, EIT 2.5 ± 1.4, ARDSnet 2.2 ± 1.7, p = 0.63). Comparison of cumulative DAD-scores with TR-hours showed a similar tendency towards higher scores and more cumulative TR in the ARDSnet group for edema and inflammation (SM: Figure S7).

4. Discussion

Based on imaging and physiological analyses obtained over an extended experimental period of 24 h, our study adds evidence that some concepts for mechanical ventilation involving individually-titrated PEEP are capable of reducing collapse&TR and restoring lung function even in early acid aspiration-induced ARDS, often considered poorly recruitable. Our results also support the idea that PEEP individualized according to different physiology-based approaches significantly exceeds the PEEP suggested by the ARDSnet concept. EIT and OLC approaches identified similarly high PEEP-values. Physiological and morphological measurements showed improved aeration and ventilation for OLC and EIT as compared with ARDSnet. These differences involved the vast majority of surrogate parameters studied, including key markers for VALI such as driving pressure and TR. Histology revealed a shift to more edema and inflammation in the EIT group than in the OLC group, presumably due to overuse of recruitment. A tendency to higher edema scores were observed in the ARDSnet group despite the fact that per protocol fluid intake was higher in the OLC and EIT groups.
The identification of patients with a high likelihood of a positive response to and potential benefit from lung recruitment and PEEP has been an ongoing quest [4,9], and recent studies are controversial as they either challenge [5] or support [35] this concept. In patients with limited potential for lung recruitment, recruitment and high PEEP may even be detrimental [5].
Our results add further indications that the very early stages of ARDS, even in ARDS forms previously considered poorly recruitable such as acid-aspiration induced ARDS, may offer a window of time during which recruitment and individualized, physiology-based selection of high PEEP may help to restore lung function and to avoid potentially injurious forms of mechanical ventilation. In our study, EIT, qCT, oxygenation, and compliance agreed in demonstrating the improvement in lung aeration and function after recruitment. Excluding qCT from this list because of unwarranted radiation exposure, the pattern of EIT, oxygenation, and/or compliance changes could easily help to answer whether a patient responds to recruitment by improved lung aeration and function. Positive responses to recruitment and PEEP are more likely during (or even limited to) the early phase of DAD [36]. In contrast to patients developing ARDS from bacterial pneumonia, who often have significant non-recruitable lung consolidation and frequently reach the intensive care unit (ICU) several days after the onset of DAD, patients developing lung dysfunction and respiratory distress after aspiration or trauma are in the very early stages of DAD [37,38]. Using EIT, oxygenation, and/or compliance for individualization of PEEP would be completely different from a “recruitment is good for all ARDS patients” approach, which was tested in previous studies [5,39] with negative results. Recent data further support this notion; there are distinct subgroups within the syndrome ARDS to which therapeutic bundles should be individually tailored [40,41,42].
Besides confirming that EIT can aid in detecting a response to recruitment by visualizing recruitment-induced restoration of ventilation in previously non-ventilated regions of the EIT-image (Figure 4, SM: Figures S5 and S6), our results suggest that EIT is capable of detecting relevant TR. While lung collapse that persists during mechanical ventilation does not necessarily lead to VALI, cyclic recruitment and derecruitment of airspaces (tidal recruitment) is deemed a main pathomechanism of VALI [3,43].
It appears important that the large SDRVD detected in non-recruited lungs (i.e., ARDSnet group and measurements before recruitment in OLC and EIT groups) were almost always associated with large qCT-measurements of TR (SM: Figures S5 and S6). The time-weighted surrogate SDRVD-hours correlated strongly with the qCT-counterpart (SM: Figures S5 and S6), and there was also an association with histology (SM: Figure S7). Considering that estimation of TR by repetitive qCT will likely remain clinically impracticable, the EIT-derived SDRVD may be a valuable option to detect TR and confirm recruitability in states of significant lung collapse in early ARDS, demonstrated here for acid aspiration.
The ARDSnet ventilation group in our study showed significantly more collapse in qCT, lower compliance, and more time-weighted TR in qCT and EIT than those of both other groups in which recruitment and individualized high PEEP resulted in restored lung volumes. We refrain here from discussing the pros and cons of the “permissive atelectasis” and “open lung” concepts, as there are abundant excellent reviews on that matter [44,45].
Besides the observations that all OLC and EIT pigs responded to recruitment by an increase in functional lung volume and that both oxygenation and EIT clearly detected this response to recruitment, some differences between otherwise widely similar OLC and EIT results warrant discussion. OLC showed a tendency to lower inflammation and edema scores (Figure 3, p < 0.05) although not statistically significant in post-hoc analysis, presumably due to a small sample size.
The difference in the number of re-RM could be an explanation. When there is a lot of recruitable lung, the SDRVD will give a strong signal when this amount of lung parenchyma undergoes TR (see above). On the other hand, if a small SDRVD indicates that all or most recruitable lung tissue is already recruited (RM) and subsequently kept recruited by PEEP, a 20% change in the small SDRVD will be easily reached. We used an arbitrary 20% change in SDRVD to prompt re-recruitment and this obviously led to overutilization of recruitment maneuvers. There were no more beneficial effects of re-RM in terms of PaO2/FiO2, shunt, or compliance in the EIT-group beyond that reached after the initial recruitment and PEEP-titration at the beginning of the study. The greater number of RM and PEEP titrations performed in the EIT-pigs resulted in larger infusion volumes (per protocol linked to number of RM) and a higher number of inflations and deflations, which may all have contributed to higher DAD scores in the EIT group compared to the OLC group [46,47,48]. Therefore, the maintenance of minimal collapse&TR over 24 h required the repeated use of recruitment and PEEP-titrations, whose side-effects (i.e., volutrauma/barotrauma) seemed to neutralize some benefits (i.e., reduced atelectrauma) in the EIT group.
The ability of the SDRVD to provide physiologically sound and clinically useful information may thus depend on the amount of lung collapse. Small absolute SDRVD or small changes of SDRVD during ventilation at high PEEP levels may be less reliable because of an unfavorable signal-to-noise ratio.

5. Limitations

Different amounts of HCL required for reaching physiological ARDS criteria must be considered when interpreting differences found in histology between OLC and EIT groups. The pressure limitation for the low-flow-maneuver was set to 80 cmH2O. Pigs with very low compliance may thus have been exposed to very high airway pressures during the low-flow-maneuver. Such values were anecdotally reported for RM [37,49], but should of course be avoided for tidal ventilation. As a matter of fact, direct translation of the results of this porcine study into clinical practice is impossible. Our model of very early ARDS has similarities with the problem of aspiration during induction of anesthesia, however, results cannot be simply extrapolated to human and/or later-stage ARDS. As a result of applying the 3R principle, sample size and power of statistical tests needed to be balanced [50]. In our work, some significances, especially the post-hoc tests for histological analyses (group size of eight animals) may have been affected. Further study seems warranted to improve the EIT-approach for bedside detection of clinically relevant collapse&TR and for PEEP-selection. Dedicated low-flow-maneuvers involving large inflation-volume airway pressures should be replaced by breath-by-breath approaches during ongoing ventilation.

6. Conclusions

Overall, recruitment and subsequent individualization of PEEP using the entirely noninvasive EIT-method resulted in lung conditions matching those seen in the oxygenation-focused OLC. In our model of ARDS, both, EIT— and OLC-based PEEP-selection resulted in physiological and morphological conditions that seem to meet contemporary criteria for lung-protective mechanical ventilation. The ARDSnet strategy led to progressive lung de-recruitment and histological results showed a tendency towards more lung inflammation in the ARDSnet group. Including EIT-derived information into patterns of physiological parameters may allow identification of patients who will respond to recruitment by reaeration of previously non-ventilated lung regions and reduction of TR. While EIT-based detection of significant TR and EIT-based PEEP-selection performed comparably to the OLC approach, the ability of EIT to detect the necessity for re-recruitment and re-titration of PEEP remains to be studied. An over-utilization of recruitment and PEEP, possibly (mis)guided by the aim at minimization of parameters only indirectly characterizing lung aeration, may indeed be stretching things too far.

Supplementary Materials

The following are available online at https://www.mdpi.com/2077-0383/8/8/1250/s1, reference [51,52,53,54,55,56,57,58] are cited in the supplementary file. Figure S1: Schematic presentation of the standardized sequence of data acquisition at each measurement point, Figure S2: Quantitative CT parameters, Figure S3: Center of Ventilation (CoV), Figure S4: System compliance, Figure S5, Correlation of tidal-recruitment-hours (TR-hours) and SDRVD-hours, Figure S6: Correlation of TR and SDRVD at different measurement points throughout the trial, Figure S7: Association of the global DAD score and its histological criteria with the magnitude of tidal recruitment expressed as tidal-recruitment-hours (TR-hours). Table S1: Changes in quantitative Computed Tomography (qCT) and Electrical Impedance Tomography (EIT) parameters, Table S2: Body temperature and fluid balance, Table S3: Regional results in histological analysis.

Author Contributions

Conceptualization, J.H.; D.C.B., and A.W.R.; Data curation, J.H., D.C.B., S.H., A.B., A.R., H.S., P.M.S., T.M., H.W., and A.W.R.; Formal analysis, J.H., D.C.B., S.H., P.S., J.M., N.C.C., A.B., A.R., and A.W.R.; Funding acquisition, H.W. and A.W.R.; Investigation, J.H.; D.C.B., and A.W.R.; Methodology, J.H., D.C.B., N.C.C., P.M.S., T.M., H.W., and A.W.R.; Project administration, H.W. and A.W.R.; Software, P.S., N.C.C., and A.B.; Supervision, C.G., T.M., H.W., and A.W.R.; Validation, J.H. and D.C.B.; Visualization, A.W.R.; Writing—original draft, J.H., D.C.B., and A.W.R.; Writing—review and editing: J.H., D.C.B., and A.W.R.

Funding

A.R. received partial support by the B. Braun Foundation. H.W. received research funding from the German Research Foundation (DFG grant WR 47/1-1). A.B. and N.C.C. were funded by the Fundação de Amparo a Pesquisa do Estado de Minas Gerais (FAPEMIG, Brazil), Coordenação de Aperfeiçoamento de Pessoal de Nível Superior (CAPES, Brazil) and Conselho Nacional de Desenvolvimento Científico e Tecnológico (CNPq, Brazil).

Acknowledgments

The authors acknowledge the support of Walter Brehm, who provided access to the animal research facility and additional institutional funding for the animal experiments.

Conflicts of Interest

During the time of study conduction, S.H. used to work part-time for Swisstom Corp., Landquart, Switzerland. H.W. received research funding, lecture fees, and technical support from Dräger Medical, Lübeck, Germany; funding from Pfizer (Investigator Initiated Trial Program), Berlin, Germany; funding and lecture fees from InfectoPharm, Heppenheim, Germany; lecture fees from GE Healthcare, Freiburg, Germany, lecture fees from Maquet, Rastatt, Germany; lecture fees from MSD, Konstanz, Germany; and technical support from Swisstom Corp., Landquart, Switzerland. A.W.R. received lecture fees and technical support from Dräger Medical, Lübeck, Germany. The other authors declare no conflicts of interest. The sponsors had no role in the design, execution, interpretation, or writing of the study.

References

  1. Amato, M.B.; Barbas, C.S.; Medeiros, D.M.; Magaldi, R.B.; Schettino, G.P.; Lorenzi-Filho, G.; Kairalla, R.A.; Deheinzelin, D.; Munoz, C.; Oliveira, R.; et al. Effect of a Protective-Ventilation Strategy on Mortality in the Acute Respiratory Distress Syndrome. N. Engl. J. Med. 1998, 338, 347–354. [Google Scholar] [CrossRef] [PubMed]
  2. Ware, L.B.; Matthay, M.A. The acute respiratory distress syndrome. N. Engl. J. Med. 2000, 342, 1334–1349. [Google Scholar] [CrossRef] [PubMed]
  3. Slutsky, A.S.; Ranieri, V.M. Ventilator-induced lung injury. N. Engl. J. Med. 2013, 369, 2126–2136. [Google Scholar] [CrossRef] [PubMed]
  4. Briel, M.; Meade, M.; Mercat, A.; Brower, R.G.; Talmor, D.; Walter, S.D.; Slutsky, A.S.; Pullenayegum, E.; Zhou, Q.; Cook, D.; et al. Higher vs. lower positive end-expiratory pressure in patients with acute lung injury and acute respiratory distress syndrome: Systematic review and meta-analysis. JAMA 2010, 303, 865–873. [Google Scholar] [CrossRef] [PubMed]
  5. Cavalcanti, A.B.; Suzumura, É.A.; Laranjeira, L.N.; Paisani, D.M.; Damiani, L.P.; Guimarães, H.P.; Romano, E.R.; Regenga, M.M.; Taniguchi, L.N.T.; Teixeira, C.; et al. Effect of Lung Recruitment and Titrated Positive End-Expiratory Pressure (PEEP) vs. Low PEEP on Mortality in Patients With Acute Respiratory Distress Syndrome: A Randomized Clinical Trial. JAMA 2017, 318, 1335–1345. [Google Scholar] [CrossRef] [PubMed]
  6. Sahetya, S.K.; Brower, R.G. Lung Recruitment and Titrated PEEP in Moderate to Severe ARDS: Is the Door Closing on the Open Lung? JAMA 2017, 318, 1327–1329. [Google Scholar] [CrossRef] [PubMed]
  7. Walkey, A.J.; Summer, R.; Ho, V.; Alkana, P. Acute respiratory distress syndrome: Epidemiology and management approaches. Clin. Epidemiol. 2012, 4, 159–169. [Google Scholar] [CrossRef] [PubMed]
  8. Chiumello, D.A.; Cressoni, M.; Carlesso, E.; Caspani, M.L.; Marino, A.; Gallazzi, E.; Caironi, P.; Lazzerini, M.; Moerer, O.; Quintel, M.; et al. Bedside Selection of Positive End-Expiratory Pressure in Mild, Moderate, and Severe Acute Respiratory Distress Syndrome. Crit. Care Med. 2014, 42, 252–264. [Google Scholar] [CrossRef]
  9. Tusman, G.; Pesch, T.; Thamm, O.; Reske, A.; Suárez-Sipmann, F.; Böhm, S.H.; Reissmann, H.; Magnusson, A.; Hedenstierna, G. Use of dynamic compliance for open lung positive end-expiratory pressure titration in an experimental study. Crit. Care Med. 2007, 35, 214–221. [Google Scholar] [Green Version]
  10. Borges, J.B.; Okamoto, V.N.; Matos, G.F.J.; Caramez, M.P.R.; Arantes, P.R.; Barros, F.; Souza, C.E.; Victorino, J.A.; Kacmarek, R.M.; Barbas, C.S.V.; et al. Reversibility of Lung Collapse and Hypoxemia in Early Acute Respiratory Distress Syndrome. Am. J. Respir. Crit. Care Med. 2006, 174, 268–278. [Google Scholar] [CrossRef]
  11. Hickling, K.G. Reinterpreting the pressure-volume curve in patients with acute respiratory distress syndrome. Curr. Opin. Crit. Care 2002, 8, 32–38. [Google Scholar] [CrossRef]
  12. Lachmann, B. Open up the lung and keep the lung open. Intensiv. Care Med. 1992, 18, 319–321. [Google Scholar] [CrossRef] [Green Version]
  13. Borges, J.B.; Suarez-Sipmann, F.; Bohm, S.H.; Tusman, G.; Melo, A.; Maripuu, E.; Sandström, M.; Park, M.; Costa, E.L.; Hedenstierna, G.; et al. Regional lung perfusion estimated by electrical impedance tomography in a piglet model of lung collapse. J. Appl. Physiol. (1985) 2012, 112, 225–236. [Google Scholar] [CrossRef] [Green Version]
  14. Carvalho, A.R.; Spieth, P.M.; Pelosi, P.; Melo, M.F.V.; Koch, T.; Jandre, F.C.; Giannella-Neto, A.; De Abreu, M.G. Ability of dynamic airway pressure curve profile and elastance for positive end-expiratory pressure titration. Intensiv. Care Med. 2008, 34, 2291–2299. [Google Scholar] [CrossRef] [Green Version]
  15. Suter, P.M.; Fairley, H.B.; Isenberg, M.D. Optimum End-Expiratory Airway Pressure in Patients with Acute Pulmonary Failure. N. Engl. J. Med. 1975, 292, 284–289. [Google Scholar] [CrossRef]
  16. Lachmann, B.; Jonson, B.; Lindroth, M.; Robertson, B. Modes of artificial ventilation in severe respiratory distress syndrome: Lung function and morphology in rabbits after wash-out of alveolar surfactant. Crit. Care Med. 1982, 10, 721–732. [Google Scholar] [CrossRef]
  17. Crotti, S.; Mascheroni, D.; Caironi, P.; Pelosi, P.; Ronzoni, G.; Mondino, M.; Marini, J.J.; Gattinoni, L. Recruitment and derecruitment during acute respiratory failure: A clinical study. Am. J. Respir. Crit. Care Med. 2001, 164, 131–140. [Google Scholar] [CrossRef]
  18. Bugedo, G.; Bruhn, A.; Hernández, G.; Rojas, G.; Varela, C.; Tapia, J.C.; Castillo, L. Lung computed tomography during a lung recruitment maneuver in patients with acute lung injury. Intensiv. Care Med. 2003, 29, 218–225. [Google Scholar] [CrossRef]
  19. De Matos, G.F.; Stanzani, F.; Passos, R.H.; Fontana, M.F.; Albaladejo, R.; Caserta, R.E.; Santos, D.C.; Borges, J.B.; Amato, M.B.; Barbas, C.S. How large is the lung recruitability in early acute respiratory distress syndrome: A prospective case series of patients monitored by computed tomography. Crit. Care 2012, 16, R4. [Google Scholar] [CrossRef]
  20. Costa, E.L.V.; Borges, J.B.; Melo, A.; Suarez-Sipmann, F.; Toufen, C.; Bohm, S.H.; Amato, M.B.P. Bedside estimation of recruitable alveolar collapse and hyperdistension by electrical impedance tomography. Intensiv. Care Med. 2009, 35, 1132–1137. [Google Scholar] [CrossRef]
  21. Kobylianskii, J.; Murray, A.; Brace, D.; Goligher, E.; Fan, E. Electrical impedance tomography in adult patients undergoing mechanical ventilation: A systematic review. J. Crit. Care 2016, 35, 33–50. [Google Scholar] [CrossRef]
  22. Wrigge, H.; Zinserling, J.; Muders, T.; Varelmann, D.; Günther, U.; Von Der Groeben, C.; Magnusson, A.; Hedenstierna, G.; Putensen, C. Electrical impedance tomography compared with thoracic computed tomography during a slow inflation maneuver in experimental models of lung injury. Crit. Care Med. 2008, 36, 903–909. [Google Scholar] [CrossRef]
  23. Muders, T.; Luepschen, H.; Zinserling, J.; Greschus, S.; Fimmers, R.; Guenther, U.; Buchwald, M.; Grigutsch, D.; Leonhardt, S.; Putensen, C.; et al. Tidal recruitment assessed by electrical impedance tomography and computed tomography in a porcine model of lung injury. Crit. Care Med. 2012, 40, 903–911. [Google Scholar] [CrossRef]
  24. Kilkenny, C.; Browne, W.J.; Cuthill, I.C.; Emerson, M.; Altman, D.G. Improving Bioscience Research Reporting: The ARRIVE Guidelines for Reporting Animal Research. PLoS Biol. 2010, 8, e1000412. [Google Scholar] [CrossRef]
  25. Berggren, S.M. The Oxygen Deficit of Aterial Blood Caused by non- ventilating parts of the lung. Acta Physiol. Scand. 1942, 4, 1–92. [Google Scholar]
  26. ARDS Definition Task Force; Ranieri, V.M.; Rubenfeld, G.D.; Thompson, B.T.; Ferguson, N.D.; Caldwell, E.; Fan, E.; Camporota, L.; Slutsky, A.S. The Acute Respiratory Distress Syndrome: The Berlin definition. JAMA 2012, 307, 2526–2533. [Google Scholar] [CrossRef]
  27. Reske, A.W.; Costa, E.L.V.; Reske, A.P.; Rau, A.; Borges, J.B.; Beraldo, M.A.; Gottschaldt, U.; Seiwerts, M.; Schreiter, D.; Petroff, D.; et al. Bedside Estimation of Nonaerated Lung Tissue Using Blood Gas Analysis. Crit. Care Med. 2013, 41, 732–743. [Google Scholar] [CrossRef]
  28. Reske, A.W.; Reske, A.P.; Heine, T.; Spieth, P.M.; Rau, A.; Seiwerts, M.; Busse, H.; Gottschaldt, U.; Schreiter, D.; Born, S.; et al. Computed tomographic assessment of lung weights in trauma patients with early posttraumatic lung dysfunction. Crit. Care 2011, 15, R71. [Google Scholar] [CrossRef]
  29. Lundquist, H.; Hedenstierna, G.; Strandberg, Å.; Tokics, L.; Brismar, B. CT-Assessment of Dependent Lung Densities in Man During General Anaesthesia. Acta Radiol. 1995, 36, 626–632. [Google Scholar] [CrossRef]
  30. Gattinoni, L.; Caironi, P.; Pelosi, P.; Goodman, L.R. What Has Computed Tomography Taught Us about the Acute Respiratory Distress Syndrome? Am. J. Respir. Crit. Care Med. 2001, 164, 1701–1711. [Google Scholar] [CrossRef] [Green Version]
  31. Frerichs, I.; Dargaville, P.A.; Van Genderingen, H.; Morel, D.R.; Rimensberger, P.C. Lung Volume Recruitment after Surfactant Administration Modifies Spatial Distribution of Ventilation. Am. J. Respir. Crit. Care Med. 2006, 174, 772–779. [Google Scholar] [CrossRef]
  32. Frerichs, I.; Hahn, G.; Golisch, W.; Kurpitz, M.; Burchardi, H.; Hellige, G. Monitoring perioperative changes in distribution of pulmonary ventilation by functional electrical impedance tomography. Acta Anaesthesiol. Scand. 1998, 42, 721–726. [Google Scholar] [CrossRef]
  33. Spieth, P.M.; Knels, L.; Kasper, M.; Domingues Quelhas, A.; Wiedemann, B.; Lupp, A.; Hübler, M.; Neto, A.G.; Koch, T.; Gama de Abreu, M. Effects of vaporized perfluorohexane and partial liquid ventilation on regional distribution of alveolar damage in experimental lung injury. Intensive Care Med. 2007, 33, 308–314. [Google Scholar] [CrossRef]
  34. Quintel, M.; Heine, M.; Hirschl, R.B.; Tillmanns, R.; Wessendorf, V. Effects of partial liquid ventilation on lung injury in a model of acute respiratory failure: A histologic and morphometric analysis. Crit. Care Med. 1998, 26, 833–843. [Google Scholar] [CrossRef]
  35. Leme, A.C.; Hajjar, L.A.; Volpe, M.S.; Fukushima, J.T.; Santiago, R.R.D.S.; Osawa, E.A.; De Almeida, J.P.; Gerent, A.M.; Franco, R.A.; Feltrim, M.I.Z.; et al. Effect of Intensive vs. Moderate Alveolar Recruitment Strategies Added to Lung-Protective Ventilation on Postoperative Pulmonary Complications. JAMA 2017, 317, 1422–1432. [Google Scholar] [CrossRef]
  36. Grasso, S.; Mascia, L.; Del Turco, M.; Malacarne, P.; Giunta, F.; Brochard, L.; Slutsky, A.S.; Ranieri, V.M. Effects of Recruiting Maneuvers in Patients with Acute Respiratory Distress Syndrome Ventilated with Protective Ventilatory Strategy. Anesthesiology 2002, 96, 795–802. [Google Scholar] [CrossRef]
  37. Schreiter, D.; Reske, A.; Stichert, B.; Seiwerts, M.; Bohm, S.H.; Kloeppel, R.; Josten, C. Alveolar recruitment in combination with sufficient positive end-expiratory pressure increases oxygenation and lung aeration in patients with severe chest trauma. Crit. Care Med. 2004, 32, 968–975. [Google Scholar] [CrossRef]
  38. Cinnella, G.; Grasso, S.; Raimondo, P.; D’antini, D.; Mirabella, L.; Rauseo, M.; Dambrosio, M. Physiological Effects of the Open Lung Approach in Patients with Early, Mild, Diffuse Acute Respiratory Distress Syndrome: An Electrail Impedance Tomography Study. Anesthesiology 2015, 123, 1113–1121. [Google Scholar] [CrossRef]
  39. Hemmes, S.N.T.; De Abreu, M.G.; Severgnini, P.; Schultz, M.J. High versus low positive end-expiratory pressure during general anaesthesia for open abdominal surgery (PROVHILO trial): A multicentre randomised controlled trial. Lancet 2014, 384, 495–503. [Google Scholar]
  40. Gattinoni, L.; Caironi, P.; Cressoni, M.; Chiumello, D.A.; Ranieri, V.M.; Quintel, M.; Russo, S.; Patroniti, N.; Cornejo, R.; Bugedo, G. Lung Recruitment in Patients with the Acute Respiratory Distress Syndrome. N. Engl. J. Med. 2006, 354, 1775–1786. [Google Scholar] [CrossRef]
  41. Maiolo, G.; Collino, F.; Vasques, F.; Rapetti, F.; Tonetti, T.; Romitti, F.; Cressoni, M.; Chiumello, D.; Mörer, O.; Herrmann, P.; et al. Reclassifying Acute Respiratory Distress Syndrome. Am. J. Respir. Crit. Care Med. 2018, 197, 1586–1595. [Google Scholar] [CrossRef]
  42. Sinha, P.; Network, F.T.N.A.; Delucchi, K.L.; Thompson, B.T.; McAuley, D.F.; Matthay, M.A.; Calfee, C.S. Latent class analysis of ARDS subphenotypes: A secondary analysis of the statins for acutely injured lungs from sepsis (SAILS) study. Intensiv. Care Med. 2018, 44, 1859–1869. [Google Scholar] [CrossRef]
  43. Muscedere, J.G.; Mullen, J.B.; Gan, K.; Slutsky, A.S. Tidal ventilation at low airway pressures can augment lung injury. Am. J. Respir. Crit. Care Med. 1994, 149, 1327–1334. [Google Scholar] [CrossRef]
  44. Pelosi, P.; Rocco, P.R.M.; De Abreu, M.G. Close down the lungs and keep them resting to minimize ventilator-induced lung injury. Crit. Care 2018, 22, 72. [Google Scholar] [CrossRef]
  45. Goligher, E.C.; Hodgson, C.L.; Adhikari Neill, K.J.; Meade, M.O.; Wunsch, H.; Uleryk, E.; Gajic, O.; Amato, M.P.B.; Ferguson, N.D.; Rubenfeld, G.D.; et al. Lung Recruitment Maneuvers for Adult Patients with Acute Respiratory Distress Syndrome. A Systematic Review and Meta-Analysis. Ann. Am. Thorac. Soc. 2017, 14 (Suppl. 4), S304–S311. [Google Scholar] [CrossRef]
  46. Silva, P.L.; Cruz, F.F.; Fujisaki, L.C.; Oliveira, G.P.; Samary, C.S.; Ornellas, D.S.; Maron-Gutierrez, T.; Rocha, N.N.; Goldenberg, R.; Garcia, C.S.; et al. Hypervolemia induces and potentiates lung damage after recruitment maneuver in a model of sepsis-induced acute lung injury. Crit. Care 2010, 14, R114. [Google Scholar] [CrossRef]
  47. Katira, B.H.; Engelberts, D.; Otulakowski, G.; Giesinger, R.E.; Yoshida, T.; Post, M.; Kuebler, W.M.; Connelly, K.A.; Kavanagh, B.P. Abrupt Deflation after Sustained Inflation Causes Lung Injury. Am. J. Respir. Crit. Care Med. 2018, 198, 1165–1176. [Google Scholar] [CrossRef]
  48. Marini, J.J.; Gattinoni, L. Protecting the Ventilated Lung: Vascular Surge and Deflation Energetics. Am. J. Respir. Crit. Care Med. 2018, 198, 1112–1114. [Google Scholar] [CrossRef]
  49. Zigelman, C.; Briskin, A.; Hersch, M. Extremely High-Pressure Lung Recruitment Maneuver May Be Life Saving in the Most Severe Cases of Acute Lung Injury/Acute Respiratory Distress Syndrome Letters to the Editor. Crit. Care Med. 2004, 32, 1441–1442. [Google Scholar] [CrossRef]
  50. Russell, W.M.S.; Burch, R.L.; Hume, C.W. The Principles of Humane Experimental Technique; Methuen: London, UK, 1959; p. 64. [Google Scholar]
  51. Li, R.; Lewis, J.H.; Cerviño, L.I.; Jiang, S.B. 4D CT sorting based on patient internal anatomy. Phys. Med. Biol. 2009, 54, 4821–4833. [Google Scholar] [CrossRef]
  52. Li, G.; Xie, H.; Ning, H.; Lu, W.; Low, D.; Citrin, D.; Kaushal, A.; Zach, L.; Camphausen, K.; Miller, R.W. A novel analytical approach to the prediction of respiratory diaphragm motion based on external torso volume change. Phys. Med. Biol. 2009, 54, 4113–4130. [Google Scholar] [CrossRef]
  53. Chiumello, D.; Marino, A.; Brioni, M.; Menga, F.; Cigada, I.; Lazzerini, M.; Andrisani, M.C.; Biondetti, P.; Cesana, B.; Gattinoni, L. Visual anatomical lung CT scan assessment of lung recruitability. Intensive Care Med. 2013, 39, 66–73. [Google Scholar] [CrossRef]
  54. Fehrenbach, A.; Fehrenbach, H.; Wittwer, T.; Ochs, M.; Wahlers, T.; Richter, J. Evaluation of Pulmonary Edema: Stereological versus Gravimetrical Analysis. Eur. Surg. Res. 2001, 33, 270–278. [Google Scholar] [CrossRef]
  55. Spieth, P.M.; Güldner, A.; Carvalho, A.R.; Kasper, M.; Pelosi, P.; Uhlig, S.; Koch, T.; De Abreu, M.G. Open lung approach vs. acute respiratory distress syndrome network ventilation in experimental acute lung injury. Br. J. Anaesth. 2011, 107, 388–397. [Google Scholar] [CrossRef]
  56. Norman, G. Likert scales, levels of measurement and the “laws” of statistics. Adv. Health Sci. Educ. 2010, 15, 625–632. [Google Scholar] [CrossRef]
  57. Boone, H.N.; Boone, D.A. Analyzing Likert Data. J. Ext. 2012, 50, 1–5. [Google Scholar]
  58. Evans, B.A.; Feng, Z.; Peterson, A.V. A comparison of generalized linear mixed model procedures with estimating equations for variance and covariance parameter estimation in longitudinal studies and group randomized trials. Stat. Med. 2001, 20, 3353–3373. [Google Scholar] [CrossRef]
Figure 1. Study flow chart. Pigs were randomized after induction of Acute Respiratory Distress Syndrome (ARDS) and baseline ventilation with positive end-expiratory pressure (PEEP) of 5 mm H20, volume-controlled ventilation (VCV) and tidal volume of 6 mL/kg bodyweight (BW) to one of three ventilation groups referred to in 1 [2] for ARDSnet low PEEP table, 2 [9] for Open Lung Concept (OLC) and 3 [23] for Electrical Impedance Tomography (EIT) with standard deviation of regional ventilation delay (SDRVD) measurements. During the follow-up for 24 h computed tomography (CT) and EIT measurements were provided every 4 h. In the EIT group, one pig had to be excluded from the experiment because of intractable metabolic acidosis, thus, this experiment had to be repeated. As a result, 25 pigs were randomized. Because two pigs developed massive pneumothoraces after intra-tracheal hydrochloric acid instillation, we had to enroll 27 pigs in total (see Supplementary Materials).
Jcm 08 01250 g001
Figure 2. Surrogates of tidal recruitment and lung collapse. Measurements were performed at baseline (BL), ARDS/randomization (ARDS) and every 4 h for 24 h for the three ventilation groups ARDSnet, Open Lung Concept (OLC) and Electrical Impedance Tomography (EIT). Percentage of nonaerated lung tissue mass (Mnon), tidal recruitment (TR), and intrapulmonary shunt are shown in percent. Temporal changes in the standard deviation of regional ventilation delay (SDRVD) are shown as surrogates of inhomogeneous lung ventilation. Data are shown as means and their 95% confidence interval. Significant increases, especially in intrapulmonary shunt and Mnon, were shown between BL and ARDS for all parameters (paired t-test). Time and group effects and their interaction were tested using the general linear model approach. Differences between ventilation groups were tested by Sidak’s post-hoc test.
Jcm 08 01250 g002
Figure 3. Histological results: diffuse alveolar damage score and histologic samples. The diffuse alveolar damage (DAD) sub-scores (0–12 with increasing severity) are shown for the criteria intra-alveolar edema, inflammation, and hemorrhage as grand mean over all regions for each ventilation group. The bar plots indicate means and standard deviations. Parametric testing was considered appropriate and was done with ANOVA, being significant for inflammation and edema (p < 0.05). In Sidak’s post-hoc test OLC vs. ARDSnet differed significantly for inflammation (p = 0.037) with a tendency to lower scores for edema (p = 0.058). Hemorrhage did not differ between groups (p = 0.63). Representative histology samples for the ARDSnet, OLC, and EIT group are shown in the lower panel (100x magnification).
Jcm 08 01250 g003
Figure 4. Representative examples of CT- and EIT-images. A derived analysis obtained at baseline, at diagnosis of ARDS, and after 4 and 24 h of mechanical ventilation is presented for each ventilation group (ARDSnet, OLC, and EIT). Representative CT-Images for each group and time point are displayed. For EIT parameter analysis medibus-data (of PEEP) and reconstructed tidal images with Dräger algorithms (Dräger Medical Germany, GmbH, Lübeck, Germany) were used. Percentages for ventral and dorsal distribution of ventilation (positive pixel values) in EIT images were calculated based on tidal images, which were averaged over each group at each point in time for visualization. PEEP data and percentage of ventral and dorsal ventilation are shown as mean with standard deviation for each group and time point.
Jcm 08 01250 g004
Table 1. Hemodynamic and respiratory parameters.
GroupBaselineARDS4 h8 h12 h16 h20 h24 h
HR aa, bbb (min−1)ARDSnet OLC EIT103 ± 2380 ± 12105 ± 15104 ± 13106 ± 9108 ± 16105 ± 20114 ± 12
93 ± 13113 ± 16115 ± 13109 ± 11110 ± 17117 ± 10116 ± 18
84 ± 15103 ± 23110 ± 16114 ± 15116 ± 25115 ± 15114 ± 23
MAP bbb (mmHg)ARDSnet OLC EIT87 ± 2082 ± 1289 ± 1383 ± 1181 ± 1379 ± 1375 ± 970 ± 8
94 ± 1076 ± 1475 ± 878 ± 773 ± 1176 ± 1271 ± 10
91 ± 1780 ± 1575 ± 1271 ± 572 ± 1170 ± 563 ± 11
CO (L·min−1)ARDSnet OLC EIT5.6 ± 1.65.0 ± 1.65.8 ± 2.65.2 ± 1.75.3 ± 0.95.4 ± 0.95.4 ± 1.16.2 ± 0.8
5.6 ± 1.34.3 ± 1.04.2 ± 1.14.3 ± 0.84.6 ± 0.84.8 ± 0.64.7 ± 0.9
4.8 ± 1.34.0 ± 1.24.8 ± 1.14.6 ± 1.54.6 ± 1.44.7 ± 1.25.0 ± 1.2
SVR a, bbb (dyn·s·cm−5)ARDSnet OLC EIT1186 ± 4301660 ± 9541334 ± 5241370 ± 5391151 ± 3141078 ± 1621041 ± 201888 ± 212
1331 ± 3381510 ± 4781353 ± 4991246 ± 2891185 ± 3311145 ± 2221047 ± 154
1409 ± 2271604 ± 10461206 ± 2141201 ± 4751156 ± 4911123 ± 4961069 ± 450
PVR aaa, bb (dyn·s·cm−5)ARDSnet OLC EIT167 ± 73391 ± 173394 ± 157412 ± 115350 ± 112324 ± 120249 ± 90268 ± 55
234 ± 69323 ± 156260 ± 140274 ± 133270 ± 90250 ± 92245 ± 76
333 ± 128431 ± 252352 ± 129291 ± 131219 ± 77240 ± 81235 ± 112
PEEP bbb, ccc, ddd (cmH20)ARDSnet eee, fff OLC EIT5.0 ± 05.0 ± 07.9 ± 3.17.1 ± 1.96.1 ± 1.66.4 ± 26.9 ± 1.66.5 ± 1.6
5.0 ± 018 ± 3.518.0 ± 3.519.0 ± 3.219.0 ± 3.219.0 ± 3.219.0 ± 3.2
5.0 ± 019.5 ± 2.120.0 ± 3.221.8 ± 3.321.5 ± 2.622.0 ± 3.021.8 ± 3.5
Driving aaa, bbb, pressure ccc, ddd (cmH20)ARDSnet eee, fff OLC EIT10.7 ± 2.121.2 ± 2.819.1 ± 3.919.1 ± 2.618.1 ± 3.018.9 ± 4.818.1 ± 4.318.4 ± 3.4
20.3 ± 2.212.6 ± 2.312.7 ± 2.411.6 ± 2.211.2 ± 1.811.5 ± 1.611.5 ± 1.6
23.3 ± 1.612.6 ± 3.511.5 ± 3.012.6 ± 3.312.3 ± 2.112.0 ± 2.212.3 ± 3.0
Paw-plat aaa, bb, ccc, dd (cmH20)ARDSnet fff OLC EIT16.5 ± 2.128.1 ± 3.628.1 ± 4.027.0 ± 3.426.3 ± 3.526.1 ± 3.227.8 ± 3.828.0 ± 3.2
27.4 ± 3.332.4 ± 4.632.7 ± 3.832.0 ± 3.931.6 ± 4.031.1 ± 3.631.9 ± 3.7
30.8 ± 3.333.6 ± 3.534.8 ± 4.336.7 ± 3.736.0 ± 4.036.1 ± 4.236.4 ± 5.1
Paw-peak aaa, ccc (cmH20)ARDSnet fff, g OLC EIT21.1 ± 3.533.4 ± 3.937.5 ± 4.337.4 ± 3.536.6 ± 2.936.1 ± 2.940.5 ± 14.238.4 ± 5.9
33.4 ± 3.937.5 ± 4.337.4 ± 3.536.6 ± 3.036.1 ± 2.941.5 ± 14.238.4 ± 5.9
37.8 ± 8.340.3 ± 4.741.8 ± 4.843.0 ± 4.142.5 ± 4.342.8 ± 4.744.1 ± 6.9
PaO2) aaa, bbb, ccc, ddd (mmHg, 100% 02)ARDSnet eee, fff OLC EIT475 ± 70129 ± 64226 ± 100236 ± 112192 ± 98155 ± 64134 ± 58184 ± 95
66 ± 18442 ± 64454 ± 79477 ± 40471 ± 38444 ± 42446 ± 31
77 ± 32507 ± 56502 ± 51500 ± 40466 ± 49430 ± 36422 ± 74
PaCO2 aaa (mmHg)ARDSnet OLC EIT51.4 ± 9.758.3 ± 15.067.3 ± 21.462.4 ± 10.058.5 ± 8.559.9 ± 9.559.0 ± 8.662.1 ± 12.1
60.2 ± 11.959.1 ± 9.654.7 ± 6.357.1 ± 7.253.7 ± 6.355.9 ± 8.756.4 ± 7.7
58.5 ± 7.969.7 ± 10.467.8 ± 10.268.4 ± 12.468.2 ± 16.565.1 ± 10.467.3 ± 11
Compliance aaa, bbb, (mL·cmH2O−1) ccc, ddARDSnet eee, ff OLC EIT26.5 ± 4.712.4 ± 2.111.6 ± 2.111.4 ± 2.412.2 ± 2.912.0 ± 3.611.93.211.4 ± 2.3
13.6 ± 2.19.8 ± 4.119.7 ± 4.521.5 ± 7.121.9 ± 6.721.9 ± 6.121.9 ± 5.4
14.5 ± 4.18.7 ± 3.819.9 ± 4.218.9 ± 4.018.8 ± 2.719.8 ± 3.918.9 ± 4.1
Data are shown for the three ventilation groups ARDSnet, OLC, and EIT as described before. Heart rate (HR), mean arterial pressure (MAP), cardiac output (CO), systemic vascular resistance (SVR), pulmonary vascular resistance (PVR), positive end-expiratory pressure (PEEP), driving pressure, plateau airway pressure (Paw-plat), peak inspiratory airway pressure (Paw-peak), arterial partial pressure of oxygen (PaO2, ventilation with 100% oxygen), arterial partial pressure of carbon dioxide (PaCO2), and respiratory system compliance (compliance) are given as mean with standard deviation. Because randomized group allocation happened only after induction of ARDS, baseline measurements are averaged over all animals. Superscript letters are used to summarize statistically significant differences; one letter refers to p < 0.05, two letters to p < 0.01, and three letters to p < 0.001. a indicates statistically significant differences between baseline and ARDS, this was analyzed by paired t-tests over all animals (n = 24), irrespective of the group, to test the effects of ARDS induction. b marks parameters, for which the general linear model (GLM) statistics over all measurements from ARDS until 24 h indicated significant changes over time. c marks parameters, for which the GLM indicated significant between-group differences and d significant interaction terms (group * time). e refers to ARDS vs. OLC, f to ARDS vs. EIT, and g to OLC vs. EIT post-hoc tests.

