Role of Low Ankle–Brachial Index in Cardiovascular and Mortality Risk Compared with Major Risk Conditions

 ,
,
Abstract
1. Introduction
2. Methods
2.1. Data Source
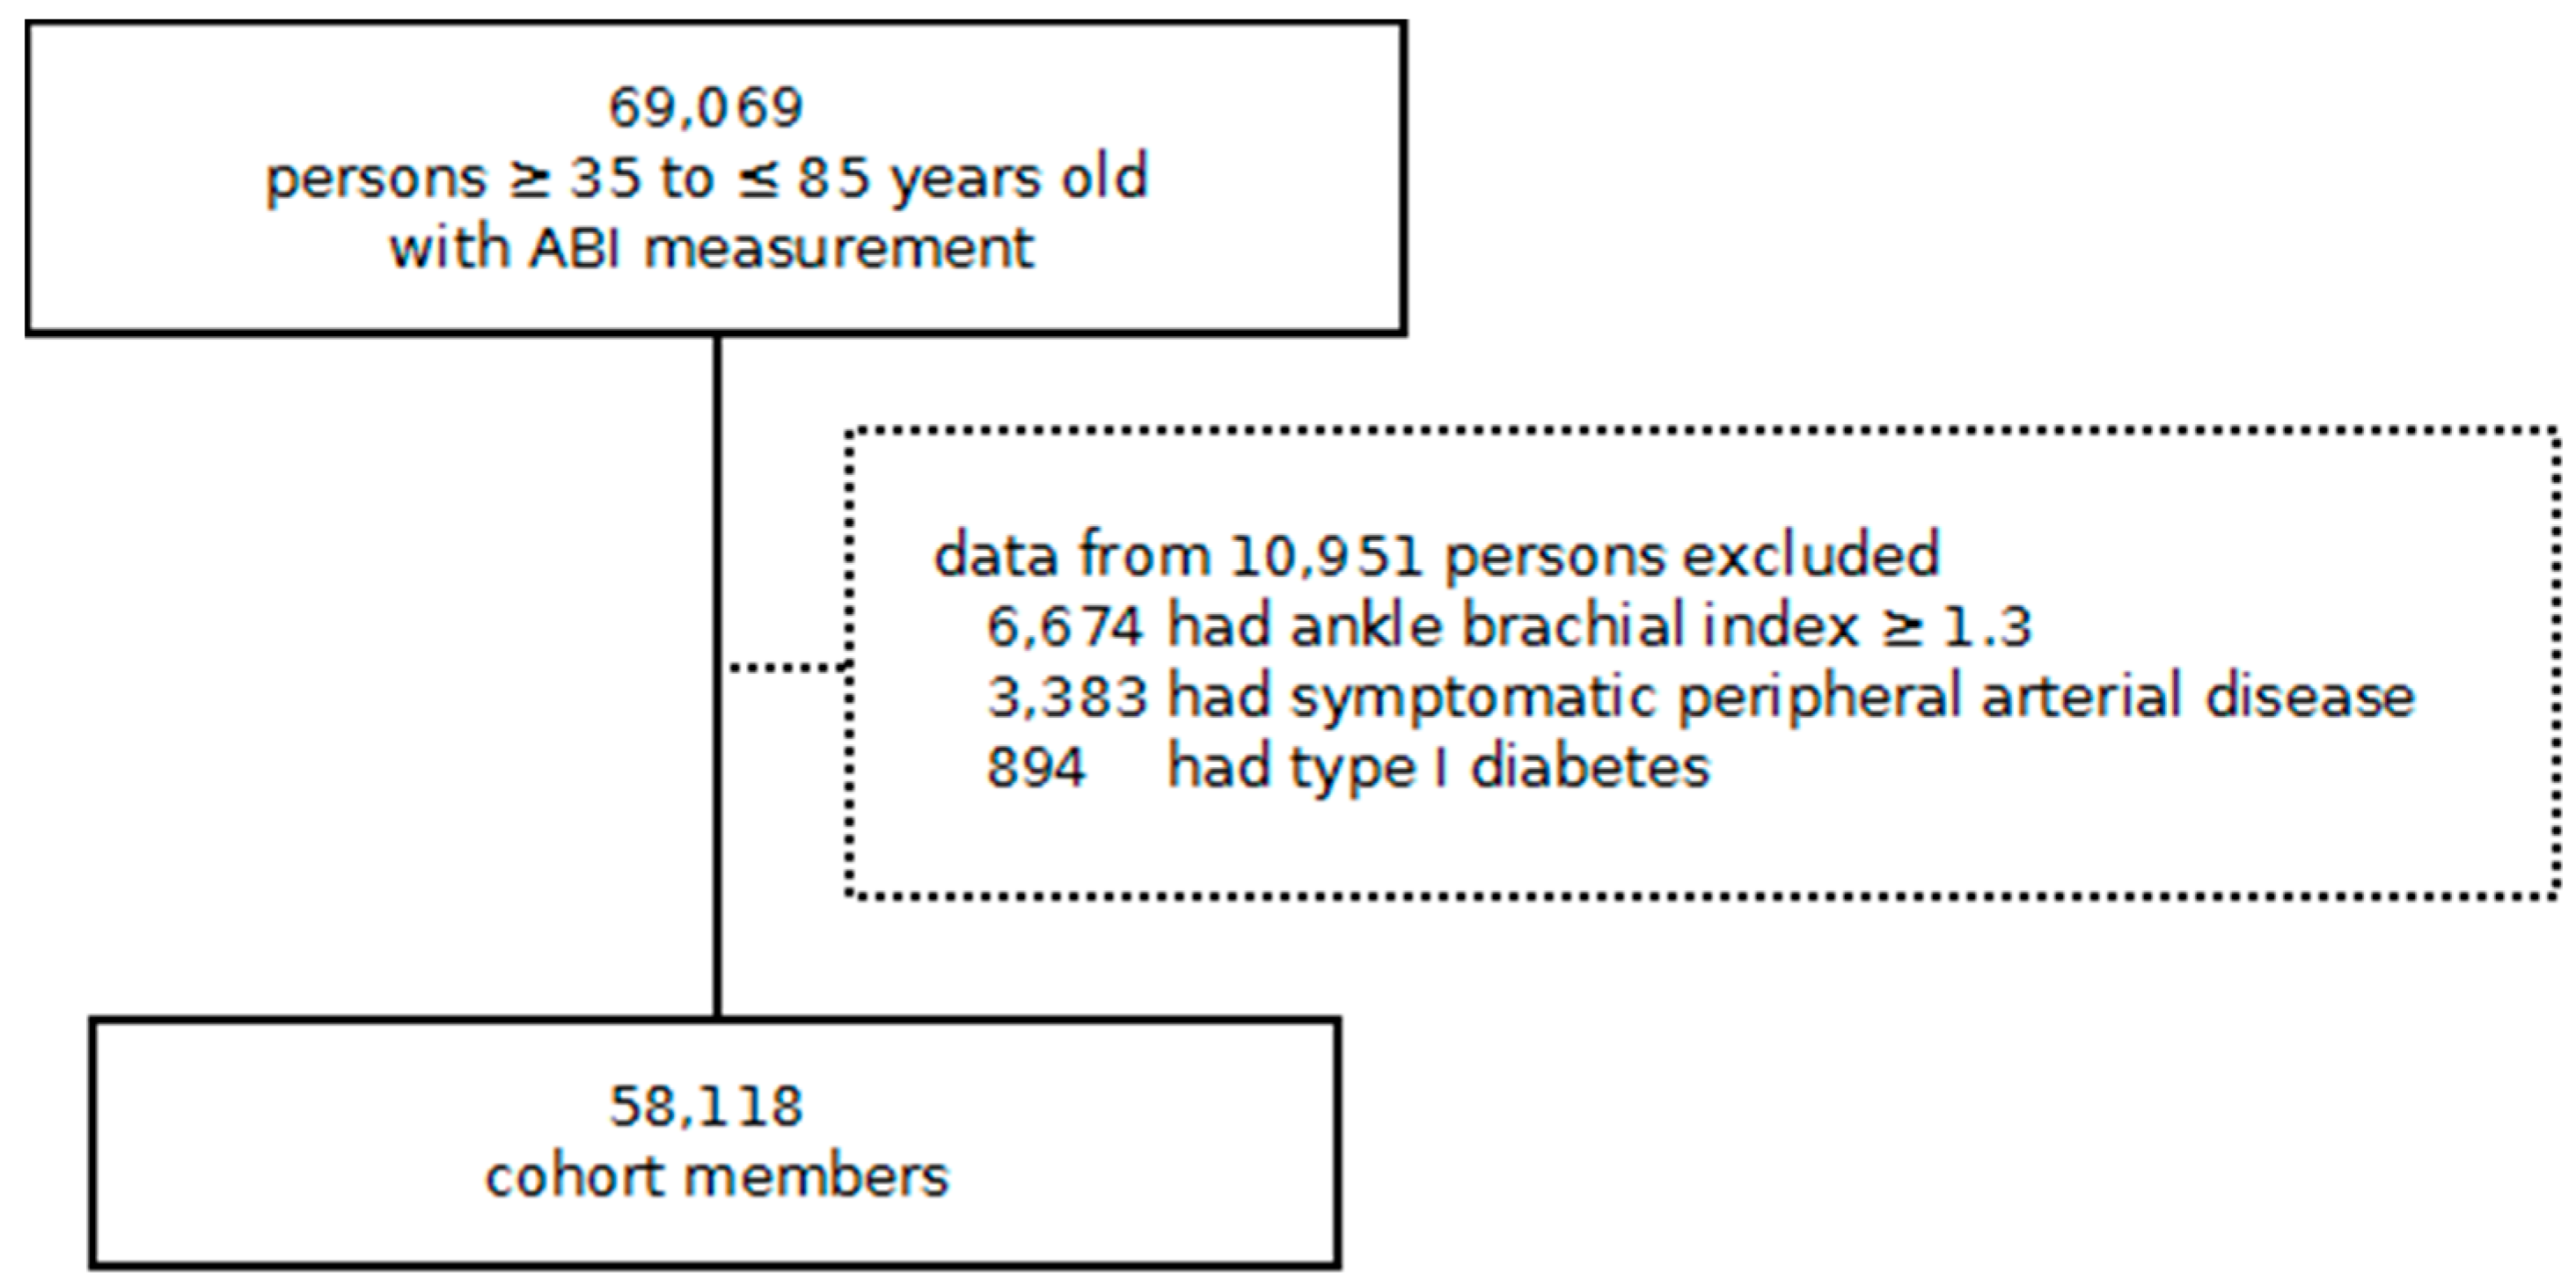
2.2. Study Design and Participants
2.3. Exposure and Outcomes
2.4. Covariates
2.5. Statistical Analysis
3. Results
4. Discussion
Author Contributions
Funding
Acknowledgments
Conflicts of Interest
Appendix A
Appendix A.1. Methods

| Variable | Missing Counts a | Imputed n = 58,118 | Complete Cases n = 28,206 |
|---|---|---|---|
| Age, years | - | 66.6 (10.7) | 67.3 (10.1) |
| Male, n (%) | - | 31,064 (53.4%) | 15,012 (53.2%) |
| Smoker, n (%) | - | 15,010 (25.8%) | 7086 (25.1%) |
| Weight, kg | 14,604 (25.1%) | 78.3 (14.6) | 78.2 (13.9) |
| Height, cm | 18,921 (32.6%) | 161.4 (9.3) | 161.1 (9.2) |
| Body mass index, kg/m2 | 19,073 (32.8%) | 30.0 (4.8) | 30.1 (4.7) |
| Systolic BP, mmHg | 7652 (13.2%) | 135.4 (15.9) | 135.7 (15.5) |
| Diastolic BP, mmHg | 7652 (13.2%) | 76.8 (9.7) | 76.5 (9.5) |
| Pulse pressure, mmHg | 7652 (13.2%) | 58.6 (14.5) | 59.2 (14.3) |
| Total cholesterol, mmol/L | 14,366 (24.7%) | 5.1 (1.0) | 5.1 (1.0) |
| LDL cholesterol, mmol/L | 18,625 (32.0%) | 3.0 (0.9) | 3.0 (0.8) |
| HDL cholesterol, mmol/L | 18,179 (31.3%) | 1.4 (0.4) | 1.3 (0.4) |
| Triglycerides, mmol/L | 16,954 (29.2%) | 1.7 (1.1) | 1.7 (1.0) |
| Glucose, mmol/L | 13,746 (23.7%) | 7.5 (2.8) | 7.7 (2.7) |
| Comorbidities, n (%) | |||
| Hypertension | - | 39,458 (67.9%) | 20,624 (73.1%) |
| Atrial fibrillation | - | 3665 (6.3%) | 1818 (6.4%) |
| Malignant neoplasm | - | 4845 (8.3%) | 2292 (8.1%) |
| Chronic kidney disease | - | 2945 (5.1%) | 1502 (5.3%) |
| COPD | - | 6442 (11.1%) | 3169 (11.2%) |
| Acute myocardial infarction | 6922 (11.91%) | 3277 (11.62%) | |
| Angina | 2680 (4.61%) | 1395 (4.95%) | |
| Stroke | 2913 (5.01%) | 1475 (5.23%) | |
| Transient ischemic attack | 1640 (2.82%) | 831 (2.95%) | |
| Medication, n (%) | |||
| Antidiabetic therapy | - | 32,846 (56.5%) | 18,480 (65.5%) |
| Diuretics | - | 14,840 (25.5%) | 7627 (27.0%) |
| Beta-blockers | - | 10,014 (17.2%) | 5191 (18.4%) |
| Calcium channel blockers | - | 10,721 (18.4%) | 5787 (20.5%) |
| Agents acting on the renin–angiotensin system | - | 32,338 (55.6%) | 17,418 (61.8%) |
| Other antihypertensives | - | 2721 (4.7%) | 1378 (4.9%) |
| Statins | - | 25,749 (44.3%) | 14,419 (51.1%) |
| Other lipid-lowering agents | - | 3799 (6.5%) | 1995 (7.1%) |
| Aspirin | - | 17,852 (30.7%) | 9636 (34.2%) |
| Follow-up, years (1st quartile, 3rd quartile) | - | 5.9 (4.7, 7.6) | 5.8 (4.7, 7.2) |
| Lost to follow-up, n (%) | - | 914 (1.6%) | 421 (1.5%) |
| Group | Hazard Ratio (95% Confidence Interval) | ||||
|---|---|---|---|---|---|
| Diabetes | CVD | Low ABI | All-Cause Mortality | AMI | Ischemic Stroke |
| Yes | Yes | Yes | 2.74 (2.32, 3.24) | 4.51 (3.26, 6.23) | 3.89 (3.09, 4.89) |
| Yes | Yes | No | 2.08 (1.78, 2.42) | 3.28 (2.41, 4.46) | 3.38 (2.74, 4.17) |
| Yes | No | Yes | 2.11 (1.81, 2.47) | 1.83 (1.31, 2.54) | 1.87 (1.49, 2.34) |
| No | Yes | Yes | 1.58 (1.21, 2.07) | 1.96 (1.14, 3.36) | 2.44 (1.69, 3.53) |
| No | Yes | No | 1.66 (1.34, 2.07) | 1.98 (1.27, 3.10) | 1.85 (1.35, 2.54) |
| No | No | Yes | 1.54 (1.21, 1.97) | 1.76 (1.08, 2.88) | 1.32 (0.90, 1.92) |
| Yes | No | No | 1.52 (1.33, 1.74) | 1.47 (1.11, 1.94) | 1.44 (1.19, 1.74) |
| No | No | No | Reference | Reference | Reference |
| Group | Hazard Ratio (95% Confidence Interval) | ||||
|---|---|---|---|---|---|
| Diabetes | CVD | Low ABI | All-Cause Mortality | AMI | Ischemic Stroke |
| Yes | Yes | Yes | 2.68 (2.42, 2.95) | 4.54 (3.71, 5.56) | 3.97 (3.43, 4.59) |
| Yes | Yes | No | 2.01 (1.84, 2.20) | 3.42 (2.84, 4.13) | 3.41 (2.99, 3.88) |
| Yes | No | Yes | 1.84 (1.68, 2.01) | 2.07 (1.69, 2.53) | 2.00 (1.74, 2.30) |
| No | Yes | Yes | 1.71 (1.49, 1.97) | 2.91 (2.21, 3.84) | 2.76 (2.25, 3.39) |
| No | Yes | No | 1.50 (1.34, 1.69) | 2.28 (1.78, 2.92) | 2.15 (1.81, 2.57) |
| No | No | Yes | 1.42 (1.25, 1.63) | 1.79 (1.34, 2.39) | 1.45 (1.17, 1.80) |
| Yes | No | No | 1.35 (1.26, 1.45) | 1.51 (1.28, 1.78) | 1.41 (1.26, 1.58) |
| No | No | No | Reference | Reference | Reference |
| Variable of Adjustment | Outcome | ||
|---|---|---|---|
| Mortality | AMI | Stroke | |
| Age | √ | √ | √ |
| Age2 | √ | √ | √ |
| Male | √ | √ | √ |
| Smoker | √ | √ | √ |
| BMI | √ | √ | √ |
| Pulse pressure | √ | √ | √ |
| LDL cholesterol | √ | √ | |
| HDL cholesterol | √ | √ | √ |
| Triglycerides | √ | √ | |
| Comorbidities | |||
| Hypertension | √ | ||
| Atrial fibrillation | √ | √ | √ |
| Malignant neoplasm | √ | ||
| Chronic kidney disease | √ | ||
| COPD | √ | √ | √ |
| Medications | |||
| Diuretics | √ | √ | √ |
| Beta-blockers | √ | √ | √ |
| Calcium channel blockers | √ | √ | √ |
| Agents acting on the renin angiotensin system | √ | √ | √ |
| Statins | √ | √ | √ |
| Other lipid lowering agents | √ | ||
| Aspirin | √ | √ | √ |
| No Diabetes | Diabetes | |||||||
|---|---|---|---|---|---|---|---|---|
| No CVD | Prior CVD | No CVD | Prior CVD | |||||
| No LOW.ABI | LOW.ABI a | No LOW.ABI | LOW.ABI | No LOW.ABI | LOW.ABI | No LOW.ABI | LOW.ABI | |
| n (%) | 3704 (13.1%) | 645 (2.3%) | 736 (2.6%) | 337 (1.2%) | 15,373 (54.5%) | 2696 (9.6%) | 3304 (11.7%) | 1411 (5.0%) |
| Age, years | 66.8 (10.3) | 68.4 (10.5) | 70.4 (8.7) | 71.1 (9.5) | 66.1 (10.2) | 68.2 (10.0) | 70.0 (8.9) | 70.9 (8.8) |
| Male, n (%) | 1650 (44.5%) | 383 (59.4%) | 476 (64.7%) | 256 (76.0%) | 7621 (49.6%) | 1500 (55.6%) | 2136 (64.6%) | 990 (70.2%) |
| Smoker, n (%) | 798 (21.5%) | 220 (34.1%) | 216 (29.3%) | 163 (48.4%) | 3417 (22.2%) | 780 (28.9%) | 971 (29.4%) | 521 (36.9%) |
| Weight, kg | 76.3 (13.7) | 77.4 (14.7) | 76.6 (12.4) | 75.2 (11.7) | 78.6 (14.1) | 78.8 (14.1) | 78.8 (13.4) | 78.0 (13.6) |
| Height, cm | 160.4 (9.2) | 161.5 (9.1) | 161.9 (8.5) | 162.0 (8.0) | 160.9 (9.4) | 161.2 (9.2) | 162.0 (9.0) | 162.0 (8.9) |
| Body mass index, kg/m2 | 29.6 (4.5) | 29.6 (4.8) | 29.2 (4.0) | 28.6 (3.9) | 30.3 (4.8) | 30.4 (5.0) | 30.0 (4.4) | 29.7 (4.5) |
| Hypertension, n (%) | 2780 (75.1%) | 499 (77.4%) | 593 (80.6%) | 279 (82.8%) | 10,579 (68.8%) | 2015 (74.7%) | 2694 (81.5%) | 1185 (84.0%) |
| Systolic BP, mmHg | 134.4 (14.9) | 136.2 (16.3) | 133.9 (15.1) | 135.8 (17.5) | 135.5 (15.1) | 138.4 (16.9) | 135.2 (15.7) | 137.3 (17.2) |
| Diastolic BP, mmHg | 77.7 (9.5) | 76.7 (9.9) | 75.8 (9.9) | 74.0 (10.0) | 77.1 (9.3) | 76.2 (9.7) | 74.1 (9.5) | 73.3 (10.2) |
| Pulse pressure, mmHg | 56.7 (13.3) | 59.5 (14.7) | 58.1 (14.1) | 61.8 (15.2) | 58.4 (13.8) | 62.2 (15.7) | 61.0 (14.6) | 64.0 (16.1) |
| Total cholesterol, mmol/L | 5.5 (0.9) | 5.5 (1.0) | 5.0 (1.0) | 5.1 (1.0) | 5.1 (0.9) | 5.1 (1.0) | 4.6 (0.9) | 4.7 (1.0) |
| LDL cholesterol, mmol/L | 3.4 (0.8) | 3.4 (0.9) | 2.9 (0.8) | 3.1 (0.9) | 2.9 (0.8) | 3.0 (0.8) | 2.6 (0.8) | 2.7 (0.8) |
| HDL cholesterol, mmol/L | 1.5 (0.4) | 1.4 (0.4) | 1.4 (0.4) | 1.3 (0.3) | 1.3 (0.3) | 1.3 (0.3) | 1.3 (0.3) | 1.2 (0.3) |
| Triglycerides, mmol/L | 1.4 (0.8) | 1.5 (0.8) | 1.5 (0.8) | 1.5 (0.8) | 1.7 (1.0) | 1.7 (1.0) | 1.7 (0.9) | 1.7 (1.1) |
| Glucose, mmol/L | 5.4 (0.9) | 5.5 (0.9) | 5.4 (0.7) | 5.4 (0.7) | 8.2 (2.7) | 8.4 (2.9) | 8.0 (2.6) | 8.4 (2.9) |
| Comorbidities, n (%) | ||||||||
| Atrial fibrillation | 170 (4.6%) | 45 (7.0%) | 102 (13.9%) | 43 (12.8%) | 684 (4.4%) | 163 (6.0%) | 407 (12.3%) | 204 (14.5%) |
| Malignant neoplasm | 269 (7.3%) | 48 (7.4%) | 69 (9.4%) | 39 (11.6%) | 1180 (7.7%) | 206 (7.6%) | 330 (10.0%) | 151 (10.7%) |
| Chronic kidney disease | 144 (3.9%) | 31 (4.8%) | 60 (8.2%) | 41 (12.2%) | 598 (3.9%) | 142 (5.3%) | 312 (9.4%) | 174 (12.3%) |
| COPD | 354 (9.6%) | 103 (16.0%) | 139 (18.9%) | 109 (32.3%) | 1295 (8.4%) | 338 (12.5%) | 532 (16.1%) | 299 (21.2%) |
| Medication, n (%) | ||||||||
| Antidiabetic therapy | 0 (0.0%) | 0 (0.0%) | 0 (0.0%) | 0 (0.0%) | 12,261 (79.8%) | 2232 (82.8%) | 2755 (83.4%) | 1232 (87.3%) |
| Diuretics | 1005 (27.1%) | 198 (30.7%) | 240 (32.6%) | 110 (32.6%) | 3664 (23.8%) | 745 (27.6%) | 1123 (34.0%) | 542 (38.4%) |
| Beta-blockers | 473 (12.8%) | 91 (14.1%) | 239 (32.5%) | 107 (31.8%) | 1918 (12.5%) | 385 (14.3%) | 1436 (43.5%) | 542 (38.4%) |
| Calcium channel blockers | 536 (14.5%) | 108 (16.7%) | 207 (28.1%) | 109 (32.3%) | 2655 (17.3%) | 552 (20.5%) | 1126 (34.1%) | 494 (35.0%) |
| Agents acting on the renin–angiotensin system | 1956 (52.8%) | 376 (58.3%) | 461 (62.6%) | 218 (64.7%) | 9090 (59.1%) | 1801 (66.8%) | 2424 (73.4%) | 1092 (77.4%) |
| Other antihypertensives | 125 (3.4%) | 35 (5.4%) | 35 (4.8%) | 18 (5.3%) | 675 (4.4%) | 161 (6.0%) | 229 (6.9%) | 100 (7.1%) |
| Statins | 1189 (32.1%) | 232 (36.0%) | 461 (62.6%) | 213 (63.2%) | 7448 (48.4%) | 1383 (51.3%) | 2456 (74.3%) | 1037 (73.5%) |
| Other lipid-lowering agents | 137 (3.7%) | 30 (4.7%) | 41 (5.6%) | 27 (8.0%) | 1046 (6.8%) | 178 (6.6%) | 378 (11.4%) | 158 (11.2%) |
| Aspirin | 378 (10.2%) | 136 (21.1%) | 440 (59.8%) | 197 (58.5%) | 4348 (28.3%) | 926 (34.3%) | 2272 (68.8%) | 939 (66.5%) |
| Follow-up, years, IQR | 5.8 (4.7, 7.5) | 5.7 (4.6, 7.2) | 5.7 (4.6, 7.2) | 5.5 (4.5, 6.9) | 5.9 (4.8, 7.3) | 5.6 (4.6, 7.1) | 5.6 (4.6, 7.1) | 5.4 (4.4, 7.0) |
| Lost to follow-up, n (%) b | 58 (1.6%) | 9 (1.4%) | 8 (1.1%) | 6 (1.8%) | 220 (1.4%) | 52 (1.9%) | 50 (1.5%) | 18 (1.3%) |
| Group | All-Cause Mortality | Acute Myocardial Infarction | Stroke | |||||
|---|---|---|---|---|---|---|---|---|
| Diabetes | CVD | Low ABI a | Events b | Incidence Rate c (95% CI) | Events | Incidence Rate (95% CI) | Events | Incidence Rate (95% CI) |
| Yes | Yes | Yes | 406 | 53.0 (48.0, 58.4) | 153 | 21.0 (17.9, 24.6) | 229 | 32.5 (28.5, 36.9) |
| Yes | Yes | No | 648 | 34.5 (32.0, 37.3) | 248 | 13.7 (12.1, 15.5) | 445 | 25.3 (23.1, 27.8) |
| Yes | No | Yes | 428 | 27.7 (25.2, 30.5) | 94 | 6.2 (5.0, 7.6) | 188 | 12.5 (10.9, 14.5) |
| No | Yes | Yes | 69 | 36.4 (28.7, 46.1) | 18 | 9.8 (6.2, 15.6) | 38 | 21.4 (15.5, 29.4) |
| No | Yes | No | 124 | 29.2 (24.5, 34.9) | 31 | 7.4 (5.2, 10.6) | 58 | 14.2 (11.0, 18.4) |
| No | No | Yes | 86 | 23.0 (18.6, 28.4) | 22 | 6.0 (3.9, 9.1) | 34 | 9.3 (6.6, 13.0) |
| Yes | No | No | 1510 | 16.4 (15.6, 17.2) | 383 | 4.2 (3.8, 4.6) | 759 | 8.4 (7.8, 9.0) |
| No | No | No | 260 | 11.6 (10.3, 13.1) | 59 | 2.7 (2.1, 3.4) | 132 | 6.0 (5.1, 7.1) |
| Group | HR (95% Confidence Interval) | ||||
|---|---|---|---|---|---|
| Diabetes | CVD | Low ABI a | All-Cause Mortality | AMI | Ischemic Stroke |
| Yes | Yes | Yes | 2.74 (2.32, 3.24) | 4.51 (3.26, 6.23) | 3.89 (3.09, 4.89) |
| Yes | Yes | No | 2.08 (1.78, 2.42) | 3.28 (2.41, 4.46) | 3.38 (2.74, 4.17) |
| Yes | No | Yes | 2.11 (1.81, 2.47) | 1.83 (1.31, 2.54) | 1.87 (1.49, 2.34) |
| No | Yes | Yes | 1.58 (1.21, 2.07) | 1.96 (1.14, 3.36) | 2.44 (1.69, 3.53) |
| No | Yes | No | 1.66 (1.34, 2.07) | 1.98 (1.27, 3.10) | 1.85 (1.35, 2.54) |
| No | No | Yes | 1.54 (1.21, 1.97) | 1.76 (1.08, 2.88) | 1.32 (0.90, 1.92) |
| Yes | No | No | 1.52 (1.33, 1.74) | 1.47 (1.11, 1.94) | 1.44 (1.19, 1.74) |
| No | No | No | Reference | Reference | Reference |
References
- Rosamond, W.D.; Chambless, L.E.; Heiss, G.; Mosley, T.H.; Coresh, J.; Whitsel, E.; Wagenknecht, L.; Ni, H.; Folsom, A.R. Twenty-two-year trends in incidence of myocardial infarction, coronary heart disease mortality, and case fatality in 4 US communities, 1987–2008. Circulation 2012, 125, 1848–1857. [Google Scholar] [CrossRef] [PubMed]
- Wang, H.; Naghavi, M.; Allen, C.; Barber, R.M.; Carter, A.; Casey, D.C.; Charlson, F.J.; Chen, A.Z.; Coates, M.M.; Coggeshall, M.; et al. Global, regional, and national life expectancy, all-cause mortality, and cause-specific mortality for 249 causes of death, 1980–2015: A systematic analysis for the Global Burden of Disease Study 2015. Lancet 2016, 388, 1459–1544. [Google Scholar] [CrossRef]
- Goff, D.C.; Lloyd-Jones, D.M.; Bennett, G.; Coady, S.; D’Agostino, R.B.; Gibbons, R.; Greenland, P.; Lackland, D.T.; Levy, D.; O’Donnell, C.J.; et al. 2013 ACC/AHA guideline on the assessment of cardiovascular risk: A report of the American college of cardiology/American heart association task force on practice guidelines. Circulation 2014, 129. [Google Scholar] [CrossRef] [PubMed]
- Stone, N.J.; Robinson, J.G.; Lichtenstein, A.H.; Bairey Merz, C.N.; Blum, C.B.; Eckel, R.H.; Goldberg, A.C.; Gordon, D.; Levy, D.; Lloyd-Jones, D.M.; et al. 2013 ACC/AHA guideline on the treatment of blood cholesterol to reduce atherosclerotic cardiovascular risk in adults: A report of the American college of cardiology/American heart association task force on practice guidelines. J. Am. Coll. Cardiol. 2014, 63, 2889–2934. [Google Scholar] [CrossRef] [PubMed]
- Conroy, R.M.; Pyörälä, K.; Fitzgerald, A.P.; Sans, S.; Menotti, A.; De Backer, G.; De Bacquer, D.; Ducimetière, P.; Jousilahti, P.; Keil, U.; et al. Estimation of ten-year risk of fatal cardiovascular disease in Europe: The SCORE project. Eur. Heart J. 2003, 24, 987–1003. [Google Scholar] [CrossRef]
- Marrugat, J.; Subirana, I.; Ramos, R.; Vila, J.; Marín-Ibañez, A.; Guembe, M.J.; Rigo, F.; Tormo Díaz, M.J.; Moreno-Iribas, C.; Cabré, J.J.; et al. Derivation and validation of a set of 10-year cardiovascular risk predictive functions in Spain: The FRESCO Study. Prev. Med. 2014, 61, 66–74. [Google Scholar] [CrossRef] [PubMed]
- Piepoli, M.F. 2016 European Guidelines on cardiovascular disease prevention in clinical practice. Int. J. Behav. Med. 2017, 24, 321–419. [Google Scholar] [CrossRef]
- Aboyans, V.; Criqui, M.H.; Abraham, P.; Allison, M.A.; Creager, M.A.; Diehm, C.; Fowkes, F.G.R.; Hiatt, W.R.; Jönsson, B.; Lacroix, P.; et al. Measurement and interpretation of the Ankle-Brachial Index: A scientific statement from the American Heart Association. Circulation 2012, 126, 2890–2909. [Google Scholar] [CrossRef]
- Aboyans, V.; Ricco, J.-B.; Bartelink, M.-L.E.L.; Björck, M.; Brodmann, M.; Cohnert, T.; Collet, J.-P.; Czerny, M.; De Carlo, M.; Debus, S.; et al. 2017 ESC Guidelines on the Diagnosis and Treatment of Peripheral Arterial Diseases, in collaboration with the European Society for Vascular Surgery (ESVS). Eur. Heart J. 2018. [Google Scholar] [CrossRef]
- Fowkes, F.G.R.; Murray, G.D.; Butcher, I.; Heald, C.L.; Lee, R.J.; Chambless, L.E.; Folsom, A.R.; Hirsch, A.T.; Dramaix, M.; DeBacker, G.; et al. Ankle brachial index combined with Framingham Risk Score to predict cardiovascular events and mortality: A meta-analysis. JAMA 2008, 300, 197–208. [Google Scholar]
- Hanssen, N.M.J.; Huijberts, M.S.; Schalkwijk, C.G.; Nijpels, G.; Dekker, J.M.; Stehouwer, C.D.A. Associations between the ankle-brachial index and cardiovascular and all-cause mortality are similar in individuals without and with type 2 diabetes: Nineteen-year follow-up of a population-based cohort study. Diabetes Care 2012, 35, 1731–1735. [Google Scholar] [CrossRef] [PubMed]
- Wang, Y.; Mou, Q.; Zhao, D.; Xu, Y.; Hu, D.; Ma, H.; Liu, J.; Guo, X.; Li, J. Predictive value of ankle-brachial index and blood glucose on the outcomes of six-year all-cause mortality and cardiovascular mortality in a Chinese population of type 2 diabetes patients. Int. Angiol. 2012, 31, 586–594. [Google Scholar] [PubMed]
- Banerjee, S.; Vinas, A.; Mohammad, A.; Hadidi, O.; Thomas, R.; Sarode, K.; Banerjee, A.; Garg, P.; Weideman, R.A.; Little, B.B.; et al. Significance of an Abnormal Ankle-Brachial Index in Patients With Established Coronary Artery Disease With and Without Associated Diabetes Mellitus. Am. J. Cardiol. 2014, 113, 1280–1284. [Google Scholar] [CrossRef] [PubMed]
- del Mar García-Gil, M.; Hermosilla, E.; Prieto-alhambra, D.; Fina, F.; Rosell, M.; Williams, T. Construction and validation of a scoring system for the selection of high-quality data in a Spanish population primary care database (SIDIAP). Inform. Prim. Care 2011, 19, 135–145. [Google Scholar] [CrossRef]
- Ramos, R.; Balló, E.; Marrugat, J.; Elosua, R.; Sala, J.; Grau, M.; Vila, J.; Bolíbar, B.; García-Gil, M.; Martí, R.; et al. Validity for use in research on vascular diseases of the SIDIAP (Information System for the Development of Research in Primary Care): The EMMA study. Rev. Esp. Cardiol. 2012, 65, 29–37. [Google Scholar] [CrossRef]
- SIDIAP (ES). Barcelona: SIDIAP (ES). Available online: http://www.sidiap.org/index.php/difusiomenu/articles (accessed on 27 March 2017).
- Ponjoan, A.; García-Gil, M.M.; Martí, R.; Comas-Cufí, M.; Alves-I-Cabratosa, L.; Sala, J.; Marrugat, J.; Elosua, R.; de Tuero, G.C.; Grau, M.; et al. Derivation and validation of BOREAS, a risk score identifying candidates to develop cold-induced hypertension. Environ. Res. 2014, 132C, 190–196. [Google Scholar] [CrossRef]
- García-Gil, M.; Blanch, J.; Comas-Cufí, M.; Daunis-i-Estadella, J.; Bolíbar, B.; Martí, R.; Ponjoan, A.; Alves-Cabratosa, L.; Ramos, R. Patterns of statin use and cholesterol goal attainment in a high-risk cardiovascular population: A retrospective study of primary care electronic medical records. J. Clin. Lipidol. 2016, 10, 134–142. [Google Scholar] [CrossRef]
- Ramos, R.; García-Gil, M.; Comas-Cufí, M.; Quesada, M.; Marrugat, J.; Elosua, R.; Sala, J.; Grau, M.; Martí, R.; Ponjoan, A.; et al. Statins for Prevention of Cardiovascular Events in a Low-Risk Population with Low Ankle Brachial Index. J. Am. Coll. Cardiol. 2016, 67, 630–640. [Google Scholar] [CrossRef]
- Potier, L.; Roussel, R.; Labreuche, J.; Marre, M.; Cacoub, P.; Röther, J.; Wilson, P.W.; Goto, S.; Bhatt, D.L.; Steg, P.G. Interaction between diabetes and a high ankle–brachial index on mortality risk. Eur. J. Prev. Cardiol. 2015, 22, 615–621. [Google Scholar] [CrossRef]
- Marrugat, J.; Vila, J.; Baena-Díez, J.M.; Grau, M.; Sala, J.; Ramos, R.; Subirana, I.; Fitó, M.; Elosua, R. Relative validity of the 10-year cardiovascular risk estimate in a population cohort of the REGICOR study. Rev. Española Cardiol. 2011, 64, 385–394. [Google Scholar] [CrossRef]
- Hippisley-Cox, J.; Coupland, C.; Vinogradova, Y.; Robson, J.; Minhas, R.; Sheikh, A.; Brindle, P. Predicting cardiovascular risk in England and Wales: Prospective derivation and validation of QRISK2. BMJ 2008, 336, 1475–1482. [Google Scholar] [CrossRef] [PubMed]
- Pasqualini, L.; Schillaci, G.; Pirro, M.; Vaudo, G.; Leli, C.; Colella, R.; Innocente, S.; Ciuffetti, G.; Mannarino, E. Prognostic value of low and high ankle-brachial index in hospitalized medical patients. Eur. J. Intern. Med. 2012, 23, 240–244. [Google Scholar] [CrossRef] [PubMed]
- Nishimura, H.; Miura, T.; Minamisawa, M.; Ueki, Y.; Abe, N.; Hashizume, N.; Mochidome, T.; Harada, M.; Shimizu, K.; Shoin, W.; et al. Clinical characteristics and outcomes of patients with high ankle-brachial index from the IMPACT-ABI study. PLoS ONE 2016, 11, 1–12. [Google Scholar] [CrossRef] [PubMed]
- Criqui, M.H.; McClelland, R.L.; McDermott, M.M.; Allison, M.A.; Blumenthal, R.S.; Aboyans, V.; Ix, J.H.; Burke, G.L.; Liu, K.; Shea, S. The ankle-brachial index and incident cardiovascular events in the MESA (Multi-Ethnic study of atherosclerosis). J. Am. Coll. Cardiol. 2010, 56, 1506–1512. [Google Scholar] [CrossRef] [PubMed]
- Elosua-Bayés, M.; Martí-Lluch, R.; del Mar García-Gil, M.; Camós, L.; Comas-Cufí, M.; Blanch, J.; Ponjoan, A.; Alves-Cabratosa, L.; Elosua, R.; Grau, M.; et al. Association of Classic Cardiovascular Risk Factors and Lifestyles With the Cardio-ankle Vascular Index in a General Mediterranean Population. Rev. Española Cardiol. 2018, 71, 458–465. [Google Scholar]
- Janssen, K.J.M.; Donders, A.R.; Harrell, F.E., Jr.; Vergouwe, Y.; Chen, Q.; Grobbee, D.E.; Moons, K.G.M. Missing covariate data in medical research: To impute is better than to ignore. J. Clin. Epidemiol. 2010, 63, 721–727. [Google Scholar] [CrossRef] [PubMed]
- White, I.R.; Royston, P.; Wood, A.M. Multiple imputation using chained equations: Issues and guidance for practice. Stat. Med. 2011, 30, 377–399. [Google Scholar] [CrossRef] [PubMed]
- Sterne, J.A.; White, I.R.; Carlin, J.B.; Spratt, M.; Royston, P.; Kenward, M.G.; Wood, A.M.; Carpenter, J.R. Multiple imputation for missing data in epidemiological and clinical research: Potential and pitfalls. BMJ 2009, 338, b2393. [Google Scholar] [CrossRef] [PubMed]
- Team R Development Core R: A Language and Environment for Statistical Computing. Available online: http://www.r-project.org/ (accessed on 10 May 2019).
- van Buuren, S.; Groothuis-Oudshoorn, K. mice: Multivariate Imputation by Chained Equations in R. J. Stat. Softw. 2011, 45, 1–67. [Google Scholar] [CrossRef]
- Samba, H.; Guerchet, M.; Ndamba-Bandzouzi, B.; Kehoua, G.; Mbelesso, P.; Desormais, I.; Aboyans, V.; Preux, P.-M.; Lacroix, P. Ankle Brachial Index (ABI) predicts 2-year mortality risk among older adults in the Republic of Congo: The EPIDEMCA-FU study. Atherosclerosis 2019, 286, 121–127. [Google Scholar] [CrossRef]
- Otsuka, K.; Nakanishi, K.; Shimada, K.; Nakamura, H.; Inanami, H.; Nishioka, H.; Fujimoto, K.; Kasayuki, N.; Yoshiyama, M. Ankle-brachial index, arterial stiffness, and biomarkers in the prediction of mortality and outcomes in patients with end-stage kidney disease. Clin. Cardiol. 2019. [Google Scholar] [CrossRef] [PubMed]
- Le Bivic, L.; Magne, J.; Guy-Moyat, B.; Wojtyna, H.; Lacroix, P.; Blossier, J.-D.; Le Guyader, A.; Desormais, I.; Aboyans, V. The intrinsic prognostic value of the ankle-brachial index is independent from its mode of calculation. Vasc. Med. 2019, 24, 23–31. [Google Scholar] [CrossRef] [PubMed]
- Miura, T.; Soga, Y.; Doijiri, T.; Aihara, H.; Yokoi, H.; Iwabuchi, M.; Nobuyoshi, M. Prevalence and Clinical Outcome of Polyvascular Atherosclerotic Disease in Patients Undergoing Coronary Intervention. Circ. J. 2013, 77, 89–95. [Google Scholar] [CrossRef] [PubMed]
- Jönelid, B.; Johnston, N.; Berglund, L.; Andrén, B.; Kragsterman, B.; Christersson, C. Ankle brachial index most important to identify polyvascular disease in patients with non-ST elevation or ST-elevation myocardial infarction. Eur. J. Intern. Med. 2016, 30, 55–60. [Google Scholar] [CrossRef] [PubMed]
- Gerhard-Herman, M.D.; Gornik, H.L.; Barrett, C.; Barshes, N.R.; Corriere, M.A.; Drachman, D.E.; Fleisher, L.A.; Fowkes, F.G.R.; Hamburg, N.M.; Kinlay, S.; et al. 2016 AHA/ACC Guideline on the Management of Patients With Lower Extremity Peripheral Artery Disease: A Report of the American College of Cardiology/American Heart Association Task Force on Clinical Practice Guidelines. J. Am. Coll. Cardiol. 2017, 69, e71–e126. [Google Scholar] [CrossRef] [PubMed]
- US Preventive Services Task Force; Curry, S.J.; Krist, A.H.; Owens, D.K.; Barry, M.J.; Caughey, A.B.; Davidson, K.W.; Doubeni, C.A.; Epling, J.W.; Kemper, A.R.; et al. Screening for Peripheral Artery Disease and Cardiovascular Disease Risk Assessment With the Ankle-Brachial Index: US Preventive Services Task Force Recommendation Statement. JAMA 2018, 320, 177–183. [Google Scholar] [CrossRef][Green Version]
- Olin, J.W.; Halperin, J.L. Viewpoint US Preventive Services Task Force recommendation statement regarding screening for peripheral artery disease with the ankle-brachial index: Déjà vu all over again. Lancet 2018, 392, 1160–1162. [Google Scholar] [CrossRef]
- Lindholt, J.S.; Søgaard, R. Population screening and intervention for vascular disease in Danish men (VIVA): A randomised controlled trial. Lancet 2017, 390, 2256–2265. [Google Scholar] [CrossRef]
- Ramos, R.; Baena-Díez, J.M.; Quesada, M.; Solanas, P.; Subirana, I.; Sala, J.; Alzamora, M.; Forès, R.; Masiá, R.; Elosua, R.; et al. Derivation and validation of REASON: A risk score identifying candidates to screen for peripheral arterial disease using ankle brachial index. Atherosclerosis 2011, 214, 474–479. [Google Scholar] [CrossRef]
- Sigvant, B.; Lundin, F.; Wahlberg, E. The Risk of Disease Progression in Peripheral Arterial Disease is Higher than Expected: A Meta-Analysis of Mortality and Disease Progression in Peripheral Arterial Disease. Eur. J. Vasc. Endovasc. Surg. 2016, 51, 395–403. [Google Scholar] [CrossRef]
- Schramm, T.K.; Gislason, G.H.; Køber, L.; Rasmussen, S.; Rasmussen, J.N.; Abildstrøm, S.Z.; Hansen, M.L.; Folke, F.; Buch, P.; Madsen, M.; et al. Diabetes patients requiring glucose-lowering therapy and nondiabetics with a prior myocardial infarction carry the same cardiovascular risk: A population study of 3.3 million people. Circulation 2008, 117, 1945–1954. [Google Scholar] [CrossRef] [PubMed]
- Whiteley, L.; Padmanabhan, S.; Hole, D.; Isles, C. Should diabetes be considered a coronary heart disease risk equivalent?: Results from 25 years of follow-up in the Renfrew and Paisley survey. Diabetes Care 2005, 28, 1588–1593. [Google Scholar] [CrossRef] [PubMed]
- Mukamal, K.J.; Nesto, R.W.; Cohen, M.C.; Muller, J.E.; Maclure, M.; Sherwood, J.B.; Mittleman, M.A. Impact of diabetes on long-term survival after acute myocardial infarction: Comparability of risk with prior myocardial infarction. Diabetes Care 2001, 24, 1422–1427. [Google Scholar] [CrossRef] [PubMed]
- Haffner, S.M.; Lehto, S.; Rönnemaa, T.; Pyörälä, K.; Laakso, M. Mortality from coronary heart disease in subjects with type 2 diabetes and in nondiabetic subjects with and without prior myocardial infarction. N. Engl. J. Med. 1998, 339, 229–234. [Google Scholar] [CrossRef] [PubMed]
- Evans, J.M.M.; Wang, J.; Morris, A.D.; Stamler, J.; Vaccaro, O.; Neaton, J.; Wentworth, D.; Stratton, I.; Adler, A.; Neil, A.; et al. Comparison of cardiovascular risk between patients with type 2 diabetes and those who had had a myocardial infarction: Cross sectional and cohort studies. BMJ 2002, 324, 939–942. [Google Scholar] [CrossRef]
- Bulugahapitiya, U.; Siyambalapitiya, S.; Sithole, J.; Idris, I. Is diabetes a coronary risk equivalent? Systematic review and meta-analysis. Diabet. Med. 2009, 26, 142–148. [Google Scholar] [CrossRef]
- Mondesir, F.L.; Brown, T.M.; Muntner, P.; Durant, R.W.; Carson, A.P.; Safford, M.M.; Levitan, E.B. Diabetes, diabetes severity, and coronary heart disease risk equivalence: REasons for Geographic and Racial Differences in Stroke (REGARDS). Am. Heart J. 2016, 181, 43–51. [Google Scholar] [CrossRef]
- Hu, F.B.; Stampfer, M.J.; Solomon, C.G.; Liu, S.; Willett, W.; Speizer, F.; Nathan, D.; Manson, J. THe Impact of Diabetes Mellitus on Mortality From All Causes and Coronary Heart Disease in Women. JAMA Intern. Med. 2001, 161, 1717–1723. [Google Scholar] [CrossRef]
- Papanas, N.; Symeonidis, G.; Mavridis, G.; Georgiadis, G.S.; Papas, T.T.; Lazarides, M.K.; Maltezos, E. Ankle-brachial index: A surrogate marker of microvascular complications in type 2 diabetes mellitus? Int. Angiol. 2007, 26, 253–257. [Google Scholar]
- Greenland, P.; Alpert, J.S.; Beller, G.A.; Benjamin, E.J.; Budoff, M.J.; Fayad, Z.A.; Foster, E.; Hlatky, M.A.; Hodgson, J.M.; Kushner, F.G.; et al. 2010 ACCF/AHA guideline for assessment of cardiovascular risk in asymptomatic adults: Executive summary. J. Am. Coll. Cardiol. 2010, 56, 2182–2199. [Google Scholar] [CrossRef]
- Goff, D.C., Jr.; Lloyd-Jones, D.M.; Bennett, G.; Coady, S.; D’Agostino, R.B.; Gibbons, R.; Greenland, P.; Lackland, D.T.; Levy, D.; O’Donnell, C.J.; et al. 2013 ACC/AHA Guideline on the Assessment of Cardiovascular Risk: A Report of the American College of Cardiology/American Heart Association Task Force on Practice Guidelines. J. Am. Coll. Cardiol. 2014, 63, 2935–2959. [Google Scholar] [CrossRef] [PubMed]
- Piepoli, M.F.; Hoes, A.W.; Brotons, C.; Hobbs, R.F.D.; Corra, U. Main messages for primary care from the 2016 European Guidelines on cardiovascular disease prevention in clinical practice. Eur. J. Gen. Pract. 2018, 24, 51–56. [Google Scholar] [CrossRef] [PubMed]
- Rydén, L.; Grant, P.J.; Anker, S.D.; Berne, C.; Cosentino, F.; Danchin, N.; Deaton, C.; Escaned, J.; Hammes, H.-P.; Huikuri, H.; et al. ESC Guidelines on diabetes, pre-diabetes, and cardiovascular diseases developed in collaboration with the EASD: The Task Force on diabetes, pre-diabetes, and cardiovascular diseases of the European Society of Cardiology (ESC) and developed in collaboratio. Eur. Heart J. 2013, 34, 3035–3087. [Google Scholar] [PubMed]


| No Diabetes | Diabetes | |||||||
|---|---|---|---|---|---|---|---|---|
| No CVD | Prior CVD | No CVD | Prior CVD | |||||
| No LOW.ABI | LOW.ABI a | No LOW.ABI | LOW.ABI | No LOW.ABI | LOW.ABI | No LOW.ABI | LOW.ABI | |
| n (%) | 11,850 (20.4%) | 1880 (3.2%) | 2064 (3.6%) | 1027 (1.8%) | 27,434 (47.2%) | 5142 (8.8%) | 6086 (10.5%) | 2635 (4.5%) |
| Age, years | 64.6 (11.4) | 66.3 (11.9) | 69.7 (9.8) | 69.8 (10.0) | 65.8 (10.5) | 67.9 (10.4) | 69.9 (9.1) | 70.7 (9.1) |
| Male, n (%) | 5353 (45.2%) | 1068 (56.8%) | 1350 (65.4%) | 799 (77.8%) | 13,853 (50.5%) | 2819 (54.8%) | 3978 (65.4%) | 1844 (70.0%) |
| Smoker, n (%) | 2786 (23.5%) | 711 (37.8%) | 648 (31.4%) | 525 (51.1%) | 6172 (22.5%) | 1458 (28.4%) | 1762 (29.0%) | 948 (36.0%) |
| Weight, kg | 76.3 (14.4) | 77.2 (15.4) | 77.1 (13.1) | 76.0 (13.4) | 79.0 (14.8) | 78.9 (14.8) | 79.1 (13.9) | 78.1 (13.8) |
| Height, cm | 161.1 (9.3) | 161.8 (9.3) | 162.3 (8.7) | 162.7 (8.3) | 161.2 (9.5) | 161.2 (9.4) | 162.2 (9.0) | 162.2 (8.9) |
| Body mass index, kg/m2 | 29.4 (4.7) | 29.4 (5.0) | 29.3 (4.3) | 28.7 (4.2) | 30.4 (5.0) | 30.4 (5.1) | 30.1 (4.5) | 29.7 (4.5) |
| Systolic BP, mmHg | 133.1 (15.3) | 135.1 (16.2) | 132.6 (15.7) | 136.2 (18.3) | 135.8 (15.4) | 138.5 (17.2) | 135.2 (16.3) | 137.7 (17.5) |
| Diastolic BP, mmHg | 77.9 (9.4) | 77.5 (10.2) | 75.6 (9.8) | 75.1 (10.8) | 77.3 (9.4) | 76.4 (9.9) | 74.3 (9.6) | 73.5 (10.4) |
| Pulse pressure, mmHg | 55.2 (13.3) | 57.6 (14.2) | 57.0 (14.1) | 61.1 (15.8) | 58.4 (14.1) | 62.0 (15.9) | 60.9 (14.8) | 64.2 (16.0) |
| Total cholesterol, mmol/L | 5.5 (0.9) | 5.5 (1.0) | 5.0 (1.0) | 5.2 (1.1) | 5.1 (1.0) | 5.1 (1.0) | 4.6 (1.0) | 4.7 (1.0) |
| LDL cholesterol, mmol/L | 3.4 (0.8) | 3.4 (0.9) | 3.0 (0.9) | 3.2 (0.9) | 3.0 (0.8) | 3.0 (0.8) | 2.6 (0.8) | 2.7 (0.8) |
| HDL cholesterol, mmol/L | 1.5 (0.5) | 1.4 (0.5) | 1.4 (0.4) | 1.4 (0.5) | 1.4 (0.4) | 1.3 (0.4) | 1.3 (0.4) | 1.2 (0.4) |
| Triglycerides, mmol/L | 1.4 (0.9) | 1.5 (0.9) | 1.5 (0.9) | 1.6 (0.9) | 1.7 (1.1) | 1.8 (1.2) | 1.7 (1.0) | 1.8 (1.3) |
| Glucose, mmol/L | 5.4 (0.9) | 5.4 (0.9) | 5.4 (0.8) | 5.5 (0.9) | 8.3 (2.8) | 8.6 (3.0) | 8.1 (2.7) | 8.4 (2.9) |
| Comorbidities, n (%) | ||||||||
| Hypertension | 6963 (58.8%) | 1134 (60.3%) | 1476 (71.5%) | 743 (72.3%) | 18,350 (66.9%) | 3740 (72.7%) | 4874 (80.1%) | 2178 (82.7%) |
| Atrial fibrillation | 448 (3.8%) | 109 (5.8%) | 275 (13.3%) | 135 (13.1%) | 1218 (4.4%) | 342 (6.7%) | 772 (12.7%) | 366 (13.9%) |
| Malignant neoplasm | 850 (7.2%) | 163 (8.7%) | 208 (10.1%) | 115 (11.2%) | 2173 (7.9%) | 425 (8.3%) | 618 (10.2%) | 293 (11.1%) |
| Chronic kidney disease | 325 (2.7%) | 77 (4.1%) | 152 (7.4%) | 96 (9.3%) | 1069 (3.9%) | 276 (5.4%) | 600 (9.9%) | 350 (13.3%) |
| COPD | 991 (8.4%) | 288 (15.3%) | 377 (18.3%) | 268 (26.1%) | 2328 (8.5%) | 661 (12.9%) | 978 (16.1%) | 551 (20.9%) |
| Medication, n (%) | ||||||||
| Antidiabetic therapy | 0 (0.0%) | 0 (0.0%) | 0 (0.0%) | 0 (0.0%) | 21,388 (78.0%) | 4193 (81.5%) | 5014 (82.4%) | 2251 (85.4%) |
| Diuretics | 2565 (21.6%) | 483 (25.7%) | 606 (29.4%) | 303 (29.5%) | 6369 (23.2%) | 1414 (27.5%) | 2102 (34.5%) | 998 (37.9%) |
| Beta-blockers | 1234 (10.4%) | 232 (12.3%) | 651 (31.5%) | 280 (27.3%) | 3382 (12.3%) | 701 (13.6%) | 2557 (42.0%) | 977 (37.1%) |
| Calcium channel blockers | 1258 (10.6%) | 243 (12.9%) | 506 (24.5%) | 253 (24.6%) | 4516 (16.5%) | 1009 (19.6%) | 2024 (33.3%) | 912 (34.6%) |
| Agents acting on the renin angiotensin system | 4719 (39.8%) | 844 (44.9%) | 1144 (55.4%) | 562 (54.7%) | 15,536 (56.6%) | 3281 (63.8%) | 4311 (70.8%) | 1941 (73.7%) |
| Other antihypertensives | 321 (2.7%) | 62 (3.3%) | 87 (4.2%) | 46 (4.5%) | 1257 (4.6%) | 291 (5.7%) | 450 (7.4%) | 207 (7.9%) |
| Statins | 2726 (23.0%) | 503 (26.8%) | 1154 (55.9%) | 538 (52.4%) | 12,207 (44.5%) | 2445 (47.5%) | 4339 (71.3%) | 1837 (69.7%) |
| Other lipid lowering agents | 345 (2.9%) | 72 (3.8%) | 118 (5.7%) | 63 (6.1%) | 1875 (6.8%) | 341 (6.6%) | 686 (11.3%) | 299 (11.3%) |
| Aspirin | 1013 (8.5%) | 326 (17.3%) | 1137 (55.1%) | 552 (53.7%) | 7366 (26.8%) | 1754 (34.1%) | 4012 (65.9%) | 1692 (64.2%) |
| Follow-up, years, (1st quartile, 3rd quartile) | 6.2 (4.8, 7.9) | 5.7 (4.6, 7.4) | 5.8 (4.6, 7.5) | 5.6 (4.5, 7.2) | 6.1 (4.8, 7.5) | 5.8 (4.7, 7.5) | 5.6 (4.6, 7.2) | 5.3 (4.2, 7.1) |
| Lost to follow-up, n (%) b | 194 (1.6%) | 30 (1.6%) | 33 (1.6%) | 16 (1.6%) | 419 (1.5%) | 92 (1.8%) | 89 (1.5%) | 41 (1.6%) |
| Group | All-Cause Mortality | Acute Myocardial Infarction | Ischemic Stroke | |||||
|---|---|---|---|---|---|---|---|---|
| Diabetes | CVD | Low ABI a | Events b | Incidence Rate c (95% CI) | Events | Incidence Rate (95% CI) | Events | Incidence Rate (95% CI) |
| Yes | Yes | Yes | 873 | 60.8 (56.9, 65.0) | 290 | 21.4 (19.0, 24.0) | 431 | 32.7 (29.8, 36.0) |
| Yes | Yes | No | 1401 | 40.2 (38.1, 42.4) | 495 | 14.8 (13.6, 16.2) | 834 | 25.6 (23.9, 27.4) |
| Yes | No | Yes | 965 | 31.3 (29.4, 33.4) | 208 | 6.9 (6.0, 7.9) | 410 | 13.8 (12.5, 15.2) |
| No | Yes | Yes | 258 | 44.2 (39.1, 49.9) | 75 | 13.3 (10.6, 16.7) | 127 | 23.2 (19.5, 27.7) |
| No | Yes | No | 400 | 32.7 (29.7, 36.1) | 105 | 8.8 (7.3, 10.7) | 190 | 16.3 (14.1, 18.8) |
| No | No | Yes | 281 | 25.4 (22.6, 28.5) | 62 | 5.7 (4.4, 7.3) | 104 | 9.7 (8.0, 11.7) |
| Yes | No | No | 3146 | 18.7 (18.0, 19.3) | 728 | 4.4 (4.1, 4.7) | 1402 | 8.5 (8.1, 9.0) |
| No | No | No | 1058 | 14.1 (13.3, 15.0) | 191 | 2.6 (2.2, 3.0) | 424 | 5.7 (5.2, 6.3) |
© 2019 by the authors. Licensee MDPI, Basel, Switzerland. This article is an open access article distributed under the terms and conditions of the Creative Commons Attribution (CC BY) license (http://creativecommons.org/licenses/by/4.0/).
Share and Cite
Alves-Cabratosa, L.; Garcia-Gil, M.; Comas-Cufí, M.; Blanch, J.; Ponjoan, A.; Martí-Lluch, R.; Elosua-Bayes, M.; Parramon, D.; Camós, L.; Ramos, R. Role of Low Ankle–Brachial Index in Cardiovascular and Mortality Risk Compared with Major Risk Conditions. J. Clin. Med. 2019, 8, 870. https://doi.org/10.3390/jcm8060870
Alves-Cabratosa L, Garcia-Gil M, Comas-Cufí M, Blanch J, Ponjoan A, Martí-Lluch R, Elosua-Bayes M, Parramon D, Camós L, Ramos R. Role of Low Ankle–Brachial Index in Cardiovascular and Mortality Risk Compared with Major Risk Conditions. Journal of Clinical Medicine. 2019; 8(6):870. https://doi.org/10.3390/jcm8060870
Chicago/Turabian StyleAlves-Cabratosa, Lia, Maria Garcia-Gil, Marc Comas-Cufí, Jordi Blanch, Anna Ponjoan, Ruth Martí-Lluch, Marc Elosua-Bayes, Dídac Parramon, Lourdes Camós, and Rafel Ramos. 2019. "Role of Low Ankle–Brachial Index in Cardiovascular and Mortality Risk Compared with Major Risk Conditions" Journal of Clinical Medicine 8, no. 6: 870. https://doi.org/10.3390/jcm8060870
APA StyleAlves-Cabratosa, L., Garcia-Gil, M., Comas-Cufí, M., Blanch, J., Ponjoan, A., Martí-Lluch, R., Elosua-Bayes, M., Parramon, D., Camós, L., & Ramos, R. (2019). Role of Low Ankle–Brachial Index in Cardiovascular and Mortality Risk Compared with Major Risk Conditions. Journal of Clinical Medicine, 8(6), 870. https://doi.org/10.3390/jcm8060870